AESO Cost of New Entry Analysis: Combustion Turbines and Combined-Cycle Plants with November 1, 2021 Online Date PREPARED FOR
←
→
Page content transcription
If your browser does not render page correctly, please read the page content below
AESO Cost of New Entry Analysis:
Combustion Turbines and Combined-Cycle Plants
with November 1, 2021 Online Date

PREPARED FOR

PREPARED BY

Johannes P. Pfeifenberger Martha Caulkins
Kathleen Spees Emily Shorin
J. Michael Hagerty
Mike Tolleth
The Brattl e Group

Sang H. Gang
Patrick S. Daou
John Wroble
Sargen t & Lundy

September 4, 2018
This report was prepared for the Alberta Electric System Operator. All results and any errors are
the responsibility of the authors and do not represent the opinion of The Brattle Group, Inc.,
Sargent & Lundy, or their clients.
Table of Contents
Executive Summary ....................................................................................................................... iii
I. Introduction .............................................................................................................................. 1
 A. Background .......................................................................................................................... 1
 B. Scope and Objective ............................................................................................................. 2
 C. Analytical Approach ............................................................................................................ 3
II. Technology Screening Analysis ................................................................................................ 5
III. Technical Specifications of Reference Technologies ................................................................ 7
 A. Locational Screen ................................................................................................................. 7
 B. Reference Technology Specifications ................................................................................. 9
 1. Turbine Model and Configuration ........................................................................... 11
 2. Environmental Requirements and Implications...................................................... 14
 3. Fuel Supply Specifications ........................................................................................ 15
 4. Additional Specifications .......................................................................................... 15
IV. Plant Capital Cost Estimates ................................................................................................... 17
 A. Plant Proper Capital Costs ................................................................................................. 18
 1. Plant Developer and Contractor Arrangements ...................................................... 18
 2. Equipment.................................................................................................................. 19
 3. Labor and Materials ................................................................................................... 20
 4. EPC Contractor Fee and Contingency ..................................................................... 21
 B. Owner’s Capital Costs ........................................................................................................ 22
 1. Project Development, Mobilization and Startup ..................................................... 22
 2. Net Startup Fuel Costs ............................................................................................... 22
 3. Gas and Electric Interconnection ............................................................................. 22
 4. Land ............................................................................................................................ 24
 5. Non-Fuel Inventories ................................................................................................ 24
 6. Owner’s Contingency................................................................................................ 24
 7. Financing Fees ........................................................................................................... 24
 C. Escalation to 2021 Installed Costs ..................................................................................... 25
V. Operation and Maintenance Costs .......................................................................................... 27
 A. Annual Fixed Operations and Maintenance Costs ........................................................... 27
 1. Plant Operation and Maintenance ........................................................................... 27
 2. Insurance and Asset Management Costs .................................................................. 28
 3. Property Tax .............................................................................................................. 28
 4. Firm Gas Transportation Service Contracts ............................................................. 28
 B. Variable Operation and Maintenance Costs ..................................................................... 29
 C. Escalation to 2021 Costs .................................................................................................... 29
VI. Financial Assumptions ............................................................................................................ 30

 i|brattle.com
A. Discount Rate and Cost of Capital .................................................................................... 30
 1. Approach and Methodology ..................................................................................... 30
 2. Recommended Cost of Capital.................................................................................. 33
 3. Detailed Calculations ................................................................................................ 36
 B. Other Financial Assumptions ............................................................................................ 45
VII. Annualized CONE Estimates .................................................................................................. 47
VIII. CONE Updates ...................................................................................................................... 51
List of Acronyms ............................................................................................................................ 53
Appendix: Detailed Analysis of Specifications and Costs............................................................... 56
 A. Aeroderivative Turbine Power Augmentation Options .................................................. 56
 B. Construction Labor Costs .................................................................................................. 57
 C. Net Startup Fuel Costs ....................................................................................................... 60
 D. Gas and Electric Interconnection Costs ............................................................................ 61
 E. Land Costs .......................................................................................................................... 62
 F. Property Taxes ................................................................................................................... 63
 G. Firm Gas Contracts ............................................................................................................ 65
 H. Summary of Additional Plant Cost Assumptions ............................................................. 67
13

 ii|brattle.com
Executive Summary
The Alberta Electric System Operator (AESO) is proposing to implement a centralized three-
year-forward capacity market with a first commitment period of November 2021 to October
2022. To that end, AESO retained The Brattle Group (Brattle) and Sargent & Lundy (S&L) to
develop several key elements of the capacity market design. This report presents our estimates of
the Cost of New Entry (CONE) in Alberta for new merchant generation resources.

The estimated CONE value represents the total annual net revenue (net of variable operating
costs) that a new generation resource would need to earn in the Alberta wholesale electricity
market to recover its capital investment and fixed costs, given reasonable expectations about
future cost recovery over its economic life. CONE is the starting point for estimating the
Net Cost of New Entry (Net CONE). Net CONE represents the annual revenues that a new
resource would need to earn specifically in the capacity market, after netting out energy and
ancillary service (E&AS) margins from CONE.

CONE and Net CONE are used to “anchor” the AESO’s administratively-set demand curve for
capacity. Note, however, that the value AESO selects for Net CONE will not determine (nor
predict) the capacity market clearing price. Rather, the market clearing price will depend on the
offers that suppliers make into the capacity market auction as cleared against the demand curve.

To estimate the CONE value for the Alberta capacity market demand curve, AESO requested that
Brattle and S&L: (1) identify candidate reference technologies for setting the CONE and Net
CONE values; (2) develop bottom-up plant capital cost and operations and maintenance (O&M)
cost estimates for each technology; (3) determine an appropriate discount rate and other financial
assumptions to convert the estimated costs into the total annualized net revenues necessary to
enter the market; and (4) calculate annualized CONE values for each reference technology. The
AESO will then select the reference technology and estimate its E&AS margins in order to
calculate Net CONE for the selected reference technology.

We reviewed a wide range of technologies that participate in the Alberta wholesale market and
selected three reference technologies for setting Net CONE in the capacity market: (1) an
aeroderivative combustion turbine (Aero CT) plant; (2) a frame-type combustion turbine (Frame
CT) plant; and (3) a combined-cycle (CC) gas turbine plant. Each of these technologies is likely
to be a part of the long-term equilibrium mix in Alberta as they have recently been added to the
Alberta system and are currently being considered for future development. In addition, there are
currently no inherent constraints to future development of these resources, and reliable cost
information is available to support an accurate bottom-up cost estimate. While the Alberta
market has a significant amount of cogeneration facilities and proposed coal-to-gas conversions,
we excluded these technologies due to their non-standard costs and the inherent limits to future
development of these resources, which can only be built either at retiring coal plants or by
constructing new plants at industrial facilities. While reciprocating internal combustion engine
(RICE) plants have recently entered the market, the total capacity in the market remains small

 iii|brattle.com
compared to other gas-fired technologies. Finally, we screened out renewables (e.g., solar and
wind) due to their limited capacity value, demand response due to their non-standard costs, and
energy storage due to the limited capacity deployed to date.

We developed complete plant designs for each of the three reference technologies that reflect the
locations, technology choices, and plant configurations that developers are likely to choose as
indicated by both operating and proposed projects. For the Aero CT design, we specify two GE
LM6000-PF SPRINT turbines; for the Frame CT design, a single Siemens SGT6-5000F turbine.
The reference CC design includes a single Siemens SGT6-8000H turbine in combination with a
heat recovery steam generator and steam turbine (“1×1 configuration”). The chosen CC design is
wet-cooled and includes a selective catalytic reduction (SCR) unit for pollution control. We
assume all plants are “gas-only” and obtain firm gas transportation contracts to ensure sufficient
fuel supply. We assume the plants are built in the greater Edmonton area due to the availability
of gas and electric infrastructure, the availability of industrial land, access to water rights, and the
recent development of gas-fired power plants in that region.

For each reference technology, we conduct a comprehensive, bottom-up analysis of the capital
costs to build the plant assuming an November 1, 2021 online date: the engineering,
procurement, and construction (EPC) costs, including equipment, materials, labor, and EPC
contracting; and non-EPC owner’s costs, including project development, financing fees,
exchange-rate hedging costs, gas and electric interconnection costs, and inventories. We
separately estimate annual fixed and variable O&M costs, including labor, materials, property
taxes, and insurance. All of the cost estimates take into account Alberta-specific prices, ambient
conditions, and construction requirements, including local labor rates and productivity factors,
land costs and property taxes, freight costs, and gas and electric interconnection standards.

Finally, we translate the estimated capital costs into the annualized average net revenues the
resource owner would have to earn over an assumed 20-year economic life to achieve its
required return on and return of capital. We use a rate of 8.5% overall after-tax cost of capital
for discounting the free cash flows of a merchant generation investment, which we estimated
based on the very high end of the range associated with various cost of capital reference points
for Canadian generation companies and U.S. independent power producers. All reference points
include adjustments to reflect expected 2021 Canadian financial market conditions and the
expected market cost of long-term (20-year) debt financing (rather than lower yields of shorter-
term and in some cases higher-credit-quality bonds of the sample companies). The
recommended cost of capital estimate thus accounts for forecasted 2021 Canadian market
conditions, the cost of long-term debt financing, and the relative risk between the sample
companies and a merchant generation plant operating in the proposed three-year forward
Alberta capacity market. Assuming a 50% debt and 50% equity capital structure and a cost of
debt of 6.0%, the recommended 8.5% overall after-tax cost of capital implies a 12.6% return on
equity (or realized internal rate of return on the equity portion of the investment) and a
weighted average cost of capital of 9.3% (without accounting for the tax advantage of debt). At
65% debt financing and a 6.5% cost of debt, the implied return on equity is 15.5%, yielding a
weighted average cost of capital of 9.7%. The cost of debt in these recommendations

 iv|brattle.com
significantly exceeds the actual (shorter-term) cost of debt reflected in the outstanding bonds on
the sample companies’ current balance sheets. This reflects the higher risks of merchant
generation investments in Alberta’s proposed capacity market, and incorporates the possibility
that some of the new plants may be developed under a project financing framework rather than
solely using balance-sheet-financing arrangements.

Table ES-1 below shows the CONE estimates for the three reference technologies. We calculate
the first year annualized costs for the plants assuming a long-term cost recovery path in which
total net revenues remain constant in nominal terms (often referred to as the “level-nominal”
approach). The CONE estimate is highest for the Aero CT at a value of $244.2/kW-year,
expressed in terms of installed capacity (ICAP). Though the Frame CT has only marginally
higher overnight capital costs than the Aero CT, its CONE value is much lower at $114.1/kW-
year, reflecting its much larger capacity. The CC is the largest unit and has the highest overnight
capital costs, yielding a CONE value of $236.1/kW-year, which is slightly lower than the CONE
value derived for the Aero CT. These estimates reflect our final cost assumptions as developed
and refined with several rounds of input received from AESO stakeholders. 1

 Table ES-1: Estimated CONE for 2021/2022 Delivery Year (2021 CAD)
 Overnight Overnight Overall (After- Annual
 Winter Capital Capital Tax) Cost of Carrying Plant Capital Fixed O&M Gross
Reference Technology Capacity Costs Costs Capital Charge Costs Costs CONE
 MW $million $/kW % % $/kW-yr ICAP $/kW-yr ICAP $/kW-yr ICAP

Aeroderivative CT 93 $138 $1,479 8.5% 12.6% $186.9 $57.3 $244.2
Frame CT 243 $163 $671 8.5% 12.7% $85.0 $29.2 $114.1
Combined Cycle 479 $657 $1,371 8.5% 13.3% $182.2 $53.9 $236.1

 Sources and notes:
 CONE values are expressed in 2021 dollars and Installed Capacity (ICAP) terms. Overnight capital
 costs are in nominal dollars. The annual carrying charge accounts for the cost recovery path,
 financing, depreciation, and taxes and is derived by dividing plant capital costs ($/kW-yr) by
 overnight capital costs ($/kW)..

Looking beyond the initial 2021/2022 delivery year, we recommend that AESO update the
CONE estimates prior to each subsequent capacity auction using a composite cost index
composed of indices that reflect changes over time to the underlying turbine, materials, and
labor costs. We recommend the AESO use indices reported by Statistics Canada for escalating
labor and materials costs. Specifically, we recommend that labor costs track the Construction
Union Wage Rate Index for electricians in Edmonton and materials track the Canadian gross
domestic product (GDP) price deflator. As our plant capital cost estimates assume the
combustion turbines are sourced from the United States, we recommend that turbine costs track

1 We presented to stakeholders a summary of our approach, initial results, responses to their feedback,
 and updated results reflecting their feedback during four Demand Curve Working Group (DCWG)
 meetings from April to August 2018. The materials presented at the meetings are available at
 https://www.aeso.ca/market/capacity-market-transition/comprehensive-market-design/demand-
 curve-working-group/.

 v|brattle.com
the Producer Price Index for turbines and turbine generator sets reported by the U.S.
Department of Labor Bureau of Labor Statistics, with an adjustment for changes in the
U.S./Canadian exchange rate. Consistent with the capital cost estimates and the relative
contribution to total costs of each component category, we recommend that AESO weight the
component indices in the Aero CT composite index based on 25% labor, 40% turbine, and 35%
materials and other equipment. We recommend that AESO weight the component indices for
the Frame CT based on 25% labor, 30% turbine, and 45% materials and other equipment. For
the CC, we recommend that AESO weight the components based on 35% labor, 15% turbine,
and 50% materials and other equipment.

 vi|brattle.com
I. Introduction

 A. BACKGROUND

AESO developed a Comprehensive Market Design (CMD) for the Alberta wholesale electricity
market that includes the introduction of a centralized three-year-forward capacity market to be
implemented for a first commitment period starting at the end of 2021. 2 The proposed capacity
market design utilizes an administratively-determined sloped demand curve to procure sufficient
capacity to achieve the resource adequacy standard set by the Government of Alberta and to
limit the volatility of prices in the capacity market. A key input to setting the demand curve is
the Cost of New Entry (CONE), which represents the long-run marginal cost of supply for
achieving AESO resource adequacy objectives.

CONE is calculated as the total annual net revenue (net of variable operating costs) that an
economically-efficient new generation resource would need to earn in the Alberta wholesale
market to recover its capital investment and fixed costs, given reasonable expectations about
future cost recovery over its economic life. CONE is the starting point for estimating the Net
Cost of New Entry (Net CONE). Net CONE represents the annual revenues that a new resource
would need to earn in the capacity market, after netting out energy and ancillary service (E&AS)
margins from CONE. CONE and Net CONE are used to “anchor” the AESO’s administratively-
set demand curve, such that prices will rise to near the administratively-determined Net CONE
when the market is in equilibrium.

The value AESO selects for Net CONE will neither determine nor predict the capacity market
clearing price in any given auction. Rather, the market clearing price will depend both on the
offers that suppliers make into the capacity market auction as well as on the shape of the demand
curve. Net CONE will, however, play an important role in ensuring that the Alberta capacity
market procures sufficient capacity on average: if Net CONE is set too high, the capacity market
will over procure capacity; if set too low, the market will under procure and possibly not achieve
its reliability objectives. Therefore, to cost effectively meet the reliability objectives of the
capacity market, the demand curve’s Net CONE parameter should accurately estimate the price
at which developers of new generation resources would actually be willing to enter the capacity
market.

As currently proposed in the CMD Final package, the AESO will update the estimated CONE
values during demand curve review cycles every four to five years based on bottom-up cost

2 The AESO is implementing an initial transition period from November 2019 through October 2021.
 The first three base auctions during the transition have forward commitment periods shorter than
 three years of 16–28 months. Starting with the base auction in October 2021, all base auctions will be
 conducted a full three years prior to the start of the obligation period. See AESO (2018). CMD Final
 Proposal, Section 5: Base Auction, p. 1, available at https://www.aeso.ca/assets/Uploads/CMD-4.0-
 Section-5-Base-Auctions-FINAL.pdf.

 1|brattle.com
estimates and financing assumptions developed by an independent consultant. 3 In the periods
between review cycles, the AESO will update the CONE values prior to each base capacity
auction based on applicable cost indices.

 B. SCOPE AND OBJECTIVE
To estimate the CONE value for the Alberta capacity market demand curve, AESO requested that
Brattle and S&L complete the following tasks:
 • Review potential candidate technologies for the reference technology based on
 Alberta-specific market conditions and resources that recently entered the market
 and recommend three technologies for developing CONE estimates.
 • Develop detailed technical specifications for the three chosen reference
 technologies, including machine type and model, configuration, fuel supply, and
 environmental controls, and identify a location in Alberta that is representative of
 future development.
 • Develop a bottom-up plant capital cost and operations and maintenance (O&M)
 cost estimates for each technology based on the detailed specifications and
 location assuming a November 1, 2021 online date. 4
 • Determine an appropriate discount rate, economic life, and levelization approach
 to convert the estimated costs into the total annualized net revenues necessary to
 enter the market (CONE).
 • Propose methods for updating the CONE value in the periods between demand
 curve review cycles.

3 AESO (2018). CMD Final Proposal, Section 4: Calculation of Demand Curve Parameters, available at
 https://www.aeso.ca/assets/Uploads/CMD-4.0-Section-4-Calc-of-Demand-Curve-FINAL.pdf.
4 The assumptions and costs underlying our CONE estimates reflect a three-year forward commitment
 period in accordance with CMD Final. During the auction phase-in period, the time between the
 capacity auction and the start of the commitment period will be less than three years. While some
 types of capacity resources (such as demand response, upgrades to existing units, or imports) will have
 lead times of less than three years, we recognize that new generation resources, which under normal
 circumstances require a 20–36 month construction period, may need to start construction prior to the
 auction or be built under an accelerated schedule (assuming such new resources actually cleared the
 market). In this study, we develop CONE values that reflect a normal plant development schedule.
 We do so because it is our understanding that while the market transitions to the full three-year
 forward period AESO aims to provide stability to the demand curve and the capacity auctions by
 maintaining a consistent approach to calculating the capacity market parameters, including the CONE
 value. If new resources were to bid in at somewhat higher price to reflect added cost of an accelerated
 schedule, the initial auctions may clear at these higher prices should those resources be needed.

 2|brattle.com
The AESO will estimate the expected E&AS margins and use the CONE values to calculate Net
CONE. Finally, AESO will determine the particular reference technology and its associated Net
CONE value to be used in anchoring the capacity auction’s sloped demand curve.

Our objective in estimating CONE is to reflect the technology, location, and costs that a
competitive developer of new generation facilities will likely be able to realize in the Alberta
electricity market, including the proposed capacity market. While every developer of merchant
generation resources in a competitive market will seek out low-cost opportunities for new
facilities, we aim to capture the types of resources, specifications, and costs that are likely to be
widely available to ensure that the CONE value is just high enough to cost effectively attract new
entry when necessary.

In this report, we provide relevant research and empirical analysis to inform our
recommendations, but recognize where judgments have to be made in specifying the reference
resource characteristics and translating its estimated costs into levelized revenue requirements.
In such cases, we discuss the tradeoffs and provide our own recommendations.

During our analysis, we presented our initial analysis and draft results to stakeholders at four
Technical Working Group meetings. 5 Stakeholders provided comments and questions at the
meetings and further information after the meetings, all of which we reviewed. Their input is
included in the proposed CONE or is addressed in the report.

 C. ANALYTICAL APPROACH

Our starting point for estimating CONE is a characterization of the CC and CT plants in Alberta
to reflect the technologies, plant configurations, detailed specifications, and locations where
developers are most likely to build. We review the most recent gas-fired generation projects in
Alberta and across Canada to determine the set of reference technologies and the key
configuration variables defined for each. Important elements include the number of gas and
steam turbines, duct firing and power augmentation, cooling systems, emissions controls, and the
plant’s approach to securing fuel supply.

We identified specific plant characteristics based on: (1) our analysis of the predominant
practices of recently-developed plants; (2) our analysis of technologies, regulations, and
infrastructure; and (3) our experience from previous CONE analyses. We selected key site

5 We presented our approach and preliminary results to stakeholders at four Demand Curve Working
 Group (DCWG) meetings held from April to August 2018. We presented our approach, screening
 analysis, draft specifications, and draft cost of capital analysis at DCWG Session 2 on April 6, 2018, a
 response to stakeholders on the cost of capital at the DCWG Session 3 on May 4, 2018, draft CONE
 results at the DCWG Session 4 on June 14, 2018, and updated CONE results in response to stakeholder
 feedback at the DCWG Session 5 on August 16, 2018. The materials presented at the meetings are
 available at https://www.aeso.ca/market/capacity-market-transition/comprehensive-market-
 design/demand-curve-working-group/.

 3|brattle.com
characteristics, which include proximity to high voltage transmission infrastructure and major
gas pipelines, siting attractiveness as indicated by units recently built or currently under
construction, and availability of vacant industrial land. Our analysis for selecting plant
characteristics and locations is presented in Section III of this report.

We developed comprehensive, bottom-up estimates of the costs of building and maintaining each
reference technology. Sargent & Lundy (S&L) estimated plant proper capital costs—equipment,
materials, labor, and the engineering, procurement, and construction (EPC) contracting costs—
based on a complete plant design and S&L’s proprietary database on actual projects. S&L and
Brattle then estimated the owner’s capital costs, including owner-furnished equipment, gas and
electric interconnection, development and startup costs, land, inventories, and financing fees
using S&L’s proprietary data and additional analysis of each component. The results of this
analysis, including adjustments to initial estimates made based on stakeholder feedback, are
presented in Section IV.

We further estimated annual fixed and variable O&M costs, including labor, materials, property
tax, firm gas transportation service, insurance, asset management costs, and working capital. The
results of this analysis are presented in Section V.

Next, we translated the total up-front capital costs and other fixed-cost recovery of the plant into
an annualized estimate of fixed plant costs, which is the Cost of New Entry, or CONE. CONE
depends on the estimated capital investment and fixed going-forward costs of the plant as well as
the estimated financing costs (cost of capital, consistent with the project’s risk) and the assumed
economic life of the asset. The annual CONE value for the first delivery year depends on our
assumption concerning the expected cost recovery path for the plant, which reflects whether a
plant built today can be expected to earn as much in later years as in earlier years. We present in
Section VI our financial assumptions for converting the costs of building and operating the plant
into an annualized CONE estimate and then present the CONE estimates in Section VII of this
report.

The Brattle and S&L authors collaborated on completing this study and report, considering
stakeholder input throughout the effort. The specification of plant characteristics was jointly
developed, with S&L taking primary responsibility for developing the plant proper capital costs
and plant O&M and major maintenance costs, and with the Brattle authors taking responsibility
for various owner’s costs and fixed O&M costs, and for translating the cost estimates into the
CONE values.

 4|brattle.com
II. Technology Screening Analysis

The Alberta wholesale electricity market includes a diverse set of internal resources that can
generate during tight supply periods to maintain system reliability. However, the capacity
market demand curve needs to reflect the costs for those technologies that are likely to enter the
market going forward to ensure that Alberta can meet its reliability requirements over the long-
term. In addition, there must be sufficient cost information for each of the technologies to
accurately estimate Net CONE.

We screened out several technologies as candidate reference technologies, including coal-to-gas
conversions, cogeneration resources, demand-side resources, renewables, and energy storage for
the reasons described below. By excluding these resources, we are not making any definitive
statements on their viability or expectations for future market entry, but find that they are not
appropriate reference technologies at this time for setting the demand curve CONE and Net
CONE parameters.
 • Cogeneration and Coal-to-Gas Conversions: While there is significant capacity in
 Alberta for both of these types of resources, the costs of building and operating
 cogeneration and coal-to-gas resources are unique to each project and would
 increase the risk of developing an inaccurate CONE value. In addition, there are
 inherent constraints in developing future capacity since cogeneration units are co-
 located with large, industrial loads, and coal-to-gas conversions are limited to the
 number and size of existing coal plants.
 • Renewable technologies (including wind and solar resources) are screened out
 because they are not dispatchable resources that system operators can call upon to
 meet system demand when capacity is scarce. In addition, renewable resources
 are not built in Alberta to maintain resource adequacy but instead are installed
 primarily to meet policy objectives concerning greenhouse gas (GHG) emissions.
 • Although energy storage resources, such as lithium-ion battery storage, are not a
 generation resource, they can provide reliable supply for limited durations during
 supply shortage events and may play an important role in meeting resource
 adequacy targets in a future with increasing renewables. Energy storage resources
 at this time though have not been deployed or proposed at sufficient scale in
 Alberta. If, in the future, energy storage resources are being proposed and
 constructed in Alberta on a merchant basis, they should be considered as a
 potential reference technology.
 • Demand-side resources, such as demand response and energy efficiency, were
 screened out due to the difficulties of identifying and specifying a standard
 demand-side resource that could be used for a bottom-up cost estimate. Demand
 resources are not standardized because their characteristics depend on the type of
 load they are intended to curtail during peak load periods. Demand-side
 resources also face inherent constraints on providing the marginal capacity
 necessary to meet resource adequacy requirements over the long term.

 5|brattle.com
The remaining resources that we considered in our screening analysis are the four gas-fired
technologies shown in Table 1 below: Aero CT, Frame CT, CC, and reciprocating internal
combustion engines (RICE). For each resource, we reviewed their typical capacity, recent
installations, capital cost range, efficiency, and speed of deployment.

 Table 1: Candidate Reference Technologies Screening Considerations

 Sources and notes:
 Data downloaded from ABB Inc.’s Energy Velocity Suite and S&P Global in February 2018, cross
 referenced with AESO LTA reports. Plant costs shown in this table are high-level estimates
 intended for screening purposes only.

Following a review of these factors, we chose to include the Aero CT, Frame CT, and CC but not
the RICE resource as a candidate reference technology. We screened out the RICE primarily due
to the small scale of planned development of this resource despite its similarity in efficiency and
cost to the much more prevalent Aero CT. 6 Installation of RICE units have increased over the
past few years in other Canadian and U.S. markets, but primarily in markets with higher levels of
renewable capacity, such as the Southwest Power Pool, ERCOT, and MISO. While few frame CT
technologies have been installed in Alberta to date, we include this generation type due to its
low cost and significant planned development.

6 We discussed developing CONE values for a RICE resource as a fourth reference technology with
 AESO and its stakeholders via the DCWG. Following the April 2018 DCWG meeting, the AESO
 gauged stakeholders on their interest for including RICE resources as a candidate reference technology
 and ultimately determined to not do so in this CONE study.

 6|brattle.com
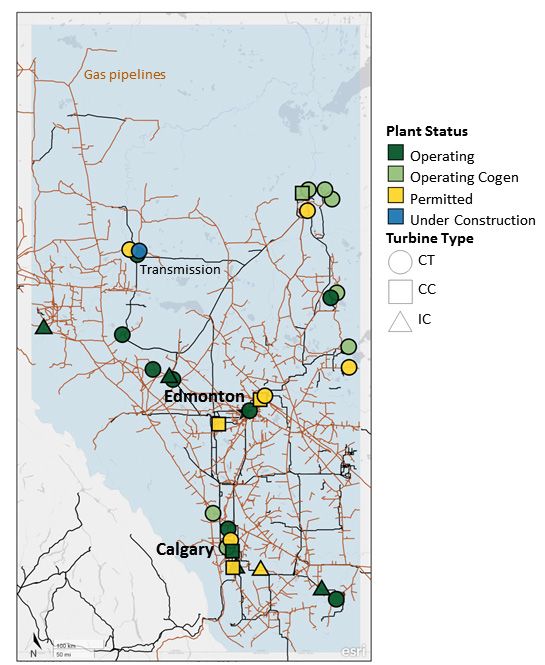
III. Technical Specifications of Reference Technologies
We determined the technical specifications of each candidate reference technology primarily
using a “revealed preferences” approach in which we consider the choices that developers have
recently found to be most feasible and economic, as observed in recently constructed and
planned units in Alberta. However, because technologies and environmental regulations
continue to evolve, we supplemented the observations based on our expertise and additional
analysis of underlying economics, regulations, and infrastructure.

 A. LOCATIONAL SCREEN

We conducted a locational screening analysis to select a favorable and feasible location for a new
merchant power plant in Alberta. Specifying a single location is necessary for developing
accurate performance characteristics of the reference technologies and estimating cost
components, such as labor costs, land costs, property taxes, and gas and electrical interconnection
costs.

We chose the greater Edmonton region as the location for the reference technologies. Our
approach for identifying this location included six factors of consideration.

First, we identified candidate locations based on the revealed preference of gas-fired plants built
since 2008 or under development as of the time of this study. 7 Using this criterion, we narrowed
the choice to either the Edmonton or Calgary areas. Figure 1 below shows the areas around
Edmonton and Calgary that have several operating and permitted gas-fired facilities as well as
substantial electrical transmission and gas pipeline infrastructure. We did not consider the
regions in the eastern and northeastern portion of the province despite the significant recent
development in these areas since the resources added there are primarily cogeneration facilities
at oil sands production sites.

7 We included under development plants that have been at least permitted in our locational review.

 7|brattle.com
Figure 1: Permitted and Operating Gas-Fired Units Built since 2008

 Sources and notes:
 S&P Global Market Intelligence, as generated July 19, 2018.

To distinguish between Calgary and Edmonton, we considered five more factors including the
ease of gas and electric interconnection, labor costs, water permit availability, transmission loss
factors, and ambient conditions. Among these criteria, we found that the ambient conditions
and the water availability were the biggest differentiating factors. Edmonton is located at a
lower elevation than Calgary, which can have a significant impact on net plant capacity for gas-
fired resources. 8 We received feedback from AESO and stakeholders that water permits are
likely unavailable in Calgary, making it infeasible to use water for cooling a power plant there.
The other factors were not materially different between Edmonton and Calgary.

We calculate the plant operating characteristics (e.g., net capacity and heat rate) of the reference
technologies using turbine vendors’ performance estimation software for the combustion
turbines output and GateCycle software for the remainder of the CC plant. For the reference
Edmonton location, we estimate the performance characteristics at a representative elevation and

8 Elevation in Calgary is roughly 400 meters higher than in Edmonton. A 400 meter increase in
 elevation would reduce net summer output by approximately 4%.

 8|brattle.com
at a temperature and humidity that reflects peak conditions. S&L sourced and averaged
temperature data from multiple weather stations in the reference Edmonton location, as made
publicly available by ASHRAE (the American Society of Heating, Refrigerating, and Air-
Conditioning Engineers). 9 Table 2 summarizes the ambient conditions assumed for the
Edmonton reference location.

 Table 2: Assumed Edmonton Ambient Conditions

 Criteria Unit Value
 Elevation m 760
 Winter
 Temperature °C -27.0
 Relative Humidity %RH 80.0
 Summer
 Temperature °C 25.8
 Relative Humidity %RH 41.4
 Average Annual
 Temperature °C 3.8
 Relative Humidity %RH 60.0

 Sources and notes:
 Humidity and temperature data from The American Society of Heating, Refrigerating, and Air-
 Conditioning Engineers (ASHRAE). Weather stations used are Tomahawk AGDM, AB, Canada;
 Highvale, AB, Canada; and Edmonton Stony Plain CS, AB, Canada. Elevation data from Alberta
 Environment and Parks (AEP).

 B. REFERENCE TECHNOLOGY SPECIFICATIONS

Based on the assumptions discussed below, the technical specifications for the Aero CT, Frame
CT, and CC reference technologies are shown below in Table 3, Table 4, and Table 5. Net plant
capacity and heat rate are calculated at the ambient air conditions listed above in Table 2. 10

9 The 1% cooling dry bulb temperature reported by ASHRAE is used for the summer condition for the
 reference technologies, and the 99% heating dry bulb temperature reported by ASHRAE is used for
 the winter design condition.
10 The net plant heat rates presented in Table 3, Table 4, and Table 5 account for balance of plant loads,
 other plant auxiliary loads, and losses of the generator step-up (GSU) transformer. Grid connection
 losses are not included, as performance test measurement points are typically at the high side terminal
 of the GSU transformer. Also, the grid connection losses are expected to be insignificant compared to
 the GSU transformer losses.

 9|brattle.com
Table 3: Aero CT Reference Resource Technical Specifications

 Plant Characteristic Aeroderivative CT
 Turbine Model GE LM6000-PF SPRINT
 Configuration 2x0
 Power Augmentation None
 Net Plant Capacity
 Max Winter (MW) 93
 Max Summer (MW) 78
 Annual Average (MW) 87
 Net Plant Heat Rate
 Max Winter (kJ/kWh, HHV) 9,526
 Max Summer (kJ/kWh, HHV) 9,954
 Annual Average (kJ/kWh, HHV) 9,677
 Emissions Rate
 (Tonnes CO2/MWh) 0.50
 Environmental Controls Dry low NOx burners
 Dual Fuel Capability No
 Firm Gas Contract Yes
 Black Start Capability None
 On-Site Gas Compression None
 Assumed Forced Outage Rate 2.5%

Sources and notes:
See Table 2 for ambient conditions assumed for calculating net summer and winter installed
capacities (ICAP) and net summer and winter heat rates.

 Table 4: Frame CT Reference Resource Technical Specifications

 Plant Characteristic Frame CT
 Turbine Model Siemens SGT6-5000F
 Configuration 1x0
 Power Augmentation None
 Net Plant Capacity
 Max Winter (MW) 243
 Max Summer (MW) 226
 Annual Average (MW) 240
 Net Plant Heat Rate
 Max Winter (kJ/kWh, HHV) 10,109
 Max Summer (kJ/kWh, HHV) 10,317
 Annual Average (kJ/kWh, HHV) 10,061
 Emissions Rate
 (Tonnes CO2/MWh) 0.52
 Environmental Controls Dry low NOx burners
 Dual Fuel Capability No
 Firm Gas Contract Yes
 Black Start Capability None
 On-Site Gas Compression None
 Assumed Forced Outage Rate 2.5%

Sources and notes:
See Table 2 for ambient conditions assumed for calculating net summer and winter installed
capacities (ICAP) and net summer and winter heat rates.

 10|brattle.com
Table 5: Combined Cycle Reference Resource Technical Specifications

 Plant Characteristic Combined Cycle
 Turbine Model Siemens SGT6-8000H
 Configuration 1x1
 Cooling System Wet Cooling
 Power Augmentation None
 Net Plant Capacity, without Duct Firing
 Max Winter (MW) 429
 Max Summer (MW) 389
 Annual Average (MW) 421
 Net Plant Capacity, with Duct Firing
 Max Winter (MW) 479
 Max Summer (MW) 438
 Annual Average (MW) 471
 Net Plant Heat Rate, without Duct Firing
 Max Winter (kJ/kWh, HHV) 6,981
 Max Summer (kJ/kWh, HHV) 6,811
 Annual Average (kJ/kWh, HHV) 6,814
 Net Plant Heat Rate, with Duct Firing
 Max Winter (kJ/kWh, HHV) 7,163
 Max Summer (kJ/kWh, HHV) 7,047
 Annual Average (kJ/kWh, HHV) 7,026
 Emissions Rate
 Without Duct Firing (Tonnes CO2/MWh) 0.34
 With Duct Firing (Tonnes CO2/MWh) 0.35
 Environmental Controls Dry low NOx burners and SCR
 Dual Fuel Capability No
 Firm Gas Contract Yes
 Black Start Capability None
 On-Site Gas Compression None
 Assumed Forced Outage Rate 2.5%

 Sources and notes:
 See Table 2 for ambient conditions assumed for calculating net summer and winter installed
 capacities (ICAP) and net summer and winter heat rates.

 1. Turbine Model and Configuration

We reviewed the most recently built or permitted gas-fired generation projects in Alberta to
determine the configuration, size, and turbine types for the reference resources. Table 6 below
shows that aeroderivative CTs are the most frequently built gas combustion turbine technology
in Alberta. We specified the Aero CT to include the GE LM6000 turbine because it is the most
built turbine type in total capacity and in number of units. Due to the significant reduction in
net plant capacity of LM6000 turbines at summer temperatures, we evaluated the costs and
incremental capacity of three different power augmentation options: spray-intercooling

 11|brattle.com
technology (referred to as SPRINT turbines) or evaporative cooling or both. 11 We found that the
turbine with SPRINT technology alone offered the most benefit (a 12 MW increase under
summer conditions) for relatively low additional costs ($3 million CAD). 12 A detailed summary
of the power augmentation configurations is provided in Appendix A.

 Table 6: Turbine Models of CT Plants Built Since 2008 or Planned in Alberta

 Capacity Installed and Number Installed and
Turbine Model Turbine Type Permitted since 2008 Permitted since 2008
 MW Count
GE LM6000 Aeroderivative CT 719 15
Siemens SGT6-5000F Frame CT 600 3
GE LMS100 Aeroderivative CT 200 2
Rolls-Royce Trent 60 Aeroderivative CT 198 3
GE 7EA Frame CT 177 2
Wartsila 18V50SG Reciprocating 94 5
Caterpillar-G16CM34 Reciprocating 65 10
Solar Turbines Inc-Titan 130 Aeroderivative CT 30 2
Cummins C2000 N6C Reciprocating 20 10
Jenbacher JGS 620 Reciprocating 18 6
Wartsila 20V34SG Reciprocating 9 1

Total 2,130 59

 Sources and notes:
 Downloaded from ABB Inc.’s Energy Velocity Suite February 2018. Table does not contain units
 designated as cogeneration facilities. CTs shown only for simple-cycle configurations, not
 combined-cycle.

Because most aeroderivative CT plants in Alberta include multiple turbines, we specified two
LM6000 turbines (“2×0 configuration”).

For the simple-cycle Frame CT, we considered three different sized turbines, commonly referred
to as E-class (about 100 MW per turbine), F-class (about 240 MW per turbine), and H-class
(about 370 MW per turbine) turbines. There are very few standalone simple-cycle Frame units
in Alberta (most Frame turbines operate in cogeneration facilities), so we considered both
representative units in Alberta and S&L’s recent experience with developers considering Frame
units. We first eliminated the H-class turbine because there are no existing or planned simple-

11 GE SPRINT technology uses atomized water injection to both compress and increase mass flow
 through the CT, resulting in increased output. Evaporative cooling provides cooling of the inlet air by
 means of water evaporation from a media surface located upstream of the compressor, resulting in
 increased output.
12 Based on discussion with a GE vendor, developers in Alberta are showing substantial interest in the
 SPRINT technology, with approximately half of LM6000 quotes including SPRINT technology.

 12|brattle.com
cycle H-class turbines in the Alberta market, and it is much larger than existing CTs. There has
been limited recent development of the either the E- or F-class turbines, but we found that the
F-class has both lower capital costs and better efficiency than the E-class. 13 Therefore, the F-
class turbine was the best choice for the Frame CT reference technology.

We used a similar methodology for selecting the CC turbines and configuration. There is only
one operating CC in Alberta built in the last decade, which was built with two Mitsubishi G-class
turbines and a single heat recovery steam generator (HRSG) and steam turbine (“2×1
configuration”). Looking forward, four CCs are currently being developed in Alberta, all in 1×1
configurations with three using the larger J/H-class turbines and one using the Siemens F-class
turbine. Based on these recently built and proposed CCs, we specified the reference CC to
include a single H-class turbine (the Siemens SGT6-8000H) in a 1×1 configuration.

 Table 7: Recently Built and Planned Combined Cycle Units in Alberta

 Plant Unit Status Turbine Model Configuration Capacity
 MW
 Shepard Energy Centre Operating Mitsubishi M501G1 2x1 851
 Genesee (CAN) Permitted Mitsubishi 501J 1x1 530
 Genesee (CAN) Permitted Mitsubishi 501J 1x1 530
 Heartland Generating Station Permitted Siemens SGT6-8000H 1x1 510
 Saddlebrook Power Station Permitted Siemens SGT6-5000F 1x1 350

 Sources and notes:
 Downloaded from ABB Inc.’s Energy Velocity Suite February 2018.

Additionally, we include supplemental firing of the steam generator, known as “duct firing,”
which increases steam production and hence increases the output of the steam turbine. 14 Duct
firing is common, although there is no standard optimized design. The decision to incorporate
supplemental firing with the plant configuration and the amount of firing depends on the
owner’s preference and perceived economic value. We assumed the reference CC plant would
add duct firing sufficient to increase the net plant capacity by 50 MW (13%) based on our
understanding of duct-firing capabilities at existing CCs in Alberta.

13 The Carmon Creek site has three planned F-class CT turbines, but this facility is a special case. The
 Carmon Creek site was partially developed by Shell as a cogeneration plant to access oil sands.
 Kineticor plans to finish the project and repurpose the facility as a standalone power plant composed
 of the three F-class Frame CTs.
14 Including duct firing increases the net capacity of the plant but reduces efficiency due to the higher
 incremental heat rate of the supplemental firing (when operating in duct-firing mode) and the
 reduced efficiency of steam turbine (when not operating at full output). The estimated heat rates and
 capacities take account for this effect.

 13|brattle.com
2. Environmental Requirements and Implications

Alberta Environment and Parks (AEP) sets power plants emissions standards in Alberta. 15 The
current regulations concerning nitrogen oxides (NOx) emissions were last updated in 2005 and
require that the reference technologies install dry low NOx burners to meet the NOx emissions
standards. Based on conversations with AEP staff, we are aware that the AEP is in the process of
updating the standards and is evaluating the costs and performance of selective catalytic
reduction (SCR) systems. However, the AEP has not provided any indication as to whether the
new standards will require gas-fired technologies to install SCRs. Recent CCs proposed in
Alberta have included plans to install SCRs, likely in an attempt to minimize community
opposition and project delays related to permitting and in anticipation of future NOx regulation.
Consequently, we assume a new CC would include an SCR even though it is not strictly required
at the time of this study. Given the lack of technology mandates or recent simple-cycle CT
builds with SCRs, we do not specify an SCR on the simple-cycle reference technologies. 16

Canada has a national source standard of 50 ppm for carbon monoxide (CO), which was
established in 1992. 17 This standard is not binding for the reference technologies. Thus, we have
not included oxidation catalysts for any of the three technologies.

The Canadian government updated the federal carbon dioxide (CO2) emissions regulations on
natural-gas fired generation over 25 MW in early 2018. 18 The updated CO2 emissions rate limits
apply only to units with a capacity factor greater than 33% and vary by unit size, with units
larger than 150 MW limited to 0.42 tonnes/MWh and units between 25 MW and 150 MW
limited to 0.55 tonnes/MWh. The emissions rate of new CCs are sufficiently low to meet the
0.42 tonnes/MWh limit for larger units, and the same is true for the Aero CTs at the less
restrictive rate applied to smaller units. 19 The less efficient Frame CT, however, will exceed the
0.42 tonnes/MWh limit and thus will be restricted to a 33% capacity factor. 20

15 Alberta Environment and Parks (2005). Alberta Air Emission Standards for Electricity Generation and
 Alberta Air Emission Guidelines for Electricity Generation, available at
 http://aep.alberta.ca/air/legislation-and-
 policy/documents/AirEmissionStandardsGuidelinesElectricity.pdf.
16 At a high-level, adding SCRs to the simple-cycle technologies, including additional labor costs, would
 increase nominal overnight costs for the Aero CT and Frame CT by $147/kW and $28/kW,
 respectively. This would translate to an increase in CONE of $18/kW-yr (2021, CAD) for the Aero CT
 and $3/kW-yr for the Frame CT.
17 Government of Canada (1992). National Emissions Guidelines for Stationary Combustion Turbines,
 available at https://www.ccme.ca/files/Resources/air/emissions/pn_1072_e.pdf.
18 Government of Canada (2018). Regulations Limiting Carbon Dioxide Emissions from Natural Gas-
 fired Generation of Electricity, Canada Gazette 152(7), available at http://gazette.gc.ca/rp-
 pr/p1/2018/2018-02-17/html/reg4-eng.html.
19 Assuming a CO2 emissions rate for natural gas of 0.050 tonnes/GJ and using the net summer heat rates
 presented in Table 5, the reference CC’s CO2 emissions rates will be approximately 0.35 tonnes/MWh
 Continued on next page

 14|brattle.com
3. Fuel Supply Specifications

Despite the abundance of natural gas in Alberta, the recent shift in natural gas production to the
northwest portion of the province and existing long-term export arrangements have resulted in a
demand-constrained natural gas pipeline system across most of the province. 21 To ensure
delivery of natural gas to new power plants, we assume developers will enter into firm
transportation service contracts with Nova Gas Transmission Ltd. (NGTL), which owns and/or
operates the predominant natural gas transportation system in Alberta. Though it may be
possible for some developers to make fuel supply arrangements directly to a natural gas
processing facility and bypass the NGTL system, these projects are not likely to be the norm. 22

An alternative approach to securing fuel supply is to install “dual-fuel” capability, which allows
the plant to burn both gas and diesel fuel. Dual-fuel plants permit the turbines to switch
between the lower cost fuel sources depending on market conditions and fuel availability. Given
the demand constraints facing Alberta’s pipeline system and the need for firm transportation
service, developers are not likely to include dual-fuel capabilities and have not chosen to do so
for recent gas-fired generation projects. 23

 4. Additional Specifications

Combined Cycle Cooling System: For the reference CC plant, we assumed a closed-loop
circulating water cooling system with a multiple-cell mechanical draft cooling tower based on
the predominance of cooling towers among new CCs and S&L’s experience in Alberta. An
alternative to the wet cooling system is an air-cooled system. Air cooling is substantially more
expensive, but wet cooling requires access to water and the ability to obtain the necessary
permits. We believe that competitive developers will pursue wet cooling, in the interest of
project economics, as long as water resources are available. Though water availability is

Continued from previous page
 and 0.34 tonnes/MWh with and without duct firing, respectively. Based on the net summer heat rates
 presented in Table 3, the Aero CT’s emission rate will be approximately 0.50 tonnes/MWh. See U.S.
 Environmental Protection Agency, Greenhouse Gases Equivalences Calculator—Calculations and
 References, available at https://www.epa.gov/energy/greenhouse-gases-equivalencies-calculator-
 calculations-and-references.
20 Assuming a CO2 emissions rate for natural gas of 0.050 tonnes/GJ and using the net summer heat rate
 presented in Table 4, the Frame CT’s CO2 emissions rate will be approximately 0.52 tonnes/MWh. Id.
21 TransCanada’s NGTL System FT-D Availability Map as of June 8, 2018, available at
 http://www.tccustomerexpress.com/docs/Delivery%20Map%20June%208%202018.pdf.
22 Additionally, natural gas plants are very sensitive to the sulfur content of the gas, which is carefully
 monitored by NGTL and may not be by independent suppliers. This incorporates additional
 operational risks, which would need to be included in the cost estimates.
23 Determined through review of data downloaded from ABB Inc.’s Energy Velocity Suite in February
 2018.

 15|brattle.com
constrained in much of Alberta, it is our understanding that AEP is still accepting water license
applications for water usage from the North Saskatchewan River Basin. Information published by
AEP indicates that only 20% to 30% of the usable capacity from the North Saskatchewan River
has been allocated. 24 A CC plant built near Edmonton would be pulling water from the North
Saskatchewan River, thus it is feasible to obtain water permits in the Edmonton area.

Black Start Capability: We did not include black start capability in any of the reference units.

Electric Interconnection: We selected 240 kV as the typical voltage for a new CC plant and 115
kV for the Aero and Frame CTs to interconnect to the AESO’s transmission grid. The switchyard
is assumed to be within the plant boundary and is counted as an EPC cost under “Other
Equipment,” including generator circuit breakers, main power and auxiliary generator step-up
transformers, and switchgear. All other electric interconnection equipment, excluding network
upgrades socialized by the AESO, is included separately under Owner’s Costs.

Gas Compression: We assume gas compression would not be needed for the reference
technologies as they are located near and/or along NGTL’s pipeline system. Both the Frame and
Aero CT turbines operate at lower gas pressures than the gas pipelines.

24 Government of Alberta Environment (2018). How Water is Governed: Water Licenses, Transfers, and
 Allocation, available at http://alberta-water.ca/how-is-water-governed/water-licences-transfers-and-
 allocation. Note that upcoming coal retirements in the Edmonton area may further increase water
 permit availability.

 16|brattle.com
You can also read