MARKET TRENDS REPORT 2020 REPORT SUMMARY - OFF-GRID SOLAR - Lighting Global
←
→
Page content transcription
If your browser does not render page correctly, please read the page content below

OFF-GRID SOLAR
MARKET TRENDS REPORT 2020
REPORT SUMMARY
February 2020

        Produced by
Disclaimer
This report is the sixth in a series of biennial assessments of the global off-grid solar market undertaken by the World Bank Group through its
Lighting Global Program. Lighting Global is the platform under which the World Bank Group supports the development of the global off-grid
solar energy services market and includes a portfolio of country-based market development programs undertaken through Lighting Africa,
Lighting Asia, Lighting Pacific, and ESMAP.

The conclusions and judgments contained in this report should not be attributed to, and do not necessarily represent the views of IFC or its Board
of Directors, the World Bank or its Executive Directors, or the countries they represent. IFC and the World Bank do not guarantee the accuracy of
the data in this publication and accept no responsibility for any consequences of their use.

The information contained in this publication is derived from carefully selected sources that are believed to be reasonable. Vivid Economics and
Open Capital Advisors do not guarantee its accuracy or completeness and nothing in this document shall be construed to be a representation of
such a guarantee. Any opinions expressed reflect the current judgement of the authors of the relevant article or features and do not necessarily
reflect the opinion of Vivid Economics and Open Capital Advisors, the IFC, or the World Bank. The opinions presented are subject to change
without notice.

Vivid Economics and Open Capital Advisors, the IFC, or the World Bank accept no responsibility for any liability arising from the use of this
document or its contents.

February 2020

Copyright
© International Finance Corporation 2020. All rights reserved.
2121 Pennsylvania Avenue NW
Washington, DC 20433
Internet: www.ifc.org

The material in this work is copyrighted. Copying and/or transmitting portions or all of this work without permission may be a violation of
applicable law. IFC encourages dissemination of its work and will normally grant permission to reproduce portions of the work promptly, and
when the reproduction is for educational and non-commercial purposes, without a fee, subject to such attributions and notices as we may
reasonably require.

All other queries on rights and licenses, including subsidiary rights, should be addressed to IFC’s Corporate Relations Department, 2121
Pennsylvania Avenue NW, Washington, DC 20433.

International Finance Corporation is an international organization established by Articles of Agreement among its member countries and a member of the
World Bank Group. All names, logos, and trademarks are the property of IFC, and you may not use any of such materials for any purpose without the
express written consent of IFC. Additionally, “International Finance Corporation” and “IFC” are registered trademarks of IFC and are protected under
international law.

Photo credits
Front cover
Top row left to right: OffGridElectric, FuturePump, © Niwa, @Solar Aid, ZOLA Electric.
Second row left to right: ©BRIGHT, ©M-KOPA/Allan Gichigi, Futurepump - IWMI and Jeffrey M. Walcott, Solar Sister, Fenix International.
Third row left to right: ©CLASP, ©Dan Odero, Bright, ©Lighting Africa/Andres Bifani, Little Sun.
Fourth row left to right: Lighting Africa, D.Light, NIWA Solar, ©India Impex, ©Lighting Africa / Zeleman communication.
Dear Reader,
In 2009, the World Bank Group’s Lighting Africa program
launched with an audacious target: to reach 250 million
people with off-grid solar products by 2030. Thanks
to the vision, innovation, and commitment of a
remarkable group of entrepreneurs, the off-grid
solar industry surpassed the goal of 250 million
in 2019—more than a decade ahead of schedule.                                                         Dana Rysankova
                                                                                                      Lighting Global
Today, the off-grid solar industry has been embraced globally as the critical component
                                                                                                      WORLD BANK
in the fight to eliminate energy poverty. It has become a proven reliable way to provide
affordable modern electricity services in rural communities and an important
complement in areas with unreliable grid electricity. Yet as this report makes clear, the
Sustainable Development Goal 7 target of achieving universal electricity access by
2030 will require a steep acceleration of the off-grid solar market’s development.

A decade in, the off-grid solar industry has already delivered quality energy services to
hundreds of millions of people – including those that traditional electricity utilities had
been unable to serve. Lighting Africa’s successful pilot in Kenya has been replicated across
the continent and the globe, leading to the creation of Lighting Asia and Lighting Global,
which is now active in nearly 40 countries. The Global Off Grid Lighting Association (GOGLA)
boasts more than 170 members, serving hundreds of millions of customers globally.
                                                                                                      Koen Peters
The 2020 edition of the Off-Grid Solar Market Trends Report measures the pulse of                     Executive Director
the off-grid solar market, and includes the most comprehensive sales and impact data                  GOGLA
available, in-depth analysis on current market dynamics and an outlook on the future of
the industry. As in previous years, we seek to frame the varied trends of a dynamic
sector, to inform the range of actors in the market, and to set strategy.

The cross-currents that characterize the evolution of the off-grid solar market are a compelling
part of the story told in the Market Trends Report. Technology continues its rapid development,
driving improved economics that enable more and more people to access modern
electricity services, while expanding the array of services enabled by solar power.

Governments are stepping up their support to the sector, integrating off-grid solutions
in their electrification plans, improving the enabling environment, and increasing financial
support in order to leave no one behind. While household services, including fans and
appliances and internet connectivity, have become a mainstay of the sector, the frontier              Russell Sturm
of productive uses of solar is now firmly in sight, and the report looks at pathways for the          Lighting Global

market’s further expansion. Business models continue to adapt and respond to customer                 INTERNATIONAL
                                                                                                      FINANCE
needs, including opportunities for sustainable off-grid services for schools and health facilities.   CORPORATION
The future of the off-grid sector heralds a second decade of innovation and impact. As
the market matures, the industry’s focus on volume of sales has evolved into a more
refined focus on unit economics and sustained profitability. This is the lynchpin for attracting
the levels of investment needed to grow the sector at scale. And that is the precondition
for achieving our ultimate energy access goal: the elimination of energy poverty.

We hope you enjoy reading the story of where we are, and where we’re headed.
This report is produced by Lighting Global, GOGLA, and ESMAP,
in collaboration with Vivid Economics and Open Capital Advisors.
                                                                       Lighting Global is the World Bank Group’s initiative to rapidly increase
                                                                       access to off-grid solar energy for the 840 million people worldwide
                                                                       living without electricity. Lighting Global - managed by the International
                                                                       Finance Corporation (IFC) and the World Bank - works with manufacturers,
distributors, governments, and other development partners to build and grow the modern off-grid solar energy market. Lighting Global programs
are funded with support from the Energy Sector Management Assistant Program (ESMAP), The Public – Private Infrastructure Advisory Facility
(PPIAF), The Netherlands’ Ministry of Foreign Affairs, The Italian Ministry for the Environment, Land, and Sea (IMELS), and the IKEA Foundation.

                                   GOGLA is the global association for the off-grid solar energy industry. Established in 2012, GOGLA now
                                   represents over 170 members as a neutral, independent, not-for-profit industry association. Its mission is
                                   to help its members build sustainable markets, delivering quality, affordable products and services to as many
                                   households, businesses and communities as possible across the developing world. The products and solutions
                                   that GOGLA members sell transform lives. They improve health and education, create jobs and income
                                   opportunities and help consumers save money. To find out more, go to www.gogla.org.

                                   ESMAP is a multi-donor trust fund administered by the World Bank, anchored in the Energy & Extractives
                                   Global Practice in Washington, DC. As a long-standing partnership between the World Bank and bilateral partners,
                                   ESMAP helps low- and middle-income countries reduce poverty and boost growth through environmentally
                                   sustainable energy solutions. ESMAP’s analytical and advisory services are fully integrated within the World
                                   Bank Group’s country policy dialogue and lending programs in the energy sector. Through the WBG, ESMAP
                                   works to accelerate the energy transition required to achieve Sustainable Development Goal 7 (SDG7) to ensure
                                   access to affordable, reliable, sustainable and modern energy for all. It helps to shape WBG strategies and programs
                                   to achieve International Development Association (IDA) policy commitments and the WBG’s Climate Change
                                   Action Plan targets.

                                   IFC—a sister organization of the World Bank and member of the World Bank Group—is the largest
                                   global development institution focused on the private sector in emerging markets. We work with more than
                                   2,000 businesses worldwide, using our capital, expertise, and influence to create markets and opportunities
                                   where they are needed most. In fiscal year 2019, we delivered more than $19 billion in long-term financing
                                   for developing countries, leveraging the power of the private sector to end extreme poverty and boost
                                   shared prosperity. For more information, visit www.ifc.org.

                                   The World Bank comprises the International Bank for Reconstruction and Development (IBRD) and the
                                   International Development Association (IDA). The organization’s mission is to end extreme poverty and promote
                                   shared prosperity in a sustainable way. The World Bank is a vital source of financial and technical assistance to
                                   developing countries around the world. We are not a bank in the ordinary sense but a unique partnership to
                                   reduce poverty and support development.

                                   Vivid Economics is a leading strategic economics consultancy with global reach. We strive to create lasting
                                   value for our clients, both in government and the private sector, and for society at large.

                                   We are a premier consultant in the policy commerce interface and resource- and environment-intensive
                                   sectors, where we advise on the most critical and complex policy and commercial questions facing clients
                                   around the world. The success we bring to our clients reflects a strong partnership culture, solid foundation
                                   of skills and analytical assets, and close cooperation with a large network of contacts across key organizations.

                                   Open Capital Advisors (OCA) is a management consulting and financial advisory firm that drives growth,
                                   enables investment, and builds markets across Africa. We help businesses, investors, development partners, and
                                   the public sector identify opportunities and deliver unique, impactful solutions. Since 2010, we have completed
                                   more than 600 engagements across 20 countries in Sub-Saharan Africa and for global clients focused on Africa.
                                   Our locally based team of over 120 offers experience from the world’s top consultancies, private equity
                                   firms, investment banks, and development organizations including Boston Consulting Group, Citigroup,
                                   Credit Suisse, IFC, McKinsey, and The World Bank.
REPORT SUMMARY

1   ESMAP, Tracking SDG7: The Energy Progress Report Highlights, 2019, https://trackingsdg7.esmap.org/data/files/download-documents/tracking_sdg7_2019_highlights.pdf

                                                                                                                                        Trends Report 2020     1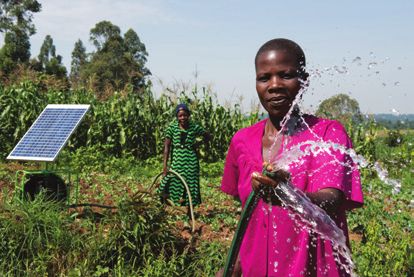
HEADLINE INSIGHTS

                                                                The off-grid solar sector has grown tremendously over the past 10 years
                                                                into a vibrant, US$ 1.75 billion annual market, which remains on a solid
                                                                growth curve.1 The sector is currently serving 420 million users. From
                                                                2017 to 2019, revenues grew rapidly at 30 percent annually, while sales
                                                                volumes grew at 10 percent annually. A shift towards higher-priced
                                                                Pay-As-You-Go (PAYGo)–enabled products that provide higher levels of
                                                                energy service has driven this rapid growth in sector turnover. While
                                                                pico products still comprise around 83 percent of all sales since 2010,
                                                                the growing reach of larger SHS products means that over half of off-
       US$ 1.75 billion market                                  grid solar customers now receive “Tier 1” access or higher to a clean,
      serving 420 million users                                 modern, and reliable source of electricity.

                                                                As the sector matures, companies are increasingly focused on financial
                                                                sustainability. Companies are moving into new geographies and underserved
                                                                markets as established markets become more saturated. They are also
                                                                accelerating the shift towards larger, higher-margin SHS sales in response
                                                                to growing consumer demand for appliances and backup systems, which
     38 percent annual increase                                 dovetails with their focus on financial sustainability. In addition, two new
         in PAYGo unit sales                                    business models are solidifying: (1)“beyond energy” companies using
                                                                consumer PAYGo data to offer financing for non-energy products and
                                                                services and (2) next-generation off-grid utilities.

                                                                The global potential OGS market remains substantial, with 840 million
                                                                people without electricity access, over 1 billion connected to an
                                                                unreliable grid, over 70 million farmers who could leverage OGS for
                                                                productive use and a promising public institutions market. Productive
                                                                Use Leveraging Solar Energy (PULSE) solutions, such as solar water
                                                                pumps (SWPs), cold storage, and solar milling, and products servicing
    Potential market of 1.8 billion                             public institutions are natural expansions of the traditional OGS market,
     people and over 70 million                                 which serves households and microenterprises. Both of these markets
               farmers                                          hold tremendous potential opportunities.

1    This report follows the convention that 1 billion = 1,000 million.

      2      Off Grid Solar Market: Trends Report 2020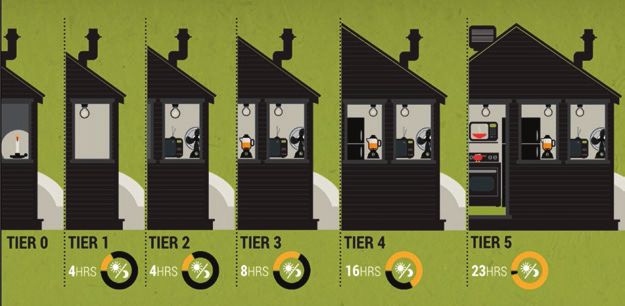
Several signs speak to the industry’s growing financial maturity, such
                           as an increase in debt investments and larger ticket sizes. Despite this
                           progress, funding gaps remain, particularly for Second- and Third-Generation
                           companies, which have been unable to raise equity. Investor types are
                           also shifting, with increased engagement from larger strategic investors,
    US$ 1.5 billion in
                           specialized debt providers, and crowdfunding, although a lack of local
 investment since 2012
                           funding sources persists. To accelerate funding for the sector and attract
                           investors will require innovative financing mechanisms, and companies
                           will need to demonstrate profitability and increase transparency around
                           operational efficiencies.

                           The OGS sector remains on a strong growth trajectory; the sector
                           is projected to serve 823 million users with OGS products by 2030.
                           To sustain the current market growth trajectory, the sector will
                           require an investment of US$ 1.7–2.2 billion in the next five years.

   823 million users
       by 2030

                           To achieve universal access, the sector would need to reach as many
                           as 617 million people with Tier 1 OGS products as their main source of
                           electricity; this would require US$ 6.6–11 billion in additional financing.
                           Of this total need, US$ 6.1 to 7.7 billion comprises required external
                           investment into OGS companies, and up to US$ 3.4 billion represents
                           public subsidies to bridge the affordability gap. These funds will
                           need to be raised between now and 2030 to unlock commercial
                           opportunities, as well as to reach the poorest people.
   US$ 6.6–11 billion
 additional financing to
achieve universal access

                                                                                 Executive Summery   3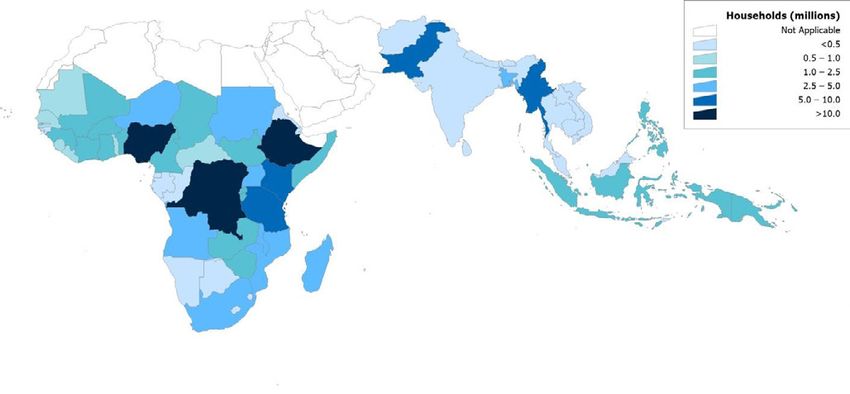
THE OFF-GRID SOLAR SECTOR HAS
    GROWN INTO A VIBRANT US$ 1.75 BILLION
    ANNUAL MARKET CURRENTLY SERVING
    420 MILLION USERS AND REMAINS
    ON A SOLID GROWTH CURVE.

Sales revenues are growing rapidly at 30 percent annually due to increased sales of higher-priced, PAYGo-
enabled products that provide increased levels of energy service. In 2016, the industry reached a significant
milestone, surpassing US$ 1 billion in annual turnover. Since then, turnover has continued to grow rapidly to reach
approximately US$ 1.75 billion in 2019 (Figure 1). This represents an annual growth rate of 30 percent over the period
2017 to 2019 (Figure 1). Growth in turnover is bolstered largely by increasing sales of larger systems, predominantly
through PAYGo-enabled solar home systems (SHS), that provide higher service levels to customers.

Figure 1: Estimated OGS Annual Market Turnover (2017–2019 est.)

                                                2.0
                                                                                                          1.7B-1.8B
                                                1.8                    30%

                                                1.6
                                                                     1.4B-1.5B
           Market turnover (in billions, US$)

                                                1.4

                                                1.2
                                                      0.95B-1.05B
                                                1.0

                                                0.8

                                                0.6

                                                0.4

                                                0.2

                                                0.0
                                                         2017            2018                              2019 est.

Source: Vivid Economics and Open Capital Advisors analysis of Stiftung Solarenergie. Sendea gGmbH, “Mangoo Marketplace,”
https://www.mangoo.org/; Aurélien Boyer et al., Pricing Quality: Cost Drivers and Value Add in the Off-Grid Solar Sector (Utrecht: GOGLA, 2019),
https://www.hystra.com/reaching-scale-in-access-to-energy-2017; GOGLA data; and MTF data.
Note: Market turnover was derived by a multi-tiered approach. For cash sales, we used conservative price estimates from our pricing analyses
for each wattage category, calculating a weighted average price for pico and SHS products based on these estimates. We then multiplied that
average combined pico and SHS pricing by global cash sales volumes to estimate an annual market turnover for pico and SHS products bought
in cash. For PAYGo, we assume a two-year repayment period, and we recognize revenue in the first year as the revenue collected from the
down payment plus revenue collected from ongoing payments expected that year.

     4     Off Grid Solar Market: Trends Report 2020
Year-on-year unit sales also continue to grow at 10 percent annually, with more than 30 million OGS units sold
in 2018 and 2019 on course to exceed this figure.2 Following the sector’s rapid acceleration between 2010 and
2015, with annual growth rates of 133 percent, the industry saw a decline in sales leading up to 2017 due to localized
shocks in key pico product markets and companies’ adaptations to sector-wide trends. Since then, growth in annual
unit sales has stabilized to 10 percent from 2017 to 2019, showing signs of a maturing market (Figure 2).

Figure 2: Global Estimated Annual Unit Sales of OGS Products by Segment (2010–2019)

                                           45

                                           40
                                                                                                                                10%

                                           35                                                            -2%
          Total unit sales (in millions)

                                           30

                                           25
                                                                             79%
                                           20

                                           15

                                           10

                                           5           245%

                                           0
                                                2010      2011      2012     2013      2014       2015     2016      2017        2018       2019 est.

                                                 Affiliate sales est.      Non-affiliate sales est.       Non-affiliate max. sales est.

Source: Vivid Economics and Open Capital Advisors analysis of MTF data; Silvia Francioso et al., Global Off-Grid Solar Market Report: Semi-An-
nual Sales and Impact Data H1 2018 (Utrecht: GOGLA; Washington, DC: Lighting Global, October 2018), https://www.gogla.org/resources/
global-off-grid-solar-market-report-h1-2018-sales-and-impact-data; Silvia Francioso et al., Global Off-Grid Solar Market Report: Semi-Annual Sales
and Impact Data H2 2018 (Utrecht: GOGLA, May 2019), https://www.gogla.org/resources/global-off-grid-solar-market-report-h2-2018-sales-and-
impact-data; Silvia Francioso et al., Global Off-Grid Solar Market Report: Semi-Annual Sales and Impact Data H1 2019 (Utrecht: GOGLA, October
2019), https://www.gogla.org/resources/global-off-grid-solar-market-report-h1-2019-sales-and-impact-data; Koen Peters et al., Off-Grid Solar
Market Trends Report 2018 (Washington, DC: Lighting Global, January 2018), https://www.lightingglobal.org/resource/2018-global-off-grid-solar-
market-trends-report; and other GOGLA sales data.

    This report distinguishes between “affiliate” and “non-affiliate” products available to users. Affiliate
    products are sold by companies that are connected to any of the partner organizations involved in the semi-
    annual GOGLA sales data reporting process, including GOGLA members, companies selling products that meet
    Lighting Global Quality Standards, and appliance companies that participated in the Global LEAP Awards or are
    engaging with the Low Energy Inclusive Appliances (LEIA) program. Much less data are available on the
    non-affiliate portion of the market, though it contributes significantly to sales volumes (Figure 2).
    Recently available data sources confirm that non-affiliate products account for the majority of sales volumes
    (72 percent).3 Approximately 200 non-affiliate manufacturers of OGS products play an important role in an organic

2   GOGLA data and MTF analysis.
3   Non-affiliate products are those that are not sold by companies involved in the GOGLA sales data reporting process. Little data are collected on this portion of
    the market, but household survey data reveal the extent of their role in the market.

                                                                                                                                          Report Summery       5
and competitive marketplace.4 However, the non-affiliate market is not well understood. While non-affiliate
    products can represent a cheaper and sometimes quality alternative, they can also be low-quality, which can
    erode consumer confidence in all OGS products. This report estimates that 23 million non-affiliate products (or
    72 percent of total market share) were sold in 2018, compared to 7.6 million affiliate products. While non-affiliate
    products dominate both the pico and combined (plug-and-play, or PnP, and component-based) SHS markets, we
    estimate that affiliates represent over 50 percent of the market for PnP SHS specifically. The market share of
    non-affiliate products varies wildly by country from, for example, 98 percent in Nepal to 3 percent in Rwanda.5

In total, around 180 million OGS units have been sold worldwide since 2010, comprising 150 million pico products
and 30 million SHS. Accounting for the lifecycle of these products, approximately 84 million units are “live,” that is, in use
today, benefiting more than 420 million people (Figure 3). This represents an estimated market penetration of 17 percent.

Figure 3: Global Estimate of Live Products by Product Segment (as of H1 2019)

                                        84 M                    2M
                                                                                      16 M

                                                                                                             20 M

                                                                                                                                     46 M

Source: Vivid Economics & Open Capital Advisors analysis of GOGLA live product data and MTF data.

Today, the pico product segment is heavily commoditized and competitive, providing users with highly
affordable lighting solutions. Non-affiliate manufacturers and unbranded products are firmly established in the
market, representing the majority of pico sales. Non-affiliate manufacturers are also expanding their offerings to
focus on designing their own brands, in some cases distributing directly to the market. This increased competition has
driven down prices and made products more affordable, particularly small pico products that serve as an important
entry point for many users to OGS products.

4   Vivid Economics and Open Capital Advisors analysis and consultations.
5   CLASP, Off-Grid Appliance Market Survey: Perceived Demand and Impact Potential of Household, Productive Use and Healthcare Technologies, 3rd ed. (London
    and Washington, DC: Efficiency for Access Coalition, September 2018), https://efficiencyforaccess.org/publications/off-grid-appliance-market-survey; The World
    Bank, Open Data, https://data.worldbank.org/; Demographic and Health Surveys, DHS Data, https://dhsprogram.com/data/; Ipsos market research commis-
    sioned by Lighting Global; MTF household survey data; GOGLA live product data; and industry interviews. Notably, the expected lifetime of high-quality affiliate
    products is higher than that of low-quality, non-affiliate products. Therefore, the use of live product data to calculate the non-affiliate share of sales may underes-
    timate the number of non-affiliate products sold in the market.

     6      Off Grid Solar Market: Trends Report 2020
Solar home systems, which currently represent about 17 percent of unit sales, will increasingly drive growth
in the years to come. The SHS segment comprises two distinct types of system: (1) PnP integrated systems,
mostly using lithium battery technology and marketed by affiliate companies and (2) component-based systems
offered by a wide variety of distributors, often unbranded and typically using lead-acid batteries. Affiliate unit sales of
SHS have continued to grow strongly in recent years. Unit sales of larger SHS kits, particularly 21–49 Wp systems
that can power televisions, increased by 73 percent annually from 2016 to 2018. SHS unit sales for products rated 11
Wp or more are increasing by 53 percent annually.6
The PAYGo business model used to finance both SHS and pico solar products is rapidly increasing its market
share, reaching 24 percent of unit sales in H1 2019 from 20 percent in H1 2018.7 PAYGo boosts affordability, unlocking
larger PnP systems that provide higher levels of energy service in addition to a wide variety of high-value, non-energy
services that can be offered over PAYGo platforms. Many investors have encouraged companies to enter the PAYGo
space in the face of reducing margins for cash sales of pico products. West Africa has seen the fastest increase in PAYGo
unit sales in the last year, reaching 47 percent of all unit sales and 92 percent of market value in that market in H1 2019.
Within the affiliate market, PAYGo comprises 76 percent of SHS unit sales and 14 percent of pico unit sales.
Nonetheless, cash-based sales of pico products will remain the backbone of the industry in terms of unit sales
over the next few years. More than 75 percent of affiliate products and the vast majority of non-affiliate products
are sold on a cash basis. Given the low incomes of target customers for off-grid products, which are generally not
sold on a PAYGo basis.
The household appliance category is becoming a major driver for the sector; affiliate companies sold more
than a million appliances in H2 2018 and H1 2019. High-efficiency DC appliances are contributing to the increase
in PnP SHS sales. Between H2 2018 and H1 2019, appliance sales increased by 111 percent, with televisions and
fans accounting for 99 percent of recorded sales.8 Most fans are sold in South Asia, while most televisions—typically
more expensive than fans—are sold in East Africa, where PAYGo financing is very prevalent (Figure 4). The current
global addressable market for off-grid household appliances is an estimated US$ 12.6 billion and could grow to US$
25.3 billion by 2030.9
TVs
Figure 4: PAYGo Regional Unit Sales of Televisions and Fans (Cumulative 2018 H2 and 2019 H1)
TVs
TVs
Fans
Fans
0 100 200 300 400 500 600 700 800
Fans Unit sales (in thousands)
0 100 200 300 400 500 600 700 800
South Asia West(in
Unit sales Africa East Africa
thousands)
South Asia West Africa East Africa
Source: Vivid Economics
0 and Open100
Capital Advisors
200 analysis 300
of GOGLA sales
400data. 500 600 700 800
Unit sales (in thousands)
6 GOGLA data.
7 South
These figures apply only to the affiliate portion of the market. Asia West Africa East Africa
8 Francioso et al., Off-Grid Solar Market H2 2018; and Francioso et al., Off-Grid Solar Market H1 2019.
9 Dalberg, The State of the Off-Grid Appliance Market (London and Washington, DC: Eficiency for Access Coalition, October 2019), https://efficiencyforaccess.org/
publications/2019-state-of-the-off-grid-appliance-market-report, 10.
Report Summery 7Productive use leveraging solar energy (PULSE) products represent an emerging opportunity for the OGS
sector, although the market is still in its infancy and will continue to learn and evolve. PULSE covers a wide range
of products including solar water pumps (SWPs) and cold storage for agricultural applications, as well as refrigeration
and appliances for microenterprises.10 The market for SWPs has been heavily driven by government subsidies; in India,
for example, over 150,000 SWP units have been sold to date, bolstered by government subsidies.11 The commercial
opportunity for the broader PULSE market is growing due to falling costs of PULSE technology, increases in appliance
efficiency, and innovations in business models. Affiliate companies sold fewer than 10,000 SWPs (all less than 3kW)
between H2 2018 and H1 2019, the only periods for which sales were collected.12 However, given the high number of
non-affiliate manufacturers of solar water pumps in the market, anecdotal evidence suggests the number of units sold
globally is much higher.
Companies are still testing business models and a wide variety of technologies to meet large potential PULSE
markets for cold storage, refrigeration, and agri-processing. Affiliate companies sold less than 10,000 off-grid
refrigerators in H2 2018 and H1 2019, and only a portion of these are for productive use. Meanwhile, in addition to
refrigeration, many solar milling business models and technologies are in the pilot phase and not yet commercially
deployed. Beyond agri-processing, even more specialized productive use applications have emerged in specific value
chains such as poultry, dairy, and coffee.13 Though the PULSE segment remains in its infancy, the rapid expansion in
market participants indicates strong potential growth, with a total addressable market of US$ 11.3 billion in 2018 for
Sub-Saharan Africa alone.14
AS THE SECTOR MATURES, COMPANIES ARE
FOCUSING ON FINANCIAL SUSTAINABILITY
AND UNIT ECONOMICS BY EXPANDING
TO NEW MARKETS AND SELLING LARGER
SYSTEMS THAT PROVIDE HIGHER LEVELS
OF SERVICE TO CUSTOMERS.
Companies are moving into new geographies and underserved markets in pursuit of scale. Several providers
in East Africa have expanded into new markets, especially in West Africa, as established markets become more
saturated. In Nigeria, companies are introducing new products; for example, Zola launched its Infinity backup product
to serve the large unreliable grid market in that country, and Beebeejump offers an SHS product with an AC inverter,
a category in which several other companies are currently testing products. Other international companies, such as
RZB Lighting, are looking at Vietnam, Indonesia, and the Philippines as new core markets of interest in Asia, after
achieving mixed success in more developed off-grid markets, such as India.15 With the goal of accelerating energy
10 Lighting Global, ESMAP, and Dalberg Advisors, The Market Opportunity for Productive Use Leveraging Solar Energy (PULSE) in Sub-Saharan Africa (Washington,
DC: Lighting Global, September 2019), https://www.lightingglobal.org/resource/pulse-market-opportunity/, 12.
11 Dalberg, Solar Water Pump Outlook 2019: Global Trends and Market Opportunities (London and Washington, DC: Efficiency for Access Coalition, September
2019), https://clasp.ngo/publications/solar-water-pump-outlook-2019-global-trends-and-market-opportunities, 6.
12 GOGLA data.
13 GOGLA data.
14 Lighting Global, ESMAP, and Dalberg Advisors, Market Opportunity for PULSE, 20.
15 RZB Group, “RZB Founded New Subsidiary RZB Lighting Asia & Pacific Sdn. Bhd.,” news release, June 5, 2014, https://www.rzb.de/en/media-centre/press-re-
leases/article/1183-rzb-founded-new-subsidiary-rzb-lighting-asia-pacific-sdn-bhd-kuala-lumpur-malaysia/.
8 Off Grid Solar Market: Trends Report 2020access, an increasing number of government incentives are encouraging expansion to underserved regions. In Togo,
both BBOXX and Soleva have entered to take advantage of the Togolese government’s incentive scheme for SHS.16
PAYGo technology, declining manufacturing costs, and increasing appliance efficiency have fueled the shift
towards larger systems. SHS manufacturing costs have declined by approximately 5–15 percent over the last two
years. There are now also highly efficient DC appliances on the market, representing an increasingly cost-effective
option for users. The combination of continued efficiency gains for appliances, declining manufacturing costs, and
use of the PAYGo business model to increase affordability will continue to drive the SHS and appliance markets.
These systems provide higher revenues and improved cashflow, important for companies that began to face investor
pressure to generate profits two or three years ago.17
These larger PAYGo-enabled systems are providing customers with energy access levels of Tier 1 and greater,
crucial for achieving energy access targets. More than half of people currently using an OGS product have at least
Tier 1 access, the minimum that counts as electricity access against globally agreed targets (Figure 5). The remaining
45 percent use an OGS product below Tier 1—pico products, such as solar lanterns. Achieving the Sustainable
Development Goal (SDG) 7 objective of universal access to “affordable, reliable, sustainable, and modern energy”
will require not only reaching currently unserved populations but also helping those using below Tier-1 products
move up to Tier 1 systems. Growing sales of larger systems that can provide at least Tier 1 service indicates progress
towards that goal.
Figure 5: People Benefiting from Access to Electricity through OGS Devices (Millions)
Tier 1: 184 million Tier 2: 47 million
Tier 0: 189 million 32% affiliate; 68% non- 10% affiliate; 90%
23% affiliate; 77% non-affiliate affiliate non-affiliate
44 M 145 M 60 M 124 M 42 M
5M
0 50 100 150 200 250 300 350 400 450
Number of people (in millions)
Affiliate Tier 0 Non-affiliate Tier 0 Affiliate Tier 1
Non-affiliate Tier 1 Affiliate Tier 2 Non-affiliate Tier 2
Source: Vivid Economics and Open Capital Advisors.
16 BBOXX, "BBOXX Receives Invitation to Meet President of Togo to Roll Out 300,000 Solar Home Systems," news release, July 17, 2017, https://www.bboxx.
co.uk/bboxx-receives-invitation-meet-president-togo-roll-300000-solar-home-systems/; and Ayi Renaud Dossavi, “CIZO Project: SOLEVA Starts Operations as
Planned,” Togo First, June 3, 2019, https://www.togofirst.com/en/energy/0306-3298-cizo-project-soleva-starts-operations-as-planned.
17 Vivid Economics and OCA consultations.
Report Summery 9THE FOCUS ON FINANCIAL SUSTAINABILITY
HAS ACCELERATED INNOVATION IN
BUSINESS MODELS, AND NEW MODELS
CONTINUE TO EMERGE. VALUE CHAIN
SPECIALIZATION IS INCREASING AS
COMPANIES FOCUS ON CORE CAPABILITIES.
Two new shifts have emerged in business models: (1) companies moving “beyond energy” and (2) the rise
of next-generation off-grid utilities. Moving beyond energy, OGS companies are using data from PAYGo platforms
to understand customer creditworthiness and upselling additional products to customers, including small loans for
education, cash loans, micro-loans for small businesses, micro-insurance products, and partnerships to distribute
fast-moving consumer goods. Meanwhile, the next-generation off-grid utility offers an integrated suite of energy
products and services to off-grid or unreliable grid customers. These companies leverage their platforms to provide a
wide range of off- and on-grid energy products to customers, including PnP OGS lighting products, liquefied natural
gas solutions, small mini-grids, and on-grid solar battery backup installations.
We are also continuing to see the disintegration of vertically integrated business models in off-grid energy, as
companies solidify their niches and increase efficiency along the value chain. New partnerships and adaptations
are emerging at each link of the value chain (Figure 6) that allow companies to focus on their core businesses to
bolster profitability.
Figure 6: Overview of OGS Supplier Value Chain
Hardware Hardware Software Marketing & Consumer After-sales
manufacturing design development distribution financing support
Source: Vivid Economics and Open Capital Advisors.
Examples of key trends include the following:
• Hardware manufacturing and design. Manufacturers are increasingly seeking quality verification and
developing their own brands to potentially compete with well-established brands; these manufacturers
could provide lower-cost products for customers at consistently higher levels of quality.
• Software development. Software specialists are providing more customizability and open architectures that
lower the barriers to entry for PAYGo models while increasing the usability of PAYGo platforms to drive
effective business decisions.
10 Off Grid Solar Market: Trends Report 2020• Marketing and distribution. Large international companies are better leveraging data to optimize their sales
and distribution models, while more hardware companies are partnering with local distributors to reach
previously unserved markets.
• Consumer financing. PAYGo uptake is increasing, with continued innovation on payment terms, credit
processes, and enabling technology. Also, companies are finding new ways to partner directly with financial
institutions to decouple consumer finance from their business models.
• After-sales support. Remote monitoring is enabling companies to improve both customer service and asset
management, and companies are beginning to incorporate e-waste disposal considerations into their business
models or through partnerships with third-party providers.
COMPETITION REMAINS STRONG ACROSS
THE SECTOR IN TERMS OF BOTH PRICE AND
QUALITY, WITH HUNDREDS OF PRODUCT
CHOICES AVAILABLE IN THE MARKET.
While competition has historically been based on price, increased familiarity with OGS products among users
means quality is an increasingly important competitive attribute. The pico product segment has been largely
characterized by a “race to the bottom” on price, with solar lantern prices as low as US$ 3. As prices have begun
to stabilize, however, users are placing more weight on quality; with quality-verified products starting to replace
previous sales of cheaper, low-quality products. Among SHS products, price still drives competition in markets where
PnP SHS cash sales are common, with non-affiliate PnP systems competing with more expensive affiliate brands.
PnP SHS also often struggle to compete against component-based systems on price, a particularly acute challenge in
Asia due to the higher influx of cheap OGS components from China in this region. With the continued growth in sales
of PAYGo PnP systems, especially in East Africa, total product price is becoming less important as many consumers
focus primarily on down payment costs and companies increasingly differentiate themselves based on their PAYGo
terms and product bundles.
Affiliate manufacturers face increasing pressure from a large number of non-affiliate manufacturers, including
those seeking to enter the affiliate market through quality verification. While affiliate distributors rank quality as
the most important criterion when sourcing products from manufacturers, they are becoming more price-sensitive.
Some are considering moving to lower-priced, high-quality non-affiliate manufacturers, even if these manufacturers
do not become Lighting Global quality-verified. Yet some non-affiliate manufacturers are already planning to seek
Lighting Global quality verification, which could put downward pricing pressure on existing affiliate manufacturers,
unless they can demonstrate their products are worth a higher price.
Report Summery 1112 Off Grid Solar Market: Trends Report 2020
SECTOR CONSOLIDATION COULD
     FUNDAMENTALLY ALTER MARKET
     DYNAMICS BUT WILL LIKELY REMAIN
     OPPORTUNISTIC IN THE NEAR FUTURE.

The past two years marked the first signs of sector consolidation through ENGIE’s acquisitions of Simpa
Networks, Mobisol, and Fenix. Other strategic investors, particularly other energy conglomerates and multi-sectoral
Japanese conglomerates, have recently shown increased interest in the off-grid sector. Strategic acquisitions could
massively alter market dynamics, leading to consolidation and investment exits for early-stage investors. However,
mergers and acquisitions in the sector remain nascent; consolidation to date has been rare and opportunistic. For
consolidation to accelerate from opportunistic transactions into a broader trend, OGS companies would need to
demonstrate the increased maturity-in terms of profitability and scale-required to attract strategic investors.
Increased consolidation or competition could both provide significant benefits to the sector, but it is too early
to tell which market dynamic will predominate moving forward. Increased competition could drive down costs
and foster innovation in a sector where both are crucial to providing reliable energy to the un- and underserved, but the
high cost of launching OGS companies could limit new entrants to the market, particularly if early-stage equity remains
difficult to access. Conversely, if companies can demonstrate the scale and profitability required to attract strategic
investors, consolidation could create OGS companies with huge scale, supported by large amounts of capital, able to
aggregate sector expertise, and achieve significant economies of scale – which would drive down system costs and
accelerate energy access.

                                         THE GLOBAL POTENTIAL MARKET REMAINS
                                         SUBSTANTIAL, WITH 840 MILLION PEOPLE
                                         WITHOUT ELECTRICITY ACCESS GLOBALLY
                                         IN 2017 AND MORE THAN ONE BILLION
                                         USING AN UNRELIABLE GRID CONNECTION.18

Electrification - both through grid connections and off-grid solutions offering Tier 1 or higher access - has
improved rapidly from 83 percent of the global population in 2010 to 89 percent in 2017, with the most
significant progress in Central and South Asia.19 Since 2010, many countries have adopted electrification plans to
reach universal access by 2030, and these increasingly include off-grid aspects alongside grid and mini-grid solutions.
However, in most of the 20 countries with the largest energy-access deficits, the rate of electrification has not kept
pace with population growth, increasing the number of people in these countries without access to electricity. In
countries with unserved populations of more than 50 million people, such as the Democratic Republic of Congo,
Nigeria, and Pakistan, electricity access in terms of the percentage of the population with access expanded by less than
one percentage point each year between 2010 and 2017.

18 While the figure of 1.095 billion people with unreliable grid connections was estimated for this report, 840 million people without acccess was estimated by the
   International Energy Agency et al. Tracking SDG 7, 1–2.
19   International Energy Agency et al., Tracking SDG 7.

                                                                                                                                        Report Summery      13
The potential market for OGS products across Sub-Saharan Africa and Asia–Pacific - the regions with the largest
energy deficits as well as the focus of this report - consists of 716 million people without electricity access and
more than one billion people with an unreliable grid. Over the last two years, some countries in these regions have
continued to make strides towards universal electrification, most notably India, where almost 100 million people gained
new access between 2017 and 2019 (Figure 7). Despite this progress, global demand for OGS remains high across
households and microenterprises that currently do not have electricity access, and among people using an unreliable grid
connection, although the entire market cannot be addressed and reached through commercial business models. While
markets with major energy access deficits in Sub-Saharan Africa and the Asia–Pacific region account for the majority of
OGS sales to date, low-access countries such as Yemen in the Middle East, or Haiti in Latin America and the Caribbean,
provide additional market opportunities.
Figure 7: The Potential Market in Sub-Saharan Africa and Asia–Pacific Consists of 716 Million
People Without Electricity Access and More than 1 Billion with an Unreliable Grid
Total 1,095
potential
market
111
1000
840
- 23
800 -100 716 716
Excluding
-1.7
millions of people
regions with
high Excluding 43
electrification newly Updated
600 connected access data 85
levels
people in in other 832
India in countries in
2017-19 2017-19
400
588
200
153
0
People without People without Potential market - Potential market -
access globally in access in major people without people with
2017 energy access access unreliable grid
deficit markets in
2019
Sub-Saharan Africa
South Asia
South-East Asia and Pacific
Source: Vivid Economics and Open Capital Advisors analysis.
The vast majority (over 80 percent) of people without electricity access live in Sub-Saharan Africa (Figure 8).
Within this region, the countries with the largest populations without access in terms of absolute numbers are
Nigeria (89 million), the Democratic Republic of Congo (68 million), and Ethiopia (61 million). Smaller countries also
represent substantial opportunities, especially where populations without access are highly concentrated; in Burundi,
for example, the total population is just 11 million, but more than 90 percent of Burundians do not have access to
electricity. In South and South East Asia, even though grid electrification rates are high, sizeable populations still lack
access to electricity, and many in remote, hard-to-reach regions use OGS products as their primary source of electricity.
14 Off Grid Solar Market: Trends Report 2020Figure 8: Across Key Energy-Deficit Countries in Africa and Asia–Pacific, 716 Million People Do Not
Have Access to Electricity (Absolute Numbers)
Number of households without access (in millions)
Not Applicable
< 0.5
0.5 - 1.0
1.0 - 2.5
2.5 - 5.0
5.0 - 10.0
> 10.0
Source: Vivid Economics and Open Capital Advisors analysis of International Energy Agency et al., Tracking SDG 7.
Note: This report focuses on countries with access deficits in Sub-Saharan Africa and Asia–Pacific. Countries not shaded in this figure have high
access rates and high grid reliability and therefore offer less of a focus market for OGS suppliers.
Around 70 percent of the population without access in Sub-Saharan Africa and Asia–Pacific could afford
to pay the monthly installments for a Tier 1 multi-light product, so the current addressable market for this
product is 476 million people.20 The remaining 240 million people who cannot afford a Tier 1 OGS product are
mostly concentrated in Sub-Saharan Africa, which reflects the region’s lower ability to pay compared to Asia–Pacific.
The addressable market for a basic SHS (21–50 Wp) is smaller at 43 percent (310 million people) of the global target
population. While this affordability gap persists for quality-verified, Tier 1–enabling products and above, almost all
people in these markets can now afford an entry-level, single-light pico product.21
PAYGo and other business models offering consumer finance are bringing OGS products within reach to a
larger share of the population. While only 476 million people could afford a Tier 1 multi-light system if they were
to pay equal monthly installments of product cost throughout its lifetime, 670 million could afford the system by
saving the PAYGo deposit over three months and subsequently paying a lower amount per month. This leads to a 40
percent increase in the addressable market for this product.22 As ability to cover the deposit is often considered the
main barrier to affordability in practice, this demonstrates how PAYGo brings higher-capacity systems within reach to
a much higher share of the population.
Even when OGS products are affordable, they must compete against a range of alternatives. Competing
alternatives include connecting a grid connection (where available), mini-grids, battery-operated torches, (sometimes-
20 “Affordable” in this context means the OGS product costs less than 5 percent of total monthly expenditures. We compare this to the average cost of a high-end
pico product (multi-light and mobile charger system) of 3–11 Wp, which provides Tier 1 access to at least one person and offers Tier 1 access to a household at
the high end of the power range. We use the annualized cost of the system over its lifetime.
21 With non-affiliate products on the market costing as little as US$ 5 or less.
22 In this calculation, we assume that a PAYGo deposit is affordable when it is less than three months of savings at 5 percent of total monthly expenditure.
Report Summery 15subsidized) kerosene for basic lighting, and petrol- or diesel-powered generators.23 Willingness to pay for OGS depends
on the availability, reliability, convenience, and pricing of alternatives, but can also be influenced by marketing and
consumer-awareness campaigns. As a result, consumers may be willing to allocate larger amounts to products that
they see as highly desirable, especially if they offer services “beyond energy”, such as insurance, cash loans, and
other durable goods.
In addition to the ‘without-access’ market, the unreliable grid market is increasingly being tapped into by OGS
products, thereby providing a more reliable energy supply to households and microenterprises. Particularly in
rural areas, many people connected to the main electric grid receive less than 12 hours of supply per day, experience
voltage surges and low-voltage days that damage or limit their use of appliances, or both.24 A substantial part of this
unreliable grid market comprises small businesses, which often require larger-capacity OGS products.
The largest concentrations of people with unreliable grid connections are in South Asia and West Africa.25
In South Asia, while grid access rates have expanded rapidly, some 832 million people have an unreliable grid
connection (Figure 9). This translates to about 46 percent of all grid-connected people. In West Africa, the majority of
all grid-connected households in Guinea and Nigeria report not having electricity “half of the time.”26
While the total potential market as a result of unreliable grid exceeds one billion people, only a subset of
these people are realistic customers for OGS backup energy products. Although unreliable grid populations
are increasingly important markets for OGS products, market penetration remains relatively low against the large
number of people with unreliable grid connections. Countries for which data are available, supported by consultations
with industry stakeholders, suggest that OGS devices currently reach only 5 percent or less of unreliable-grid users,
even in markets where the grid is very weak.27 Nonetheless, anecdotal evidence and interviews with companies
show that unreliable grid populations are increasingly viewed as an important growth market for OGS companies,
particularly in South Asia. As a realistic benchmark of what could be reached in the coming five to 10 years, we
estimate one in four people with an unreliable grid connection may also buy an OGS product, which would bring the
market down from more than one billion to around 250 million people.28
23 In some countries, especially in South Asia, where kerosene subsidies are still in place, many people also continue to use kerosene lamps during outages or be-
cause they cannot afford electricity. Tara Laan et al., Policy Approaches for a Kerosene to Solar Subsidy Swap in India (Geneva: International Institute for Sustain-
able Development Global Subsidies Initiative, April 2019), https://www.iisd.org/library/india-kerosene-solar-swap. For a more geographically general discussion of
competition for off-grid solar from dirty fuels, see: Nicholas L. Lam et al., The Dirty Footprint of the Broken Grid: The Impacts of Fossil Fuel Back-up Generators
in Developing Countries (Washington, DC: International Finance Corporation, September 2019), https://www.ifc.org/wps/wcm/connect/industry_ext_content/
ifc_external_corporate_site/financial+institutions/resources/dirty-footprint-of-broken-grid; and Prabhakar Yadav, Anthony P. Heynen, and Debajit Palit, “Pay-As-You-
Go Financing: A Model for Viable and Widespread Deployment of Solar Home Systems in Rural India,” Energy for Sustainable Development 48 (February 2019):
139–53, https://doi.org/10.1016/j.esd.2018.12.005.
24 Abhishek Jain et al., Access to Clean Cooking Energy and Electricity: Survey of States 2018 (New Delhi: Council on Energy, Environment & Water, November
2018), https://www.ceew.in/publications/access-clean-cooking-energy-and-electricity; Vivek Sen and Saloni Sachdeva, “Post Saubhagya: Moving Beyond Con-
nections to Quality of Supply,” Shakti Sustainable Energy Foundation (blog), March 12, 2019, https://shaktifoundation.in/post-saubhagya-moving-beyond-connec-
tions-to-quality-of-supply/; Sreekumar Nhalur, Ann Josey, and Manabika Mandal, “Rural Electrification in India: Looking Beyond ‘Connections for All’ to ‘Power
for All,’” Economic and Political Weekly 53, no. 45 (November 17, 2018), http://www.prayaspune.org/peg/publications/item/399-rural-electrification-in-india-
from-connections-for-all-to-power-for-all.html; and Prayas (Energy Group), “Electricity Supply Monitoring Initiative (ESMI),” published March 2015, https://www.
prayaspune.org/peg/resources/electricity-supply-monitoring-initiative-esmi.html.
25 The share of unreliable grid connections is based on three sources, in order of robustness: (1) the data underlying ESMAP’s Beyond Connections reports,
available for seven countries; (2) the Afrobarometer Round 7 survey results; (3) and the World Bank Enterprise Surveys. The answer buckets for these surveys
were slightly different, but we only include the share of people who responded their grid was “unreliable” or “very unreliable,” which means we do not include
slightly unreliable connections in the potential unreliable grid market. ESMAP, Energy Access Diagnostic Reports Based on the Multi-Tier Framework (MTF):
Beyond Connections, https://www.esmap.org/node/56715; Afrobarometer, Merged Round 7 Data (34 Countries) (2019), https://www.afrobarometer.org/data/
merged-round-7-data-34-countries-2019; The World Bank, Enterprise Surveys: What Businesses Experience, https://www.enterprisesurveys.org/en/data.
26 Afrobarometer, Round 7 Data.
27 Based in part on data, available for seven countries, underlying ESMAP, Diagnostic Reports Based on the MTF.
28 Estimate based on the current reach of OGS products to grid connected customers from MTF survey data, and stakeholder consultations
16 Off Grid Solar Market: Trends Report 2020Figure 9: More than One Billion People Suffer From an Unreliable Grid Connection, Many of Whom
Are in South Asia and West Africa
Number of households with an unreliable grid connection (in millions)
Not Applicable
< 0.5
0.5 - 1.0
1.0 - 2.5
2.5 - 5.0
5.0 - 10.0
> 10.0
Source: Vivid Economics and Open Capital Advisors analysis of ESMAP, Diagnostic Reports Based on the MTF; Afrobarometer, Round 7 Data;
and The World Bank, Enterprise Surveys.
Notes: This report focuses on countries with access deficits in Sub-Saharan Africa and Asia–Pacific. Countries not shaded in this figure have
high access rates and high grid reliability and therefore offer less of a focus market for OGS suppliers.
The OGS market has evolved rapidly beyond lighting and consumptive energy services for households
and microenterprises, offering a range of PULSE applications. Demand for dual-use appliances (providing both
residential and productive use services), as well as demand for SWPs, cold storage solutions, and solar milling
solutions for smallholder farmers, is substantial and expected to grow.
• The potential SWP market exceeds 67 million smallholder farmers worldwide,29 and SWPs can help
relieve the strain on overstretched main grids. Sub-Saharan Africa is the largest potential market for SWPs,
with more than 43 million smallholder farmers currently without access to the main grid. In South Asia at least
22 million smallholders are not currently connected to the grid, with a further two million smallholders in
South East Asia without grid connections. In addition, governments are increasingly incentivizing uptake of
SWPs by grid-connected farmers, opening a large potential market. For example, the governments of India
and Bangladesh are supporting the deployment of SWPs to reduce the strain on over-stretched electricity
distribution grids.
• Solar-powered cold storage solutions also have large market potential, with 6.5 million smallholder farmers
in Sub-Saharan Africa alone active in sectors that would benefit from refrigeration.30 Six-and-a-half
million smallholder farmers working in the dairy and horticulture sectors in SSA have no access to the grid
and require cooling technologies, ranging from small cooling units for low volumes of dairy or horticultural
produce to large walk-in storage facilities serving multiple smallholders.31
29 This assumes that all smallholder farmers without electricity access are potential SWP customers. In reality, the demand for irrigation to improve productivity
varies by crop type, access to market, quality of seed, and other non-energy-related aspects. In addition, demand is influenced by farmers’ ability to pay and
SWPs’ affordability.
30 Lighting Global, ESMAP, and Dalberg Advisors, Market Opportunity for PULSE, 22.
31 Lighting Global, ESMAP, and Dalberg Advisors, Market Opportunity for PULSE.
Report Summery 17You can also read