COOK ISLANDS STRATEGIC ANALYSIS - Country Operations Business Plan 2016-2018 - Asian ...
←
→
Page content transcription
If your browser does not render page correctly, please read the page content below
COOK ISLANDS

Country Operations Business Plan 2016–2018

          STRATEGIC ANALYSIS

                 September 2015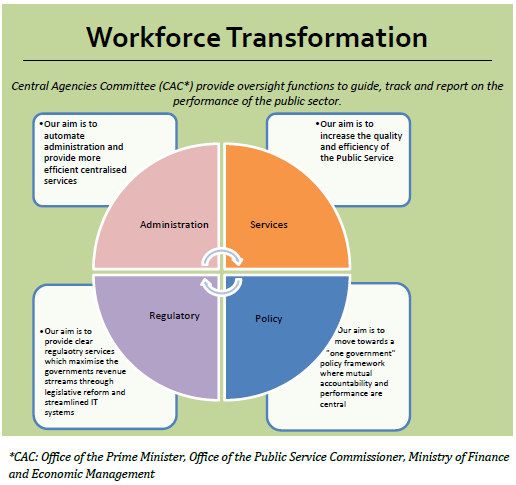
CONTENTS

I.    DEVELOPMENT TRENDS AND ISSUES
      A.         Country Background                                          1
      B.         Highlights of Previous Programming Approach                 3

II.   THE COUNTRY STRATEGIC PRIORITIES
      A.         Developing the ADB Country Strategic Priorities             4
      B.         Implementation Issues                                       6

APPENDICES TO LINKED DOCUMENT
1.    Data Tables                                                            7
      Table 1: Progress towards the Millennium Development Goals             7
      Table 2: Country Economic Indicators                                   11
      Table 3: Country Poverty and Social Indicators                         12
      Table 4: Country Environment Indicators                                13
      Table 5: Country Portfolio Indicators                                  14
              Table 5a: Portfolio Amounts and Ratings                        14
              Table 5b: Disbursements and Net Transfers of Resources         15
              Table 5c: Project Success Rates                                16
              Table 5d: Portfolio Implementation Status                      17
2.    Development Coordination                                               19
      Table 6: Development Coordination Matrix                               19
3.    Sector Assessments                                                     22
      (I)        Public Sector Management                                    22
      (II)       Private Sector Development                                  27
      (III)      Renewable Energy                                            33
      (IV)       Information and Communication Technology                    37
4.    Risk Assessment and Management Plan                                    39
5.    Country Cost-Sharing Arrangements and Eligible Expenditure Financing
      Parameters, 2016–2018                                                  41
ABBREVIATIONS
ADB Asian Development Bank
ADF Asian Development Fund
CITC Cook Islands Telecommunications Company
CPS Country Program Strategy
COLA Cost of Living Adjustment
DCD Development Coordination Division
DCO Development Coordinating Officer
DSA Debt Sustainability Analysis
EU European Union
FRR Fiscal Responsibility Ratios
GDP Gross Domestic Product
HIES Household Expenditure and Income survey
ICT Information, Communication and Technology
JFPR Japan Fund for Poverty Reduction
JNAP Joint National Action Plan for Disaster Risk Management and Climate
Change Adaptation
IMF International Monetary Fund
MDG Millennium Development Goal
MFEM Ministry of Finance and Economic Management
NESAF National Environmental Strategic Action Plan
NSDC National Sustainable Development Committee
NSDP National Strategic Development Plan
NZD New Zealand dollar
NZDP New Zealand Development Program
PFTAC Pacific Finance Technical Assistance Center
ODA Official Development Assistance
OPM Office of the Prime Minister
PCR Project Completion Report
PEFA Public Expenditure and Finance Analysis
PEM TA Pacific Economic Management Technical Assistance
PRC Peoples’ Republic of China
PSC Public Service Commission
PSDI Private Sector Development Institute
SOE State owned enterprise
TAU Te Aponga Uira
UNDP United Nations Development Program
USD Unites States dollarI. DEVELOPMENT TRENDS AND ISSUES
A. Country Background
1. The Cook Islands lie between the Kingdom of Tonga to the west, Kiribati to the North
and French Polynesia to the east and is surrounded by nearly two million square kilometers of
ocean. There are 15 islands in the Group with a total land area of 240 square kilometers. There
are two main groups: the north consisting of seven atolls and the south consisting of eight
volcanic islands. Cook Islands has a total population of 15,000 and most live on the largest
island Rarotonga. Many of the smaller islands are sparsely populated.
2. Through a constitutional arrangement, Cook Islanders are citizens of New Zealand, with
rights to live and work in New Zealand and Australia. This mobility impacts almost all the social
and economic sectors in the Cook Islands. Emigration is high, averaging 1.6 per cent of the
population annually during the past 18 years. The total labor force participation rate is over 70%
(2011).1 The reservation price of labor is linked to that in New Zealand. In addition, the level of
wellbeing is high. Per capita income of the Cook Islands is $23,000, the highest in the region.
With the direct and indirect support of New Zealand, the country enjoys high standards of health
care and education. Furthermore, with strong trade and travel links with New Zealand, the
country adopts the New Zealand Dollar (NZD) as its domestic currency avoiding the need to
protect the exchange rate. Net remittances are estimated to be negative. Standard and Poors
re-affirms Cook Islands Credit Rating at B+/B and stable.2
3. The Cook Islands is a small open economy largely dependent on tourism and
infrastructure development. Visitors to the Cook Islands increased to about 123,000 in FY2014,
up by 1.6% over FY2013, and are expected to stabilize in FY2015 and FY2016. Gross domestic
product (GDP) declined by 1.2% in FY2014, a slight improvement from 1.7% contraction in
FY2013. It is forecasted to grow by 2.1% in FY2015 and then contract by 0.3% in FY2016 as
large public investment projects end. Large capital expenditures continue to drive government’s
expansionary fiscal policies, with budget deficits seen to jump from the equivalent of 3.0% of
GDP in FY2014 to 7.3% of GDP in FY2015, before easing slightly to 7.1% in FY2016. Despite a
high GDP per capita (NZ$20,425 in FY2014), the lack of economic diversity, economies of
scale, and vulnerability to climatic conditions makes any progress fragile and reversible. Labor
market constraints also present major limitations on economic growth, an issue that is worsened
by continued depopulation, from 14,900 residents in 2006 to 13,500 in 2014.
4. The Cook Islands is one of the few nations in the Pacific that offers a wide range of
welfare support. In 2014, local pensions were increased by 25% and other welfare payments by
10%. Tax reforms were also introduced in 2014., including an increase in the tax free threshold
from NZ$10,000 to NZ$11,000; significant reduction in income tax rates aimed predominantly at
low income earners; and increasing the minimum wage by NZ$1 (20%) to NZ$6/hour.
5. The biggest long term strategic issue facing the Cook Islands is the reduction in
population, resembling an average annual rate of growth of –0.5 per cent, averaging about 322
people leaving year. The decline of the population is most noticeable in the Outer Islands where
the population was almost 14 per cent less in 2011 than in 2006.3 Continuous migration
constrains domestic growth by creating shortages of skilled workers. In the Cook Islands, this
gap is filled by migrant workers, largely in the services industry.
1
Government of the Cook Islands. Source
2
Standard and Poors Rating Service. February 2015.
3
Government of the Cook Islands. Source2
6. Infrastructure continues to be a major challenge. The current state of infrastructure
inhibits private sector investment particularly in tourism. With the assistance of development
partners, the government in recent years has raised the level of investment in urban
infrastructure, particularly port, water, and sanitation sectors. A new infrastructure master plan,
developed with assistance from the Pacific Region Infrastructure Facility, will assist in identifying
future projects and include considerations for maintenance and integration with the budget
process.
7. The Cook Islands depends heavily on imported fuels. The total fuel import bill of the
Cook Islands in 2012 was NZ$34.6 million or 25% of total imports and 9% of gross domestic
product. Diesel-powered generators constitute about 99% of the total electricity generating
capacity. Electricity costs are also among the highest in the Pacific. The reliance on imported
fuel is reflected in the high average electricity tariff charged, which was $0.63 per kilowatt-hour
in 2013. Such a high tariff translates into 4% of annual household expenditure and 15% of
annual business entity expenditure. Volatile diesel fuel prices and heavy reliance on imported
diesel fuel for power generation significantly affects the economy and living standards in the
Cook Islands.
8. Tourism is the mainstay of the Cook Island economy accounting for over 60% of GDP.4
The trade sector share of total GDP, which includes restaurants and accommodation, increased
from 34% in 2000 to 39% in 2012. Other important sectors contributing to the economy include
marine resources, agriculture and financial services. However, the short to medium term
prospect for substantive growth in these non-tourism sectors is limited. Environment
degradation and climate change are risks to the tourism sector. The establishment of marine
parks and a shark sanctuary are notable achievements. Support for the tourism industry through
the budget and donor assistance is sizeable estimated at around 18% of GDP. 5
9. Improving public sector productivity remains key to the ongoing economic success of the
Cook Islands. There are approximately 1,888 employees in the Cook Islands public sector,
representing around 27 per cent of the workforce. As a proportion of the population, this has
increased to around 16 per cent due mainly to the decline in population which has occurred over
the past decade. The Cook Islands acknowledges that any reduction in the numbers of public
service staff will not translate directly into growth in the private sector as it often assumed.
Government is focused on centralizing functions to reduce red tape and increase efficiency, as
well as pursuing private sector-led growth.
10. The country is well on track to achieving all eight MDG targets by end 2015. In addition,
the country has added its own MDG 9 of improving governance. While incidence of poverty is
not a perceived problem, a more appropriate measure is in terms of access to basic services,
opportunity to participate in socio-economic life, and adequate resources including cash for
basic needs. Income disparity is significant between the main island Rarotonga and the outer
islands.
11. Government debt levels are estimated to be 22.3% of GDP for FY2015 (NZ$86 million),
well below the government’s own threshold of 35% and the 40% of GDP that the IMF considers
a sustainable level of foreign debt for small developing countries. Rigorous debt maintenance
adds to the overall resilience of the country and ensures there is sufficient future capacity
4
The estimate of the contribution of tourism to the economy varies from 60% to 80%.
5
To grow the tourism sector via regular flight services, the government has been underwriting Air New Zealand
flights to Rarotonga, Cook Islands from Los Angeles and Sydney since 2007. The cost of underwriting the airline
has risen sharply in recent years to 11% of total budget expenditure. Government has signed a new agreement for
2014–2018 and is expecting an increase from 22,000 to 30,000 of visitors from Sydney annually.3 (around NZ$18 million of possible debt capacity) within the public sector to cope with external shocks, including fiscal deficits, exchange rate risk on external debt, and the importance of maintaining borrowing space to improve the country’s resilience to natural disasters. ADB’s loans account for 70% of Cook Island’s gross debt portfolio. Debt levels are a sensitive public issue following the events of the late 1990s where extreme public debt levels precipitated an ADB-facilitated debt re-write off and restructuring, enforced expenditure restraints, and public sector downsizing. The country must however avoid the repetition of the fiscal crisis of the late 1990s when debt rose to well over 100% of GDP. ADB, through assistance from the regional Pacific Economic Management TA, will be assisting government with a macroeconomic assessment in quarter 4, 2015. The outcome will help government determine its readiness to take on further debt. B. Highlights of Previous Programming Approach 12. ADB’s Country Partnership Strategy (CPS) 2008–2012 guided its partnership with the Cook Islands and was closely aligned with the aims of the Cook Islands National Sustainable Development Plan (NSDP), 2011-2015.6 Improved public infrastructure, sound public sector management, renewable energy, information communications and technology (ICT), private sector development, and institutional strengthening were ADB’s core areas of focus. 13. ADB has made satisfactory progress in developing infrastructure in the Cook Islands. The rehabilitation of the Avatiu wharf, a $24 million investment completed in 2013, has improved the efficiency and safety of the port infrastructure in Rarotonga.7 The Economic Recovery Support Program cluster loan of $16 million helped mitigate the impact of the global economic crisis. Combined, the two subprograms helped reduce the impact of projected revenue shortfalls and supported prioritized investments in infrastructure to help boost sustainable economic growth.8 In 2013, ADB explored information communications and technology (ICT) options for greater connectivity.9 Since 2010, a $900,000 regional grant-financed project, funded through the Japan Fund for Poverty Reduction, has been supporting the provision of social protection to the vulnerable. Project components include provision of care services to the elderly as well as reviewing social welfare system.10 In support of the Cook Islands Renewable Energy Chart Implementation Plan, ADB has been assisting government since 2011 to achieve their targeted 50% power generation from renewable energy sources by 2015, and 100% by 2020. 11 14. Through technical assistance, ADB has supported economic management, public sector management reforms (including a functional analysis of the public service and strengthening outer island administration, and support for good public financial management), energy efficiency, private sector development, infrastructure services delivery, and asset management. 6 Government of the Cook Islands. 2011. The Cook Islands National Sustainable Development Plan, 2011–2015. The development of the NSDP 2016–2020 is underway. 7 ADB. 2008. Avatiu Port Development Project. Manila; ADB 2015. Avatiu Port Development Project Completion Report. Manila. The project is rated successful. 8 ADB. 2009. Economic Recovery Support Program. Subprogram 1 was implemented in 2009 and subprogram 2 in 2012. The project completion report will be completed in Q4 2015. 9 In 2013, ADB supported a submarine cable feasibility study, estimated to cost $35 million. The launch of the O3b satellite service and Telecom Cook Islands 3G mobile service network in 2014 has improved broadband internet capacity in the country. For the longer term, the government has prioritized a submarine cable option in the Cook Islands National Infrastructure and Investment Plan. ADB will stay engaged with government to monitor the growth in demand for internet services following the O3b introduction 10 ADB. 2010. Social Protection of the Vulnerable in the Pacific. Manila. 11 ADB’s support to government’s efforts includes the ongoing Promoting Energy Efficiency in the Pacific (Phase 2) project and the Renewable Energy Project ($11.2 million OCR loan, with EU cofinancing of $7.3 million), approved in November 2014 and declared effective on 9 February 2015.
4
The country has also benefited from technical support from the Pacific Regional Infrastructure
Facility (PRIF) and the Private Sector Development Institute (PSDI).12
II. THE COUNTRY STRATEGIC PRIORITIES
A. Developing the ADB Country Strategic Priorities
15. The Cook Islands NSDP, 2011-2015, envisions the highest quality of life in harmony with
the country’s culture and environment for all Cook Islanders. The eight priority areas in the
NSDP are: (i) economic development; (ii) infrastructure; (iii) energy; (iv) social development; (v)
resilience; (vi) ecological sustainability; (vii) governance; and (viii) law and order. The progress
towards NSDP goals in energy, social development, resilience, ecological sustainability and law
and order has been evaluated by government as satisfactory while the targets that are lagging
behind are economic development, infrastructure, and governance. As the Cook Islands is not a
member of the International Monetary Fund and the World Bank Group, ADB plays a pivotal role
in helping government deliver the national objectives of the NSDP.
16. The ADB’s Interim Pacific Approach 2015, which extends the validity of ADB's Pacific
Approach 2010–2014, serves as the country partnership strategy for the Cook Islands, and aims
to achieve sustained, resilient, and improved living standards for all Pacific Developing Member
Countries.13 In light of the high standards of education and health care in the Cook Islands, the
demand for support in the key social sectors of health, education and direct poverty alleviation
are not strong. These sectors are also well catered for by bilateral development partners
especially New Zealand. Based on national priorities and comparative advantages of
development partners, targeted areas for ADB’s support include infrastructure development,
renewable energy and energy efficiency, ICT, public sector management, private sector
participation, and capacity development. These strategic priorities are in line with the Midterm
Review of Strategy 2020.14 The provision of well-focused technical assistance will remain an
integral part of the ADB support for the Cook Islands aimed at building capacity and
strengthening governance arrangements.
17. ADB’s operations in the Cook Islands are demand-driven, within areas of ADB’s
comparative strength, and capitalize on regional approaches and partnerships. The Cook
Islands is a Group C developing member country in ADB and has access to ordinary capital
resources. The indicative resources available during 2016–2018 for sovereign operations
amount to $9.40 million. Additional resources and co-financing can be sourced to meet national
needs.15
18. ADB’s short to medium term support will focus on (i) enabling the government to
continue improving the effectiveness of the public sector, (ii) supporting private sector-led
economic growth, (iii) supporting government’s commitment to renewable energy, and (iv)
escalating the efficiency of the ICT sector.
19. Public Sector Management: The Cook Islands Public Sector Strengthening Strategy is
focusing on building a “Public Service of Excellence” over the medium term (2015-2020)
12
In 2014, PRIF commenced preparation of a medium-term National Infrastructure and Investment Plan (NIIP)
including both economic and social infrastructure. The plan was finalized in March 2015.
13
ADB. 2015. Interim Pacific Approach, 2015. Manila; ADB. 2009. Pacific Approach, 2010–2014. Manila;
14
ADB. 2014. Midterm Review of Strategy 2020: Meeting the Challenges of a Transforming Asia and Pacific. Manila.
15
Since joining ADB in 1976, 19 loans for $76.90 million, 2 grants for $8.06 million, and 34 technical assistance
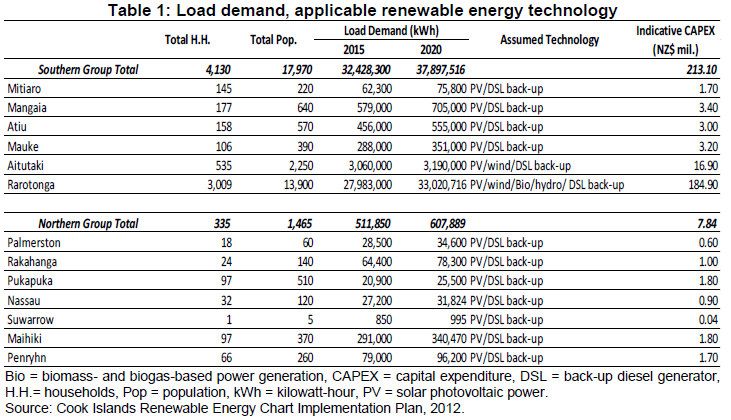
projects for $12.12 million have been provided to the Cook Islands.5 through a positive shift towards “One Government” led by the Central Agencies Committee.16 Public sector reforms require deepening to raise performances and productivity, with value in revisiting recommendations from the 2011 ADB supported functional review.17 Additionally, the Cook Islands state-owned enterprise portfolio continues to generate a return on equity that is considerably below the cost of capital with a need to also strengthen the policy and legislative framework for SOEs. Support from development partners such as IMF’s Pacific Financial Technical Assistance Centre and ADB is also needed to help government implement government’s public financial management roadmap, based on the 2011 public expenditure and financial accountability assessment.18 Refer to Appendix 3 (I). 20. Private Sector Development. Government is committed to pursuing sustainable development through private sector-led growth. ADB’s Private Sector Development Initiative (PSDI) recently undertook a Private Sector Assessment with recommendations to government. Government has engaged PSDI assistance to help improve the business entry process, including a review of the Companies Act to bring it fully in line with modern companies legislation; develop an electronic registry allowing online filing and external searches via the internet; develop a coherent and appropriate regulatory framework for telecommunications to create a more competitive telecommunications industry including a telecom policy; and strengthen the commercial operation of the government-owned Bank of Cook Islands so businesses will get the finance they need and reduce risks to the financial system and to the government budget. Refer to Appendix 3 (II). 21. Energy: The government is committed to increasing the contribution of renewable energy to 50% of the total demand in the Cook Islands by 2015 and 100% by 2020. Government has established the Cook Islands Renewable Energy Chart Implementation Plan (CIRECIP) 2012-2020, which sets a target of supplying electricity from renewable energy on all inhabited islands by 2020, estimated to cost NZ$260 million depending on the technology that will be selected and the upgrading that will be required to the existing infrastructure.19 Given the size and scope of the project, development partner coordination is necessary for effective implementation. ADB, New Zealand, and the European Commission are coordinating closely to support implementation of the CIRECIP. New Zealand started solar photovoltaic power system development on the Northern group islands in 2012 and on Rarotonga in 2014. ADB’s renewable energy project, declared effective on 9 February 2015, will construct new solar photovoltaic power plants on up to six islands of the Southern Group and provide institutional strengthening support to implement the CIRECIP.20 ADB is seeking an additional $4.12 million from the Global Environment Facility as a potential grant contribution to the Renewable Energy Sector Project. Refer to Appendix 3 (III) 22. ICT: The launch of the O3b satellite service and Telecom Cook Islands 3G mobile service network in 2014 has improved broadband internet capacity in the country. Following a feasibility study supported by ADB in 2013, the government has prioritized a submarine cable option in the Cook Islands National Infrastructure and Investment Plan to meet the expected 16 Office of the Prime Minister, Office of the Public Service Commissioner, Ministry of Finance and Economic Management 17 ADB. 2011. Implementing Public Sector Reforms. Manila 18 ADB’s Pacific Economic Management (PEM) Phase 2 is assisting government proactively manage their fiscal risks, provide macroeconomic and fiscal policy advice, and build capacity in the development of fiscal analytic skills and tools. 19 The Government of the Cook Islands. 2012. The Cook Islands Renewable Energy Chart Implementation Plan, Avarua, Rarotonga. 20 ADB. 2014. Report and Recommendation of the President to the Board of Directors: Proposed Loan and Administration of Grant to the Cook Islands for the Renewable Energy Sector Project. Manila.
6

growth in demand for high quality internet services.21 Should this project develop, the
government will be looking at both sovereign and nonsovereign financing. PARD’s ICT team
and the Private Sector Operations Department (PSOD) will stay engaged with government to
monitor the growth in demand and assess whether the demand level will justify the introduction
of a cable system in 2019. Refer to Appendix 3 (IV).

B.         Implementation Issues

23.     Capacity: Limited technical capacity remains the overriding concern of any project
design and project implementation. The retention of administrative skills is also a challenge as
young people move on to New Zealand and Australia. Consideration will have to be given to
outsourcing these skills wherever necessary. Capacity building both at technical and
management levels will continue to be the top priority of government and development partners.
ADB will continue to provide assistance to enhance local capacity in design and implementation
of investment projects, policy formulation, and advisory support.

21
     ADB. 2013. Report on the Feasibility of an International Submarine Cable System for the Cook Islands. Manila;
     Government of the Cook Islands. 2015. Cook Islands National Infrastructure Investment Plan. Rarotonga. This
     plan, which included both economic and social infrastructure, was developed with support from the Pacific Region
     Infrastructure Facility.
7 Appendix 1
Table 1: Progress towards the Millennium Development Goals
Goals and Target Country Status
Goal 1: Eradicate extreme poverty and hunger On Track
Target 1.A: Halve, between 1990 and 2015, the proportion of Poverty as defined in the MDG is absent in the Cook Islands
people whose income is less than $1 a day (CI). Poverty is better measured in terms of access to basic
services, opportunity to participate in socio-economic life, and
adequate resource including cash for basic needs. GDP per
capita is approximately NZ$$27,000, the highest amongst the
PDMCs. Access to job markets in New Zealand and welfare
systems are available. Public services are generally good. The
issue is more over inequality of income between the main island
Rarotonga and the outer islands. The average income of people
in Rarotonga (NZ$15,700) was more than double of that in the
Southern (NZ$7,200) and Northern group islands (NZ$7,800).
Target 1.B: Achieve full and productive employment and The labour participation rate is high at 75% of working age
decent work for all, including women and young people population in both the formal and informal sectors. The
emigration of skilled workers to New Zealand is a major
concern for the Cook Islands. This has led to decline in
population and an increase in foreign workers.
Target 1.C: Halve, between 1990 and 2015, the proportion of Hunger is also not an issue for the CI. However, obesity,
people who suffer from hunger. including among children, has emerged as a serious issue for
the Cook Islands. The Ministry of Health will collect data on the
weight of children to better target its obesity prevention
programmes.
Goal 2: Achieve universal primary education On Track
Target 2.A: Ensure that, by 2015, children everywhere, boys Education in the Cook Islands continues to be compulsory and
and girls alike, will be able to complete a full course of free for children from 4–16 years of age. Cook Islands also has
primary schooling a high literacy rate. The decline in the survival rate to the last
grade in primary education was a result of outmigration and not
as a result of drop-outs. Raising the quality of education,
beyond access, is the major focus for the CI. This is evident
from the 2011–2015 National Sustainable Development Plan,
which focuses on education-quality based M&E indicators.
Several initiatives ensure quality primary education, including
rigorous numeracy/literacy programmes and significant
resourcing of school libraries. Also, the Inclusive Education
Policy aims to ensure that children with particular learning and
physical needs are in school, and, where practicable,
mainstreamed into classrooms. The Education Master Plan
identifies pre and post school education as priorities. The CI
pays child allowance for each child below 16 years of age.
Goal 3: Promote gender equality and empower women On Track
Target 3.A: Eliminate gender disparity in primary and Cook Islands has achieved gender parity in primary and
secondary education, preferably by 2005, and in all levels of secondary education. While the latest data for the gender parity
education no later than 2015 index in tertiary education is not available, based on historical
data and current trends, it is also likely that Cook Islands has
also achieved gender parity in tertiary education.
The number of women employed in the non-agricultural sector
has increased steadily since 1990 from 38% in 1991 to 55% in
2006.
Although participation of women in the labour force is not an
issue, there are concerns over pay disparities. Representation
of women in parliament is low, as women face a number of8 Appendix 1
challenges from entering politics, including lack of time and
financial resources, weak social capital and deep-rooted beliefs
that politics are the domain of men.
The Government of the Cook Islands has had a national gender
policy in place since 1995 and recently updated its national
policy, with the inclusion of a Strategic Plan of Action (2011-
2016). The current national policy and strategic action plan
effectively identifies and addresses areas to improve gender
equality and empowerment
Goal 4: Reduce child mortality On Track
Target 4.A: Reduce by two thirds, between 1990 and 2015, The average annual number of live births in the CI is around
the under-five mortality rate 300. This means that the statistical impact of even one death on
the U5M and IM rates, per 1,000 live births, has a profound and
misleading effect. Therefore, the global MDG target of a two-
thirds reduction of the U5M rate from 1990 to 2015 is not
relevant in the context of the CI due to the small size of the
population. Also as a result of population dynamics, data is
better assessed over a multi-year period rather than a single
year. The CI national target is to maintain a low U5M rate. Both
the U5M and IM rates have declined in the review period,
consistent with the increase in the measles immunisation over
the period 2001–2008, by 14%.
Child mortality rates are also significantly low compared to
international standards. Public health care for children up to 16
years of age is free. The major challenge for the Cook Islands is
to provide quality health services to the outer islands amid
depopulation and geographical constraints.
Goal 5: Improve maternal health On Track
Target 5.A: Reduce by three quarters, between 1990 and The global MDG target of a three-quarters reduction of the
2015, the maternal mortality ratio MMR is not relevant in the context of the Cook Islands due to
the small size of the population. Maternal deaths are a rare
occurrence. Between 1990 and 2010, there were only 2
maternal deaths, recorded in 1992 and 1995. Skilled birth
attendance is 100%.
Target 5.B: Achieve, by 2015, universal access to CI has the highest contraceptive prevalence rate (CPR) among
reproductive health the PDMCs. Teenage pregnancies are on the decline and are
comparatively low, while there is 100 % antenatal coverage.
Goal 6: Combat HIV/AIDS, malaria, and other diseases On Track
Target 6.A: Have halted by 2015, and begun to reverse, the There have been no officially recorded cases of HIV/AIDS in the
spread of HIV/AIDS Cook Islands. However, there is a high prevalence of STIs, and
coupled with the low condom use, mobility of residents and high
number of tourists, the spread of HIV/AIDS is still a risk
Target 6.B: Achieve, by 2010, universal access to treatment Not applicable
for HIV/AIDS for all those who need it
Not applicable. Also, there have been no tuberculosis
Target 6.C: Have halted by 2015, and begun to reverse, the incidences since 2001.
incidence of malaria and other major diseases
Goal 7: Ensure environmental sustainability On Track
Target 7.A: Integrate the principles of sustainable Ecological sustainability is one of the eight priority areas listed
development into country policies and programs and reverse in the 2011-2015 National Sustainable Development Plan. In
the loss of environmental resources 2011, CI adopted a Renewable Energy Chart, targeting 50 %
power generation from renewable energy by 2015, and 100 %
by 2020.Appendix 1 9
Target 7.B: Reduce biodiversity loss, achieving, by 2010, a Forest cover is high and remains at sustainable levels. CO2
significant reduction in the rate of loss emissions have increased, largely driven by increased fuel
consumption. In 2011, strategies developed to reduce the
nation’s reliance on fossil fuels which will contribute to a
reduction in CO2 emissions, although the current level remains
lower than those of developed countries. Since 2000, Cook
Islands recorded zero consumption of ODS. Traditional
protection methods continue. There are currently 39 protected
natural areas.
Target 7.C: Halve, by 2015, the proportion of people without 95%(2001) proportion of population using an improved drinking
sustainable access to safe drinking water and basic water source an 80% (2001) using improved sanitation facility.
sanitation
Target 7.D: By 2020, achieve a significant improvement in There are no slum dwellers in the Cook Islands.
the lives of at least 100 million slum dwellers
Goal 8: Develop a global partnership for development On Target
Target 8.A: Develop further an open, rule-based, predictable, The Cook Islands projected nominal GDP for 2011/2012 was
non-discriminatory trading and financial system NZD$369.8 million. Total ODA was NZD$19.7 million which
Target 8.B: Address the special needs of the least accounts for 5.3% of nominal GDP. Total budget expenditure
developed countries was 28% of nominal GDP. New Zealand and Australia through
Target 8.C: Address the special needs of landlocked their harmonized aid program continues to be the Cook Islands
developing countries and small island developing states biggest donor with a combined allocation of NZD$17 million. In
(through the Program of Action for the Sustainable the 2013/2014 fiscal year, total contributions by donor partners
Development of Small Island Developing States and the are budgeted at $20 million.
outcome of the twenty-second special session of the
General Assembly) CI has achieved 100% coverage of essential supplies and
Target 8.D: Deal comprehensively with the debt problems of medicines to all health clinics, and hospitals
developing countries through national and international
measures in order to make debt sustainable in the long term Cellular usage has increased from 24.4% in 2001 to 35.7% in
Target 8.E: In cooperation with pharmaceutical companies, 2008. Currently cellular services are available only on
provide access to affordable essential drugs in developing Rarotonga and Aitutaki. There are however plans to expand the
countries service to other islands.
Target 8.F: In cooperation with the private sector, make
available the benefits of new technologies, especially Internet usage has increased significantly over the period 2001
information and communications to 2008, from 10.8% to 32.1%. This is due to the growing
reliance on the internet, the improvement of service including
the availability of broadband in the outer islands, and the
reduction of costs. The CI telecommunications company is
switching to a new low obit satellite platform that will increase
bandwidth and improve internet access throughout the Islands.
Goal 9: Improved Governance On Target
Implement half of the political reform recommendations by No further progress has been achieved in terms of
2010 fulfilling any further recommendations with the exception of an
amendment to the Electoral Act 2004 to stop party hopping by
members of parliament
Timely Financial Reports; Reporting procedures in place for Improvements in budget preparation and oversight. The Office
M&E sector performance; Annual report of governments of the Public Service Commissioner receives six monthly and
based expenditures publicly available annual reports from government agencies. Ministry income and
expenditure accounts are published by the Ministry of Economic
Management and Finance both in hard copy and on the Ministry
website.
Complete devolution process with full administration Key functions such as education, health that were devolved to
devolved to outer islands by 2010 local government and island administration offices have since
been restored to central ministries.
Regular review of private sector performance at all levels Setup of a Commerce Commission is yet to be finalized. Fair10 Appendix 1
Trading and Consumer Guarantees Acts were passed by
Parliament in 2008, however the lack of resources and capacity
to enforce these legislations is a challenge.
Code of conduct adopted for MPs, cabinet and all public Incorporated within the Public Service Act 2009, is a Code
servants and implemented under the Public Service Conduct for all Public Servants. The Manual of Cabinet
Commission Act Procedures 2009 outlines the conduct expected of Cabinet
Ministers. There remains no Code of Conduct for
Parliamentarians.
Full and independent review of the operations and Since the passing of the 2009 Public Service Act, the Office of
performance of the whole Cook Islands public service and the Public Service Commissioner (OPSC) began efforts to
the recommendations for improvement by 2008. strengthen the Office and the systems and processes that
govern the public sector including conducting functional reviews
and developing standardized operations systems and
processes.
Sources: Cook Islands National Millennium Development Goals Report 2010; Regional MDGs Tracking Report 2013,
Pacific Islands Forum SecretariatAppendix 1 11
Table 2: Country Economic Indicators
Amounts in NZD
a
Indicator 2012 2013 2014
Total GDP (billion current $) 0.3 0.3 0.3
GDP per capita (current $) 21,507.5 23,538.9 20,319.6
GDP per capita, PPP (current international dollars) --- --- ---
GNI per capita, Atlas method (current $) --- --- ---
GNI growth (%) --- --- ---
GDP growth (%) 4.4 3.2 -1.2
b
Revenue (% of GDP) 40.5 39.8 32.6
Expenditure (% of GDP) 42.6 41.8 36.8
b
Fiscal balance (% of GDP) -2.1 -2.0 -3.0
Money Supply (M3) growth (%) --- --- ---
Inflation (annual average, %) 2.8 2.8 1.6
Unemployment (% of labor force) --- --- ---
Merchandise exports (% of GDP) 1.0 --- ---
Merchandise imports (% of GDP) -37.4 --- ---
Merchandise trade balance (% of GDP) -42.7 -42.1 -42.1
c
Current account balance (% of GDP) --- --- 26.6
Remittances (% of GDP) --- --- ---
Foreign direct investment (% of GDP) --- --- ---
Merchandise export growth (%) -24.4 --- ---
Merchandise import growth (%) 7.4 --- ---
Total external debt (% of GDP) 21.8 24.0 20.0
Total external debt service (% of exports & services) --- --- ---
Gross international reserves (in months of imports) --- --- ---
Average exchange rate (New Zealand dollar/US dollar) 1.2 1.2 1.2
a
Preliminary.
Sources: ADB. Asian Development Outlook database; Pacific Economic Monitor 2014;
Projections (2014–2015)
Indicator 2014 2015
GDP growth (%) 2.2 2.5
Inflation (average, %) 1.9 2.5
Current account balance (% of GDP) --- ---
Sources: ADB. Asian Development Outlook database; Pacific Economic Monitor 2014.12 Appendix 1
Table 3: Country Poverty and Social Indicators
Item Baseline Midpoint Latest Year
A. Population Indicators
Total Population … … 17,794(2011)
Resident Population … … 14,974(2011)
Male … … 7,490(2011)
Female … … 7,484(2011)
Population Density (No. of people, km2) ... … 63(2011)
Rarotonga … … 195(2011)
Urban Population-Rarotonga … 13,095(2011)
B. Social Indicators
Life Expectancy at birth 70(1990) 72(2000) 77(2011)
Under 5 mortality (per 1,000 live births) … 26.1(1996-02) 7.0(2008-10)
Infant mortality (per 1,000 live births) 16.1(1990-94) 13.9(1998-02) 10.8(2006-10)
Maternal mortality (per 100,000 live births) 39.2(1900-94) 0.0(1998-02) 0.0(2006-10)
Skilled birth attendance (%) 70.0(1988) 98.0(2001) 100.0(2008)
Net enrolment ratio in primary education (%) … 92.0(2001) 98.0(2011e)
Literacy rates of 15-24 years old (%) … 99.0(2001) 99.0(2009e)
Gender Parity index in primary education 98.0(1990) 89.0(2003) 102.0(2011)
Gender Parity index in secondary education 112.0(1990) 94.0(2003) 116.0(2011)
Gender Parity index in tertiary education 86.0(1990) 100.0(2003) …
Women in the non-agricultural sector (%) 38.0(1991) 46.0(2001) 55.0(2006)
Seats held by women in parliament (%) 6.0(1991) 8.0(2001) 4.2(2011)
Contraceptive prevalence rate (%) … 47.2(2001) 46.1(2005)
HIV prevalence of 15-24 years old 0.0(1991) 0..0(2001) …
C. Poverty Indicators
Basic Needs Poverty (%) … … 28.4(2006)
Poverty Gap Ration (%) … … 8.5(2006)
Poorest quintile in national consumption … … 9.0(2006)
Employment to population ratio (%) … … 62.9(2008)
Employed living below $1 (PPP) per day (%) … … N/A
Food Poverty (%) … … 2.0(2006)
Labour force participation rate … 69.0(2001) 70.2(2006)
Rarotonga … 76.1(2001) 76.2(2006)
Southern Group … 53.8(2001) 56.7(2006)
Northern Group … 60.1(2001) 59.5(2006)
Unemployment rate … 13.1(2001) 8.9(2006)
Rarotonga … 6.7(2001) 5.9(2006)
Southern Group … 26.8(2001) 16.5(2006)
Northern Group … 34.6(2001) 24.3(2006)
…
… = data not available, GDP = gross domestic product.
Sources: Cook Islands National Millennium Development Goals Report 2010; Regional MDGs Tracking Report 2013,
Pacific Islands Forum Secretariat; WHO http://apps.who.intAppendix 1 13
Table 4: Country Environment Indicators
Indicator Baseline Latest Year
A. Energy Efficiency of Emissions
CO2 emissions, total (‘000 metric tons) 22.0(1990) 70.0(2010)
CO2 emissions, per capita (metric tons) 1.2(1990) 3.6(2008)
Use of ODS (ODP metric tons) 0.1(1991) 0.0(2009)
B. Water Pollution: Water and Sanitation
Population using improved drinking water sources (%) 100(1990) 100(2011)
Rarotonga 99(1990) 98(2010)
Outer Islands 97(1990) …
Population using improved sanitation facilities (%) 100(1990) 95(2011)
Rarotonga 100(1990) 100(2010)
Outer Islands 91(1990) 100(2010)
C. Land Use and Deforestation
Forest area (% of total land area) 62.5(1990) 66.7(2010)
2
Average annual deforestation (km ) … …
Average annual deforestation (% change) … ...
Arable land (% of total land) … …
Permanent cropland (% of total land) … …
D. Biodiversity and Protected Areas
Terrestrial and Marine protected areas (%) 0.0(1990) 0.1(2010)
Mammals (number of threatened species) … …
Birds (number of threatened species) … …
Higher plants (number of threatened species) … …
Reptiles (number of threatened species) … …
Amphibians (number of threatened species) … …
E. Urban Areas
Urban population living in slums (%) 0.0(2001) 0.0(2008)
Wastewater treated (%)
Solid waste generated per capita (kg/day)
… = data not available
Sources: Cook Islands National Millennium Development Goals Report 2010; Regional MDGs Tracking Report 2013,
Pacific Islands Forum Secretariat; WHO http://apps.who.intTable 5: Country and Portfolio Indicators
Table 5a: Portfolio Amounts and Ratings (Sovereign projects, as of 31 December 2014)
PCR
Net Loan Amount Total
Sector Loan No. Title $
% No. % Rating Circulation No
million
Multisector 461 Multiproject Loan 1.000 2.7% 1 7.1% Not Rated 1987 102–87
Finance 567 Cook Islands Development Bank Project 1.500 4.0% 1 7.1% Not Rated 1989 273–89
Partially
Multisector 849 Second Multiproject 2.801 7.4% 1 7.1% 1996 190–96
Successful
Generally
Transport & ICT 1031 0uter Islands Telecommunications Project 5.034 13.4% 1 7.1% 1995 94–95
Successful
Second Cook Islands Development Bank Generally
Finance 1155 1.333 3.5% 1 7.1% 1997 115–97
Project Successful
Emergency Telecommunications
Transport & ICT 1171 0.404 1.1% 1 7.1% Not Rated 1993 275–93
Rehabilitation
Agriculture &
Natural 1309 Pearl Industry Development Project 0.481 1.3% 1 7.1% Unsatisfactory 1999 337–99
Resources
Education 1317 Education Development Project 2.529 6.7% 1 7.1% Successful 2001 209–01
Third Cook Islands Development Bank
Finance 1380 2.104 5.6% 1 7.1% Successful 2003 265–03
Project
Public Sector Generally
1466 Economic Restructuring Program 4.831 12.8% 1 7.1% 1999 3–99
Management Successful
Generally
Multisector 1588 Cyclone Emergency Rehabilitation Project 0.636 1.7% 1 7.1% 2000 211–00
Successful
Water & Other
Municipal Infra. & 1832 Waste Management Project 2.456 6.5% 1 7.1% Successful 2005 353–05
Svcs
Multisector 2174 Cyclone Emergency Assistance 2.498 6.6% 1 7.1% Successful 2010 187–10
Economic Recovery Support Program-
Multisector 2565 10.000 26.6% 1 7.1% - - -
Subprogram 1
TOTAL 37.607 100.0% 14 100.0%
Appendix 1
14Appendix 1 15
Table 5b: Disbursements and Net Transfers of Resources
(Sovereign loans, as of 31 December 2014)
Disbursements and Transfers OCR ADF Total
Disbursements
a
Total funds available for withdrawal ($ million) - - -
Disbursement amount ($ million, cumulative) 28.86 34.65 63.51
Percentage disbursed (disbursed amount/total available)
Disbursements ($ million, for the year ended 31Dec2014) 0.03 0.25 0.28
b
Disbursement ratio 11.05 96.93 55.70
Net Transfer of Resources
2010 9.98 (0.41) 9.57
2011 5.53 2.39 7.92
2012 7.07 0.87 7.94
2013 4.87 (0.60) 4.27
2014 (2.10) (0.95) (3.05)
ADF = Asian Development Fund, OCR = Ordinary Capital
Resources
a
Undisbursed balance as of 31 December 2014.
b
Ratio of total ADB Sovereign loan disbursements in a given year (or period) to its undisbursed balance
at the beginning of the year (or period). The undisbursed balance as the denominator includes 1)
undisbursed balance of effective loans, and 2) undisbursed balance of loans that were approved but not
yet effective as at the beginning of the year.16
Appendix 1
Table 5c: Project Success Rates
(1996–2014)
Source
Approval of PCR PVR PPER
Project name Sector Latest rating
date Latest year year Year
rating
Cyclone Emergency 30-Jun-05 Multisector PVR Successful 2010 2010
Water and Other
Municipal
2005
Infrastructure and
Waste Management Project 17-Jul-01 Services PCR Successful
Third Cook Islands Development Bank 26-Sep-95 Finance PCR Successful 2003
Education Development Project 22-Sep-94 Education PPER Successful 2001 2004
Generally
2000
Cyclone Emergency Rehabilitation Project 08-Dec-97 Multisector PCR successful
Agriculture and
1999
Pearl Industry Development Project 30-Aug-94 Natural Resources PCR Unsuccessful
Public Sector
1999
Economic Restructuring Program 26-Sep-96 Management PPER Successful 2002
Less than
1997
Second Cook Islands Development Bank 14-Jan-92 Finance PPER successful 1998
Less than
1996
Second Multiproject 27-Oct-87 Multisector PCR successful
Generally
1995
Outer Islands Telecommunications Project 20-Sep-90 Transport and ICT PCR successful
Less than
1989
Cook Islands Development Bank Project 25-Mar-82 Finance PPER successful 1990
Source: IEDTable 5d: Portfolio Implementation Status
(Sovereign loans, as of 31 December 2014)
I. Active Loans
Cumulative
Net Loan Amount Approval Effectivity
Sector Loan No. Fund Title Disbursement Closing Date
($m) Date Date
($m)
OCR ADF OCR ADF Original Revised Actual
Avatiu Port
Transport & ICT 2472 OCR 8.420 - 8.420 - 20-Nov-08 10-Sep-09 31-Dec-12 31-Dec-13 14-Apr-14
Development Project
Avatiu Port
Transport & ICT 2473 ADF - 7.037 - 6.784 20-Nov-08 10-Sep-09 31-Dec-12 31-Dec-13 14-Apr-14
Development Project
Avatiu Port
Transport & ICT 2739 OCR 4.455 - 4.428 - 24-Mar-11 22-May-12 31-Dec-12 31-Dec-13 14-Apr-14
Development Project
Economic Recovery
Multisector 2946 OCR Support Program- 5.983 - 5.983 - 22-Nov-12 22-Oct-13 31-Dec-12 31-Dec-13 24-Jan-14
Subprogram 2
Renewable Energy- Renewable Energy
3193 OCR 9.722 - 21-Nov-14 09-Feb-15 31-Dec-17
Solar Sector
Total 28.580 7.037 18.831 6.784
Appendix 1
1718
Appendix 1
II. Closed Loans
Cumulative
Loan Net Loan Amount
Sector Fund Title Disbursement Approval Effectivity Closing Date
No. ($m)
($m) Date Date
OCR ADF OCR ADF Original Revised Actual
Multisector 461 ADF Multiproject Loan - 1.000 - 1.000 21-Aug-80 6-Nov-80 3-Jun-83 31-Dec-83 8-Dec-83
Finance 567 ADF Cook Islands Development - 1.500 - 1.500 25-Mar-82 24-Nov-82 23-Nov-85 31-Dec-87 8-Jan-88
Bank Project
Multisector 849 ADF Second Multiproject - 2.801 - 2.801 27-Oct-87 11-Mar-88 30-Jun-91 30-Jun-94 29-Sep-95
Transport & ICT 1031 ADF Outer Islands - 5.034 - 5.034 20-Sep-90 23-Jan-91 30-Sep-93 30-Sep-94 28-Sep-94
Telecommunications
Project
Finance 1155 ADF Second Cook Islands - 1.333 - 1.333 14-Jan-92 25-Jun-92 25-Jun-96 25-Jun-96 2-Oct-95
Development Bank Project
Transport & ICT 1171 ADF Emergency - 0.404 - 0.404 16-Jul-92 3-Aug-92 31-Dec-92 30-Jun-93 21-Jul-93
Telecommunications
Rehabilitation
Agriculture & 1309 ADF Pearl Industry Development - 0.481 - 0.481 30-Aug-94 19-Dec-94 30-Apr-98 31-Dec-98 12-Jul-99
Natural Resources Project
Education 1317 ADF Education Development - 2.529 - 2.529 22-Sep-94 28-Feb-95 31-Jul-00 31-Oct-00 18-Dec-00
Project
Finance 1380 ADF Third Cook Islands - 2.104 - 2.104 26-Sep-95 22-Jan-96 22-Jan-00 31-Dec-01 19-Feb-02
Development Bank Project
Public Sector 1466 ADF Economic Restructuring - 4.831 - 4.831 26-Sep-96 26-Sep-96 31-Dec-97 31-Dec-97 18-Mar-98
Management Program
Multisector 1588 ADF Cyclone Emergency - 0.636 - 0.636 8-Dec-97 6-Jan-98 30-Jun-99 30-Jun-99 16-Jun-00
Rehabilitation Project
Water & Other 1832 ADF Waste Management Project - 2.456 - 2.456 17-Jul-01 25-Oct-01 28-Feb-04 28-Feb-05 20-Sep-05
Municipal Infra. &
Svcs
Multisector 2174 ADF Cyclone Emergency - 2.498 - 2.498 30-Jun-05 14-Jul-05 31-Oct-07 30-Jun-09 13-May-10
Assistance
Multisector 2565 OCR Economic Recovery 10.000 - 10.000 - 13-Oct-09 26-Mar-10 31-Mar-10 31-Mar-10 31-Mar-10
Support Program-
Subprogram 1
Total 10.000 27.607 10.000 27.607
ADF = Asian Development Fund; OCR = Ordinary Capital Resources
Source: LFIS/GFISTable 6: Development Coordination Matrix
Sectors and Other Development Partners’ Strategies and/or Main Activities
Current ADB Strategic Focus
Themes Multilateral Institutions and the UN System Bilateral
Sector
Public Sector Budget and technical support for policy EU Budget and technical support for NZL Budget and technical
Management reforms linked to Public Financial policy reforms linked to Public support for policy reforms
Management Roadmap; Strengthening Financial Management Roadmap linked to Public Financial
public sector financial management; Management Roadmap
Economic planning capacity Improving
the governance and performance of
SOEs
Transport Avatiu Port rehabilitation, infrastructure … … NZL Reconstruction of harbors
services delivery on Mauke and Mitiaro to
reduce the risk of disaster
due to cyclones and other
extreme weather events.
Alternative port at
Arorangi.
Water Improve access to water by all EU Improve access to water by all NZL, PRC Improve access to water
communities, reliable and clean water communities, reliable and clean by all communities,
supply water supply; increase waste reliable and clean water
water treatment and sewer supply; support for the
collection capacity to control improvement of water
lagoon pollution quality in Muri lagoon in
Rarotonga,
Social Protection Direct support to vulnerable groups … … NZL, IND Small grant funding with
(elderly, disabled) social protection project
criteria
Energy Signed loan and grant arrangement to EU Signed Grant agreement NZL, JPN Current completing
complete Renewable Energy Program, Renewable Energy Program Northern Group
Southern Islands, Promoting energy Renewable Energy
efficiency Program.
Japan integrated into
Sothern Group solar panel
provision
Education … UNESCO Bi-annual grants for related sector NZL Improvements in
Appendix 2
projects (up to $25k per project) educational quality at all
levels. Improvements in
teacher qualification up-
skilling.
1920
Sectors and Other Development Partners’ Strategies and/or Main Activities
Current ADB Strategic Focus
Themes Multilateral Institutions and the UN System Bilateral
Appendix 2
Information and Feasibility study on the submarine fiber … … NZL Draft New Zealand Aid
Communication optic cable. Deregulation of the Programme Strategic Plan
Technology telecommunication industry. 2015/16–2018/19:
Potential programme
could include improving
affordable access to
telecommunications and
the internet; improving
regulation and
competition; and
maximizing associated
business and service
delivery opportunities
Industry and … EU Regional integration and trade- … …
Trade related issues including the
implementation of the Economic
Partnership Agreement
Themes
Capacity More responsive and cost-effective UNDP Build capacity at local NZL Provision of technical
Development scope, structure, and size of selected government level to effectively assistance fund. Training
public service sectors; Changes to the plan and manage resources in procurement,
Cook Islands outer islands administration scholarship awards and
and effective public policy manual. the procurement of capital
Building capacity in policy development, equipment
economic analysis and projection.
Governance Governance framework supporting EU Provision of advisory services NZL, PRC, Hosting of regional
infrastructure management and and technical studies. Systems KOR meetings. Provision of
development, Rigorous planning and improvement in MFEM. cars, Web tax lodgment
investment criteria for vetting system, accounting
infrastructure proposals, software for Aid
Asset management, Institutional management
adjustments and reforms for ensuring
sector sustainability
through regulatory reviews of tariff
regimes and private sector participation.
The Cook Islands have added
governance as its ninth MDGs.Sectors and Other Development Partners’ Strategies and/or Main Activities
Current ADB Strategic Focus
Themes Multilateral Institutions and the UN System Bilateral
Environment ... EU, UNDP, Climate change management NZL Assistance with the
Sustainability and GEF, SPREP program; integration of both DRR reconstruction of public
Climate Change and CCA in national, island and infrastructure and housing
community policies, plans and on the island of Aitutaki
work programmes. Improve following Cyclone Pat in
coordination. 2010.
Private Sector Strengthening policy environment, … … … …
Development regulatory oversight and improving
infrastructure including water, ports and
the development of ICT
ADB = Asian Development Bank, EU = European Union, GEF = Global Environment Facility, ICT = Information and Communication Technology, IND =
Government of India, JPN = Government of Japan, KOR – Government of the Republic of Korea, NZL =Government of New Zealand, MDGs = Millennium
Development Goals, MFEM = Ministry of Finance and Economic Management, PRC – Peoples Republic of China, SOE = State Owned Enterprises, SPREP =
Secretariat of the Pacific Regional Environment Programme, UNDP = United Nations Development Programme, UNESCAP = United Nations Economic and Social
Commission for Asian and the Pacific,
Source: Development partner websites and communications.
Appendix 2
2122 Appendix 3
Sector Assessment: (I) Public Sector Management
I. Sector Performance, Problems, and Opportunities
A. Role of the State
1 The public sector accounts for a substantial portion of overall expenditure in the Cook
Islands, with government spending averaging around 32.5% of gross domestic product (GDP) in
the last five years. Public sector performance management is overseen by the public service
commissioner. The public sector is made up of 40 separate entities in the form of ministries,
constitutional agencies, outer island administration offices, crown agencies, and state owned
enterprises (SOE).
2 Public sector priorities are guided by Te Kaveinga Nui, the country vision document, and
the medium term guides to its implementation—the National Sustainable Development Plan
(NSDP 2011-2015). Five strategic outcomes are set forth:
• Well educated, healthy and productive people and resilient communities;
• A secure society built on law and order and good governance;
• Sustainable economic growth in harmony with our social values, culture and
environment;
• Responsible and mature foreign relations with New Zealand and other regional and
international communities in the interest of the people of the Cook Islands; and
• Enhanced cultural and environmental values.
3 The state also plays a significant role in the Cook Islands economy through the provision
of infrastructure services. The Cook Islands Investment Corporation acts as the holding
company and ownership monitor for all of the SOEs, of which the Airport Authority, Port
Authority, Cook Islands Bank Limited, and the power utility are considered commercial in nature.
Through its subsidiary, the Cook Islands Government Property Corporation, it also holds the
government’s 40% shareholding in Cook Islands Telecom.
4 Constraints faced arise out of the decline in population facilitated by the ability of the
population to take up residency in New Zealand. The significant population loss (as high as
25%) experienced immediately following the public sector downsizing which was part of the
reforms of the late 1990s has left a mark and any current consideration of reforms is tempered
by consideration of the risk of further population loss. Limited capacity, across the whole
economy, is also an outcome of earlier reforms. Limiting the role of the state in development is
constrained in the case of outer island development where there are few private sector
opportunities and a constant struggle to halt population loss to Rarotonga.
B. The Quality of Public Expenditure
5 The Cook Islands’ public financial management (PFM) system is largely a creation of the
reform process that the country undertook between 1996 and 1998 when government had
become insolvent as it was unable to meet its debt obligations as they fell due. It was during this
time that much of the legislation that is the foundation of the current PFM was developed
including, the Ministry of Finance and Economic Management Act (1995-96), Income Tax Act
(1997), Value Added Tax Act (1997), Public Expenditure Review Committee and Audit Act
(1995-96), Public Service Commission Act (1996) and the Cook Islands Investment Corporation
Act (1997-98).You can also read