City of Port Hueneme General Plan 2021-2029 Housing Chapter
←
→
Page content transcription
If your browser does not render page correctly, please read the page content below

City of Port Hueneme
General Plan 2021-2029 Housing Chapter

                          Background Report
                                             prepared by
                                 City of Port Hueneme
                    Community Development Department
                               250 North Ventura Road
                        Port Hueneme, California 93041

                          prepared with the assistance of
                                Rincon Consultants, Inc.
                             180 North Ashwood Avenue
                               Ventura, California 93003

                                        November 2020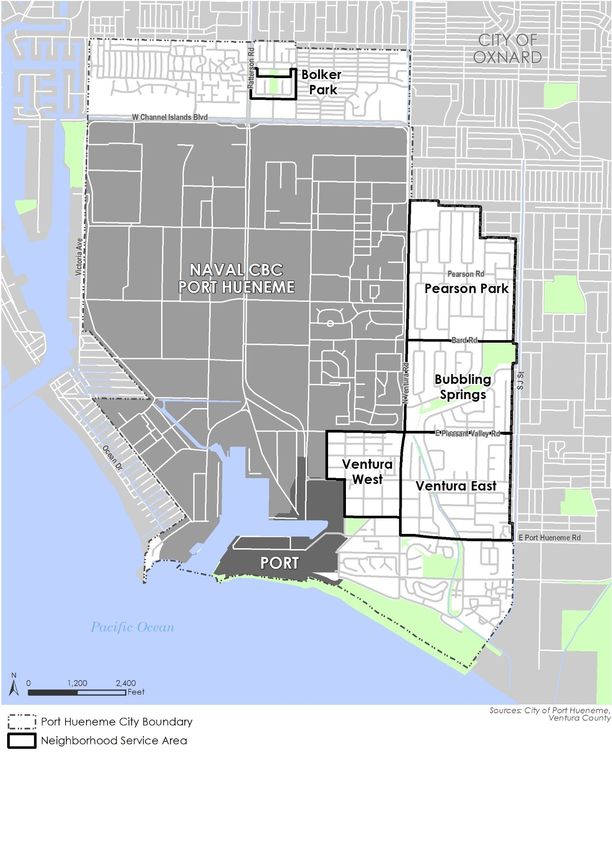
Table of Contents

Table of Contents

1   Introduction ....................................................................................................................................1
    1.1    Port Hueneme Setting.........................................................................................................1
    1.2    Purpose of the Report .........................................................................................................1
2   Community Profile ..........................................................................................................................2
    2.1  Demographic Trends ...........................................................................................................2
    2.2  Employment ........................................................................................................................4
    2.3  Household Characteristics ..................................................................................................4
    2.4  Special Needs Groups .........................................................................................................7
    2.5  Housing Characteristics.....................................................................................................14
    2.6  Regional Housing Needs Allocation ..................................................................................21
    2.7  Assisted Housing Preservation Analysis ............................................................................22
    2.8  Housing in Coastal Zone ....................................................................................................25
3   Housing Constraints ......................................................................................................................27
    3.1   Market Constraints ...........................................................................................................27
    3.2   Governmental Constraints ................................................................................................29
    3.3   Environmental Constraints ...............................................................................................42
4   References ....................................................................................................................................44

Tables
Table 1        Population Trends: 2000-2020............................................................................................2
Table 2        Age Characteristics of Population: 2010-2018....................................................................3
Table 3        Racial/Ethnic Composition: 2018 ........................................................................................3
Table 4        Employment by Industry .....................................................................................................4
Table 5        Household Type: Port Hueneme and Ventura County .......................................................5
Table 6        Overcrowding: Port Hueneme and Ventura County ...........................................................6
Table 7        Income Distribution: Port Hueneme and Ventura County .................................................7
Table 8        Elderly Households by Tenure ............................................................................................7
Table 9        Disabilities by Age Group ....................................................................................................9
Table 10       Household Size and Tenure ..............................................................................................11
Table 11       Single-Parent Households: Port Hueneme .......................................................................11
Table 12       Ventura County Homeless Count: 2020............................................................................13
Table 13       Housing Units 2000 to 2020 ..............................................................................................14
Table 14       Housing Units by Type: Port Hueneme and Ventura County 2020...................................15
Table 15       Year Units Built..................................................................................................................16
Table 16       Housing Conditions Survey 2013 ......................................................................................17

Background Report                                                                                                                                    i
City of Port Hueneme City of Port Hueneme General Plan 2021-2029 Housing Chapter Table 17 Income Categories and Affordable Housing Costs – Ventura County ..............................20 Table 18 Regional Housing Needs Allocation ..................................................................................21 Table 19 Inventory of Assisted Rental Housing ...............................................................................22 Table 20 Rent Subsidies Required ...................................................................................................23 Table 21 Market Value of At Risk Housing ......................................................................................24 Table 22 Housing in the Coastal Zone 1982-2020 ...........................................................................25 Table 23 New Housing Constructed in the Coastal Zone 2013-2020 . Error! Bookmark not defined. Table 24 Loan Applications by Census Tract 2017...........................................................................28 Table 25 Residential Development Standards .................................................................................29 Table 26 Parking Requirements .......................................................................................................31 Table 27 Provisions for a Variety of Housing Types.........................................................................32 Table 28 Planning and Subdivision Fees ..........................................................................................39 Table 29 Approximate Development Processing Times ..................................................................42 Figures Figure 1 Neighborhood Strategy Area and the Bolker Park Single-Family Homes .........................18 Appendices Appendix A Review of the Previous Housing Element ii
Introduction

1          Introduction

1.1        Port Hueneme Setting
Port Hueneme is a coastal community located about 60 miles north of Los Angeles and 40 miles
south of Santa Barbara. The City encompasses an area of approximately 4.5 square miles with nearly
half situated within the California Coastal Zone. Over half of the City's incorporated area is
comprised of the U.S. Naval Base Ventura County - Port Hueneme (NBVC-PH) that is controlled by
the federal government and the Port of Hueneme, operated by the Oxnard Harbor District.
The California Department of Finance (DOF) estimates that as of January 2020, the City had a
population of 23,607 persons and 8,284 housing units (DOF 2020). The City is a maturing community
with very limited vacant land available for future residential development.
Port Hueneme is primarily bounded by the City of Oxnard and the Pacific Ocean; it has virtually no
annexation potential. The only unincorporated areas contiguous to the City are the "islands" of
Silver Strand and Hollywood-by-the-sea. However, incorporation of these areas is unlikely as they
are within the City of Oxnard's Sphere of Influence (SOI).
The presence of the NBVC-PH used to place significant pressure on the tight local housing market,
particularly on the lower cost housing market. However, due to the realignment of the Naval Civil
Engineering Laboratory (NCEL) in 1997 and consolidation of Point Mugu with the NBVC-PH under
one command Naval Base Ventura County (NBVC), the number of military personnel and families
has decreased, easing the pressure on the local housing market.
Future population and residential growth in the City will most likely occur in areas where infill
developments are implemented, as most of the City’s available land is built out. This Background
Report identifies the vacant and underutilized sites which are suitable for residential uses. However,
due to the high cost of new construction and limited availability of suitable land for new
development, the City is prioritizing increased density of housing located in areas that are already
built out through in-fill development. Zoning overlays and rezoning are the primary mechanisms
through which the City intends to promote high density in-fill development.

1.2        Purpose of the Report
The Housing Element is intended to direct residential development, preservation, and enhancement
in a way that corresponds with the overall economic and social values of the community. The
residential character of a city is largely dependent on the type and quality of its housing units, their
location, and such factors as maintenance and neighborhood amenities. The Housing Element is an
official municipal response to a growing awareness of the need to provide housing for all economic
segments of the community, as well as legal requirements to incorporate housing policies as part of
the planning process. As such, the Port Hueneme Housing Element establishes policies to guide City
officials in decision-making and sets forth an action program to implement the City's housing goals.
This Housing Element Background Report provides an overview of the population, socioeconomic
and housing characteristics of the City of Port Hueneme. This information will help define the City's
current and projected housing needs and provide direction in developing the Housing Element
goals, policies and programs. This report will serve as a technical appendix to the Housing Element.

Background Report                                                                                       1
City of Port Hueneme
City of Port Hueneme General Plan 2021-2029 Housing Chapter

2                  Community Profile

2.1                Demographic Trends
Population Growth
Population growth trends for the City of Port Hueneme and surrounding jurisdictions are presented
in Table 1 for years 2000 to 2020. Port Hueneme’s population grew 7.5% between 2000 and 2020,
to an estimated total of 23,607.

Table 1         Population Trends: 2000-2020
                                                                                        % to Change
    Jurisdiction                      2000                2010        2020               2000-2020
    Camarillo                        57,077               65,201     70,261                 18.8
    Oxnard                          170,358              197,899    206,352                 17.4
    Port Hueneme                     21,845               21,723     23,607                  7.5
    Ventura                         100,916              106,433    106,276                  5.0
    Ventura County                  753,197              823,318    842,886                 10.6
    Source: U.S. Census Bureau 2000 and 2010; DOF 2020

The City’s relatively slow population growth in recent years was largely reflective of the limited land
available for residential development in the City and constrained potential for expansion. Port
Hueneme has no remaining land of considerable size currently designated for residential uses. As
part of this Housing Element update, potential sites for residential development will be evaluated.
The Housing Element will establish complementary policies and programs to ensure the affordability
of a portion of this housing to lower- and moderate-income households.

Age Characteristics
The age profile presented in Table 2 illustrates the demographics changes that have occurred
among the Port Hueneme population from 2010 to 2018 (the latest year for which such age
information is available). The median age in Port Hueneme increased slightly from 31.3 in 2010 to
31.7 in 2018.
Due to the lack of population growth, the age structure in Port Hueneme has remained stable, with
minimal change in the proportion of the population ages 45 and over from 2010 to 2018.
Overall, seniors (those over 65 years of age) comprised approximately 10.8 percent of the City’s
population in 2018.

2
Community Profile
Table 2 Age Characteristics of Population: 2010-2018
2010 2018
Age Range # of Persons % of Population # of Persons % of Population
0-4 years 1,862 8.6% 1,958 8.8%
5-19 years 4,677 21.5% 4,130 18.6%
20-24 years 1,947 9.0% 1,839 8.3%
25-44 years 6,258 28.8% 7,301 32.9%
45-54 years 2,551 11.7% 2,011 9.1%
55-59 years 1,091 5.0% 1,461 6.6%
60-64 years 951 4.4% 1,114 5.0%
65-74 years 1,204 5.5% 1,264 5.7%
75-84 years 843 3.9% 882 4.0%
85 years+ 339 1.6% 255 1.1%
Total 21,723 100.0% 22,215 100.0%
Male 11,030 50.8% 11,404 51.3%
Female 10,693 49.2% 10,811 48.7%
Median age 31.3 31.7
Source: US Census Bureau 2010 and 2018a
Race and Ethnicity
Table 3 shows that the City's population is more diverse than that of the county as a whole, with
70.9 percent white compared to 80.2 percent for the entire county. Persons of Hispanic origin
comprised 59.4 percent of the City's population. Countywide, 42.4 percent of residents reported
Hispanic origin.
Table 3 Racial/Ethnic Composition: 2018
Port Hueneme Ventura County
Race/Ethnicity Population % of Total Population % of Total
White 15,758 70.9% 680,197 80.2%
Black 1,030 4.6% 14,835 1.7%
American Indian and Alaska Native 160 0.7% 7,069 0.8%
Asian 1,305 5.9% 61,772 7.3%
Native Hawaiian and other Pacific Islander 216 1.0% 1,771 0.2%
Other race 1,669 7.5% 44,907 5.3%
Two or more races 2,077 9.3% 37,561 4.4%
Total 22,215 100.0% 848,112 100.0%
Hispanic (any race) 13,196 59.4% 360,017 42.4%
Source: US Census Bureau 2018a
Background Report 3City of Port Hueneme
City of Port Hueneme General Plan 2021-2029 Housing Chapter
2.2 Employment
The California Employment Development Department (EDD) estimated a civilian labor force of
10,100 in the City in February 2020. Of that labor force, approximately 400 people were
unemployed, for an unemployment rate of 3.7 percent. The COVID-19 pandemic started to impact
employment and the labor force around March 2020. The current civilian labor force as of August
2020 is 9,700, with 900 unemployed and an unemployment rate of nine percent. In addition to the
civilian labor force, a total 1,185 individuals were employed in the Armed Forces according to
the2018 U.S. Census American Community Survey (ACS) five-year estimates.
Table 4 provides a breakdown of the industries in which Port Hueneme residents were employed.
The educational, health and social services sector employed the greatest proportion of residents
with 19.7 percent. The second largest sector was manufacturing with 12.8 percent followed by retail
trade with 11.3 percent.
Table 4 Employment by Industry
Industry Jobs %
Civilian Labor Force
Agriculture, forestry, fishing and hunting, and mining 446 4.5%
Construction 596 6.1%
Manufacturing 1,257 12.8%
Wholesale trade 428 4.4%
Retail trade 1,116 11.3%
Transportation and warehousing, and utilities 522 5.3%
Information 86 0.9%
Finance and insurance, and real estate and rental and leasing 291 3.0%
Professional, scientific, and management, and administrative and waste management services 1,091 11.1%
Educational services, and health care and social assistance 1,942 19.7%
Arts, entertainment, and recreation, and accommodation and food services 645 6.6%
Other services, except public administration 588 6.0%
Public administration 825 8.4%
Total 9,833 100.0%
Non Civilian Labor Force
Armed Forces 1,185 –
Source: US Census Bureau 2018b.
2.3 Household Characteristics
What Is a Household?
A household is defined as all persons occupying a housing unit. Families are a subset of households,
and include all persons living together who are related by blood, marriage, or adoption. Single
households include persons living alone in housing units, but do not include persons in group
quarters such as convalescent homes or dormitories. Other households are unrelated people living
together, such as roommates.
4Community Profile
Household Composition and Size
Family households represent the majority of the City's households, making up 67.1 percent of all
households in Port Hueneme, as shown in Table 5. Countywide, family households account for 72.2
percent of all households. Compared to the County as a whole, Port Hueneme has a higher
proportion of non-family households, as well as persons living alone.
Table 5 Household Type: Port Hueneme and Ventura County
Port Hueneme Ventura County
Household Type Households %1 Households %1
Family households 4,422 67.1% 197,226 72.7%
With own children under 18 years 2,153 32.7% 84,465 31.1%
Married-couple family 3,153 47.8% 150,646 55.5%
With own children under 18 years 1,522 23.1% 63,468 23.4%
Male householder, no wife present 334 5.1% 14,457 5.3%
With own children under 18 years 133 2.0% 6,014 2.2%
Female householder, no husband present 935 14.2% 32,123 11.8%
With own children under 18 years 498 7.6% 14,983 5.5%
Nonfamily households 2,171 32.9% 74,000 27.3%
Total households 6,593 100.0% 271,226 100.0%
Householder living alone 1,743 26.4% 58,566 21.6%
Households with one or more people under 18 years 2,464 37.4% 95,920 35.4%
Households with one or more people 65 years and over 1,759 26.7% 84,664 31.2%
Average household size 3.22 3.08
Source: US Census Bureau 2018c
1: Percentages are relative to the combined total of family and non-family households
Household size is an important indicator that identifies sources of population growth as well as
overcrowding in housing units. A community's average household size will increase over time if
there is a trend toward larger families. In a community where the population is aging, the average
household size may actually decline. In addition, an increase in household size with time can also
indicate increasing housing costs and unaffordability. The 2018 ACS reported that the average
household size in Port Hueneme was 3.22, increasing from 2.95 in 2010 and suggesting a trend
towards larger families. In comparison, countywide average household size was 3.08 in 2020,
slightly lower than for the City. In addition, the average family size in the City was approximately
3.9, which is higher than the average household size and does not indicate unaffordable housing
costs.
Overcrowding
The State Department of Housing and Community Development (HCD) defines overcrowding as a
household with more than one person per room (excluding bathroom and kitchen). Severe
overcrowding is one with more than 1.5 persons per room. Overcrowding typically reflects the
inability of households to buy or rent housing that provides reasonable privacy for its residents.
Table 6 shows that about 8 percent of owner households and about 8.9 percent of renter house-
holds in Port Hueneme reported overcrowding in 2018. 3.3 percent of owner-occupied households
Background Report 5City of Port Hueneme
City of Port Hueneme General Plan 2021-2029 Housing Chapter
were severely overcrowded and 3.0 percent of renter-occupied households were severely
overcrowded. Given that less than 1 percent of owner households and just over 1 percent of renter
households reported being severely overcrowded according to the 2010 ACS, severe overcrowding
is increasing in Port Hueneme. Compared to the County as a whole, Port Hueneme shows higher
rates of overcrowding among owners and similar rates of overcrowding among renters.
Table 6 Overcrowding: Port Hueneme and Ventura County
Port Hueneme Ventura County
Household Type Households % Households %
Owner-occupied 3,172 100.0% 171,554 100.0%
Overcrowded (1.01 to 1.5) 253 8.0% 4,189 2.4%
Severely overcrowded (1.51+) 106 3.3% 1,235 0.7%
Renter-occupied 3,421 100.0% 99,672 100.0%
Overcrowded (1.01 to 1.5) 305 8.9% 8,145 8.2%
Severely overcrowded (1.51+) 104 3.0% 4,323 4.3%
Source: US Census Bureau 2018d
Household Income
An important factor with respect to housing affordability is household income. While upper income
households have more discretionary income to spend on housing, low- and moderate-income
households are more limited in the range of housing they can afford.
To determine eligibility for participation in housing programs, HCD has developed the following
income categories based on Area Median Income (AMI) and adjusted for household size:
▪ Extremely Low Income - less than 30 percent of AMI
▪ Very Low Income - between 30 and 50 percent of AMI
▪ Low Income - between 50 and 80 percent of AMI
▪ Moderate Income - between 80 and 120 percent of AMI
▪ Above Moderate Income - greater than 120 percent of AMI
Extremely low, very low, and low income groups are also collectively referred to as the lower
income group.
Typically, median incomes for lower income groups are “capped” at the national median levels.
However, due to the high cost of housing in Ventura County, income limits for the lower income
groups are "uncapped", allowing adjustments to be higher than the standard 30, 50 and 80 percent
for extremely low, very low, and low-income households, respectively. These adjustments are
necessary to compensate for the high cost of housing in Ventura County and allow more households
to qualify for housing programs. Median and moderate-income limits are maintained at 100 and 120
percent of the AMI. The income distributions for Port Hueneme and the County are presented in
Table 7.
6Community Profile
Table 7 Income Distribution: Port Hueneme and Ventura County
Port Hueneme Ventura County
Income Group Households % Households %
Very low income1 1,880 29% 63,297 23%
Low income 1,453 22% 44,751 17%
Moderate income 1,595 24% 50,875 19%
Above moderate 1,636 25% 111,123 41%
Total 6,564 100% 270,046 100%
1 Very low income households include extremely low income households
Source: SCAG 2020
Table 7 shows that Port Hueneme's income distribution differs from that of the County's. About 29
percent of Port Hueneme households earned extremely low and very low incomes, compared to 23
percent of County households. In contrast, only 25 percent of the City households have above
moderate incomes, while 41 percent of all households in the County have above moderate income.
Port Hueneme's lower income distribution results, in part, from the fact that most enlisted
personnel and military families at the NBVC-PH are lower income.
2.4 Special Needs Groups
Certain segments of the population may have a more difficult time finding decent affordable
housing due to special circumstances. These special needs households, as defined in the State
housing element law, are “the elderly, persons with disabilities, large families, families with female
heads of households, farmworkers, and families and persons in needs of emergency shelter”
(Government Code §65583). In Port Hueneme, military families also warrant special attention in
relation to housing due to their generally lower incomes.
Elderly
Senior households have special housing needs due to three concerns - limited and fixed incomes,
high health care costs, and disabilities. According to the 2018 ACS five-year estimates, 32.1 percent
of owner households and 15.5 percent of renter households were headed by seniors aged 65 and
older, as shown in Table 8.
Table 8 Elderly Households by Tenure
Owner Renter
Householder Age Households % Households %
Under 65 years 2,154 67.9% 2,890 84.5%
65 to 74 years 523 16.5% 285 8.3%
75 to 84 years 382 12.0% 234 6.8%
85 years and over 113 3.6% 12 0.4%
Total Households 3,172 100% 3,421 100%
Source: US Census 2018e
Background Report 7City of Port Hueneme City of Port Hueneme General Plan 2021-2029 Housing Chapter The special needs of seniors can be met through a range of services, including congregate care, rent subsidies, shared housing, and housing rehabilitation assistance. For the frail or disabled elderly, housing can be modified with features that help promote continued independent living. Port Hueneme has two assisted housing projects that are targeted toward serving very low-income elderly residents - Casa Pacifica and Mar Vista. Casa Pacifica is a 90-unit privately owned senior housing project under a project-based Section 8 contract, developed with financial assistance from the HUD Section 222(0)(4) program. Ten of the units are equipped with barrier free features for disabled persons and all units receive housing choice voucher program rent subsidies to ensure affordability. The Section 8 contract is due to expire on January 31, 2025. Mar Vista is a 60-unit low-income senior housing project owned and operated by the Housing Authority of the City of Port Hueneme (“Housing Authority”). Mar Vista is reserved for households earning less than 80 percent of the AMI. The Housing Authority administers a Capital Fund Program (CFP) that provides funding through HUD to pay for large capital improvements such as elevator renovations, windows, or roofs; and also provides funding for management and security improvements. CFP funds can also be directed toward public housing operating expenses. Funding is directed by Housing and Facilities Maintenance personnel who identify and address facility needs in both family and senior developments through physical inspections and input from residents for interior and exterior improvements. A majority of Port Hueneme's elderly population resides in the City's older neighborhoods and at Hueneme Bay, a senior housing development as defined under Civil Code §51.3 consisting of 773 individually-owned garden-patio and townhome lots with community facilities operated by the Carefree Living Association. In the City's older neighborhoods, some housing units exhibit deferred maintenance and require rehabilitation. Low interest loans and grants are offered through the City's Home Maintenance Incentive Rebate Program (HMIRP)to facilitate unit upgrading, thereby improving housing conditions for the elderly and other low-income residents. The Housing Authority administers a Capital Fund Program (CFP) that provides funding through HUD to pay for large capital improvements such as elevator renovations, windows, or roofs; and also provides funding for management and security improvements. CFP funds can also be directed toward public housing operating expenses. Funding is directed by Housing and Facilities Maintenance personnel who identify and address facility needs in both family and senior developments through physical inspections and input from residents for interior and exterior improvements. Persons with Disabilities Disability can hinder access to housing units of traditional design as well as potentially limit the ability to earn adequate income. The Census defines a "disability" as a long-lasting physical, mental, or emotional condition. Table 9 shows a breakdown of disabilities by age group. 2018 ACS data reported that approximately 25.6 percent of Port Hueneme’s population had some type of disability. Seniors had the highest rates of disabilities, with 17.6 percent reporting difficulty with independent living and 23.9 percent reporting an ambulatory difficulty. 8
Community Profile

Table 9        Disabilities by Age Group
 Disability by Age                                             Persons              %
 Age 5 and Under
 Total persons                                                  1,958
 With a hearing difficulty                                        116              5.9%
 With a vision difficulty                                           62             3.2%
 Age 5 to 17
 Total persons                                                  3,472
 With a hearing difficulty                                          24             0.7%
 With a vision difficulty                                           24             0.7%
 Age 17 and Under
 Total Persons                                                  5,430
 With a cognitive difficulty                                      136              3.9%
 With an ambulatory difficulty                                      79             2.3%
 With a self-care difficulty                                        79             2.3%
 Age 18 to 64
 Total persons                                                 13,194
 With a hearing difficulty                                        184              1.4%
 With a vision difficulty                                         223              1.7%
 With a cognitive difficulty                                      754              5.7%
 With an ambulatory difficulty                                    533              4.0%
 With a self-care difficulty                                      219              1.7%
 With an independent living difficulty                            436              3.3%
 Age 65 and Over
 Total persons                                                  2,401
 With a hearing difficulty                                        337             14.0%
 With a vision difficulty                                         127              5.3%
 With a cognitive difficulty                                      236              9.8%
 With an ambulatory difficulty                                    575             23.9%
 With a self-care difficulty                                      239             10.0%
 With an independent living difficulty                            423             17.6%
 Note: Totals may exceed 100% due to multiple disabilities per person
 Source: US Census Bureau 2018f

The City provides rental assistance through Housing Choice Vouchers and Public Housing for
households with very low incomes (up to 50 percent AMI), including persons with disabilities, to the
extent that vouchers and units are available. In addition, the City offers rehabilitation assistance
that can be used to make accessibility improvements. The City has adopted procedures for
reviewing and approving requests for reasonable accommodation.

Developmentally Disabled
As defined by federal law, “developmental disability” means a severe, chronic disability of an
individual that:

Background Report                                                                                  9
City of Port Hueneme
City of Port Hueneme General Plan 2021-2029 Housing Chapter

     ▪    Is attributable to a mental or physical impairment or combination of mental and
          physical impairments
     ▪    Is manifested before the individual attains age 18
     ▪    Is likely to continue indefinitely
     ▪    Results in substantial functional limitations in three or more of the following areas of
          major life activity: a) self-care; b) receptive and expressive language; c) learning; d)
          mobility; e) self-direction; f) capacity for independent living; or g) economic self-
          sufficiency
     ▪    Reflects the individual 's need for a combination and sequence of special,
          interdisciplinary, or generic services, individualized supports, or other forms of
          assistance that are of lifelong or extended duration and are individually planned and
          coordinated.

The Census does not record developmental disabilities. According to the U.S. Administration on
Developmental Disabilities, an accepted estimate of the percentage of the population that can be
defined as developmentally disabled is 1.5 percent. Many developmentally disabled persons can live
and work independently within a conventional housing environment. More severely disabled
individuals require a group living environment where supervision is provided. The most severely
affected individuals may require an institutional environment where medical attention and physical
therapy are provided. Because developmental disabilities exist before adulthood, the first issue in
supportive housing for the developmentally disabled is the transition from the person's living
situation as a child to an appropriate level of independence as an adult.
The California Department of Developmental Services (DDS) currently provides community-based
services to approximately 315,000 persons with developmental disabilities and their families
through a statewide system of 21 regional centers, four developmental centers, and two
community-based facilities1. Port Hueneme is served by the Tri-Counties Regional Center2 (TCRC),
which is based in Santa Barbara and operates a field office in Oxnard, just northwest of Port
Hueneme. As of 2017 the Center served over 14,000 individuals and families and had approximately
340 staff persons. Any resident who has a developmental disability that originated before age 18 is
eligible for services. Services are offered to people with developmental disabilities based on
Individual Program Plans and may include: Adult day programs; advocacy; assessment/consultation;
behavior management programs; diagnosis and evaluation; independent living services; infant
development programs; information and referrals; mobility training; prenatal diagnosis; residential
care; respite care; physical and occupational therapy; transportation; consumer, family vendor
training; and vocational training. TCRC also coordinates the state-mandated Early Start program,
which provides services for children under age three who have or are at substantial risk of having a
developmental disability.

Large Households
A large household is defined as one with five or more members in a housing unit. Large households
are identified as a group with a special housing need based on the limited availability of adequately
sized, affordable housing units. Large families are often of lower income (on a per capita basis). The
mismatches between household size, housing unit size, and affordability frequently result in the

1 https://law.stanford.edu/wp-content/uploads/2019/07/Lanterman-Primer-Posted-July-1-2019.pdf
2 www.tri-counties.org

10
Community Profile
overcrowding of smaller dwelling units, which in turn accelerates unit deterioration. As shown in
Table 10, large households represented 18.5 percent of owner households and 15.6 percent of
renter households in Port Hueneme according to the 2018 ACS.
Table 10 Household Size and Tenure
Owner Renter
Householder Size Households % Households %
1 person 878 27.7% 865 25.3%
2 persons 958 30.2% 621 18.2%
3 persons 470 14.8% 638 18.6%
4 persons 278 8.8% 764 22.3%
5 persons 191 6.0% 392 11.5%
6 persons 177 5.6% 100 2.9%
7+ persons 220 6.9% 41 1.2%
Total households 3,172 100.0% 3,421 100.0%
Source: US Census Bureau 2018g
Little housing development has occurred since the prior Housing Element was completed in 2013.
As such, avaliability of housing in the City suited to large families has remained stable. The Housing
Authority provides two- and three-bedroom public housing units at Hueneme Village.
Single-Parent Families
Single-parent households require special consideration and assistance because of their greater need
for day care, health care, and other assistance. As shown in Table 11, single-parent households
represented about 14.9 percent of owner households and 23.4 percent of renter households in Port
Hueneme according to the 2018 ACS.
Table 11 Single-Parent Households: Port Hueneme
Owner Renter
Householder Size Households % Households %
Married couple family 1,605 50.6% 1,548 45.3%
Male householder, no wife present 202 6.4% 132 3.9%
Female householder, no husband present 269 8.5% 666 19.5%
Non-family households 1,096 34.5% 1,075 31.4%
Total households 3,173 100.0% 3,420 100.0%
Source: US Census Bureau 2018h
Female-headed households, with children in particular, tend to have lower incomes, thus limiting
housing availability for this group. All of the City's housing programs that serve lower-income
persons also serve the needs of low-income single-parent households, such as Section 8 rental
assistance, public housing, and the acquisition/rehab program.
Background Report 11City of Port Hueneme City of Port Hueneme General Plan 2021-2029 Housing Chapter Military Families Over half of Port Hueneme's 4.5-square-mile area is comprised of the Naval Base Ventura County - Port Hueneme (NBVC-PH). The Office of Public Affairs at the NBVC-PH reports that there are approximately 2,949 people living on the base. The NBVC-PH provides 1,720 barrack slots for single enlisted personnel and officers and 799 housing units for military personnel with families. The 799 family units consist of 415 two- bedroom units, 241 three-bedroom units and 67 four-bedroom units for enlisted personnel. The remaining family units are officer housing, consisting of 3 five-bedroom units and 73 three- and four-bedroom units. The Navy estimated that the 799 family housing units provide approximately 25 percent of the family housing units needed. The NBVC-PH Housing Office maintains a waiting list for all on-base family housing. The wait ranges from one month for two- bedroom units, three to four months for three-bedroom units, six to eight months for four-bedroom units, and up to two years for the five-bedroom units. Compared to a few years ago, the length of the wait time has been cut in half due to the reduced housing demand as a result of the base realignment and consolidation.3 Although the NBVC-PH adjusts the monthly income of its personnel by their marital status, most enlisted personnel are still classified as very-low- and low-income based on HUD standards and typically cannot afford the high housing costs in the open market. The NBCV-PH provides housing allowances for its military personnel who require housing off the NBVC-PH site. The pay scale for enlisted personnel is based on pay grade (1-9) and on years of experience. As of 2020, recently enlisted personnel (paygrade 1) earn $1,733.01 per month.4 For more experienced personnel (paygrade 7) with eight years of experience, the monthly income starts at $3,114.34 and increases according to total years of service. These pay scales place most enlisted military personnel at very low- and-low income levels. The Basic Allowance for Housing (BAH) is a program administered by the Department of Defense to provide housing assistance to military personnel. It measures rental housing costs in the civilian market rather than measuring how much members spend on housing. The BAH is calculated based on the local price of rental housing, utilities and renter’s insurance. The housing costs are computed within a reasonable commuting distance from the duty location (20 miles or a one-hour drive in rush hour traffic). As a Southern California coastal community, the cost of housing in Port Hueneme is generally higher than in less urbanized non-coastal counties. However, housing costs in Port Hueneme are generally lower than many other cities in Ventura County and other coastal counties in the Southern California region. Farm Workers Farm workers are defined as persons making their living through agricultural work and many of whom move with the seasons to different farming areas or communities. The special needs of many farm workers arise from their low wages and the insecure nature of their employment. While there is no agricultural production within Port Hueneme, immediately surrounding the City are many orchards and strawberry farms. As shown previously in Table 4, the 2018 ACS indicated that 446 Port Hueneme residents, or about 4.5 percent of employed residents, were employed in the agriculture, forestry and fisheries industries. 3 Conversation with staff at NBVC-PH, January 2013. 4 http://www.militaryfactory.com/military_pay_scale.asp. 12
Community Profile

Given the limited number of farm workers in the City and the even smaller number of migrant farm
workers, special housing needs associated with farm workers in Port Hueneme are insignificant
compared to other special needs groups. Housing needs for permanent farm workers can generally
be addressed by overall programs for housing affordability, such as the City's public housing and
Section 8 rental assistance program. Any affordable housing efforts targeted toward lower-income
households will help address housing issues faced by permanent farm workers.
Port Hueneme has no land designated for agricultural use and no agricultural production. Also, the
City is primarily built out with little remaining land that is vacant or can be redeveloped. As such, the
development of group housing for the small number of migrant farm workers is not an appropriate
or feasible housing option in the City.

Homeless
Throughout the country, homelessness has become an increasing problem. Factors contributing to
the rise in homelessness include the general lack of housing affordable to low- and moderate-
income persons, increases in the number of persons whose incomes fall below the poverty level,
reductions in public subsidy for the poor and the deinstitutionalization of the mentally ill.
The 2020 Ventura County Homeless Count and Subpopulation Survey, conducted through a
partnership by the Ventura County Continuum of Care (VCCoC), community organizations and
volunteers were conducted on January 29, 2020. Results are presented in Table 12. The Homeless
Count found 16 unsheltered homeless persons in Port Hueneme, all of whom were over the age
of 18.

Table 12 Ventura County Homeless Count: 2020
 Jurisdiction                                    Number                            % of Total
 Camarillo                                         30                                 1.7%
 Fillmore                                          10                                 0.6%
 Moorpark                                           0                                 0.0%
 Ojai                                              49                                 2.8%
 Oxnard                                           567                                32.5%
 Port Hueneme                                      19                                 1.1%
 Santa Paula                                       95                                 5.5%
 Simi Valley                                      162                                 9.3%
 Thousand Oaks                                    152                                 8.7%
 Ventura                                          531                                30.5%
 Unincorporated County                            128                                 7.3%
 Total                                           1,743                              100.0%
 Source: VCCoC 2020

Port Hueneme has no emergency shelters. However, the City operates its own HUD-designated
Small City Housing Authority which serves as a local resource center where citizens including
homeless persons can receive a wide range of information and referrals to legal services, rental
assistance, utility assistance, government benefits (Medicaid, food stamps, SSDI, SSI, Veterans
benefits, etc.), clothing, and meals. In connection with the City's participation in the Urban County
Community Development Block Grant (CDBG) program, the City and the Urban County have

Background Report                                                                                       13
City of Port Hueneme
City of Port Hueneme General Plan 2021-2029 Housing Chapter

traditionally allocated a majority of the CDBG e funds towards code enforcement activities, public
facility improvements and homeless service programs.
As part of its obligation under the Base Closure Community Redevelopment and Homeless
Assistance Act of 1994, the City, acting by and through the Port Hueneme Surplus Property
Authority, entered into an agreement with a coalition of homeless service providers to help fund
new or existing programs in the County that provide food, shelter and/or support services. Under
the agreement, the coalition is entitled to a credit of $26,521 per year ("homeless set aside") for 30
years. Unless the City offsets this obligation by dedicating funds directly for eligible homeless
programs or providing transitional housing units, the homeless set-aside obligation will accrue as
debt against the Surplus Property Authority's real property asset formerly occupied by the Naval
Civil Engineering Laboratory (NCEL) that was closed and realigned by the Department of Defense in
1995. Since 1996 the City has been more than meeting its annual homeless obligation by spending
CDBG funds on eligible homeless services and leasing affordable dwelling units owned by the City or
its Surplus Property Authority to the coalition for temporary use (up to 180 days per client) as
transitional housing for families who are either homeless or temporarily displaced due to domestic
violence. Currently four units are leased to the coalition.

2.5             Housing Characteristics
A housing unit is defined as a house, apartment or a single room, occupied as a separate living
quarters, or, if vacant, intended for occupancy as a separate living quarters. Separate living quarters
are those in which the occupants have direct access from the outside of the building or through a
common hall. A community's housing stock is the compilation of all its housing units.

Housing Growth
Due at least in part to the City's built out and land locked character, Port Hueneme experienced
lower housing growth between 2012 and 2020 compared to the surrounding communities. Table 13
shows that Port Hueneme's housing stock grew by about 1.8 percent between 2010 and 2020. This
is less than the growth experienced in the same periods for larger cities such as Camarillo and
Oxnard. Ventura County's housing stock grew by 3.3 percent from 2010 to 2020.

Table 13 Housing Units 2000 to 2020
 Jurisdiction                2000                   2010            2020           % Change (2010-2020)
 Camarillo                  21,946                  25,702         27,789                  7.5%
 Oxnard                     45,166                  52,772         56,240                  6.2%
 Port Hueneme                 7,908                  8,131          8,284                  1.8%
 Ventura                    39,803                  42,827         43,784                  2.2%
 County Total              251,712                 281,695        291,210                  3.3%
 Sources: US Census Bureau 2000; DOF 2010 & 2020

14
Community Profile Housing Types Information on the types of housing in a community helps identify discrepancies between housing needs and housing supply. From 2010 to 2020 the total housing stock in Port Hueneme increased by 153 units, or 1.8 percent, compared to an increase of 3.3 percent for Ventura County as a whole. With a small increase in the housing stock during the last decade, the housing unit mix has remained relatively stable. Table 14 shows housing units by type in Port Hueneme and Ventura County. As of 2020, single-family detached units comprised 32.4 percent of the City's total housing stock, compared to 63.6 percent for the entire County. Table 14 Housing Units by Type: Port Hueneme and Ventura County 2020 Structure Type Units % Port Hueneme Single-family detached 2,688 32.4% Single-family attached 2,373 28.6% Multi-family 2-4 units 961 11.6% Multi-family 5+ units 2,253 27.2% Mobile Homes 9 0.1% Total units 8,284 100.0% Ventura County Single-family detached 185,184 63.6% Single-family attached 31,834 10.9% Multi-family 2-4 units 16,075 5.5% Multi-family 5+ units 46,759 16.1% Mobile Homes 11,358 3.9% Total units 291,210 100.0% Source: DOF 2020 Housing Tenure and Vacancy A housing unit can be categorized as an ownership unit or rental unit regardless of the housing type. An ownership unit is one that is either occupied by persons who own the unit or is currently vacant but was occupied by persons who owned the unit. A rental unit is one that is either occupied by renters or is currently vacant but was occupied by renters. The tenure distribution of a community's housing stock (owner versus renter) influences several aspects of the local housing market. A community with a relatively high proportion of rental housing may encounter problems related to high housing turnover, an unstable population base, problems associated with deferred maintenance, and an overall concern with the property valuation in the neighborhood. Tenure preferences are primarily related to household income, composition, and age of the householder. Typically, there is a strong correlation between the types of housing units and housing tenure. For example, single-family attached or detached homes are usually ownership housing units, whereas multi-family units are usually rented units. However, housing characteristics in Port Hueneme do not always follow this pattern. Although many of the units in the City were developed as ownership Background Report 15
City of Port Hueneme
City of Port Hueneme General Plan 2021-2029 Housing Chapter

housing (such as single-family homes, townhomes, and condominiums), many of these units are
occupied by renters.
According to the 2018 ACS, Port Hueneme's occupied housing stock was comprised of 48 percent
owner-occupied units and 52 percent renter-occupied units, with a vacancy rate of 5.3 percent for
owner units and 2.3 percent for rental units.

Age and Condition of Housing Stock
The period in which housing units were built in Port Hueneme and Ventura County is presented in
Table 15. Port Hueneme was developed as a residential community with more than 72 percent of its
housing stock being built between 1960 and 1980. Significant growth occurred in Port Hueneme
during the 1970s; about a third of the housing stock was constructed during this decade. As land
available for development became increasingly scarce, residential construction began to slow, as
evidenced by the smaller proportions of housing units built after 1990.

Table 15 Year Units Built
                                          Port Hueneme                         Ventura County
 Year Structure Built             Units                   %            Units                     %
 Built 2014 or later                 13                  0.2%          1,964                    0.7%
 Built 2010 to 2013                132                   1.7%          3,676                    1.3%
 Built 2000 to 2009                295                   3.8%        29,820                 10.4%
 Built 1990 to 1999                345                   4.4%        30,458                 10.6%
 Built 1980 to 1989               1,787              23.0%           51,934                 18.1%
 Built 1970 to 1979               2,273              29.3%           65,720                 22.9%
 Built 1960 to 1969               1,550              20.0%           57,917                 20.1%
 Built 1950 to 1959               1,038              13.4%           27,873                     9.7%
 Built 1940 to 1949                217                   2.8%          8,382                    2.9%
 Total units                      7,754             100.0%          287,498               100.0%
 Source: US Census 2018i

As a generally accepted standard, housing units older than 30 years are assumed to require major
rehabilitation or maintenance efforts. As of 2018, about 89 percent of Port Hueneme’s housing units
were over 30 years old, indicating the potential need for rehabilitation and continued maintenance
of a substantial portion of the City’s housing units based on age alone.

Neighborhood Strategy Area
Because of the lack of available vacant land and high costs associated with building replacement
housing, the City has made preservation of the existing affordable housing stock a priority and
established a neighborhood preservation program in 1978. Based on the age and condition of the
housing stock, the City has delineated a Neighborhood Strategy Area (NSA) in which rehabilitation
and code enforcement efforts are focused. The NSA is further subdivided into four priority
neighborhoods based on the relative age of the housing stock in those areas. The four sub-areas
are: Ventura West, Ventura East, Bubbling Springs and Pearson Park. In 1996, 92 Bolker Park single-
family homes were designated as an additional target area for the purposes of CDBG-supported
code enforcement and the City-sponsored Home Maintenance Incentive Program. In 2000, the

16
Community Profile
Residential Rehabilitation Loan Program was also extended to the Bolker Park homes. Figure 1
illustrates the Neighborhood Strategy Area and the Bolker Park Single-Family Homes.
Periodically the City conducts a survey of housing conditions in the NSA and Bolker Park homes to
evaluate the effectiveness of the City's rehabilitation and code enforcement efforts and to assess
the remaining need for rehabilitation. The 2013 Site and Structural Conditions Survey documented
overall improvement in both site and structural conditions and a continuing need for residential
rehabilitation. Each residential parcel in the NSA and the Bolker Park area was individually evaluated
using a weighted scale that allowed for rating of major structural elements such as a roof or
foundation and minor building elements such as windows, doors, stairs and porches. In general,
those structures deemed substandard exhibit at least one serious defect in a major structural
element such as a sagging foundation, buckled exterior walls or a dilapidated roof or a combination
of a lesser degree of deterioration in a major structural element plus other deficiencies in one or
more minor building elements.
Survey results suggest that of the total of approximately 3,000 housing units surveyed, 164 units
(5.5 percent) were substandard and in need of moderate to major rehabilitation and two units were
deemed to be too deteriorated to be saved (Table 16). These numbers reflect a small decline in
conditions compared to earlier surveys, and the need for rehabilitation loans and maintenance
incentives is expected to increase as the housing stock continues to age. Dwelling units located
outside the surveyed areas were generally in newer planned unit developments governed by
maintenance covenants and are in good condition.
Table 16 Housing Conditions Survey 2013
Structures Units
Non- Non-
Standard Moderate Major Rehab- Moderate Major Rehab-
Area Condition Rehab Rehab able Total Standards Rehab Rehab able Total
Ventura 360 20 2 4 386 687 35 5 2 729
West (5.2%) (0.5%) (1.0%) (4.8%) (0.7%) (0.3%)
Ventura 570 28 0 0 598 843 45 0 0 888
East (4.7%) (5.1%)
Bubbling 493 14 2 0 509 517 14 2 0 533
Springs (2.8%) (0.4%) (2.6%) (0.4%)
Pearson 704 56 6 0 766 704 56 6 0 766
Park (7.3%) (0.8%) (7.3%) (0.8%)
Bolker 91 0 1 0 92 91 0 1 0 92
Park (1.1%) (1.1%)
Total 2,218 118 11 4 2,347 2,842 150 14 2 3,006
(5.0%) (0.5%) (0.2%) (5.0%) (0.5%) (0.1%)
Source: City of Port Hueneme, 2013
Background Report 17City of Port Hueneme City of Port Hueneme General Plan 2021-2029 Housing Chapter Figure 1 Neighborhood Strategy Area and the Bolker Park Single-Family Homes 18
Community Profile

Port Hueneme operates its own housing rehabilitation programs, which are funded in part with the
following sources:
▪    Local funds from the City’s Revolving Rehabilitation Trust Fund
▪    Urban County Entitlement CDBG funds
▪    Housing Successor Agency funds
▪    Rebate Program

The City’s primary program to promote rehabilitation effort involves the Home Maintenance
Incentive Rebate Program (HMIRP). The City has issued 73 loans dedicated to housing rehabilitation
through this program since 2013.

Housing Costs and Affordability
This section examines the definition of “affordable housing” and current housing market conditions
in Port Hueneme.

Housing Affordability Criteria
State law establishes five income categories for purposes of housing programs based on the area
(i.e., county) median income: extremely-low (30% or less of AMI), very-low (31-50% of AMI), low
(51-80% of AMI), moderate (81-120% of AMI) and above moderate (over 120% of AMI). Housing
affordability is based on the relationship between household income and housing expenses.
According to HUD and the California Department of Housing and Community Development (HCD)5,
housing is considered “affordable” if the monthly payment is no more than 30% of a household's
gross income. In some areas (such as Ventura County), these income limits may be increased to
adjust for high housing costs.
Table 17 shows current (2020) affordable rent levels and estimated affordable purchase prices for
housing in Ventura County by income category. Affordable costs are calculated based on the
definitions of affordable housing from the California Health and Safety Code. Affordable rent levels
account for the monthly cost of utilities.
Maximum purchase prices are more difficult to determine due to variations in mortgage interest
rates and qualifying procedures, down payments, special tax assessments, homeowner association
fees, property insurance rates, and other variable factors. With this caveat, the maximum home
purchase prices by income category shown in Table 17 have been estimated based on typical
conditions.

5 HCD memo of 4/18/07 (http://www.hcd.ca.gov/hpd/hrc/rep/state/inc2k7.pdf

Background Report                                                                                  19
City of Port Hueneme
City of Port Hueneme General Plan 2021-2029 Housing Chapter

Table 17 Income Categories and Affordable Housing Costs – Ventura County
                                    Affordable Costs2                  Utilities3
                     Annual                                                                 Taxes and       Affordable       Affordable
 Household          Income1       Rental       Ownership         Rental     Ownership      Insurance4,5        Rent6         Home Price7
 Extremely Low Income (0-30% AMI)
 1-Person            $23,700          $593          $593          $175          $175            $207             $418             $48,903
 2-Person            $27,100          $678          $678          $181          $181            $237             $497             $60,366
 3-Person            $30,500          $763          $763          $203          $203            $267             $560             $68,104
 4-Person            $33,850          $846          $846          $223          $223            $296             $623             $76,119
 5-Person            $36,600          $915          $915          $248          $248            $320             $667             $80,701
 Very Low Income (31-50% AMI)
 1-Person            $39,550          $989          $989          $175          $175            $346             $814            $108,847
 2-Person            $45,200        $1,130        $1,130          $181          $181            $396             $949            $128,819
 3-Person            $50,850        $1,271        $1,271          $203          $203            $445           $1,068            $145,066
 4-Person            $56,450        $1,411        $1,411          $223          $223            $494           $1,188            $161,591
 5-Person            $61,000        $1,525        $1,525          $248          $248            $534           $1,277            $172,980
 Low Income (51-80% AMI)
 1-Person            $63,250        $1,027        $1,198          $175          $175            $419             $852            $140,510
 2-Person            $72,300        $1,174        $1,369          $181          $181            $479             $993            $165,004
 3-Person            $81,350        $1,320        $1,540          $203          $203            $539           $1,117            $185,775
 4-Person            $90,350        $1,467        $1,712          $223          $223            $599           $1,244            $207,012
 5-Person            $97,600        $1,584        $1,848          $248          $248            $647           $1,336            $221,906
 Moderate-Income (81 to 100% AMI)
 1-Person            $68,450        $1,540        $1,797          $175          $175            $629           $1,365            $231,129
 2-Person            $78,250        $1,760        $2,054          $181          $181            $719           $1,579            $268,569
 3-Person            $88,000        $1,980        $2,311          $203          $203            $809           $1,777            $302,285
 4-Person            $97,800        $2,201        $2,567          $223          $223            $899           $1,978            $336,467
 5-Person          $105,600         $2,377        $2,773          $248          $248            $970           $2,129            $361,718
 Moderate-Income (100 to 120% AMI)
 1-Person            $82,150        $1,883        $2,196          $175          $175            $769           $1,708            $291,541
 2-Person            $93,900        $2,152        $2,510          $181          $181            $879           $1,971            $337,612
 3-Person          $105,600         $2,421        $2,824          $203          $203            $988           $2,218            $379,959
 4-Person          $117,350         $2,690        $3,138          $223          $223          $1,098           $2,467            $422,771
 5-Person          $126,750         $2,905        $3,389          $248          $248          $1,186           $2,657            $454,927
 1   HCD 2020
 2Affordable costs are calculated based on the California Health and Safety Code Section 50052.5 definitions of affordable housing
 (between 30 and 35 percent of household income depending on tenure and income level.)
 3 Healthand Safety code definitions of affordable housing costs (between 30 and 35 percent of household income depending on tenure
 and income level).
 4   HUD 2020c
 5   35 percent of monthly affordable cost for taxes and insurance on an annual basis.
 6   Taxes and insurance apply to renter costs only apply to owner costs as renters usually do not pay for taxes and insurance
 7   Affordable Rent = Affordable Rental Cost minus the cost of utilities
 8
     Affordable Home Price Assumptions – Five percent down payment, four percent interest rate for a 30-year fixed-rate mortgage loan.
 Prepared with the assistance of Veronica Tam and Associates.

20
Community Profile Rental Housing An internet search of available rental units in Port Hueneme in July 2020 found rents ranging from $1,750 to $2,800 per month (Zillow 2020), with those units at the upper end of the range being high-end apartments and single-family homes. When market rents are compared to the amounts lower-income households can afford to pay shown in Table 17, it is clear that extremely-low and very-low-income households would have difficulty finding rental housing without overpaying. However, market rents for many apartments fall into the low-income category, and moderate- income households have a wider range of choices without overpaying. 2.6 Regional Housing Needs Allocation State law requires jurisdictions to provide for their share of the regional housing needs through the Regional Housing Needs Allocation (RHNA) process. Total housing needs for a jurisdiction reflect the number of new units needed based on households which are expected to reside within the jurisdiction (future demand), plus an adequate supply of vacant housing to assure mobility and new units to replace losses. These needs are based on a regional and local level market demand for housing, employment opportunities, availability of suitable sites for public facilities, commuting patterns, type, and tenure of housing need and housing needs of farmworkers. The RHNA and Housing Element process occurs in cycles. The planning period between October 2021 and October 2029 represents the 6th RHNA cycle. To initiate each cycle, the California Department of Housing and Community Development (HCD) completes an assessment of housing needs within each region of the State. Regional planning bodies (known as Councils of Governments, or COGs) then allocate housing needs to each jurisdiction under their purview. Port Hueneme is under the purview of the Southern California Association of Governments (SCAG). According to SCAG, the 6th cycle RHNA for Port Hueneme will likely be a total of 125 units, made up of a combination of units designated for all income levels, from very-low to above moderate. Table 18 shows the estimated RHNA breakdown by income category. AB 2634 mandates that localities calculate the subset of the very low income regional need that constitutes the communities' need for extremely low-income housing. Some of the very-low-income units have been assigned to the extremely-low category based on the provision of state law that allows the very- low-income need to be divided equally between the extremely-low and very-low categories. Table 18 Regional Housing Needs Allocation Income Category Housing Units % of Total Extremely low (0-30% AMI) 13 10.5% Very low (31-50% AMI) 12 9.7% Low (51-80% AMI) 15 12.1% Moderate (81-120% AMI) 18 14.5% Above moderate (over 120% AMI) 66 53.2% Total housing units 125 100.0% Source: SCAG 2020b Background Report 21
You can also read