Feering Parish Council Housing Needs Assessment
←
→
Page content transcription
If your browser does not render page correctly, please read the page content below
Feering Parish Council
Housing Needs Assessment

July 2018
AECOM                                                                                               2

Quality information
Prepared by                          Checked by                            Approved by

Emily Pugh, Senior Planner           Ivan Tennant, Principal Planner       Stuart Woodin, Technical Director
Guillaume Rey, Graduate Planning
Consultant

Revision History
Revision             Revision date   Details                Authorised   Name                 Position

V1                   16/03/18        Draft                  EP           Emily Pugh           Senior Planner

V2                   05/04/18        Draft Review           SW           Stuart Woodin        Technical Director

V3                   30/04/18        Group Review           PL           Paul Lees            Check of Feering
                                                                                              Parish Council

V4                   30/05/18        Final Proofread        JB           Jessica Boekhoff     Sustainability
                                                                                              Consultant

V5                   19/06/18        Locality Review        FS           Francis Shaw         Neighbourhood
                                                                                              Planning Programme
                                                                                              Manager

V6                   04/07/18        Final                  IT           Ivan Tennant         Principal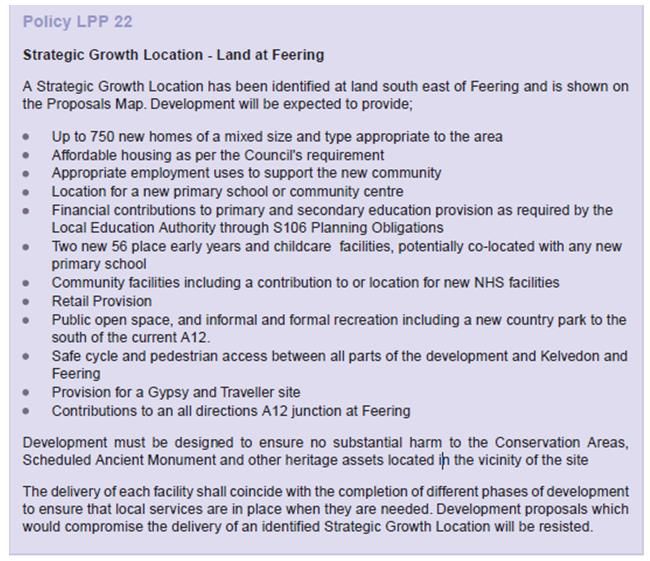
AECOM                                                                                                      3

Prepared for:
Feering Parish Council

Prepared by:

AECOM
Aldgate Tower
2 Leman Street
London
E1 8FA
aecom.com

© 2018 AECOM. All Rights Reserved.

This document has been prepared by AECOM (“AECOM”) for sole use of our client (the “Client”) in accordance with
generally accepted consultancy principles, the budget for fees and the terms of reference agreed between AECOM and the
Client. Any information provided by third parties and referred to herein has not been checked or verified by AECOM, unless
otherwise expressly stated in the document. No third party may rely upon this document without the prior and express
written agreement of AECOM.
AECOM                                                                                                                                                               4

Table of Contents
Executive Summary ................................................................................................................................................ 6
1.        Context ...................................................................................................................................................... 10
          1.1       Local context .................................................................................................................................. 10
          1.2       Planning policy context ....................................................................................................................11
2.        Approach ................................................................................................................................................... 15
          2.1       Research Questions ....................................................................................................................... 15
          2.2       Quantity .......................................................................................................................................... 15
          2.3       Tenure ............................................................................................................................................ 15
          2.4       Type and Size ................................................................................................................................. 15
          2.5       Housing for Specialist Groups ........................................................................................................ 15
          2.6       Study Objectives............................................................................................................................. 16
          2.7       Relevant Data ................................................................................................................................. 16
          2.7.1 Strategic Housing Market Area ....................................................................................................... 16
          2.7.2 Other relevant data (from LPA or NP group, e.g. housing survey) .................................................. 18
3.        Tenure ........................................................................................................................................................ 19
          3.1       Introduction ..................................................................................................................................... 19
          3.2       Definitional issues........................................................................................................................... 20
          3.3       Affordability ..................................................................................................................................... 21
          3.3.1 Income............................................................................................................................................ 21
          3.3.2 Affordability Ratio ........................................................................................................................... 22
          3.3.3 Income threshold ............................................................................................................................ 23
          3.3.4 Purchase threshold......................................................................................................................... 24
          3.3.5 Overcrowding and Concealment .................................................................................................... 24
          3.3.6 Housing waiting list ......................................................................................................................... 26
          3.4       Tenure Conclusions ........................................................................................................................ 28
4.        Type and size............................................................................................................................................. 30
          4.1       Current Type and Size profile ......................................................................................................... 30
          4.1.1 Dwelling Type ................................................................................................................................. 30
          4.1.2 Dwelling Size .................................................................................................................................. 30
          4.2       Factors affecting size of housing needed ....................................................................................... 32
          4.2.1 Age structure .................................................................................................................................. 32
          4.2.2 Household composition .................................................................................................................. 34
          4.2.3 Housing Needs Survey ................................................................................................................... 37
          4.2.4 Bringing the evidence together: Market Segmentation ................................................................... 38
          4.3       Indicators of type of housing needed .............................................................................................. 41
          4.3.1 Housing Needs Survey ................................................................................................................... 41
          4.3.2 Transactions (Sales vs Stock) ........................................................................................................ 41
          4.4       Conclusion ...................................................................................................................................... 43
5.        Specialist Housing ..................................................................................................................................... 44
          5.1       Sheltered and extra-care housing................................................................................................... 44
          5.2       Retirement villages ......................................................................................................................... 45
          5.3       Senior Co-housing .......................................................................................................................... 45
          5.4       Multi-generational homes ............................................................................................................... 46
          5.5       Lifetime Homes............................................................................................................................... 46
          5.6       Right-sizing ..................................................................................................................................... 46
          5.7       Planning flexibility ........................................................................................................................... 46
          5.8       Lifetime neighbourhoods ................................................................................................................ 47
          5.9       Age-friendliness .............................................................................................................................. 47
          5.10      Housing for people with Dementia .................................................................................................. 48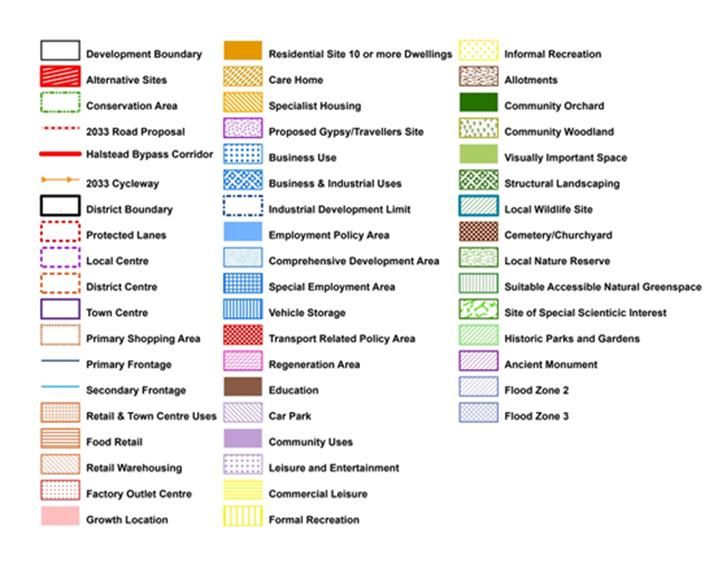
AECOM                                                                                                                                                           5

          The role of the Local Authority ................................................................................................................... 48
6.        Conclusions ............................................................................................................................................... 49
          6.1       Overview ........................................................................................................................................ 49
          6.2       Recommendations for next steps ................................................................................................... 51
Appendix A : Glossary ........................................................................................................................................... 52
Appendix B Definitions of Specialist Housing........................................................................................................ 60
          B.1       Sheltered Housing .......................................................................................................................... 60
          B.2       Extra Care Housing ........................................................................................................................ 60

List of acronyms used in the text:

AH           Affordable Housing (National Planning Policy Framework (NPPF) definition)

AMH          Affordable Market Housing

BDC          Braintree District Council

BLP          Braintree Local Plan

FPC          Feering Parish Council

GT           Gypsy and Traveller

GTAA         Gypsy and Traveller Accommodation Assessment

HNA          Housing Needs Assessment

LPA          Local Planning Authority

MHCLG Ministry for Housing, Communities and Local Government (formerly DCLG)

NDP          Neighbourhood Development Plan

NP           Neighbourhood Plan

NA           Neighbourhood Area

NPPF         National Planning Policy Framework

ONS          Office for National Statistics

PPG          Planning Practice Guidance

PRS          Private Rented Sector

SHLAA Strategic Housing Land Availability Assessment

SHMA         Strategic Housing Market Assessment
AECOM                                                                                                                        6

Executive Summary
Headlines
1.    Given the dominance of owner occupied dwellings within the neighbourhood area (NA) there is a need for Affordable
                                          1
      Housing tenures such as intermediate , affordable and social rent.

2.    There is also a significant need for small and medium sized housing of 2-3 bedrooms in the future.

3.    Finally, there is a need for additional specialist housing for the elderly in the NA totalling 33 units over the Plan
      period, which should be of sufficient size to make a dedicated scheme feasible.
Introduction
4.    Feering Parish Council is designated as a Qualifying Body (QB) and has decided to prepare a Neighbourhood Plan for
      the Parish area, referred to here as the NA. The 2011 Localism Act introduced neighbourhood planning, allowing
      parishes, town councils or neighbourhood forums across England to develop and adopt legally binding development
      plans for their NA. We have been asked to prepare a Housing Needs Assessment (HNA) by the Parish Council, based
      on a robust methodology, local data, and focussed on a number of research questions agreed with the Parish Council.

5.    As more and more towns and parish councils and forums seek to address housing growth, including tenure and type
      of new housing, it has become evident that housing policies need to be underpinned by robust, objectively assessed
      housing data.

6.    In the words of the national Planning Practice Guidance (PPG), establishing future need for housing is not an exact
                                                                      2
      science, and no single approach will provide a definitive answer . The process involves making balanced judgements
      based on the qualitative and statistical evidence gathered as well as having regard for relevant national and local
      planning policies and guidance.

7.    At a neighbourhood planning level, one important consideration is determining the extent to which the neighbourhood
      diverges from the local authority average, reflecting the fact that a single town, village, or neighbourhood almost never
                                         3
      constitutes a housing market area on its own and must therefore be assessed in its wider context.

8.    The guidance quoted above on HNA is primarily aimed at local planning authorities preparing Strategic Housing
      Market Assessments (SHMAs), which are used to determine housing need at a local authority and/or housing market
      area level. However, it helpfully states that those preparing neighbourhood plans can use the guidance to identify
      specific local needs that may be relevant to a neighbourhood, but that any assessment at such a localized level
                               4
      should be proportionate .
9.    Our brief was to advise on data at this more local level to help Feering Parish Council understand the tenure, type,
      and size of housing needed to inform neighbourhood plan policies.
PPG-based assessment
10. This objective and independent HNA follows the PPG approach where relevant. This ensures our findings are
    appropriately evidenced. The PPG advises that assessment of development needs should be thorough but
    proportionate and does not require planners to consider purely hypothetical future scenarios, only future scenarios
    that could be reasonably expected to occur.
Summary of methodology
11. HNA at neighbourhood plan level can be focused either on quantity of housing needed, type of housing needed, or
    both.

12. Feering Parish Council has been allocated a quantity of housing by Braintree District Council, which is not in dispute.
    Therefore, the issue of quantity question has been not been addressed within this report.

13. In terms of the types of housing needed, there is generally more flexibility on what neighbourhood plans can cover. In
    order to understand the types of housing needed in Feering, we have gathered a wide range of local evidence and
    distilled this into policy recommendations designed to inform decisions on housing characteristics.

1
  ‘Affordable Housing’ is the umbrella term to denote the various forms of subsidised housing; the full definition is set out on page 62
National Planning Policy Framework (consultation draft). See Glossary at the end of this document under ‘Affordable Housing’
2
  PPG Paragraph: 014 Reference ID: 2a-014-20140306 Revision date: 06 03 2014
3
  See Glossary
4
  See Glossary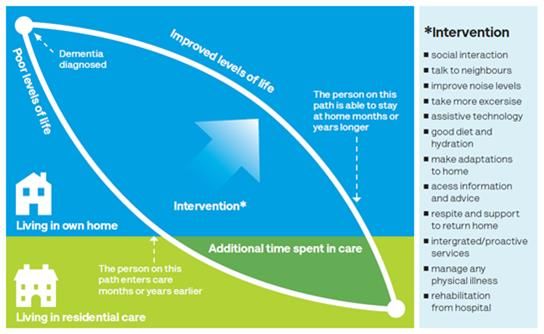
AECOM                                                                                                                      7

Focus on demand rather than supply
14. Our approach is based on best practice and is to advise on housing required based on need and/or demand rather
    than supply.

15. For this reason, we advise that the conclusions of this report should be assessed against supply-side considerations
    (including, for example, factors such as land, transport infrastructure, landscape constraints, flood risk and so on) as a
                                     5
    separate and follow-on exercise .

16. The table below outlines a summary of the factors specific to Feering NP that are considered to have an impact on the
    future housing requirements of the NA.

     Table 1. Summary of factors specific to Feering NP with a potential impact on neighbourhood plan
     housing type
     Factor      Source(s)   Possible impact on housing       Conclusion
                             needed

     Affordable       SHMA, ONS        Lead indicators (LQAR and MAR)              This HNA therefore recommends the increased
     Housing(AH)                       suggest Feering for sale dwellings are      provision of Affordable Housing across the Parish, with
                                       unaffordable in Feering. In addition, the   an additional focus on Shared Ownership6/Starter
                                       Parish has little incidence of social       Homes to reduce entry requirements to the local
                                       rented or shared ownership housing          housing market.
                                       with tenure dominated by ownership.

     Demand/need SHMA, ONS             The Feering NA has displayed signs of       Demographic trends and rising affordability ratios point
     for smaller                       an ageing population between 2001 and       conclusively in the direction of smaller homes in an area
     dwellings                         2011, which is projected to increase        dominated by large dwellings which command
                                       across the Plan period to 2030.             comparatively high prices. Therefore, the increased
                                                                                   provision of 2-3 bedroom units across the NA is
                                                                                   recommended to enable to people to find the size of
                                       Furthermore, there is evidence of
                                       demographic changes towards smaller         dwelling that is right for them and increase the
                                       households.                                 affordability of entry-level market homes.

     Demographic SHMA, ONS             The SHMA and the DCLG data indicate         This HNA highlights the existing demographic changes
     Change                            the future proportion of those aged over    across the NA and incorporates population projections,
                                       75 will increase over the Plan period.      recommending the provision of specialist housing to
                                       This exacerbates population change          cater to the needs of older people. This is advocated
                                       trends between 2001 and 2011, which         through the introduction of Life Time Homes7 design
                                       show Feering has experienced a              principles but also the introduction of housing suitable
                                       reduction of those within the 0-15 and      for smaller household sizes to encourage ‘right sizing’.
                                       24-44 age brackets and an increase in       Furthermore, following the Housing Learning and
                                       the older population.                       Improvement Network’s methodology, a total of 48
                                                                                   sheltered and extra care units across the Plan period is
                                                                                   advocated to address the needs of the Parish’s ageing
                                                                                   population.

     Family-sized     SHMA, ONS,       Census data for the Feering NA shows     This HNA recommends the greater provision of 2-3
     housing          Feering          the Parish has lower levels of           bedroom units, as well as Affordable Housing tenures, to
                      Housing Needs    dependent children, a higher proportion reduce barriers to home ownership in Feering.
                      Survey           of households without children and a
                                       larger amount of one person households
                                       aged 65 and over compared to the
                                       District.
                                       Furthermore, the NA has a higher
                                       proportional incidence of concealed
                                       families8 and a reduction in both the 0-
                                       15 and 24-44 age brackets, indicating
                                       the potential for young families to
                                       be/being displaced from the NA.

5
  Such an approach, clearly separating housing need assessment from dwelling capacity assessment, was endorsed by the Government
for calculating housing need at local authority level in the ministerial statement and press release ‘Councils must protect our precious
green belt land’ (DHCLG, 4 October 2014, available at https://www.gov.uk/government/news/councils-must-protect-our-precious-green-
belt-land)
6
  See Glossary
7
  See Glossary
8
  See Glossary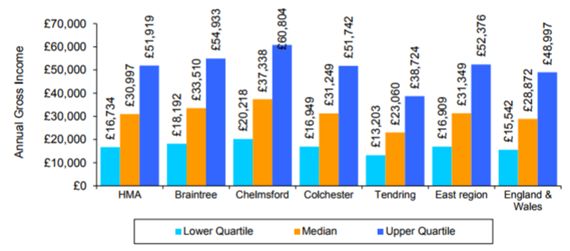
AECOM 8
17. Table 2 below indicates the different market segments, and the degree to which they are a growing, stable or declining
group within the local population. One ‘up’ arrow indicates this grouping is growing modestly in the NA; two ‘up’ arrows
indicates strong growth, three ‘up’ arrows suggests very rapid growth in years to come. Where segments are falling in
numbers, or not growing, neutral or down arrows are shown; this information is used to inform recommendations
about the overall size and tenure required within the NA.
Table 2. Market Segments
Presence in
Market segments Income range Conclusion
Plan Area
Requirement for larger homes in the
following tenures:
Young family where parents are aged 24-44 with 1+
children aged 0-15
Median
-
-
Private rental
Shared Ownership
- Affordable market housing
Requirement for larger homes in the
Professional Head of Household Young family where following tenures:
Mean
parents are aged 24-44 with 1+ children aged 0-15 - Market Housing
- Affordable market housing
Requirement for larger homes in the
Professional Head of Household family where parent following tenures:
>Mean (equity
are aged 44-64 with non-dependent children living at
rich) - Market Housing
home
Requirement for smaller homes in the
Lower Quartile following tenures:
Lone parent (with 1+ children)
(equity poor) - Social rent
Requirement for smaller homes in the
following tenures:
One person household aged under 65
Median (equity
poor) -
-
Private rental
Discount market housing
One person household aged 65+ with wealth
Median (equity
Requirement for smaller homes in the
following tenures:
rich) - Market housing
One person household aged 65+ without wealth
Lower Quartile
Requirement for smaller homes in the
following tenures:
(equity poor) - Social rent
Requirement for larger homes in the
following tenures:
- Market housing
>Mean (equity
Young couple no children - Discount market housing (e.g.,
poor)
‘Starter Homes’
- Shared Ownership
Requirement for smaller homes in the
Lower Quartile following tenures:
Concealed households
(equity poor) - Social rent
AECOM 9
Recommendations for next steps
18. This HNA has aimed to provide FPC with evidence on housing trends from a range of sources. It is recommended that
the parish should, as a next step, discuss the contents and conclusions with BDC with a view to agreeing and
formulating draft housing policies, bearing the following in mind:
it has regard to the neighbourhood planning basic conditions that will be tested at examination;
the views of BDC;
the views of local residents;
the views of other relevant local stakeholders, including housing developers;
the numerous supply-side considerations, including local environmental constraints, the location and
characteristics of suitable land, and any work carried out by the LPA to understand the capacity of the NA to
absorb housing, including but not limited to the SHLAA;
the recommendations and findings of this study;
9
the impact of the new Government proposed standard methodology on calculating housing need on the
District and its neighbourhoods;
10
The new draft NPPF .
19. Recent changes to the planning system, the new draft NPPF, as well as the implementation of the Housing and
Planning Act, will continue to affect housing policies at a local authority and, by extension, a neighbourhood level.
20. This HNA has been provided in good faith by AECOM consultants on the basis of housing data and national guidance
current at the time of writing (alongside other relevant and available information).
21. Bearing this in mind, we recommend that the steering group should monitor carefully strategies and documents with
an impact on housing policy produced by the BDC or any other relevant body and review the neighbourhood plan
accordingly to ensure that general conformity is maintained.
22. At the same time, monitoring on-going demographic or other trends over the period in which the neighbourhood plan
is being developed (factors summarised in Table 1) would help ensure relevance and credibility of its policies.
9
See Glossary. In the course of this study we provide housing needs figure based on the standard method; this is to ensure this HNA, as
and when the method is introduced with the next version of the National Planning Policy Framework, is not rendered out of date.
10
Available at:
https://assets.publishing.service.gov.uk/government/uploads/system/uploads/attachment_data/file/685289/Draft_revised_National_Plannin
g_Policy_Framework.pdf
AECOM 10
1. Context
1.1 Local context
23. Feering is a village located in a rural setting within the administrative area of Braintree District which is located within
the country of Essex in the East of England. The village, which lies at the south-west edge of the parish, is conjoined
to the neighbouring village of Kelvedon. Also within the parish are the hamlets of Skye Green and Langley Green. The
parish is located between Braintree (11 miles) and Colchester (9 miles) and is North of Witham (5.4 miles) and
Chelmsford (27 miles).
24. The A12 links Feering to Chelmsford, Colchester and Witham. The A12 also links Feering to London, which is
approximately 60 miles away.
th
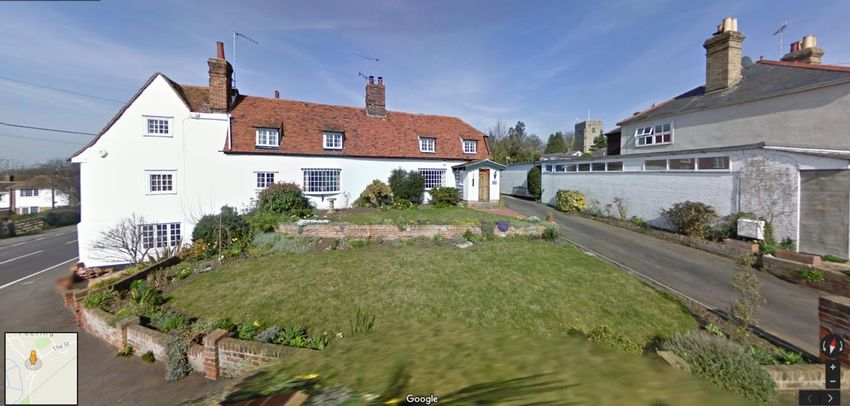
25. The NA for the Feering Parish Neighbourhood Plan (NP) was designated by Braintree District Council (BDC) on 30
March 2015; the NA covers the area of Feering Parish and is depicted in Figure 1 below.
Figure 1. Feering Neighbourhood Area
(Source: Braintree District Council)AECOM 11
1.2 Planning policy context
26. The current development plan for BDC comprises the Braintree District Core Strategy Local Development Document
which was adopted on 19 September 2011 and covers the period 2011 to 2026.
27. The adopted development plan was prepared and adopted prior to the publication of the National Planning Policy
Framework (NPPF). Following the publication of the NPPF due weight should be given to relevant policies in existing
plans according to their degree of consistency with the NPPF (the closer the policies in the plan to the policies in the
NPPF, the greater the weight that may be given).
28. The Council is in the process of preparing the new Braintree Local Plan (BLP) which is forecast to be adopted in 2018,
after which it will replace both the Core Strategy (2011) and the Local Plan Review (2005).
th 11
29. On the 5 June the Publication Draft BLP was approved for a Regulation 19 consultation to be followed by
submission to the Secretary of State for Examination-in-Public under Regulation 22.
30. Paragraph 216 of the NPPF requires that decision-takers may give weight to relevant policies in emerging plans
according to the stage of preparation of the emerging plan. Generally, the more advanced the preparation, the greater
the weight that may be given; although other factors that influence this are: the extent to which there are unresolved
objections to relevant policies (the less significant the unresolved objections, the greater the weight that may be
given); and the degree of consistency of the relevant policies in the emerging plan to the policies in this Framework
(the closer the policies in the emerging plan to the policies in the Framework, the greater the weight that may be
given). Given the advanced stage of preparation of the BLP it is reviewed within this study.
31. The Publication Draft BLP (June 2017) is formed of two parts:
Section 1 – Strategic Plan for North Essex (shared with Colchester District Council and Tendering District
Council); and
Section 2 – Policies, maps and sites for development, housing, employment, regeneration etc. within
Braintree District.
32. The Strategic Plan for North Essex sets out the objectively assessed housing need for the three local authority areas.
For Braintree this figure is 716 new homes per year across the Local Plan period 2013 – 2033. This equates to a
requirement to build 14,320 new homes for the Plan period.
33. The Spatial Strategy contained within Section 2 defines a Settlement Hierarchy which directs development towards
the most sustainable locations and provides the framework in which the Local Plan growth is provided. The settlement
hierarchy ranks areas of the District in order of their sustainability merits and the size, function and services that each
of the areas can offer.
34. Feering is included in the ‘Key Service Villages’ category. This category refers to large villages which serve a wider
rural hinterland and are able to meet day to day needs.
35. Within the BLP, Feering and neighbouring Kelvedon are treated as one key service village although they are two
separate villages which function as one, with services and facilities serving the population of both villages.
36. The Publication Draft BLP provides the following six policies which are of relevance to this HNA; these are set out
below.
37. Policy LPP17 – Housing Provision and Delivery – states that new homes will be primarily located in the Main
Towns and Key Service Villages on eight Strategic Growth Locations. Feering is a Key Service Village and has been
allocation 750 dwellings during the Plan period.
38. Each of the strategic growth locations has an individual policy to accompany it which sets out the expectations for the
delivery of the site.
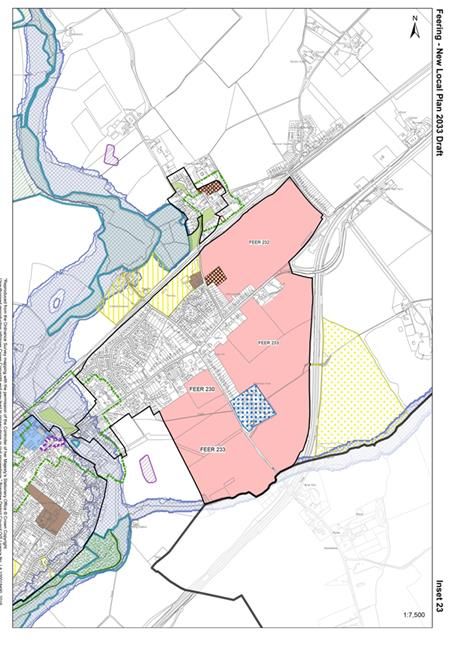
39. Policy LLP22 – Strategic Growth Location – Land at Feering. The policy has been reproduced in Figure 2 below,
750 new homes are allocated to Feering. The extent of the Strategic Growth Location at land south-east of Feering is
shown on the policies map (Figure 2 and Figure 3 below). The policy does not define a specific mix for the type, size
or tenure split of dwellings that have been allocated to Feering.
11
Second stage of the consultation process when forming a Local Plan, it includes the proposed policies for an area.AECOM 12 Figure 2. Publication Draft BLP Policy LPP22 (Source: Publication Draft BLP, 2017: pp. 61)
AECOM 13
AECOM                                                                                                      14

      Figure 3. Publication Draft BLP Key
      (Source: Braintree District Council)

40. Policy LPP33 – Affordable Housing–sets a target of 40% Affordable Housing of the total number of residential unit
    sites in all areas outside of the main towns, with a threshold of 11 dwellings or more with a maximum combined gross
    internal floor space of 1,000sqm. The policy further adds that 10% of all homes on individual sites should be
    affordable home ownership products including starter homes and shared ownership. The mix of ownership options will
    be subject to identified local needs as well as the mix of units.
41. Policy LPP35 – Specialist Housing – proposals for specialist housing provision are allocated on the Proposals Map.
    No such site has been identified on the Proposal map for Feering. New specialist housing on unallocated sites in the
    countryside will not be supported.
42. Policy LPP36 – Gypsy and Traveller and Travelling Showpersons’ Accommodation –states that pitches for
    Gypsy and Traveller accommodation will be allocated at Strategic Growth Locations although none has been allocated
    for Feering. However, additional proposals may be considered through the planning application process if additional
    need is identified in future. Policy LPP22 expects the provision for a Gypsy and Traveller site in Feering.
43. Policy LLP37 – Housing Type and Density –states that housing mix should be in line with the identified local need
    as set out in the 2015 SHMA Update unless material considerations indicate otherwise. Additionally, 2% of homes will
    be required to be available for self or custom builders on sites of 500 dwellings or more.

44. Evidence carried out for Braintree District Council by independent consultants indicates that the need for open market
    housing in the District is 4% one bedroom, 31% two bedrooms, 45% three bedrooms and 20% four bedrooms. All new
    developments are expected to meet this broad range of sizes for open-market housing.
AECOM 15
2. Approach
2.1 Research Questions
45. Housing Needs Assessments (HNAs) at neighbourhood plan level can be focused either on quantity of housing
needed, type of housing need, or both. Research Questions, abbreviated to ‘RQ’ are arrived at the start of the project
through discussion with the parish. They serve to direct our research and provide the structure for the HNA. The key
research questions can be summarised as follows:
2.2 Quantity
46. The District Council are in the process of developing the BLP; this has reached a mature stage of development, and a
Publication Draft version is available for review on BDC’s website. At the time of writing BDC has concluded the
Regulation 19 consultation before it is submitted to the Secretary of State and goes through an Examination-in-Public.
47. Policy LPP17 of the BLP deals with Housing Provision and Delivery and allocates dwellings to a number of ‘Main
Towns and Key Service Villages.’
48. Feering is defined as one such settlement, and has been set a target for homes to be delivered over BLP’s Plan
12
period of 2013 to 2033 of 750 dwellings . Given this clarity, there is no requirement within this HNA to provide FPC
with a housing needs figure.
2.3 Tenure
49. BDC have drafted a policy to guide the tenure split of forthcoming development; however, it is important to establish
whether the split as recommended is appropriate for the NA. In addition, FPC are conscious that rural poverty exists
within the NA. Given this perception of need, FPC wishes the HNA to provide an estimate of the need for Affordable
Housing in the parish, and how this may be addressed through a division of the affordable homes that arise as a result
of development into different tenures. FPC is also considering whether to develop a local connections test for eligibility
for affordable housing.
50. Moreover, given that affordable homes may neither be suitable nor available for all households, the HNA should
consider the role of market housing, both for sale and rent, in addressing need. As a result the following research
questions will be addressed:
1. What Affordable Housing (social housing, affordable rented, shared ownership, intermediate rented) and
market tenures should be included in the housing mix? In answering this affordability (based on income
levels) will be given particular attention.
2. Is there sufficient evidence of need available to support a local connection policy?
2.4 Type and Size
51. There is a perception that a misalignment exists between the distribution of sizes of dwellings in the housing stock and
the needs of the community. In particular there exists an over-supply of larger homes. A key question for the HNA is to
put forward a recommendation as to the size and type of new build homes bearing in mind demographic trends and
affordability. As a result the following research question will be addressed:
3. What type (terrace, semi, bungalows, flats and detached) and size (number of habitable rooms) of housing is
appropriate over the Plan period?
2.5 Housing for Specialist Groups
52. FPC feels that the needs of two groups within the community should be given particular attention, firstly, people
looking to ‘right-size’ into another home (people nearing retirement and older people) and, secondly, first time buyers.
The HNA will therefore consider:
4. What provision should be made for…
─ housing for older people
12
Braintree District Council Local Plan, Publication Draft for consultation, June 2017, page 54AECOM 16
Open market but smaller properties for those looking to right-size
Specialist housing (including independent living and onsite care)
─ first time buyers
…within the NA?
2.6 Study Objectives
53. The objectives of this report can be summarised as:
Collation of a range of data with relevance to housing need in Feering within the administrative boundary of
BDC;
Analysis of that data to determine patterns of housing need and demand; and
Setting out recommendations based on our data analysis that can be used to inform the Neighbourhood
Plan’s housing policies.
54. The remainder of this report is structured around the research questions set out above and Section 6 sets out our
conclusions and recommendations based on our data analysis that can be used to inform the NP’s housing policies.
2.7 Relevant Data
2.7.1 Strategic Housing Market Area
55. The PPG states that neighbourhood planners can refer to existing needs assessments prepared by the local planning
authority as a starting point. As Feering Parish NP is located within the Braintree Housing Market Area (HMA), we
therefore turned to the Braintree District Council Strategic Housing Market Assessment Update 2015 (SHMA) which
covers the housing market area (HMA) and informs emerging housing policies at a local authority level, including any
Affordable Housing policies.
56. While SHMAs are credible sources, and their statistical robustness can be assumed, their usefulness also depends on
whether the HMA that the SHMA studies address as their subject area can be used as a proxy for the NA. This
requires an assessment of the extent to which the demographic characteristics and economic trends that it identifies
are common to the NA. Shared characteristics emerge as a result of internal linkages fundamental to the notion of a
HMA.
57. PPG defines a HMA as a geographical area ‘defined by household demand and preferences for all types of housing,
13
reflecting the key functional linkages between places where people live and work.’ It goes on to remark that
‘establishing the assessment area may identify smaller sub-markets with specific features, and it may be appropriate
to investigate these specifically in order to create a detailed picture of local need. It is important also to recognise that
there are ‘market segments,’ i.e. not all housing types or economic development has the same appeal to different
14
occupants.’
58. PPG therefore sets two principle tests for identifying a functional HMA: patterns of demand for housing and
commuting relationships. The first can be denoted by the concept of ‘self-containment,’ the degree to which household
moves are ‘contained’ within a certain geographical area, and the second by ‘travel to work areas.’ It is generally
assumed that a strong HMA will show at least 70% of household moves and commuting journeys taking place within
its area.
59. The 2001 Census revealed that 74.3% of household moves were within the boundary of the Braintree District. 61.3%
of residents who live within the area also work within the boundary of the Braintree District which is relatively high for
an authority area close to London with good transport links. The data suggests that the Braintree District can be
considered to be a single market area given the degree to which household moves and ‘travel to work areas’ are
‘contained’ within the boundaries of the district.
60. Within the SHMA Braintree District has been divided into five sub‐areas outlined in Figure 5; the Feering NA is part of
the Kelvedon and Feering Ward and both are within the Southern and Western Rural Sub-Area.
13
PPG Paragraph: 010 Reference ID: 2a-010-20140306 Revision date: 06 03 2014
14
PPG Paragraph: 008 Reference ID: 2a-008-20140306 Revision date: 06 03 2014AECOM 17
Table 3. Braintree Market Sub-Area Breakdown
Sub-Areas Wards contained within
Braintree Town Braintree Central, Braintree East, Braintree South, Bocking North, Bocking South, Bocking Blackwater and
Great Notley
Witham Town Witham Chipping Hill & Central Witham North, Witham South and Witham West
Halstead Town Halstead St Andrews and Halstead Trinity
Southern and Three Fields, Panfield, Rayne Black Notley & Terling, Hatfield Peverel, Cressing & Stisted, Bradwell, Silver
Western Rural End & Rivenhall, Coggeshall & North Feering and Kelvedon
Northern Rural Bumpstead, Upper Colne, Yeldham, Stour Valley North, Hedingham & Maplestead, Gosfield & Greenstead
Green, Stour Valley South, Three Colnes
(Source: BDC SHMA 2014)
Figure 4. Ward map of Braintree District
61. The SHMA 2015 Update follows on from the Objectively Assessed Housing Needs Study (OAHN) (Peter Brett
15
Associates, July 2015) for Braintree, Chelmsford, Colchester and Tendring and forms part of the overall SHMA. The
OAHN study identified the Housing Market Area (HMA) as incorporating the aforementioned Council areas and
calculates the Objectively Assessed Need for housing across the HMA. The SHMA 2015 Update report focuses,
principally, on the calculation on the level of Affordable Housing need and the size and tenure of all dwellings required
within the overall OAHN Study. As such, it contains a number of points of relevance when determining housing need
within the NA.
15
Available at: https://www.braintree.gov.uk/downloads/file/5208/objectively_assessed_housing_need_study_july_2015AECOM 18
62. This provides a strong starting point for policy development that aims to build on and add local specificity to those of
the Local Planning Authority by enabling a comparison to be made with parish-level data (gathered as part of the
preparation of this study), given that such an exercise reveals contrasts as well as similarities.
2.7.2 Other relevant data (from LPA or NP group, e.g. housing survey)
16
63. To help supplement the research undertaken by AECOM, a Housing Needs Survey undertaken in Feering Parish
was also considered. The survey was delivered to each dwelling within the parish in January 2016. Part 1 of the
survey included questions on household composition and property type and everyone was asked to complete,
regardless of housing need but only those who were experiencing, or expecting to be in, housing need in the future
were asked to respond to part 2. Approximately 815 surveys were distributed with 220 completed or partially
completed surveys being returned.
64. In addition, BDC has also supplied housing completions data for the parish; data about the Affordable Housing
register and data about the self-build register.
16
Available at: https://www.essexinfo.net/feeringparishcouncil/assets/documents/surveyAECOM 19
3. Tenure
RQ1. What Affordable Housing (social housing, affordable rented, shared ownership, intermediate
rented) and market tenures should be included in the housing mix; in answering this affordability
(based on income levels) will be given particular attention?
3.1 Introduction
65. The provision of Affordable Housing is critical to the continuation of most communities as viable settlements; it needs,
however, to be understood in relation to other tenures. The PPG states that HNAs should investigate household
tenure in the current stock and recent supply. They should then make an assessment, based on the evidence
gathered, whether the continuation of recent trends would meet future needs or whether policies should support a
17
change to the profile of tenure within the NA’s housing stock .
66. In line with PPG, it is necessary to explain the current tenure profile of the NA. Table 4 below presents the tenure
profile of households in the NA at the time of the last Census. In 2011 owner occupied was the dominant tenure type
and there was a very low percentage of social rented tenures, particularly when compared to the District and
nationwide. The Housing Needs Survey (2016) commissioned by the Parish Council broadly corroborates the data
outlined below.
Table 4. Tenure (households)
Tenure Feering Braintree England
Owned; total 81.8% 68.6% 63.3%
Shared ownership; total 0.5% 0.6% 0.8%
Social rented; total 5.6% 16.5% 17.7%
Private rented; total 11.3% 13.2% 16.8%
(Source: ONS 2011)
67. In 2011 there were 815 households within Feering, accounting for 1.3% of the household within the administrative
area of Braintree. Most of the households were owner-occupied (667 households) and the percentage of owner-
occupation was higher within the parish than the percentage of owner-occupation at District and national levels. The
private rental sector accounted for the second largest percentage of tenure within the parish (92 households) but the
percentage of households who rent in the private sector was lower than the percentages at District and national level.
45 households were social rented which accounts for a much smaller percentage of the households within the parish
than the percentages at District and national level. Four households were shared ownership within the parish.
17
PPG Paragraph: 021 Reference ID: 2a-021-20160401AECOM 20
Table 5. Rates of Tenure change between 2001 and 2011
Tenure Feering Braintree England
Owned; total -0.1% 7.1% -0.6%
Shared ownership; total -50.0% 43.1% 30.0%
Social rented; total 15.0% -3.2% -0.9%
Private rented; total 95.7% 157.5% 82.4%
(Source: ONS)
68. In 2001 there were 777 households within the parish which had increased to 815 in 2011, an increase of
approximately 5%. In this time the percentage of owner-occupation saw a decrease from 86% of households in 2011
to 81.8% of households in 2011. This change was similar to changes at national level, although the District saw an
increase of home-ownership in the same period. Shared-ownership decreased from 1% in 2001 to 0.5% in 2011, a
reduction from 8 to 4 households. This decrease is vastly different to the changes witnessed at District and national
level which saw notable increases in this tenure. This change and difference is likely to be due to a lack of supply of
this type of tenure within Feering as well as existing households buying out of the shared ownership situation. The
private rental tenure type increased from 6% in 2001 to 11.3% in 2011 (increasing from 47 households to 92
households) and the number of households whose tenure is social rent also increased from 40 to 46 households. This
increase in percentage was greater than the change at District and national levels.
3.2 Definitional issues
69. It is necessary at this stage of the study to make clear the distinction between affordable homes as planning
terminology and the colloquial meaning of the phrase. In the course of this study, we refer to Affordable Housing,
abbreviated to ‘AH’. We mean by this those forms of housing tenure that fall within the definition of Affordable Housing
set out in the National Planning Policy Framework (NPPF): social, affordable rented and various forms of intermediate
housing. To distinguish this from the colloquial definition, we refer to the latter as Affordable Market Housing (AMH).
70. In this paragraph we briefly review the proposed reforms to the definition of AH set out in the Government’s Housing
White Paper published in February 2017. These reforms make clear its commitment to home ownership but recognise
the important role of affordable rent for those not currently seeking home ownership. The changes proposed broaden
the definition of AH to include a range of low cost housing opportunities for those aspiring to own a home, including
starter homes. Subject to further consultation, MHCLG intends to publish a revised definition of Affordable Housing as
18
part of their revised changes to the National Planning Policy Framework.
71. The Housing and Planning Act 2016 made provision for a new simplified definition of Affordable Housing as ‘new
dwellings…to be made available for people whose needs are not adequately served by the commercial housing
19 20
market’ . Secondary legislation is required to implement this definition, necessitating further parliamentary debate .
21
72. The Housing White Paper confirms that a revised definition of AH will be brought forward through changes to the
NPPF early 2018, proposing a definition as ‘housing that is provided for sale or rent to those whose needs are not met
by the market (this can include housing that provides a subsidised route to home ownership’ and which ‘meets the
22
criteria’ for one of the following models) :
Social rented housing, as currently defined, owned by local authorities and private registered providers
(usually housing associations) with guideline target rents determined through the national rent regime. It may
be owned by other persons and provided under equivalent rental arrangements, as agreed with the local
authority or Homes England (formerly the Homes and Communities Agency);
Affordable rented housing, as currently defined, and let by local authorities or private registered providers
of social housing to households eligible for social rented housing. Affordable rent is controlled at no more
than 80% of the local market rent including service charges where applicable;
18
MHCLG (2017) Fixing our Broken Housing Market (para A.119/A121)
19
Housing and Planning Act 2016, part 6, section 159 (4)
20
Section 159(2) of the Act inserts ‘(3ZB) No regulations may be made under section 106ZB [which contains the updated definition of
affordable housing] unless a draft of the instrument containing the regulations has been laid before, and approved by a resolution of, each
House of Parliament’
21
DHCLG (2017) Fixing our Broken Housing Market (para A.120)
22
https://www.gov.uk/guidance/definitions-of-general-housing-termsAECOM 21
Various forms of intermediate housing, defined to include discounted market sales and intermediate
rented housing considered affordable rented (as above) – and other housing that is ‘provided for sale and
rent at a cost above social rent, but below market levels’. Examples include:
o Starter Homes, as defined in the Housing and Planning Act 2016 constitutes a form of intermediate
housing and are expected to provide a new low cost market housing product for first time buyers
between the ages of 23 and 40 with a mortgage, sold for no more than 80% of open market value and
capped at £250,000 outside London.;
o Other discounted market sales housing, such as those eligible for Help to Buy and other shared or
fixed equity schemes, usually sold at a discount of at least 20% below market value with provision to
remain at a discount for future eligible households. Eligibility is determined with regard to local
incomes and house prices. This category also includes shared ownership housing, a form of
affordable home ownership allowing households to buy a share in a property, whilst renting the
remainder, usually from a local authority or private registered provider such as a housing association;
o Intermediate rented housing, made available for rent at a level which is usually 20% below local
market rent with provision to ensure that rent remains at a discounted level or alternative Affordable
Housing provision is made if the discount is withdrawn. This is viewed as particularly suited to the
provision of Affordable Housing in Build to Rent schemes.
73. Government also intends to introduce a requirement for sites of 10 units or more to ensure that at least 10% of all
homes are affordable home ownership products, including Starter Homes, shared ownership homes and homes
available for discount market sale. At present, it is difficult to differentiate between affordable and intermediate
rented housing, partly because this is an emerging sector, however, the Government has made clear that these
should be considered two separate tenure categories.
74. The evidence assembled to answer RQ1 seeks to populate a series of ‘key indicators’; these are the age structure
of the population, household composition and income both now and how they are forecast to change in future
years. Through a consideration of these trends and how they interrelate to each other, it is possible to arrive at
recommendations as to how not only the tenure of housing in the plan area, but also type and size should be
modified through planning policy.
3.3 Affordability
75. To understand the need for Affordable Housing (AH) in the NA it is necessary to identify the proportion of the
population who are unable to access AMH without subsidy. To do this the affordability of housing, expressed as a
multiple of household income, known as the ‘Affordability Ratio’ is considered. In addition, the income and purchase
thresholds and the extent of overcrowding are considered. The housing waiting list for Braintree District Council is also
reviewed.
3.3.1 Income
76. Income has a core effect on the level of choice a household has when determining their future accommodation. The
mean earned income for full-time employees resident (rather than household income) in Braintree in 2014 was
£34,476, according to the ONS Annual Survey of Hours and Earnings. In comparison, the regional figure was £34,185
and the national average was £32,765; both of these figures are individual incomes rather than household incomes.
77. The SHMA Update 2015 details that CACI Paycheck estimates that the mean gross annual household income in the
HMA is £38,688, which is 1.0% below the regional equivalent (£39,071) and 5.6% above the England and Wales
figure (£36,636). The same data source indicates that the mean gross annual household income in Braintree District
is £41,078.
78. Households within Braintree District are more affluent than the eastern region and also fare better than England and
Wales, see Figure 5 below.AECOM 22
Figure 5. Distribution of annual gross household income, by housing market area, local authority
area, region and national
(Source: SHMA Update 2015)
3.3.2 Affordability Ratio
79. In order to assess homeownership, which accounts for the greatest tenure type within the NA, in line with the PPG,
evidence of affordability has been examined by looking specifically at the relationship between lower quartile house
prices and incomes, using an indicator called the Lower Quartile Affordability Ratio (LQAR). This indicator is helpful
both as a way of understanding the extent to which those on lower incomes can access entry-level houses for sale
and the relative affordability of housing in the NA compared to other places.
80. Entry-level dwellings may be understood as one suitable for a household comprising two or three individuals.
Moreover, as is demonstrated in following sections, these types of household (for example childless couples, couples
with one dependent child, and lone parents) are projected to increase in the NA. In order to conform to the
23
Government’s guidance on overcrowding , such a home would require three habitable rooms (a flat or house with two
bedrooms).
81. To ascertain the value of an entry-level property in Feering, data has been drawn from the website home.co.uk. Seven
dwellings were advertised for sale in March 2018 and are set out in the table below. One is within a Grade II listed
building and is considerably more expensive than the other properties and one is for over-65’s and these two do not
offer modest family accommodation and therefore do not conform with the working definition of an ‘entry-level’
dwelling set out above and have been excluded. The mean value of the remaining five properties is £241,300.
Table 6. Value of two-bedroom dwellings in Feering (March 2018)
Property Price
Maldon Road, Kelvedon £510,000*
Rosslyn Terrace, Kelvedon £250,000
High Street, Kelvedon £250,000
London Road, Kelvedon £242,500
High Street, Kelvedon £239,000
Glebe Road, Kelvedon £225,000
High Street, Kelvedon £157,740*
Mean average £241,300
*dwellings discounted as they do not meet the definition of an entry-level’ dwelling
(Source: home.co.uk)
23
This is based in the notion of the ‘room standard’. This indicates a dwelling is legally overcrowded if two people of the opposite sex have
to share a room to sleep in (this does not apply when couples share a room).
http://england.shelter.org.uk/housing_advice/repairs/overcrowdingAECOM 23
82. The LQAR is arrived at by dividing entry level house-prices by the lower quartile household income; the higher the
ratio the less affordable an area is. Income data is not publically available but BDC’s SHMA Update 2015 details that
CACI Paycheck estimates that the mean gross annual household income in Braintree District is £41,078.
83. The Office for National Statistics (ONS) produces data which details the house price, earnings and affordability ratios
for the lower quartile and median average at Local Authority level; this data has provided the starting point for the
assessment of the affordability ratio for the District and the NA.
84. Feering Neighbourhood Plan Steering Group commissioned a Housing Needs Survey in 2016 which had a good
response rate of 27% and of those respondents 18% completed Part 2 relating to households in housing need. The
survey provides an indication of gross monthly income for new households. In answer to question 11 on income, 25
(modal average) responded that their household had a gross monthly income of £1,501 - £2,000 (annualized to
£18,012 - £24,000); the mid-point of this range is £21,006 and this information has been fed into the Table below to
verify the use of the lower quartile gross income for Braintree District as detailed within the ONS data.
85. Table 7 sets out the Affordability Ratio for Feering and for Braintree District; 11.84 and 10.17 respectively. The
Affordability Ratio for Feering is higher than the Affordability Ratio for the wider District; both are very high which
indicate a problem with affordability at both NA and District levels.
Table 7. LQAR Braintree District and Feering NA
Feering Feering Braintree
(Lower quartile income for (income from Feering Housing (Lower quartile income for
Braintree District from ONS) Needs Survey) Braintree District from ONS)
Lower quartile income £20,363 £21,006 £20,363
Lower quartile house price £241,300 £241,300 £207,000
Affordability ratio 11.84 11.48 10.17
(Source: ONS, Feering Housing Needs Survey, AECOM calculations)
3.3.3 Income threshold
86. Income threshold is the required level of income (per annum) to rent in the private rental market. Income threshold
has been calculated on the assumption that rent may account for approximately a third of a household’s gross annual
income. The first step is to identify the average rental income for the NA.
87. The current rental market was reviewed using the websites Home.co.uk and Rightmove.co.uk. The search revealed
that there are no dwellings with one bedroom to rent in the NA but there are two no. two bedroom dwellings to rent
which are available for £725pcm (Feering Hill, Feering) and £800pcm (Bridge Meadow, Feering). Given the lack of
dwellings with one bedroom, it is considered appropriate to calculate income threshold on the basis of dwellings with
two-bedrooms. The mean average of the two dwellings with two bedrooms available for rent within the NA is £762.50.
88. Home.co.uk provides a rental price analysis for Braintree District based on the advertised rents for homes to let,
calculated daily from the rental properties found by the Home.co.uk Property Search Engine. The data in Table 8 was
based on 43 two-bedroom properties to rent on 30th April 2018.
Table 8. Income threshold Braintree District and Feering NA
Braintree District Feering
Average rent for a two bedroom £799pcm £762.50pcm
dwelling
Annual average rent for a two bedroom £9,588 £9,150
dwelling
Income threshold £28,764 £27,450
(Source: AECOM calculations)
89. Table 8 outlines the income threshold required for households to access dwellings with two bedrooms within Braintree
District and the Feering NA. The data shows that the income threshold is currently slightly higher across the District asYou can also read