The Fundamental Valuation of Canopy Growth Corporation - bibsys brage
←
→
Page content transcription
If your browser does not render page correctly, please read the page content below
Norwegian School of Economics
                                                                            Bergen, Spring 2018

       The Fundamental Valuation of
        Canopy Growth Corporation
                  Finding value in the haze of legalization

                                    Olivier Côté

                      Supervisor: Prof. Carsten Bienz

Master thesis, MSc Economics and Business Administration, Finance

        NORWEGIAN SCHOOL OF ECONOMICS

This thesis was written as a part of the Master of Science in Economics and Business
Administration at NHH. Please note that neither the institution nor the examiners are
responsible − through the approval of this thesis − for the theories and methods used, or
results and conclusions drawn in this work.
2
Contents
CONTENTS ........................................................................................................................................... 2
1. EXECUTIVE SUMMARY ........................................................................................................... 5
1.1 ACKNOWLEDGEMENTS: ........................................................................................................... 6
1.2 AUTHOR’S NOTE: ..................................................................................................................... 6
1.3 PREFACE ................................................................................................................................... 7
2. INTRODUCTION: ........................................................................................................................ 8
2.1 COMPANY PROFILE: ................................................................................................................ 8
2.2 CANNABIS INDUSTRY: ............................................................................................................ 12
2.3 HISTORICAL PERSPECTIVE OF THE MEDICAL MARIJUANA SEGMENT: ............................... 13
2.4 LEGALIZATION OF CANNABIS AND CAPITAL MARKETS: ...................................................... 16
2.5 SALE OF RECREATIONAL CANNABIS ..................................................................................... 17
2.6 MARKET DYNAMICS:............................................................................................................... 21
2.7 MARKET CONSOLIDATION:.................................................................................................... 22
3. METHODOLOGY ...................................................................................................................... 23
3.1 ABSOLUTE VALUE APPROACH:.............................................................................................. 23
3.1.1 Dividend Discount Model ............................................................................................... 23
3.1.2 Discounted Cash Flow Model ........................................................................................ 24
3.1.3 Frameworks of DCF Valuation: ..................................................................................... 26
3.1.4 Weighted Average Cost of Capital (WACC – methods) ................................................. 26
3.1.5 Adjusted Present Value (APV – Method) ....................................................................... 26
3.2 RELATIVE VALUE APPROACH: .............................................................................................. 27
3.3 MODEL SELECTION: .............................................................................................................. 28
4. CANOPY GROWTH CORPORATION COMPANY ANALYSIS ........................................ 293
4.1 COMPETITIVE ENVIRONMENT:.............................................................................................. 29
4.2 SWOT ANALYSIS: ................................................................................................................. 29
4.2.1 Strengths: ....................................................................................................................... 29
4.2.2 Weaknesses: ................................................................................................................... 30
4.2.3 Opportunities: ................................................................................................................ 30
4.2.4 Threats: .......................................................................................................................... 31
4.3 PURCHASE ORDERS ................................................................................................................ 31
4.4 FINANCIAL SUMMARY ........................................................................................................... 33
4.4.1 Balance Sheet: ................................................................................................................ 34
4.5 KEY PERFORMANCE INDICATORS ......................................................................................... 36
4.5.1 Average Price per gram: ................................................................................................ 36
4.5.2 Cash Cost of Production per gram: ............................................................................... 37
4.6 ADJUSTMENTS TO FINANCIAL STATEMENTS ......................................................................... 38
4.6.1 Non-Cash Expenses – Fair Value measures of Biological Assets ................................. 39
4.6.2 Operating Expenses – Employee Stock Options ............................................................ 41
4.6.3 Adjustments to Net Working Capital .............................................................................. 42
5. FORECASTING .......................................................................................................................... 43
5.1 REVENUE – RECREATIONAL MARKET .................................................................................. 43
5.2 REVENUE – MEDICAL MARKET ............................................................................................ 46
5.3 REVENUE – CONSOLIDATED .................................................................................................. 46
5.4 COST OF GOODS SOLD ........................................................................................................... 47
5.4.1 COGS – Recreational ..................................................................................................... 47
5.4.2 COGS – Medical ............................................................................................................ 48
5.5 OPERATING EXPENSES .......................................................................................................... 494
5.5.1 Sales & Marketing Expenses .......................................................................................... 49
5.5.2 R&D Expenses:............................................................................................................... 49
5.5.3 General & Administrative Expenses: ............................................................................. 49
5.5.4 Acquisition expenses: ..................................................................................................... 50
5.6 NOPLAT ................................................................................................................................ 51
5.7 FREE CASH FLOWS: ............................................................................................................... 52
5.7.1 Delta Net working Capital: ............................................................................................ 52
5.7.2 Capital Expenditures ...................................................................................................... 52
6. DCF VALUATION ...................................................................................................................... 55
6.1 DISCOUNT RATE ..................................................................................................................... 55
6.2 ENTERPRISE CASH FLOW DCF VALUATION: ....................................................................... 58
6.3 APV METHOD ........................................................................................................................ 59
6.4 ANALYSIS ................................................................................................................................ 60
6.5 RECOMMENDATION ............................................................................................................... 61
7. BIBLIOGRAPHY ........................................................................................................................ 62
8. ANNEX 1: IAS 41 REGULATION ............................................................................................ 65
8.1 ANNEX 2 .................................................................................................................................. 68
8.2 ANNEX 3 BASE OF FINANCIAL MODELS .................................................................................. 695 1. Executive Summary The purpose of this Master’s thesis is to perform a fundamental analysis of Canopy Growth Corporation (TSX: WEED), analyse the Canadian cannabis industry and provide a valuation of the company as at the 31.03.2018, and ultimately offer an investment recommendation for a hypothetically well-diversified investor. The Canadian government has announced that it will be opening the recreational marijuana industry by the summer of 2018. The prospect of legalization has cause a gold rush towards the industry, leading to high levels of investment and market consolidation. Licensed producers have been racing to increase capacity to both compete in the market and become least cost producers. Canopy has followed the trend, conducting M&A transaction and building several new production facilities that will ensure they are the largest producer. The company presented strong growth in the medical market however the upside prospects of the recreational market far out weigh those of their current operations. The analysis also included I a study the cannabis market in the state of Colorado as a proxy for determining growth patterns following legalization of cannabis. A central component to the market analysis was determining the overall market size, which still remains ambiguous as most data comes from self-reported, and biased sources. Furthermore, I found that IFRS accounting standards lead to miss representation of financial statements and pose problems to identifying value for the uninitiated. The valuation of the company was primarily based on two DCF models, one Enterprise Cash Flow model and the other a Adjusted Present Value analysis. Based on a potential 20% market share assumption and an estimated price per gram of $7. The company can be valued at approximately $6B CAD, I have identified a target price of $32.64. This ultimately leads us to offer an investment thesis recommendation of Hold or cautious Buy for a well- diversified risk liking investor.
6

1.1 Acknowledgements:
The completion of my academic work at NHH would not have been possible without the
guidance and support of my friends and family. I would like to take a moment to thank my
thesis supervisor Prof. Carsten Bienz as well as my colleague and dear friend Sebastiano
Pescarolo, who I had, somewhat unfruitfully, attempted to write several other academic
works with.

1.2 Author’s note:
This Master’s thesis does not present any stance on the moral and legal implications of the
sale, and or consumption of Cannabis as it remains prohibited in many parts of the world.
Any or all indications of the contrary do not reflect the views or policies of the Norwegian
School of Economics, and or my supervisor. The goal of this academic work was to present
an objective valuation of a publicly listed company in a novel and poorly documented
industry, as well as contribute to academic research on the topic.
7

1.3 Preface
This paper represents the culmination of my academic career. With it, I hope to provide a
comprehensive work that leverages all aspects of my education to date. In my Master’s
program at NHH I have specialized in finance, and I believe that the best way for me to
synthesize what I have learnt over these past years is to conduct an in-depth fundamental
valuation of a public corporation.

The reason why I have chosen Canopy Growth Company, as the topic of my thesis is simple.
Being both a Canadian and someone that is extremely interested by niche markets, the
medical marijuana industry presented a unique opportunity to explore an under studied
industry and the impact of legalization on valuations in capital markets. An important home
country bias and Canopy being the largest player in the market made the choice quite simple.

This being said, there are many factors that must be addressed relating to this academic
work. Due to the developing nature of the legal framework surrounding cannabis producers
in Canada, some of the points presented in this paper may have evolved by the time you are
reading this. For this reason I will be basing my research on all public information available
as of March 31st, 2018.

Montreal, Canada

June 20th, 2018

Olivier Côté
8

2. Introduction:

2.1 Company Profile:
Canopy Growth Corporation, “Canopy” or the “Company”, formerly named Tweed
Marijuana Inc., is one of Canada and the world’s leading producers of medical cannabis. The
Company was the first licenced producer in Canada to go public in 2014 and is currently
traded on the Toronto Stock Exchange (“TSX”), listed under the symbol WEED. Since its
creation, Canopy has grown from a producer of simple medical marijuana into a vertically
integrated company with operations ranging from growing of cannabis plants, to the
transformation and processing of the plants into various consumer goods. The Company
currently only sells medical marijuana products as the recreational consumption for weed is
still prohibited in Canada, as the new Canadian Cannabis Act has yet to come into force
(expected date of July 1st, 2018). As at the 28th of March 2018, the company had a market
capitalization of $6.8B CAD and a price per share of $33.66 CAD.

Fig1: Canopy stock price between April 1st, 2014 and March 28th, 2018

Source: Capital IQ

In the past year, Canopy’s share price has increased by more than 300% in the wake of the
end of cannabis prohibition.
9

                  Fig2 : Operating Subsidiaries

           Controlled or jointly controlled subsidiaries

                                       %
Name                              Ownership        Accounting

Tweed                               100.0%         Consolidated

Tweed Farms                         100.0%         Consolidated

Bedrocan                            100.0%         Consolidated

Spectrum Cannabis                   100.0%         Consolidated

Tweed Grasslands                    100.0%         Consolidated

Mettrum Hempworks                   100.0%         Consolidated

Group H.E.M.P.                       75.0%         Consolidated

Spektrum Cannabis                   100.0%         Consolidated

Vert Cannabis                       100.0%         Consolidated

Bodystream                          100.0%         Consolidated

"Apollo"                            100.0%         Consolidated

Spot Therapeutics                   100.0%         Consolidated

Spectrum Chile                       85.0%         Consolidated

Tweed JA                             49.0%         Consolidated

Canopy Rivers                        34.1%         Consolidated

Spectrum Cannabis Denmark            62.0%         Consolidated

Vert Mirabel                         66.7%         Consolidated

BC Tweed                             66.7%        Jointly operated

Source: Canopy Q3, 2018 Financial Statements
10
Canopy currently has 18 distinct subsidiaries or affiliated business ventures, mainly
concentrated in Canada. Currently, the bulk of Canopy’s production is retained for the
Canadian market, as the export of cannabis and its derivatives remains extremely difficult.
However, the Company has been able to establish agreements to export medicinal products
to Australia, Germany and Brazil, and several of their subsidiaries are also located abroad
(Canopy Growth Corporation, a 2018).
Canopy Growth Corporation aims to become the leading cannabis company in the world and
is relatively agnostic in which form the Company will sell it. Canopy’s core brand remains
Tweed, which offers dry, easy to consume and soft-gel products. The Company is looking to
expand Tweed into a lifestyle brand through aggressive marketing and an innovative social
media presence. Canopy has also developed a premium brand, Black Label, as well as other
brands whose product lines will remain focused solely on medical markets.
Canopy has grown its production both organically, with growing facility expansions, and
through acquisitions in the last four years. In fact, since it’s listing on the Toronto Stock
Exchange, Canopy has acquired 17 other firms for a total value of $514M CAD1. The
company currently operates 7 facilities totalling 728,000 square feet and currently have 8
development projects, slated to come into operations by 2019, that would add another
4,932,000 square feet of production space
1
Capital IQ data retrieved April 21st
2
Macroeconomic analysis report on Cannabis.11
Fig3: Canopy Growth Operating Facilities
Approximate Anticipated
Facility Type Status
size (Sq ft) completion
168,000 sq ft licensed +
Smith Falls, ON Indoor 450,000 CY 2018
Development Project Underway
Niagara-on-the- Hybrid 168,000 sq ft licensed +
1,000,000 CY 2018
Lake, ON Greenhouse Development Project Underway
British Hybrid
1,300,000 Development Project Underway CY 2018
Columbia, site 1 Greenhouse
British Hybrid
1,700,000 Development Project Underway CY 2018
Columbia, site 2 Greenhouse
Hybrid
Mirabel, QC 700,000 Development Project Underway CY 2018
Greenhouse
Newfoundland Indoor 150,000 Potential Sites Being Evaluated CY 2019
Edmonton, AB Indoor 100,000 Development Project Underway CY 2019
New Brunswick Indoor 50,000 Development Project Underway CY 2018
Yorkton, SK Indoor 60,000 Licensed
Bowmansville,
Indoor 75,000 Licensed
ON
Creemore, ON Indoor 15,000 Licensed
St. Lucien, QC Indoor 10,000 Licensed
Scarborough,
Indoor 50,000 Licensed
ON
Total 5,660,000
Source: Canopy Q3, 2018 Financial Statements
In February 2018, Canopy announced that it successfully completed an over-subscribed
treasury share offering on the Toronto stock exchange, raising $250M CAD. The proceeds of
this stock offering will be primarily be used to fund financing growth projects over the next12 18 months, according to Jordan Sinclair, the Company’s communications director. Canopy’s current strategy is to focus both on domestic and international expansion through acquisitions and development of production sites. The funds raised are central to Canopy’s continued operations, as the Company remains highly unprofitable to this day. 2.2 Cannabis Industry: Firstly, one must define the industry in which Canopy Growth Corporation falls into. Considering Canada is the first G20 nation to be legalizing recreational marijuana use on a national scale, the industry finds itself at a crossroads, and essentially in uncharted territory. For this reason, the majority of this analysis shall be based on the assumption that marijuana producers will naturally diversify their operations and expand to the recreational market. As such, the cannabis industry can be composed of two distinct segments: Medical and Recreational, both part of a single overarching industry. Secondly, defining what kind traditional market cannabis producers most resemble can be difficult, as they present characteristics of several current industry sectors. At their inception, marijuana producers, also know as “Licenced Producers” or “Growers”, have been categorized as “Pharmaceutical” companies, given their end product is in fact a form of medication and is controlled similarly to a restricted substance. This classification is mostly used by the financial industry. However, these businesses do not operate as normal pharmaceutical producers and resemble much more agricultural firms with high levels of perishable inventories and large, physical infrastructure. As such, marijuana producers have different reporting standards under IFRS that have cause much confusion in the market (Owram 2018) than a pharmaceutical company and cannot be valued as such. In essence, marijuana producers in Canada are the creators of a new market segment with the distinct characteristic of several industries, which is why cannabis should be considered its own specific industry. The strict production standards and regulatory environment closely mirror the pharmaceutical industry. Their operations can only be classified as being an agricultural commodity business as dry bulk cannabis is grown, harvested and processes like any other crop business would be. Where licenced producers differ from agricultural firms is in the processing of their crops. In essence, dried cannabis is a commodity crop with low costs of
13

production and a relatively low value. This is why producers have branched out into the
production of value added products and the design of new derivatives of the cannabis plant.
The extraction of the chemical compounds tetrahydrocannabinol (THC) and cannabidiol
(CBD) have allowed companies to infuse food, cosmetics, supplements and a wide array of
other value added products with the desired cannabinoid properties. Producers have
recognized this reality and have diversified their operations to take full advantage of these
opportunities. They have, over the past several years, gone through an acquisition spree and
made forays into the consumer goods segment. While these products are currently
considered controlled substances and are only sold to patients holding a medical
prescription, they will be available to the general population and the adult consumer market
following the opening of the broader Canadian market. This explains why vertically
integrated marijuana producers should be categorized as their own industry within the
consumer staple sector, similarly to tobacco, food or alcohol companies.

Understanding how these firms operate is crucial to determining the companies overall
operating risks and their idiosyncratic risk with regards to financial market. This analysis
will be touched upon during financial modeling as it is key to determining the company and
industry’s over all beta.

The Canadian Government has determined that the operations of cannabis producers warrant
their own industry classification and that this new cannabis industry should be included in
the country’s national accounts. The cannabis industry will now feature in the Canadian
System of Macroeconomic Accounts and contribute to the country’s Gross Domestic
Product. (Statistics Canada 2018).

2.3 Historical perspective of the Medical Marijuana
    segment:
The use of cannabis, varietals of hemp containing psychoactive ingredients such as THC and
CBD, has been outlawed in Canada since the 1920’s following the creation of the Narcotics
Drug Act Amendment Bill. This specific piece of legislation prohibited the used of most
major drugs such as marijuana, cocaine, opium, heroine, etc (Rough 2017).

During the tail end of the 1960’s, the Canadian federal government commissioned the Dain
Commission to study the effects of Non-Medical drug use. The commission’s findings
14 pointed towards the possible benefits of decriminalization of cannabis; however no legislative actions were undertaken. In 2000, a court ruling from the Ontario court of appeals overturned a previous decision and rendered the prohibition of cannabis unconstitutional, as it constituted a form of medical treatment for the respondent, and in such limiting the drug’s access infringed upon the claimant’s constitutional rights to healthcare. In 2001, the Canadian Government enacted the Marijuana for Medical Access Regulation, which in short granted medical patients access to grow their own medical marijuana or to purchase it from licenced growers. And so, a new industry was born. Since then, medical use of cannabis has also grown throughout the European Union, Israel, Australia and a majority of US States. The industry has grown to a thriving industry (Canopy a 2018). In the 2013, the Canadian government allowed private enterprises to participate in the production of cannabis for medical purposes leading the way to the founding of companies such as Canopy, Aurora and the other major players in the newly formed industry. As of the end of the calendar year 2017, the number of Canadians using medical marijuana may represent less than 1% of adult Canadians, however the industry has seen strong growth according to research conducted by the Canadian government. In December 2017, there were 269,502 registered consumers, compared to 174,503 at the start of the year, an increase of 54%. The Associated Press (2012) reported that Health Canada estimated the market will eventually grow to 450,000 people by 2024.
15

Fig4: Number of Registered Medical Cannabis Consumers

Source: Data compiled from Health Canada reports.

By volume, sales of medical dried cannabis increased 614%, growing from 2,772kg to
19,780kg between 2014-2015 and 2016-2017. Furthermore, Health Canada reports 2017-
2018 is also poised to outpace previous years as medical marijuana sales for the first 9
months were 18,143kg. The volume of cannabis oil has seen an even more astounding
growth going from 584kg in 2015-2016 to 13,702kg in 2016-2017, with sales for the first 9
months of the present reporting year passing volumes of dried cannabis at 23,137 kg. At an
average price of $7.6 per gram of dried weed and weed equivalents, that put the value of the
Canadian market around $400M CAD for 2017-2018 Health Canada’s estimates the total
market size to grow to $1.3B CAD by 2024 according to the Associated Press (2017).
16

Fig 5: Medical Canabis Sales by Volume

Source: Data compiled from Health Canada

2.4 Legalization of Cannabis and Capital markets:
The Liberal government of Canada, in 2016, announced its plan to legalize marijuana for
recreational use. This legislation has been in the works for the last 2 years, and if all goes to
plan, the consumption, production and transformation of cannabis for recreational purposes
will be legal in Canada by July 1st 2018, just in time for the 151st Canadian national day. This
deadline may be rather optimistic given the current progress the aforementioned regulation
in the Canadian Senate.

The proposed new law, The Cannabis Act, would change the status of plants of the Cannabis
genus from controlled substances under the Canadian Controlled Substances Act (CDSA)
and would permit the sale, possession and consumption of pot, and marijuana derived
products by people over the age of 18. The current medical marijuana regulation would
remain unchanged (Government of Canada 2017).
17

2.5 Sale of Recreational Cannabis
The sale of dry cannabis buds, oils, and various other derivatives and infused products will
be permitted to all Canadians over the age of 18, or 19 depending on the province of sale,
similarly to alcohol. The organization of the sales infrastructure and regulation will be
attributed to the different provinces and territories of Canada. This, in theory, means the
Canadian market is opened to roughly 28 million consumers scattered from one ocean to
another. Asserting that the market for cannabis is composed of the entire adult population is
rather misleading. A survey conducted by the Canadian Government (c 2018) found that
roughly 12% of the population consumes cannabis for recreational purposes already. This
statistic however, should present several issues, including the fact that it was based on self-
identification surveys, which inherently include high levels of bias. The legalization of these
products should lead this number to increase significantly but one should not include the
entire population in this estimate.

Through provisional provincial legislation, we now know that most Canadian provinces will
be regulating the sale of cannabis through government run enterprises, most of which are
linked to their provincial liquor boards. These provincial crown corporations will be
responsible for purchasing cannabis products from the Licenced Producers and will then
distribute it throughout their respective jurisdictions. Both Quebec and Ontario, Canada’s
most populous provinces have limited the sale of cannabis through their government run
stores and capped the number of initial stores to ensure orderly roll out of the new products.
In Alberta and BC, however, the provincial boards will allow the sale of cannabis in private
stores but will still retain their role of distributor to these stores according to the CBC
(2018).

What this indicates is that currently, the most important growth factor for Licensed
Producers is their ability to win purchasing agreements with provincial regulators. This
implies two things, the first of which is that high levels of compliance with regulators are in
everyone’s best interests. And two, being a least cost supplier is crucial to growth strategies,
as most governmental contracts are attributed according to strict rules, which fundamentally
ends up being tied to price. This being said, each province will be allocated and controlling
their purchasing separately will make it even harder to estimate sales growth for any given
player within the market. It is also possible that provinces will support LPs with local
production facilities, which would help to support local economies. This can favour larger
18

producers who have the resources to build greenhouses across the country. Furthermore, all
sales by licensed producers are going to be on a wholesale basis, which translates to
significantly lower margins for the Licensed Producers than if they had the option to have
their own retail locations.

Fig 6: Provincial Cannabis Regulation Breakdown

                                                  Number of           Governmental       Private      Online
                    Population    Legal age
                                                 retail outlets          outlets         Outlets      Sales

 Alberta             4,300,000             18          no limit                    Yes        Yes        Yes

 British
                     4,800,000             19                                      Yes        Yes
 Columbia

 Saskatchewan        1,200,000             18

 Manitoba            1,300,000             19                                      Yes        Yes

                                                 40 and 150 by
 Ontario                                   19                                      Yes         No        Yes
                    14,200,000                             2020

                                                 15 and 150 by
 Quebec              8,400,000             18                                      Yes         No        Yes
                                                           2020

 New Brunswick        760,000              19                 20                   Yes         No        Yes

 Nova Scotia          954,000              19                                      Yes         No        Yes

 Prince    Eduard
                      152,000              19                                      Yes         No        Yes
 Island

                                                                                         Yes down
 Newfoundland         529,000              19                                      Yes                   Yes
                                                                                           the line

 Yukon                 39,000              19                     1                Yes        Yes        Yes

 Northwest
                       45,000              19                                      Yes        Yes        Yes
 Territories

                                  Expected to
 Nunavut               38,000                               N/A                N/A            N/A       N/A
                                 be prohibited

(Data from: Associated Press & BNN)
19 The Province of Quebec has come out as one of the first provinces with a real purchasing strategy. They will be allocating nearly 62,000kg of Cannabis to 6 different LPs. The stipulations of these agreements have not all been made public however, recurring information seems to indicate that the LPs have agreed to base purchase quantities and fixed durations of possibly 3 years (Rendell 2018). This can give us a base indication as to the possible initial size of the Canadian Cannabis market as the province of Quebec does represent nearly a quarter (22,87%) of the Canadian population. This would put the total volume of the Canadian market around 271,000kg. Industry analysts (Shenfeld 2016 p.7), however estimate the market to be somewhere in the rage of 770,000 kg. It is important to note that all products will have to be sold in generic packaging, similarly to tobacco products, to dissuade young consumer and minors from smoking. However, this regulation will be less stringent than it is for the tobacco industry. This will have an important impact on how firms differentiate themselves from the rest of the industry (see competitive landscape section). With regards to dry bulk cannabis, as previously mentioned, is a commodity product, meaning firms will need to either invest in R&D to develop specific new varietals with different properties, or will need to become least-cost to win over the recreational consumers. In fact Ouellet, Macdonald, Bouchard, Morselli & Frank (2017) found that cannabis consumers displayed price sensitivity. Their results demonstrated that the Canadian market has price elasticity of demand between -0.42 and -0.60, meaning that a 10% variation in price would lead to an inverse movement of demand between 4% and 6%. When considering this and the fact that marketing initiatives are will be limited due to Bill C-45, on cannabis packaging, the risk of substitution is quite high. The Canadian Government conducted a comprehensive study in 2017, and estimated the total value of the cannabis industry in Canada to be worth roughly $5.7B CAD. Others place the value of the market between $4.9B and $8.7B (depending on average price per gram) and that the economic windfall considering all ancillary industries linked to cannabis production (infrastructure construction, testing labs, security services) would be in the range of $12B to $22B CAD (Deloitte 2017). To put things into perspective, these estimates place the cannabis industry on par with the Canadian spirits market. A gold mine of sorts for both government revenues and market potential. Another proxy for estimating the direction of the Canadian market could be to analyse the recreational market in US states that have legalized cannabis. In the Public Safety Canada
20

report “Price of Cannabis in Canada”, the authors (Ouellet, Macdonald, Bouchard, Morselli
& Frank 2017) base themselves heavily on data collected by US governmental agencies to
establish market trends and characteristics that could be applicable to the Canadian market.
Therefore a relevant example could be Colorado, the first state to fully legalize recreational
cannabis in 2014. Despite having a population of approximately 5.6M people, (Government
of Canada d 2017) it represents one of the only sample market that has collected enough
information on the industry to present actual trends. Data compiled by the Department of
Revenue of Colorado shows that the recreation sales presented a 53% annual compounded
growth rate between 2014 and 2017 (Government of Colorado 2017). Furthermore, their data
indicated that medical sales had started to stabilize and even decrease throughout the
observed period. This is indicative that perhaps, medical users switched to legal cannabis
due to its higher availability and the increased variety of products in the market.

Fig 7: Marijuana Sales in Colorado

Source: Colorado Department of Revenue
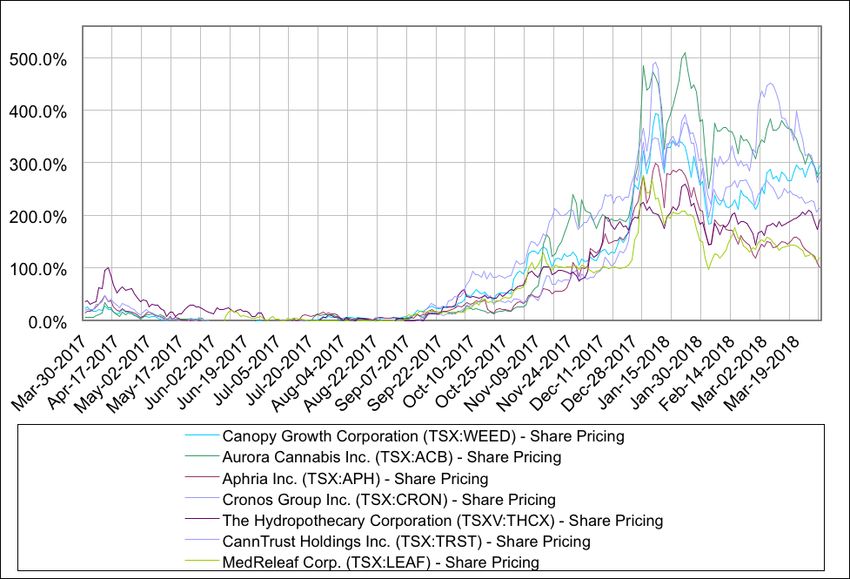
21

2.6 Market Dynamics:
The cannabis industry today has two distinct types of licenced producers within the market.
The first model being the large licensed producer. LPs will be vying for the main share of the
market, producing a wide range of products in high volumes with the goal of being least cost
producers. Their product being a commodity, their growth depends on the growth of sales as
a whole and the reduction of their operating costs. These producers face risks linked to steep
competition and price volatility, as well as contract attribution by the provincial governments
who will buy the products.

The second model is that of the niche or specialized producer. These are LPs that cannot
compete on scale but look to differentiate themselves through specialized products, which
would garner high sales prices. These niche producers, face many risks through competition
and also face the risk of being acquired by their larger competitors.

Canopy falls under the Large LP category. Their main competitors within the market are
Aurora Cannabis Inc. (TSX: ACB), Aphria Inc. (TSX:APH), MedReleaf Corp.
(TSX:LEAF), CannTrust Holdings Inc. (TSX:TRST), Organigram Holdings Inc.
(TSX:OGI), The Hydropathecary Corporation (TSX:THCX), and Cronos Group Inc. (TSX:
CRON).

The prospect of full legalization has sent an incredible influx of investment into the market.
Cannabis producers have seen considerable growth in market value over the past year, with
an average increase in share price of 211.8% among the largest producers. Once a novel
investment vehicle, weed stocks, as they are colloquially known, have gained investor
support and are more popular than ever2.

2
 Macroeconomic analysis report on Cannabis.
ttps://www.baystreet.ca/articles/research_reports/fundamental_research/Canadian-Marijuana-Industry-Overview-Final.pdf
22

Fig 8: Stock returns of the top 5 listed Licenced Producers, by market capitalization, between
March 30th, 2017 and March 29th, 2018:

Source: CapitalIQ – compiled by Author

2.7 Market consolidation:
These large players have also adopted the strategy to grow through acquisitions. In fact,
Canopy’s largest competitor, Aurora, has conducted 7 acquisitions since its original listing
on the TSX (a reverse take-over of Prescient Mining Corp in 2014) totalling $1.49B CAD.
The most notable of which was the take-over of CanniMed Therapeutics, Inc. valued at
$1.11B CAD, the largest acquisition in the market to date, according to CISION Newswire
(2018). This shows that even some of the largest LPs are not safe from take-over bids.
Aurora is positioning itself to be the largest producer in the market. This not only allowed
them to acquire an established customer base of medical cannabis clients but also to increase
their production capacity.
23

3. Methodology
There exist several ways many ways to evaluate the value of a publicly traded company.
These techniques theoretically take into account all publicly available information to
determine a fair value for an enterprise currently traded on a stock exchange. Financial
theory identifies two major approaches to stock valuation: fundamental valuations and
relative valuations.

3.1 Absolute Value approach:
Absolute or intrinsic value approaches take into account the firm’s distinct financial
performance and characteristics such as dividend rates, growth, cash flows, retained
earnings, etc. Through this approach one can use several other models to arrive at a valuation
estimate for the shares of the company. The most common techniques include the dividend
discount model (DDM), discounted cash flow model (DCF) and asset based valuations.

3.1.1 Dividend Discount Model

Dividend Discount Models quite simply discounts the future dividends paid out by the firm
to determine its fundamental value to an investor. The accuracy of this model is predicated
on the analyst’s ability to predict future dividend policies for the firm and the appropriate
discount rate to use. DDMs are rather unreliable as not every company pays out dividends
nor can future dividend policies be forecasted. This model should not be utilised given the
current exercise.

In the case of Canopy and marijuana producers, DDMs would prove highly ineffective
seeing as they are companies focused on growth. Firms in that stage of the lifecycle, such as
Canopy and its peers, are highly unprofitable, as well most of them are still raising capital to
fund their on going operations. Koller, Goedhart and Wessels (2015)3, indicate as well that
Dividend policies are also a signalling mechanism to investors that management no longer

3
 Koller, Goedhart and Wessels, “Valuation, Measuring and Managing the Value of Companies”University Edition”,
Mickensey & Company, USA, page 98.
24

believes in its ability to conduct value-creating projects. DDMs should therefore not be used
with regards to valuing a growth stock such as Canopy.

3.1.2 Discounted Cash Flow Model

The DCF looks to calculate the present value of future cash flows. The reasoning behind this
being that a firm’s value is the Net Present Value (NPV) of its future cash flows. This
methodology allows for detailed modeling of cash flows, which represent the key value
driver when determining the value of a firm. There are however some limitations to these
absolute valuation models. A company’s current lifecycle stage may not lend itself to a
discounted cash flow method. For example, early stage, pre-revenue companies or even
distressed firms will not necessarily report positive financial results, which when applied
within a DCF return negative valuations, and which is categorically incorrect. DCFs
represent the most concrete and accurate representation of a firm going forward as you are
able to model out cash flows, and set clear and precise estimates and assumptions. This
would be the ideal method used to determine absolute value for a firm. The granularity that
this method provides may, however, also lead to significant risk of human error linked to
assumption selections.

There exist several types of DCF models, which will use different performance
measurements as well as different discount factors. Koller, Goedhart and Wessels (2015),
outline the various in the most common models used by academics and industry
professionals alike, in their reference text “Valuation” sixth edition. (See table)
25

Fig 9: Framework for DCF-Based Valuations

        Model                 Measure             Discount factor                Assessment

                                                                          Works best for projects,
                                                                             business units, and
Enterprise discounted
                                FCF                    WACC                companies that manage
      cash flow
                                                                          their capital structure to
                                                                                 a target level

                                                                            Explicitly highlights
Discounted Economic
                          Economic profit              WACC               when a company creates
        Profit
                                                                                     value

                                                                            Highlights changing
Adjusted Present Value                                                     capital structure more
                                FCF            Unlevered cost of equity
        (APV)                                                                easily than WACC-
                                                                                 based models

                                                                            Compresses free cash
                                                                          flows and the interest tax
                                                                          shield into one number,
  Capital Cash Flow       Capital cash flow    Unlevered cost of equity     making it difficult to
                                                                             compare operating
                                                                             performance across
                                                                          companies and over time

                                                                          Difficult to implement
                                                                          correctly because capital
                                                                          structure is embedded
   Equity cash flow      Cash flow to equity    Levered cost of equity
                                                                          within the cash flow.
                                                                          Used     when      valuing
                                                                          financial institutions.

Legend: WACC = Weighted Average Cost of Capital, FCF = Free Cash Flows, Economic
profit = Invested Capital x (Return on Invested Capital – WACC)
26
3.1.3 Frameworks of DCF Valuation:
To be concise and not regurgitate previous academic reference materials, I have chosen
to compare the implications of WACC and APV methods and forgo Capital cash flow
and equity cash flow models as they do not fit the realities of the present exercise.
3.1.4 Weighted Average Cost of Capital (WACC – methods)
One of the main methods used in a DCF model is to use a Weighted Average Cost of Capital
method to discount future cash flows to the present date. (ie Enterprise Discounted Cash
Flow or Discounted Economic Profit models). The WACC discount factor does require
certain assumptions to hold for the model to function correctly.
Firstly, the model assumes cash flows are perpetuities, an often-unrealistic prediction.
Secondly, it assumes a fixed corporate tax rate and lastly it follows the assumption that the
firm maintains a constant leverage ratio. As firms progress through their life cycles, their
capital structures are destined to change as well.
In the case of Canopy, the company is currently in a growth phase and are part of an industry
that is still developing. The industry being in its infancy and seing as legalization has yet to
come there is not clear that there is an optimal capital structure or debt to equity ratios for the
industry. Using a static model with a constant leverage ratio therefore poses a problem.
3.1.5 Adjusted Present Value (APV – Method)
The Adjusted present value approach utilizes the same free cash flow approach as an
enterprise DCF; however, the Firm can be valued in two sections, the Enterprise Value of the
unlevered as well as the Present Value of Tax shields generated from financial leverage.
APV = Vu + PVTS
This method utilises a different discount factor for each section. The EV for an all equity-
financed firm is calculated as the NPV of free cash flows discounted by the cost of unlevered
cost of equity (Ku) and a discount factor relative to the present value of the interest tax
shield (Ktx). This method as outline above in the table better suits valuing companies with
changing capital structures.27 In the case of Canopy, it is clear that the company’s capital structure will change in the short-run. At the moment the company has little to no debt and continues to raise equity through share offerings. A public debt offering is surely in the cards for Canopy. This is why an APV valuation would make sense for the company. It is important to note however that modeling a news debt levels would be a nothing more than a guessing game. 3.2 Relative Value approach: The second approach is a comparative evaluation of the stocks value based on key metrics called a multiple-valuation. By following this approach one must look at key ratios and performance multiples of comparable firms or of the industry as a whole to determine the fair value of the stock. A significant risk linked to comparative valuations is the peer selection criteria. One must identify firms with similar risk, growth and cash flows. This being said, relative valuations can be useful in certain situations such as for early stage firms, as they might have negative operating income. This method is used in Private Equity and Venture Capital markets where you don’t have share prices. Comparative valuations also use far fewer assumptions than a DCF, which ultimately in a certain way limits the risk of including faulty or biased parameters within the financial model. In public markets, analysts principally use the price-to-earnings (“P/E”) multiple as their key ratio, however this may be an over simplification of the model for our purposes. This methodology does not include many of the subtle intricacies required for a fundamental valuation of a company in the context of making an investment decision and establishing a share price. A more realistic approach would be to use Net Enterprise Value (“NEV”) divided by Earnings before interest taxes, depreciation and amortization (“EBITDA”) or by Net operating profits less adjusted taxes (“NOPLAT”).
28

3.3 Model Selection:
The choice between fundamental or relative valuation is a no brainer. Although multiple-
valuations could be effective for the early stages of an industry, the immaturity of the newly
minted Cannabis industry and lack of consensus in the market relative to cannabis
producers’ valuations and capital structures allows us to determine it would be impossible to
establish an accurate peer group with consistent ratios necessary for using a relative
valuation. Furthermore, multiple based valuations do not offer the granularity required for
the nature of this paper. At this stage in the industry’s life cycle a relative valuation would be
similar to a scatter shotgun and the DCF would be an accurate riffle.

Question remains, which DCF to use. The enterprise cash flow methods, which uses FCFs
discounted by the firm’s WACC, or the Adjusted Present Value model, which uses the cost
of unlevered equity as a discount factor. Canopy will be evaluated using both methods and
the results will then be compared.
29

4. Canopy Growth Corporation Company Analysis

4.1 Competitive environment:
Canopy Growth Corporation was one of the first licenced producers to enter the medical
marijuana market in 2014. Since then they have grown extremely quickly. At the moment
there are approximately 100 Licensed Producers in Canada.

4.2 SWOT Analysis:

4.2.1 Strengths:

   • Canopy’s greatest strength remains its size. Canopy currently has the largest
       production footprint amongst its peer group, allowing them to achieve significant
       economies of scale and allows them to be one of the least cost producers in the space.
       This is paramount in a commodity product environment.
   • The second strength of Canopy is their positioning as a vertically integrated
       company, with operations from genetic diversification all the way to the production
       of cannabis derived consumer staples. This allows them to control the entire
       production chain and to offer higher margin, value added products.
   • Canopy also was one of the best-established brands in the cannabis space. Tweed, its
       former namesake has positioned itself as one of the most recognisable brands in the
       cannabis market. Tweed has been trying to transcend the pharmaceutical market to
       establish itself as a lifestyle brand as well.
   • On October 30th, 2017, Canopy entered into a strategic partnership with Constellation
       Brands (NYSE:STZ) a producer and marketer of alcoholic beverages. In return for a
       9.9% equity stake at the time (valued at $245M CAD), Constellation Brands would
       provide analytical support, branding expertise and strategic help with the consumer
       beverage markets. Furthermore, Canopy has also been able to foster important
       relationships with public figures such as the rapper Snoop Dogg, through his business
       Merry Jane, a cannabis lifestyle company and information network. These initiatives
       drive Canopy’s brand image, which can hopefully increase consumer engagement
       and build fidelity.
30
• Canopy has been able to establish itself across the country with several production
facilities. This facilitates transportation, increases capacity and facilitates distribution
but also gains favour with provincial government who are responsible for the
wholesale purchasing of recreational cannabis for their regions.
• Canopy has established a very responsible financial position. During its rapid growth
period, the company has been able to access capital extremely easily by raising
equity. This has allowed them to limit their leverage, and reduce their financial risk.
• Canopy has developed a strong R&D portfolio, which has the capacity to develop
new strands of cannabis to fit the diverse needs of its clients.
4.2.2 Weaknesses:
• Canopy has grown extremely quickly thanks to large scale funding rounds. In total
Canopy has issued nearly $1B CAD in equity. This has lead to rapid growth, and low
financial risk, however this has also lead to the significant dilution of original
shareholders within the firm.
• The firm seems to rely heavily on stock based compensation to attract and
compensate their top management. In fact, stock based compensation represents
nearly 50% of total revenue (first 9 months, ending December 31, 2017). Even
though this does not represent actual cash based expenditures, it does present a clear
signal to the market that Management is perhaps over compensated or too focused on
paying themselves out versus ensuring the success of the firm.
4.2.3 Opportunities:
• Canopy is well positioned in the market to continue to grow through organic sales but
also through acquisitions. Smaller producers will have a harder time competing at
scale with Canopy, making them easy targets for corporate takeovers. This is coupled
with low interest rates in the Canada, which means that there is both an abundance of
cheap capital and opportunities for consolidation. Furthermore, Canopy’s aversion to
debt and strong cash reserves will facilitate potential acquisitions in the future.
• Its position and recognition worldwide means that should new markets open to the
recreational cannabis sector, and that Canopy’s expertise should give it a clear31
advantage in the international market. Furthermore, the Company is already
operating through subsidiaries in Europe and Australia.
4.2.4 Threats:
• Canopy’s largest competitor continues to grow organically but most importantly
through acquisitions. The current M&A environment means there is an inherent risk
of take-overs in the market. A consolidation also translates to higher price
competition within the market as producers look to bring down production expenses
through scale.
• Uncertainty surrounding the official regulation in Canada and the official legalization
still casts doubts over the market. The start date for selling recreational cannabis,
initially July 1st, 2018 seems to be rather optimistic at the moment.
• International regulation ambiguity, such as in the US, lead to more difficult financing
through debt and American banks, and limits the overall shareholder pool as
institutional investors shy away from the sector. Furthermore, difficult regulatory
environment in the USA make it impossible for Canadian LPs to enter in the US
market due to strict securities laws. These however preclude licensing of intellectual
property.
• The relatively low barriers to entry in the market, and large upside potential mean
that more and more players will look to enter the cannabis market, which will
ultimately lead to increased supply and a lower market price of their final product.
• Low product differentiation steaming from plain product packaging regulations
means that consumers will be highly influenced by price.
4.3 Purchase orders
To date, Canopy has reached several agreements with provincial regulators for the wholesale
of cannabis products. As mentioned in the market dynamics section these provincial sales
represent the future revenue streams for Licenced Producers in the recreational market. As of
the 31st of March 2018, Canopy had received four letters of Intent or Memorandums of
Understanding (MoU) from provincial cannabis associations (Canopy a 2017).32
Though the purchase price for these agreements has yet to be disclosed, we do know the
volumes that Canopy will be supplying. The province of Quebec has stated its intent for
purchase 12,000kg, and up to 25,000kg per year over a period of 3 years. The province of
Newfoundland and Labrador will look to purchase a minimum of 8,000kg per year. The
province of Prince Edward Island (PEI) issued an MoU for 1,000kg, and New Brunswick
has issued an MoU of 4,000kg.
Fig 10: Provincial Purchase Orders
Provincial Purchase Orders
Quantity Supplied Length of contract
Provinces (Kg) (Years)
New Brunswick 4000 3
Newfoundland &
8000 2
Labrador
PEI 1000 2
Quebec* 12000 3
Total 25000
Source: Canopy Q3 Financials and Capital IQ
These agreements represent the foundation for our modeling of recreational cannabis
operations revenue going forward. However, there still remain questions as to the status of
Canopy’s sales in the remaining Canadian provinces and territories. At an average price of
roughly $6.5/gram, these 4 provinces alone would represent yearly sales of $162.5M CAD,
more than four times its current medical sales for the financial year 2017 and roughly three
times its sales for the first 9 months of FY2018. This demonstrates the exponential growth
that Canopy and its competitors are expected to experience over the next few years.
The central difficulty remains in estimating their sales in the other Canadian provinces as
there are really no way to assign sales volumes to contracts that have not been attributed.
This being said, as the largest licensed producer in Canada, Canopy’s ability to secure33 agreements is rather probable. This is thanks to their long-standing cooperation with regulators and their broad network of growing facilities across the country. 4.4 Financial Summary Canopy’s sales have increased exponentially since it started its operations in 2014, going from $1.9M in 2015 to $39.9M in 2017. The company’s year-to-date Q3 2018 results show that they were able to grow sales by 130.6% compared FY 2017 results. This increase is indicative of the strong growth within the medical marijuana sector, as these figures have yet to include any sales of recreational products. Fig 11: Financial Highlights Key Financials (Millions of CAD) For the Fiscal Period Ending FY 2015 FY 2016 FY 2017 Q3 2018 Total Revenue 1.9 12.7 39.9 55.1 Growth Over Prior Year NA 569.5% 214.2% 130.6% Gross Profit 2.3 19.0 38.7 67.0 Margin % 119.2% 149.5% 97.0% 121.5% EBITDA (6.1) 0.9 (0.7) (13.6) Margin % NM 7.3% (1.7%) (24.7%) EBIT (6.6) (1.3) (6.7) (28.8) Margin % NM (10.4%) (16.8%) (52.2%) Net Income (7.5) (3.5) (7.5) (8.8) Margin % NM (27.5%) (18.9%) (16.0%) Source: Canopy Q3 Financials and Capital IQ
34

An interesting observation is that the company’s gross margin figures are nearly 99.6%. This
is solely due to IFRS reporting standards.                 Seeing as their products are technically
agricultural produce, accounting rules oblige companies to account for changes in fair value
of biological assets4 when computing their gross margin. By capitalizing fair value changes
in biological assets and inventory, companies are essentially counting their chickens before
they hatch. These changes fluctuations in fair value are linked to increased production and
inventory size, which will eventually be smoothed out when cannabis companies reach
stable production levels. However for now, these line items have the effect of seriously
overstating the financial performance of the firm in question. This problem is in fact
endemic to the industry, and will require further adjustments when modeling revenues. (See
financial adjustments).

Furthermore, Canopy is currently unprofitable; with the company presenting a negative Net
Income figure since its inception. Losses in 2018 are particularly high due to several factors,
but most notably from stock-based compensation to employees, which amounted to nearly
$34.3M, or, more than 50% of sales during the LTM ending Q3 2018. This was due to
Canopy using stock based incentives linked to acquisition milestones. This compensation
structure allows them to ensure that management’s interests are aligned with Canopy’s long-
term goals. This being said, they do represent a concerning portion of their total
expenditures. However, stock based compensation is not a cash expense and will therefore
need to be adjusted for when assessing the company’s intrinsic value. (see financial
adjustments).

4.4.1 Balance Sheet:

The company has grown its balance sheet significantly over the last year; its numerous
acquisitions and investments have led them to increase their assets 7.4x since March 31st,
2016, reaching $1,091M. A large portion of it consists in new facilities with Property, Plant
and Equipment having grown to $108M from just 46M in 2016. The largest portion of the
increased assets is attributable to goodwill, which represents 24.9% of the company’s total
assets. The increase in goodwill is attributable to Canopy’s strong M&A activity and their
preference for acquiring targets with strong brands.

4
 Castaldo, J. (2018) “Canadian Weed Stocks have a serious Accounting problem” MAcleans Magazine, retrieved from:
https://www.macleans.ca/economy/canadian-weed-stocks-have-a-serious-accounting-problem/ (March 25th 2018)
You can also read