ECONOMIC DEVELOPMENT MARKET ANALYSIS - City of Saco, ME DEC EMBER 2020 - Saco ...
←
→
Page content transcription
If your browser does not render page correctly, please read the page content below

ECONOMIC
DEVELOPMENT MARKET
ANALYSIS
City of Saco, ME

                         DEC EMBER 2020

                   PREPARED BY:

                   120 West Avenue, Suite 303
                   Saratoga Springs, NY 12866
                   518.899.2608
                   www.camoinassociates.com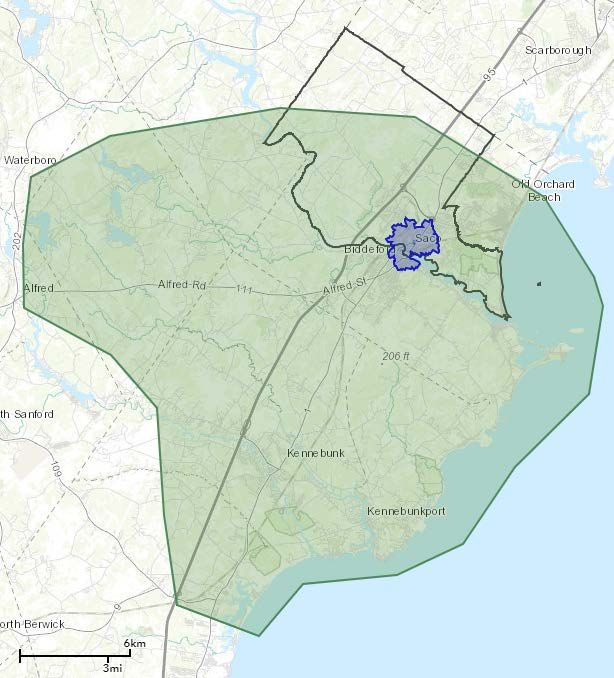
ECONOMIC DEVELOPMENT MARKET ANALYSIS FOR THE CITY OF SACO, ME

CONTENTS
EXECUTIVE SUMMARY ............................................................................................ 1
ECONOMIC BASE ANALYSIS .................................................................................. 4
DEMOGRAPHIC AND SOCIOECONOMIC PROFILE ............................................ 19
RETAIL SNAPSHOT ................................................................................................ 25
RESIDENTIAL SNAPSHOT...................................................................................... 34
OFFICE SNAPSHOT ............................................................................................... 41
INDUSTRIAL SNAPSHOT ....................................................................................... 44
COMPETITIVENESS ASSESSMENT ........................................................................ 46
WHAT WE HEARD ................................................................................................. 51
ACTION PLAN........................................................................................................ 54
APPENDICES .......................................................................................................... 57

                                                                                                                           i
ECONOMIC DEVELOPMENT MARKET ANALYSIS FOR THE CITY OF SACO, ME

EXECUTIVE SUMMARY
 PURPOSE OF THIS STUDY
 The City of Saco has invested in an Economic Development Market Analysis to deepen its understanding of the local
 and regional economic and real estate market environment to inform economic development policies and strategies
 that are focused on what actions the City can take. Camoin 310 and our partner Frank O’Hara worked in conjunction
 with the City of Saco staff in a collaborative process to gain insight into Saco’s existing challenges and competitive
 advantages. The following sections comprise the market analysis:

           Economic Base Analysis | The base analysis is an in-depth examination of industry trends by employment,
           wages, concentration, and gross regional product to create a baseline of information. This analysis homed
           in on the sectors that pose the greatest strength for the City of Saco.

           Demographic and Socioeconomic Profile | The profile examined historic and projected trends for
           population, households, age, incomes, and other demographic factors that help to inform the market
           analysis.

           Real Estate Snapshot | The City of Saco’s diversity and availability of options within the retail, residential,
           office, and industrial markets were examined in the retail snapshot. This snapshot outlined market supply
           and demand.

           Competitive Assessment | To understand Saco’s role and standing in the regional economy, we compared
           municipal economic indicators for Saco to several other communities in the region: Biddeford, Westbrook,
           Gorham, Scarborough, Portland, South Portland, and Falmouth.

           Business Development Strategy Survey | A public survey was employed to solicit feedback from the
           community on perceptions of Saco’s quality of life, business offerings, and economic development
           direction. (See Appendix C)

           Stakeholder Interviews | As part of the Economic Development Market Analysis, the City of Saco staff
           and Camoin 310 conducted interviews with key stakeholders including business leaders, developers,
           investors, etc. The stakeholder interviews provide valuable information on public perceptions, specific
           challenges and opportunities, and other detailed information that informs the data analysis.

           Challenges and Opportunities | The aforementioned components culminated in the creation of the
           challenges and opportunities section of the report, which outlines the major themes and serves as the
           foundation for the Action Plan.

 Please note that data projections outlined below do not factor in the economic impact of COVID-19. While some
 projections are included, the focus of the analysis is on historic and current trends that shape market opportunities for
 the City of Saco.

                                                                                                                         1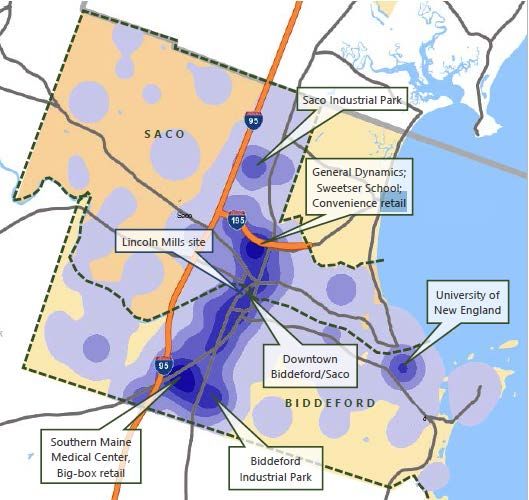
ECONOMIC DEVELOPMENT MARKET ANALYSIS FOR THE CITY OF SACO, ME
KEY TAKEAWAYS & RECOMMENDATIONS
Important takeaways from the analysis of the economy and real estate market in the City of Saco include:
INCREASE RESILIENCY THROUGH DIVERSIFICATION
Saco has strong levels of incomes, education, and age demographics; however, it is exporting professional and
technical jobs and importing retail and service jobs. This matters because most people engaging with Saco’s
economy are only doing so through one channel – they are either living here, OR working here, few do both. This
can be considered a threat because an economy based on a single, highly volatile, sector (i.e. retail), is less resilient
than a diverse economy, which can adapt more capably to market trends.
ROLE OF CITY: COMMUNICATOR & CONNECTOR
The City of Saco's strength in supporting real estate development is acting as the communicator and connector.
The City should avoid, when possible, property acquisition for economic development - the City is not a developer.
This is because it can be risky, and therefore better handled by the market. The City's primary role is to communicate
about properties, assets and opportunities, and connecting businesses and developers with those properties and
sites.
FOCUS ATTRACTION EFFORTS ON INDUSTRY SECTORS WITH LOCAL AND REGIONAL STRENGTH
Industry sectors with strength and opportunity for success in Saco include Health Care/Medical Services,
Manufacturing, and Professional & Technical Services.
Light Industrial, Manufacturing, & Logistics | This sector has a strong tradition in the region and state
with historical growth. It includes a blend of small and large businesses in food production, aerospace,
medical and life sciences related manufacturing, and textiles. Growth opportunity are present in the cross
section of logistics and manufacturing. Pre-COVID, demand was for small flex spaces under 10,000 SF, with
loading docks, which is not available in the market and price-prohibitive to build. During COVID and post-
COVID, this market gap is likely to increase, with increased demand for warehouse and logistics.
Professional & Technical Services | This sector is small in size but has historic and projected growth with
higher than average wages in emerging industries. It includes business services such as engineering,
information technology, research and development, and media and business services. Pre-COVID, there
were slight increases in office space demand and supply; however, post-COVID there is great uncertainty
with likely greater supply than demand and a market shift to low-density office space options.
Health Care/Medical Services | This is a large and growing sector that is projected to advance, both
locally and regionally. The challenge is increasing opportunities for mid-higher earning occupations. Saco
is located between two major medical areas: the hospital in Biddeford and the healthcare network in
Portland. The opportunity for Saco is outpatient specialty services and healthcare related offices. Medical
office space is strong and growing locally and regionally today. Industry projections support increased
demand. Work to attract health service providers like Biddeford-Saco Dental Associates that offer attractive
career opportunities and jobs in the healthcare field, as well as investment in new office locations that create
demand and synergies located within commercial districts.
2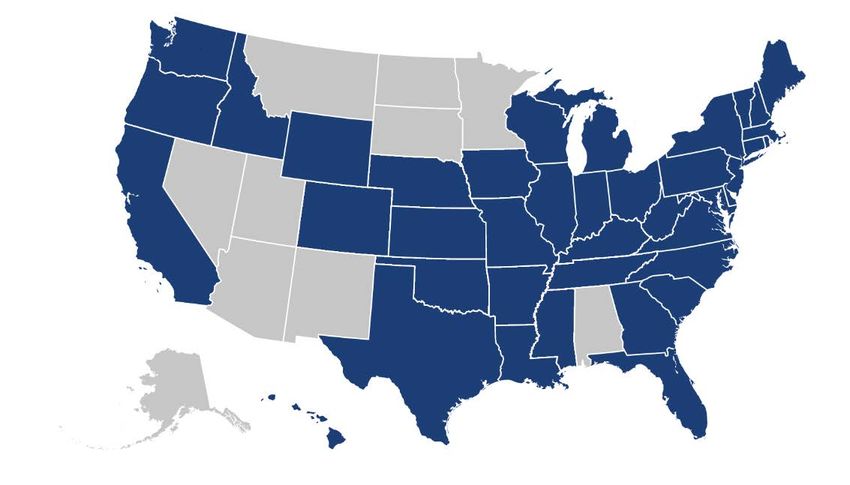
ECONOMIC DEVELOPMENT MARKET ANALYSIS FOR THE CITY OF SACO, ME
CONTINUE TO FILL EXISTING BUSINESS PARKS WITHOUT EXPANDING
One of the critical questions driving this study was “Should we expand the business parks and work to attract
modern amenities in the parks?”
What we found through our research and analysis is that businesses who are in Saco’s business parks today are
happy with their location even though the parks themselves lack many of the amenities that more modern park do.
Employers and employees in the parks feel well served by the diverse amenities and retail offerings available in
Saco.
Regarding the question of expansion of the parks, the market analysis found that the supply of industrial space in
the region continues to be limited, and the demand for that type of space is moderate. There are growth
opportunities in the cross section of logistics and manufacturing; however, this demand is not significant enough
to justify an expansion of Saco’s business parks considering the availability of privately-owned sites on the market
currently.
Therefore, our recommendation is to focus on attracting businesses within the opportunity sectors to existing park
properties. Do not expand business parks or dedicate resources to attracting amenities to the parks.
CONNECT ECONOMIC DEVELOPMENT AND LAND USE PLANNING
How the City handles land use and zoning, including addressing parking challenges and traffic congestion, will go
a long way to connecting businesses and employees to the amenities that they desire.
While the expansion of a general business park – paid for by the City – is not justified based on the limited market
demand; we recommend focusing on signature projects that include:
Significant mixed-use development that integrates housing and commercial uses
Riverfront projects
All of this should be done with the City continuing to lead planning and zoning, as well as communicating to the
private sector how the City’s vision and goals align with market opportunities, and connecting businesses and
developers with projects.
3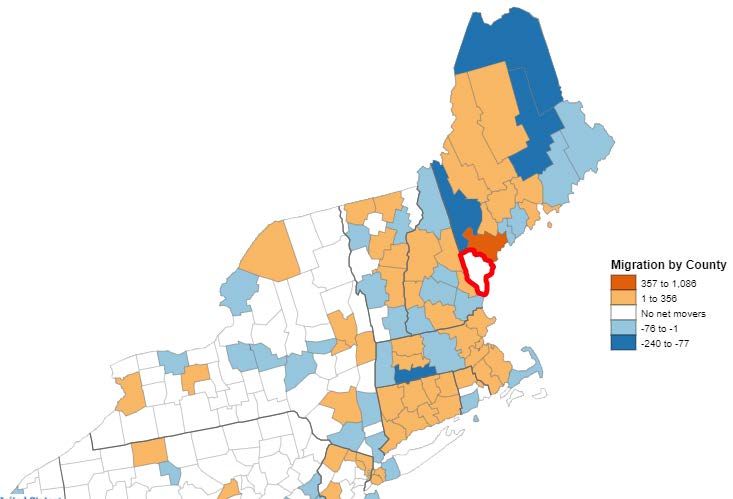
ECONOMIC DEVELOPMENT MARKET ANALYSIS FOR THE CITY OF SACO, ME
ECONOMIC BASE ANALYSIS
MAJOR INDUSTRY SECTORS
Based on the economic, industry, and business data outlined below, the following industry groups represent the
greatest strength for the City of Saco:
Health Care (NAICS 62 Health Care and Social
Assistance): The Health Care and Social Assistance industry Factors for Considering
is the largest industry by employment in the City of Saco. Industry Strength
Saco’s Health Care industry has lower than average earnings
at $42,000 per job, compared to the surrounding two-county • Number of jobs
region ($63,900 per job) and state ($59,200 per job). Lower • Employment growth, past and
earnings can be attributed to Saco’s high concentration of projected
Personal Care Aides, which have hourly earnings of $12.21, • Employment concentrated (LQ)
thus driving down earning figures in the city. Personal Care • Business establishments
Aides is the top occupation in Saco with 325 jobs in 2019, up • Wages
28% since 2014. Residential Intellectual and Developmental • Occupation/talent skills and
Disability, Mental Health, and Substance Abuse Facilities are education
also highly concentrated in Saco with a location quotient
(LQ) 1 of 8.44. Jobs in this industry grew from 224 in 2014 to
311 in 2019 and are projected to continue growing. The
largest Health Care establishment in Saco is Evergreen Rehabilitation & Living Center, a nursing home with
80 employees. As the population is projected to age, demand for health care services will increase and
contribute to industry growth. Other establishments include Sweetser and Spurwink, which focus on
behavioral health and disability services.
Manufacturing (NAICS 31-33): Between 2014 and 2019, the Manufacturing sector expanded by 78 jobs
within Saco for a growth rate of 13%. Manufacturing growth has been driven by the Small Arms, Ordnance,
and Ordnance Accessories Manufacturing sector and the Roped, Cordage, Twine, Tire Cord, and Tire Fabric
Mills sector, which are both significantly concentrated with LQs of 220.0 and 328.49, respectively. Seafood
Product Preparation and Packing also has a high LQ at 37.76, and growth in this industry has been driven
by the recent development of Ready Seafood, the largest lobster processing plant in Maine. 2 Manufacturing
has a significant presence throughout the two-county region and, therefore, there are regional assets that
Saco can draw on to drive growth. This includes food production, aerospace, medical and life sciences
related manufacturing, and textiles. Manufacturing is typically tied to an economy’s Wholesale Trade sector.
Within Saco, the Wholesale Trade industry experienced a historic decline in Grocery and Related Product
Merchant Wholesalers.
Professional and Technical Services (NAICS 54 Professional, Scientific, and Technical Service and
NAICS 52 Finance and Insurance): Architectural, Engineering, and Related Services has been the primary
driver of growth in this sector, increasing from 183 jobs in 2014 to 277 jobs in 2019. Depository Credit
Intermediation also grew from 233 jobs in 2014 to 256 jobs in 2019. Both industries are projected to
1
Location quotient (LQ) is a measure of industry concentration, indicating how concentrated a certain sector is in a given
area of study, relative to the nation. It can reveal what makes a particular region “unique” in comparison with the national
average. A location quotient greater than 1 indicates that sector employment in the study area is more concentrated than it
is at the national level.
2
Maine’s largest lobster processing plant opens. September 6, 2020. https://www.mainebiz.biz/article/maines-largest-
lobster-processing-plant-opens
4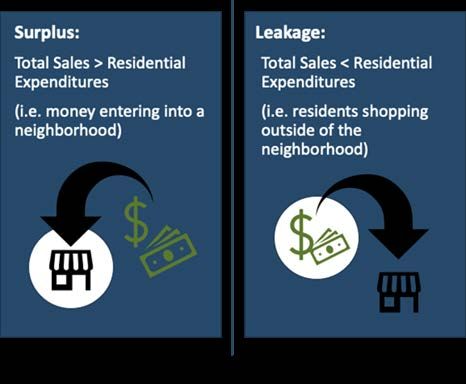
ECONOMIC DEVELOPMENT MARKET ANALYSIS FOR THE CITY OF SACO, ME
continue growing into the future. York and Cumberland Counties had strong growth in the Professional,
Scientific, and Technical Services industry, expanding 16% from 2014 to 2024. Despite its small size relative
to the nearby cluster in Boston, life science research and development and related manufacturing has
gained strength in South Maine. The research and development assets in Saco include Maine Molecular
Quality Controls and New Earth Ecological Consulting with Maine Medical Center Research Institution,
University of New England, Idexx, ClearH2O, and others nearby. Computer Systems Design and Related
Services is strong in terms of jobs and growth at the two-county level. Average earnings in this sector rank
above average at approximately $75,000 per job.
Retail, Arts, and Accommodations and Food Services (NAICS 44 Retail Trade, NAICS 71 Arts,
Entertainment, and Recreation, and NAICS 72 Accommodation and Food Services): Retail Trade is the
largest driver of Saco’s economy with over $103.2 million in GRP or 13% of the total GRP. Saco is home to
Fun Town, Splash Town, Monkey Trunks, and a variety of other establishments that contribute to the Arts,
Entertainment, and Recreation industry. The concentration of these recreational assets creates a regional
draw and contributes to a high location quotient of 16.38 for Amusement Parks and Arcades. Overall,
occupations that fall within the Retail, Arts, and Accommodations and Food Services sector have grown
since 2014 and are projected to continue adding jobs into 2024. Most of the occupations within this sector
are lower-earning, including Retail Salespersons with average hourly earnings of $14.42 and Waiters and
Waitresses with average hourly earnings at $14.67.
ECONOMIC DATA AND TRENDS
The table below displays jobs by the 2-digit industry sector for the Saco ZIP Code in 2014 and 2019, as well as 2024
projections that were made before the COVID-19 crisis. As of 2019, there were approximately 9,300 jobs in Saco.
The largest industries by employment are Health Care and Social Assistance, Retail Trade, and Government. Between
2014 and 2019, Saco experienced 5% job growth, which was slightly higher than the state’s 4% job growth and
lower than York and Cumberland Counties 7% job growth.
Saco (04072) Jobs by Industry, 2014 - 2024
2014 - 2014 - 2019 - 2019 - Avg.
Location
NAICS Description 2014 Jobs 2019 Jobs 2024 Jobs 2019 2019 % 2024 2024 % Earnings
Quotient
Change Change Change Change Per Job
11 Agriculture, Forestry, Fishing and Hunting 0 0 0 0 0% 0 0% 0.00 $ -
21 Mining, Quarrying, and Oil and Gas Extraction 0 0 0 0 0% 0 0% 0.00 $ -
22 Utilities 26 35 34 9 35% (1) (3%) 1.10 $ 62,161
23 Construction 484 517 520 33 7% 3 1% 0.98 $ 48,644
31 Manufacturing 618 696 690 78 13% (6) (1%) 0.94 $ 71,020
42 Wholesale Trade 567 363 323 (204) (36%) (40) (11%) 1.06 $ 75,272
44 Retail Trade 1,068 1,154 1,197 86 8% 43 4% 1.24 $ 50,730
48 Transportation and Warehousing 173 235 270 62 36% 35 15% 0.68 $ 47,949
51 Information 66 87 87 21 32% 0 0% 0.51 $ 41,173
52 Finance and Insurance 305 343 348 38 12% 5 1% 0.92 $ 73,137
53 Real Estate and Rental and Leasing 119 115 116 (4) (3%) 1 1% 0.73 $ 40,578
54 Professional, Scientific, and Technical Services 468 556 601 88 19% 45 8% 0.90 $ 75,996
55 Management of Companies and Enterprises 116 126 137 10 9% 11 9% 0.94 $ 95,680
Administrative and Support and Waste
56 684 616 612 (68) (10%) (4) (1%) 1.06 $ 35,858
Management and Remediation Services
61 Educational Services 472 504 548 32 7% 44 9% 2.10 $ 46,348
62 Health Care and Social Assistance 1,254 1,322 1,335 68 5% 13 1% 1.11 $ 41,775
71 Arts, Entertainment, and Recreation 385 404 413 19 5% 9 2% 2.47 $ 22,889
72 Accommodation and Food Services 862 928 959 66 8% 31 3% 1.16 $ 26,809
81 Other Services (except Public Administration) 378 397 404 19 5% 7 2% 0.90 $ 33,620
90 Government 861 936 967 75 9% 31 3% 0.67 $ 81,091
Total 8,904 9,333 9,560 429 5% 227 2% $ 52,024
Source: EMSI
5ECONOMIC DEVELOPMENT MARKET ANALYSIS FOR THE CITY OF SACO, ME
Industry trends in Saco were compared to trends in York and Cumberland Counties (i.e. the “two-county region”)
and Maine to identify specific strengths in the local and regional economies to draw from. The economic base of
Saco is generally comparable to the economic base of the two-county region in terms of industry make-up. Overall,
average earnings per job in Saco ($52,024) lag average earnings in the two-county region ($59,973) and state
($54,766). This is partially driven by Saco’s high concentration of jobs in Retail, Accommodation, Food Services, Arts,
and Entertainment industries, which have lower than average earnings per job. The tables below outline industry
trends from 2014 to 2019 and 2024 projections for those geographies.
York and Cumberland Counties Jobs by Industry, 2014 - 2024
2014 - 2014 - 2019 - 2019 - Avg.
Location
NAICS Description 2014 Jobs 2019 Jobs 2024 Jobs 2019 2019 % 2024 2024 % Earnings
Quotient
Change Change Change Change Per Job
11 Agriculture, Forestry, Fishing and Hunting 1,786 2,433 2,842 647 36% 409 17% 0.71 $ 38,766
21 Mining, Quarrying, and Oil and Gas Extraction 105 90 85 (15) (14%) (5) (6%) 0.07 $ 76,492
22 Utilities 529 463 429 (66) (12%) (34) (7%) 0.46 $ 135,576
23 Construction 15,942 17,196 17,545 1,254 8% 349 2% 1.03 $ 56,917
31 Manufacturing 16,883 20,437 20,889 3,554 21% 452 2% 0.88 $ 77,954
42 Wholesale Trade 9,164 9,298 9,112 134 1% (186) (2%) 0.86 $ 81,393
44 Retail Trade 32,934 32,784 31,433 (150) (0%) (1,351) (4%) 1.12 $ 36,424
48 Transportation and Warehousing 7,624 7,526 7,125 (98) (1%) (401) (5%) 0.68 $ 52,125
51 Information 3,842 4,145 4,045 303 8% (100) (2%) 0.77 $ 70,343
52 Finance and Insurance 13,597 15,284 15,607 1,687 12% 323 2% 1.29 $ 100,807
53 Real Estate and Rental and Leasing 4,497 4,868 4,940 371 8% 72 1% 0.97 $ 51,831
54 Professional, Scientific, and Technical Services 15,490 17,973 19,801 2,483 16% 1,828 10% 0.92 $ 86,742
55 Management of Companies and Enterprises 5,021 6,312 6,922 1,291 26% 610 10% 1.48 $ 114,683
Administrative and Support and Waste
56 14,102 14,349 14,592 247 2% 243 2% 0.78 $ 43,749
Management and Remediation Services
61 Educational Services 9,507 9,440 10,056 (67) (1%) 616 7% 1.24 $ 44,730
62 Health Care and Social Assistance 42,826 45,038 46,469 2,212 5% 1,431 3% 1.20 $ 63,851
71 Arts, Entertainment, and Recreation 5,119 5,458 5,609 339 7% 151 3% 1.06 $ 27,926
72 Accommodation and Food Services 26,264 29,023 30,262 2,759 11% 1,239 4% 1.14 $ 27,883
81 Other Services (except Public Administration) 12,740 13,531 14,066 791 6% 535 4% 0.97 $ 33,218
90 Government 38,251 39,747 39,703 1,496 4% (44) (0%) 0.90 $ 73,778
Total 276,225 295,395 301,533 19,170 7% 6,138 2% $ 59,973
Source: EMSI
6ECONOMIC DEVELOPMENT MARKET ANALYSIS FOR THE CITY OF SACO, ME
Maine Jobs by Industry, 2014 - 2024
2014 - 2014 - 2019 - 2019 - Avg.
Location
NAICS Description 2014 Jobs 2019 Jobs 2024 Jobs 2019 2019 % 2024 2024 % Earnings
Quotient
Change Change Change Change Per Job
11 Agriculture, Forestry, Fishing and Hunting 14,608 15,006 15,078 398 3% 72 0% 1.82 $ 45,781
21 Mining, Quarrying, and Oil and Gas Extraction 196 217 241 21 11% 24 11% 0.07 $ 74,706
22 Utilities 1,583 1,655 1,643 72 5% (12) (1%) 0.69 $ 123,064
23 Construction 41,599 44,121 44,909 2,522 6% 788 2% 1.10 $ 52,768
31 Manufacturing 51,937 54,562 53,456 2,625 5% (1,106) (2%) 0.97 $ 70,215
42 Wholesale Trade 20,620 20,318 20,306 (302) (1%) (12) (0%) 0.79 $ 77,240
44 Retail Trade 85,559 84,646 82,047 (913) (1%) (2,599) (3%) 1.20 $ 34,793
48 Transportation and Warehousing 18,435 19,068 18,744 633 3% (324) (2%) 0.72 $ 53,963
51 Information 8,307 8,179 7,756 (128) (2%) (423) (5%) 0.64 $ 64,847
52 Finance and Insurance 24,410 26,127 26,209 1,717 7% 82 0% 0.92 $ 90,901
53 Real Estate and Rental and Leasing 8,593 9,182 9,405 589 7% 223 2% 0.76 $ 47,252
54 Professional, Scientific, and Technical Services 30,429 33,865 36,215 3,436 11% 2,350 7% 0.73 $ 78,161
55 Management of Companies and Enterprises 9,082 11,448 12,707 2,366 26% 1,259 11% 1.12 $ 101,210
Administrative and Support and Waste
56 34,959 35,328 36,286 369 1% 958 3% 0.80 $ 42,455
Management and Remediation Services
61 Educational Services 20,197 20,726 22,209 529 3% 1,483 7% 1.14 $ 42,325
62 Health Care and Social Assistance 106,823 110,719 113,454 3,896 4% 2,735 2% 1.23 $ 59,211
71 Arts, Entertainment, and Recreation 11,325 12,284 12,640 959 8% 356 3% 0.99 $ 28,001
72 Accommodation and Food Services 56,018 60,274 62,100 4,256 8% 1,826 3% 0.99 $ 25,618
81 Other Services (except Public Administration) 31,147 31,396 31,720 249 1% 324 1% 0.94 $ 32,466
90 Government 106,089 106,999 105,130 910 1% (1,869) (2%) 1.01 $ 65,863
Total 681,917 706,119 712,256 24,202 4% 6,138 1% $ 54,766
Source: EMSI
The table below displays industries by 2019 Gross Regional Product (GRP) for the City of Saco compared to York
and Cumberland Counties and the State of Maine. Retail is the largest industry by GRP in the City of Saco,
constituting 13% of total GRP compared to 7% in York and Cumberland Counties and 9% in Maine. Government is
the second largest industry by GRP in the City of Saco and the largest for the two-county region and state.
Manufacturing and Health Care and Social Assistance are also strong contributors to Saco’s GRP.
Gross Regional Product, 2019
York and
NAICS Description Saco (04072) Cumberland Maine
Counties
44 Retail Trade $ 103,226,405 13% 7% 9%
90 Government $ 96,731,669 12% 13% 14%
31 Manufacturing $ 79,499,954 10% 11% 12%
62 Health Care and Social Assistance $ 67,260,960 9% 12% 13%
42 Wholesale Trade $ 64,463,458 8% 7% 6%
52 Finance and Insurance $ 60,566,156 8% 11% 8%
54 Professional, Scientific, and Technical Services $ 60,288,223 8% 8% 6%
72 Accommodation and Food Services $ 42,286,844 5% 5% 4%
23 Construction $ 40,114,435 5% 5% 6%
Administrative and Support and Waste Management
56 $ 34,508,561 4% 3% 3%
and Remediation Services
61 Educational Services $ 25,471,526 3% 2% 2%
81 Other Services (except Public Administration) $ 23,024,101 3% 2% 2%
53 Real Estate and Rental and Leasing $ 20,809,112 3% 3% 3%
48 Transportation and Warehousing $ 16,671,842 2% 2% 2%
71 Arts, Entertainment, and Recreation $ 15,854,649 2% 1% 1%
55 Management of Companies and Enterprises $ 14,417,022 2% 3% 2%
51 Information $ 13,411,058 2% 3% 2%
22 Utilities $ 5,458,862 1% 1% 1%
11 Agriculture, Forestry, Fishing and Hunting $ - 0% 1% 2%
21 Mining, Quarrying, and Oil and Gas Extraction $ - 0% 0% 0%
Total $ 784,064,834 100% 100% 100%
Source: EMSI
7ECONOMIC DEVELOPMENT MARKET ANALYSIS FOR THE CITY OF SACO, ME
Industry trends at the 4-digit NAICS code provide greater detail into which sub-sectors are driving growth.
Restaurants and Other Eating Places is the top 4-digit industry with 721 jobs in 2019. The retail industry is primarily
driven by Automobile Dealers and Grocery stores with 527 and 328 jobs respectively. Architectural, Engineering, and
Related Services was the fastest-growing sector, adding 94 jobs between 2014 and 2019 for a growth rate of 51%.
Saco (04072) Top 25 4-Digit Industries by 2019 Jobs, 2014 - 2024
2014 - 2014 - 2019 - 2019 - Avg.
Location
NAICS Description 2014 Jobs 2019 Jobs 2024 Jobs 2019 2019 % 2024 2024 % Earnings
Quotient
Change Change Change Change Per Job
7225 Restaurants and Other Eating Places 685 721 749 36 5% 28 4% 1.17 $ 25,031
4411 Automobile Dealers 459 527 561 68 15% 34 6% 6.97 $ 70,602
6111 Elementary and Secondary Schools 387 402 432 15 4% 30 7% 6.03 $ 52,243
9011 Federal Government, Civilian 272 339 371 67 25% 32 9% 2.07 $ 114,440
4451 Grocery Stores 316 328 325 12 4% (3) (1%) 2.13 $ 29,460
9036 Education and Hospitals (Local Government) 327 327 321 0 0% (6) (2%) 0.67 $ 62,773
5617 Services to Buildings and Dwellings 253 313 354 60 24% 41 13% 1.90 $ 32,329
Residential Intellectual and Developmental
6232 Disability, Mental Health, and Substance 224 311 341 87 39% 30 10% 8.44 $ 42,107
Abuse Facilities
Architectural, Engineering, and Related
5413 183 277 318 94 51% 41 15% 3.06 $ 83,570
Services
3329 Other Fabricated Metal Product Manufacturing 242 257 246 15 6% (11) (4%) 16.01 $ 82,799
5221 Depository Credit Intermediation 233 256 258 23 10% 2 1% 2.58 $ 66,257
5613 Employment Services 267 212 195 (55) (21%) (17) (8%) 1.03 $ 37,649
7131 Amusement Parks and Arcades 203 211 219 8 4% 8 4% 16.38 $ 23,761
Local Government, Excluding Education and
9039 187 196 203 9 5% 7 4% 0.60 $ 64,127
Hospitals
6216 Home Health Care Services 243 177 154 (66) (27%) (23) (13%) 1.99 $ 44,866
Nursing Care Facilities (Skilled Nursing
6231 196 177 164 (19) (10%) (13) (7%) 1.94 $ 39,491
Facilities)
Continuing Care Retirement Communities and
6233 152 170 184 18 12% 14 8% 3.14 $ 37,304
Assisted Living Facilities for the Elderly
2361 Residential Building Construction 146 160 162 14 10% 2 1% 2.23 $ 46,909
6244 Child Day Care Services 139 160 160 21 15% 0 0% 2.24 $ 27,167
7139 Other Amusement and Recreation Industries 132 155 159 23 17% 4 3% 1.85 $ 21,697
7211 Traveler Accommodation 135 142 138 7 5% (4) (3%) 1.27 $ 36,029
6241 Individual and Family Services 112 140 140 28 25% 0 0% 0.92 $ 30,929
5511 Management of Companies and Enterprises 116 126 137 10 9% 11 9% 0.94 $ 95,680
Grocery and Related Product Merchant
4244 308 113 75 (195) (63%) (38) (34%) 2.47 $ 52,306
Wholesalers
3149 Other Textile Product Mills 101 113 120 12 12% 7 6% 28.43 $ 60,978
Source: EMSI
Industries with the highest concentration in Saco represent unique assets and include industries within
Manufacturing, Amusement Parks, Wholesale, Healthcare, Utilities, and Education.
Saco (04072) Top 4-Digit Industries by Location Quotient, 2014 - 2024
2014 - 2014 - 2019 - 2019 -
Location
NAICS Description 2014 Jobs 2019 Jobs 2024 Jobs 2019 2019 % 2024 2024 %
Quotient
Change Change Change Change
3117 Seafood Product Preparation and Packaging 64 75 82 11 16.8% 7 8.8% 37.76
3149 Other Textile Product Mills 101 113 120 12 11.8% 6 5.4% 28.43
3322 Cutlery and Handtool Manufacturing 29 41 48 12 40.9% 7 17.1% 18.68
7131 Amusement Parks and Arcades 203 211 219 8 3.9% 9 4.1% 16.38
3329 Other Fabricated Metal Product Manufacturing 242 257 246 15 6.1% (11) (4.4%) 16.01
2213 Water, Sewage and Other Systems 26 35 34 9 34.9% (1) (2.0%) 11.01
Residential Intellectual and Developmental Disability,
6232 224 311 341 88 39.2% 30 9.5% 8.44
Mental Health, and Substance Abuse Facilities
Agents and Managers for Artists, Athletes,
7114 35 21 17 (13) (38.8%) (4) (18.7%) 7.24
Entertainers, and Other Public Figures
4411 Automobile Dealers 459 527 561 68 14.9% 34 6.4% 6.97
6111 Elementary and Secondary Schools 387 402 432 15 4.0% 30 7.4% 6.03
Source: EMSI
8ECONOMIC DEVELOPMENT MARKET ANALYSIS FOR THE CITY OF SACO, ME
According to 2019 Esri data, there are 191 business establishments with $512.9 million in sales within the City of
Saco. There is a significant presence of Other Services (except Public Administration) 3 and Retail Trade businesses
with 28 and 26 establishments, respectively.
3
Examples of Saco businesses that fall under Other Services (except Public Administration) include retirement homes,
cemetery associations, trail alliances, churches, kennels, hair salons, and auto shops.
9ECONOMIC DEVELOPMENT MARKET ANALYSIS FOR THE CITY OF SACO, ME
Saco’s principal employers are listed in the following table. This information comes from Maine Department of Labor
data and outreach conducted by City of Saco staff. As shown, major employers in the City include school and
childcare services, along with the City of Saco, Prime Dealerships (multiple locations), General Dynamics, and
Hannaford Brothers.
City of Saco Principal Employers Businesses by Number of Employees, 2020
Employer Employees Rank
City of Saco 376 1
Saco School Department 353 2
Prime Dealerships 306 3
Sweetser Children's Services 301 4
Thornton Academy 211 5
General Dynamics 205 6
Hannaford Brothers 203 7
Saco & Biddeford Savings 131 8
Shaw's Supermarkets 130 9
Precision Manufacturing 95 10
Sources: Maine Department of Labor, U.S. Department of Labor & data compiled by City of Saco
Planning & Development, contacting businesses.
Esri offers employment data by site location. According to this source, the largest business locations by employment
are grocery stores Shaw’s and Hannaford with 150 and 125 employees, respectively. The third and fourth largest
businesses are Boise Cascade Co, a building materials wholesaler with 100 employees, and Prime Scion of Saco, a
car dealership with 100 employees. General Dynamics operates under NAICS classification 238990 - All Other
Specialty Trade Contractors – which is not included in this dataset.
City of Saco Top 10 Businesses by Number of Employees, 2019
Number of
NAICS Description Business Name Address
Employees
44511003 Supermarkets Shaw's Supermarket Scammon St 150
44511003 Supermarket Hannaford Supermarket Main St 125
42331002 Lumber Wholesaler Boise Cascade Co Industrial Park Rd 100
81112102 Wholesale Automobile Dealer Prime Scion of Saco Portland Rd 100
52211002 Commercial Banking Saco & Biddeford Savings Instn Main St 90
81111104 Wholesale Automobile Dealer Patriot Subaru Portland Rd 83
Continuing Care Retirement
62331103 Evergreen Manor North St 80
Community
Elementary and Secondary
61111007 Saco Middle School Buxton Rd 80
Schools
31141102 Food Manufacturing Sure Winner Foods Lehner Rd 80
Occupational Safety and Health
61169929 Jacman Group Pepperell Sq 75
School
Source: Esri
10ECONOMIC DEVELOPMENT MARKET ANALYSIS FOR THE CITY OF SACO, ME
Most Saco businesses are small employers with less than 20 employees. Nearly 34% of businesses fall within the 1
to 4 employee category. According to the Kauffman Indicators of Entrepreneurship report, nearly 17.2% of
businesses in Maine are new employers, ranking as the highest state with new employer business actualization. 4
Saco Businesses by Number of Employees, 2019
Sourc e: D atabaseU SA, EMSI
OCCUPATIONS
The top twenty-five occupations in Saco complement a mix of industries spanning Health Care and Social Services,
Retail and Food Related industries, Education, and Construction. The top occupation in Saco is Personal Care Aides
with 325 jobs as of 2019. This occupation has grown nearly 28% since 2014 and is projected to continue adding
jobs into 2024. The highest paying top occupation is General and Operations Managers with average earnings of
$48.60 per hour. Overall, most of the top occupations have experienced job gains since 2014, and those that did
lose jobs declined only marginally.
Saco (04072) Top 25 Occupations by 2019 Job Figures, 2014 - 2024
2014 2019 2024 2014 - 2019 2014 - 2019 2019 - 2024 2019 - 2024 Avg. Hourly
SOC Description
Jobs Jobs Jobs Change % Change Change % Change Earnings
39-9021 Personal Care Aides 255 325 332 70 27.6% 7 2.0% $ 12.21
37-2011 Janitors and Cleaners, Except Maids and Housekeeping 220 252 276 32 14.7% 24 9.4% $ 16.49
41-2031 Retail Salespersons 181 199 211 18 9.7% 12 6.2% $ 14.42
35-3031 Waiters and Waitresses 175 185 191 10 5.7% 6 3.2% $ 14.67
35-3021 Combined Food Preparation and Serving Workers, 147 169 181 22 14.8% 12 7.2% $ 11.06
41-2011 Cashiers 165 169 170 4 2.3% 1 0.4% $ 11.77
11-1021 General and Operations Managers 154 167 171 13 8.3% 4 2.6% $ 48.60
49-3023 Automotive Service Technicians and Mechanics 147 165 173 18 11.9% 8 4.7% $ 19.41
31-1014 Nursing Assistants 175 155 149 (19) (11.0%) (6) (4.1%) $ 13.77
43-9061 Office Clerks, General 152 149 146 (3) (2.3%) (3) (2.0%) $ 16.91
25-9041 Teacher Assistants 116 133 138 18 15.2% 5 3.9% $ 16.82
43-4051 Customer Service Representatives 137 132 122 (4) (3.2%) (10) (7.7%) $ 17.17
35-2021 Food Preparation Workers 139 132 136 (7) (5.2%) 4 3.2% $ 13.08
43-6014 Secretaries and Administrative Assistants, Except 133 130 124 (4) (2.8%) (5) (4.0%) $ 18.31
53-3032 Heavy and Tractor-Trailer Truck Drivers 125 123 126 (1) (1.1%) 3 2.4% $ 23.08
37-2012 Maids and Housekeeping Cleaners 111 115 117 4 3.4% 2 1.9% $ 14.58
43-5081 Stock Clerks and Order Fillers 109 109 111 1 0.7% 2 1.5% $ 14.47
39-9011 Childcare Workers 113 107 101 (6) (5.6%) (5) (5.1%) $ 12.55
43-3031 Bookkeeping, Accounting, and Auditing Clerks 110 105 103 (6) (5.0%) (2) (1.9%) $ 19.67
25-2031 Secondary School Teachers, Except Special and 96 104 108 7 7.6% 4 4.1% $ 27.51
47-2031 Carpenters 99 102 100 3 3.3% (2) (2.3%) $ 21.46
35-3022 Counter Attendants, Cafeteria, Food Concession, and 103 101 102 (3) (2.4%) 1 1.0% $ 11.37
25-2021 Elementary School Teachers, Except Special Education 99 100 104 2 1.8% 4 3.7% $ 26.68
37-3011 Landscaping and Groundskeeping Workers 86 94 102 8 8.8% 8 8.5% $ 16.34
47-2061 Construction Laborers 84 91 92 7 8.3% 1 1.4% $ 17.89
Source: EMSI
4
Kauffman indicators of Entrepreneurship, 2018 New Employer Business Report: National and State Trends, March 2020.
11ECONOMIC DEVELOPMENT MARKET ANALYSIS FOR THE CITY OF SACO, ME
2020 Q1 DATA: JOBS BY INDUSTRY
The following table contains jobs data for the first quarter of 2020, right before the COVID-19 crisis accelerated and
began disrupting the economy.
Saco (04072) Jobs by Industry,2019 - 2020
2019 - 2020 2019 - 2020
NAICS Description 2019 Jobs 2020 Jobs
Change % Change
11 Agriculture, Forestry, Fishing and Hunting 0 0 0 0%
21 Mining, Quarrying, and Oil and Gas Extraction 0 0 0 0%
22 Utilities 35 37 3 8%
23 Construction 517 534 17 3%
31 Manufacturing 696 685 (11) (2%)
42 Wholesale Trade 363 377 14 4%
44 Retail Trade 1,154 1,176 22 2%
48 Transportation and Warehousing 235 273 38 16%
51 Information 87 92 6 7%
52 Finance and Insurance 343 352 9 3%
53 Real Estate and Rental and Leasing 115 118 3 2%
54 Professional, Scientific, and Technical Services 556 577 21 4%
55 Management of Companies and Enterprises 126 148 22 17%
Administrative and Support and Waste Management
56 616 599 (17) (3%)
and Remediation Services
61 Educational Services 504 505 1 0%
62 Health Care and Social Assistance 1,322 1,269 (53) (4%)
71 Arts, Entertainment, and Recreation 404 389 (15) (4%)
72 Accommodation and Food Services 928 952 24 3%
81 Other Services (except Public Administration) 397 401 4 1%
90 Government 936 1,023 87 9%
Total 9,333 9,507 174 2%
Source: EMSI
12ECONOMIC DEVELOPMENT MARKET ANALYSIS FOR THE CITY OF SACO, ME
WORKFORCE AND SKILLS ASSESSMENT
The workforce and skills assessment examines
workforce trends as they relate to business City of Saco Inflow/Outflow, 2017
development in Saco through commuter
trends, occupation trends, demand for
credentials, and academic completions in the
two-county region.
COMMUTER TRENDS
As of 2017, over 5,200 people commute into
the City of Saco for work. Approximately 1,400
Saco residents both live and work within the
city and nearly 8,600 residents commute out
of Saco for work.
Where Saco’s Workforce Lives | The
majority of Saco’s workforce lives within York
and Cumberland Counties with 21% residing
in the City of Saco, 12% in the City of
Biddeford, and 6% in the City of Portland. Source: U.S. Census Bureau, OnTheMap
Approximately 48% of Saco’s workers travel
less than 10 miles from their home to work at Saco businesses and 10.2% travel over 50 miles from areas including
Boston, MA, and Bangor, ME.
Where Saco’s Residents Work | Approximately 14.0% of City of Saco’s residents work within the city, with an
additional 20.4% working in the City of Portland, and 10.8% working within the City of Biddeford. The majority of
Saco residents work within the two-county region. In terms of distance traveled, 41% of Saco residents travel less
than 10 miles to work while 8% work over 50 miles from the city in places including Lewiston, ME, and Augusta, ME.
Where City of Saco Workers Live, 2017 Where City of Saco Residents Work, 2017
Number Percent Number Percent
Saco city (York, ME) 1,402 21.1% Portland city (Cumberland, ME) 2,042 20.4%
Biddeford city (York, ME) 811 12.2% Saco city (York, ME) 1,402 14.0%
Portland city (Cumberland, ME) 419 6.3% Biddeford city (York, ME) 1,075 10.8%
Old Orchard Beach town (York, ME) 264 4.0% South Portland city (Cumberland, ME) 948 9.5%
Sanford city (York, ME) 221 3.3% Scarborough town (Cumberland, ME) 799 8.0%
Scarborough town (Cumberland, ME) 211 3.2% Westbrook city (Cumberland, ME) 452 4.5%
South Portland city (Cumberland, ME) 167 2.5% Kennebunk town (York, ME) 223 2.2%
Waterboro town (York, ME) 159 2.4% Old Orchard Beach town (York, ME) 190 1.9%
Kennebunk town (York, ME) 148 2.2% Sanford city (York, ME) 167 1.7%
Lyman town (York, ME) 141 2.1% Buxton town (York, ME) 127 1.3%
All Other Locations 2,697 40.6% All Other Locations 2,564 25.7%
Total 6,640 100.0% Total 9,989 100.0%
Source: U.S. Census Bureau, OnTheMap Source: U.S. Census Bureau, OnTheMap
13ECONOMIC DEVELOPMENT MARKET ANALYSIS FOR THE CITY OF SACO, ME
The figure below displays the major employment centers within Saco and Biddeford, with the intensity of the blue
indicating job density.
Employment Centers Near Saco
Source: U. S. Ce ns us Bur eau, O nTheM ap
14ECONOMIC DEVELOPMENT MARKET ANALYSIS FOR THE CITY OF SACO, ME
The table below displays Saco’s net commuters by occupation as a measure of jobs within Saco compared to
residents within each occupation. The top occupation where workers commute into Saco to work is Automotive
Service Technicians and Mechanics with 82 net commuters. Most of these occupations are expected to grow and
therefore keep residents within Saco, except for Home Health Aides. The automation index (AI) 5 is displayed for f
these occupations to indicate which occupations are at high risk for automation. Sewing Machine Operators and
Cleaners of Vehicles and Equipment have a high AI of nearly 124 indicating they are at high risk for automation.
Top 10 Occupations Where Saco Imports Workers, 2024
Net
2019 - Residents in Avg.
Automation Commuters: Annual
SOC Description 2019 Jobs 2024 the Hourly
Index Jobs Less Openings
Change Occupation Earnings
Residents
49-3023 Automotive Service Technicians and Mechanics 165 8 105.9 83 82 18 $19.41
39-9021 Personal Care Aides 325 7 94.2 291 34 47 $12.21
39-3091 Amusement and Recreation Attendants 51 3 108.1 26 25 13 $11.98
51-3022 Meat, Poultry, and Fish Cutters and Trimmers 41 3 118.3 18 23 6 $13.77
53-7061 Cleaners of Vehicles and Equipment 49 4 123.7 28 21 8 $14.57
51-6031 Sewing Machine Operators 30 2 123.8 14 16 4 $15.07
39-9031 Fitness Trainers and Aerobics Instructors 46 3 84.4 32 14 9 $21.88
41-2022 Parts Salespersons 35 1 98.7 21 14 5 $16.30
31-1011 Home Health Aides 50 (1) 92.0 38 12 6 $13.17
Secondary School Teachers, Except Special
25-2031 104 4 84.9 93 11 9 $27.51
and Career/Technical Education
Source: EMSI
The table below displays the top ten occupations where Saco exports workers, meaning Saco residents are leaving
the city to work in other communities. These occupations are a mix of service workers and professionals. The
professionals that commute out of Saco for work include Registered Nurses, General and Operations Managers, and
Insurance Sales Agents which have higher earnings of $39 to $48 per hour. Overall, Saco sees a greater influx of
service occupations than it exports while a greater portion of professional occupations commutes out of Saco. This
indicates an opportunity to capture these professionals through small business growth in Saco.
Top 10 Occupations Where Saco Exports Workers, 2024
Net
2019 - Residents in Avg.
Automation Commuters: Annual
SOC Description 2019 Jobs 2024 the Hourly
Index Jobs Less Openings
Change Occupation Earnings
Residents
41-2031 Retail Salespersons 199 30 93.4 339 (140) 32 $14.42
29-1141 Registered Nurses 89 (4) 85.3 228 (139) 5 $32.51
43-4051 Customer Service Representatives 132 (15) 96.4 216 (84) 18 $17.17
43-9061 Office Clerks, General 149 (6) 102.0 231 (82) 18 $16.91
41-3021 Insurance Sales Agents 19 4 96.0 101 (82) 2 $28.98
35-3031 Waiters and Waitresses 185 16 129.8 261 (76) 37 $14.67
Secretaries and Administrative Assistants,
43-6014 130 (9) 91.4 202 (72) 15 $18.31
Except Legal, Medical, and Executive
11-1021 General and Operations Managers 167 17 82.2 235 (68) 16 $48.60
31-9092 Medical Assistants 27 5 97.3 94 (67) 4 $15.28
41-2011 Cashiers 169 5 105.5 223 (54) 33 $11.77
Source: EMSI
5
The automation index captures an occupation’s risk of being affected by automation relative to other occupations with 100 being an average worker,
values over 100 being at risk for automation, and values under 100 having a low automation risk. Automation index measures an occupation’s time spent
of high risk work and low risk work, number of high risk jobs in compatible occupations, and overall industry automation risk.
15ECONOMIC DEVELOPMENT MARKET ANALYSIS FOR THE CITY OF SACO, ME
CREDENTIALS AND SKILLED DEMANDED FOR MAJOR INDUSTRY SECTORS
Health Care
Credentials: The majority of Health Care positions in Saco require a high school diploma or equivalent. Nationally,
the health care sector is projected to grow as health care spending continues to rise. The Bureau of Labor Statistics
notes that providers are challenged with finding practitioners and support personnel to fill positions and that this
low supply is likely to continue.
Saco Health Care Skills Summary, 2019 - 2024
Entry Education Median Earnings 2019 - 2024
Sample Jobs 2019 Jobs
Level Range, Hourly Change
No Formal Maids and Housekeeping Cleaners; Cooks, Institution
$10.35 - $14.98 55 0
Credential and Cafeteria, Food Servers
Personal Care Aides; Childcare Workers; Home
H.S. or Equivalent $11.61- $18.49 625 9
Health Aides
Registered Nurses; Substance Abuse, Behavioral
Bachelor's Degree $24.17 - $51.84 Disorder, and Mental Health Counselors; Medical and 118 2
Health Services Managers
Mental Health and Substance Abuse Social Workers;
Postsecondary $26.09 - $114.31 Physical Therapists; Obstetricians and 221 (3)
Gynecologists
Source: EMSI
Skills: Job postings from October 2018 to October 2019 were analyzed to understand the most in-demand skills for
each sector. The top in-demand hard skills in Health Care are mental health, substance abuse, crisis intervention,
and nursing. The top common skills are a valid driver’s license, leadership, communications, and teaching. Within
Saco, the most in-demand Health Care qualifications include Licensed Clinical Social Workers, Certified Nursing
Assistant, and Licensed Clinical Professional Counselor.
Manufacturing
Credentials: Saco’s Manufacturing sector primarily requires a high school degree or equivalent with few
occupations requiring higher education. However, most of the occupations projected to decline to require a typical
entry-level education of a high school degree or equivalent. Training and education could help to transition those
workers into higher-earning positions within the same sector. The sector has the highest median hourly earnings
for no formal credential at $19.03 per hour.
Saco Manufacturing Skills Summary, 2019 - 2024
Entry Education Median Earnings 2019 - 2024
Sample Jobs 2019 Jobs
Level Range, Hourly Change
No Formal Meat, Poultry, and Fish Cutters and Trimmers;
$11.26 - $19.03 108 0
Credential Sewing Machine Operators; Packers and Packagers
Machinists; Production Workers; Sales
H.S. or Equivalent $13.21 - $27.71 260 (15)
Representatives; Metal Workers and Plastic Workers
General and Operations Managers; Computer
Bachelor's Degree $16,05 - $59.13 18 1
Programmer; Accountant
Postsecondary $29.83 - $65.99 Laywers; Statisticians; Economists 0 0
Source: EMSI
Skills: The most in-demand skills in the Manufacturing cover a variety of industries including rope manufacturers
with Yale Cordage being the top posting company, as well as the snack/food industry (Synder’s-Lance and Oakhurst
Dairy), laboratory (Maine Molecular Quality Controls), and construction (Andersen and Boise Cascade Building
Materials). The top hard skills include quality control, warehousing, palletizing, cycle counting, and material handling.
The top common skills include communications, sales, and management. Companies within this sector are seeking
16ECONOMIC DEVELOPMENT MARKET ANALYSIS FOR THE CITY OF SACO, ME
candidates with a Commercial Driver’s License. The most in-demand skills in the Manufacturing sector show that
these skills are not necessarily acquired at a four-year university.
Professional and Technical Services
Credentials: Most occupations in the Professional and Technical Services sector require a high school
diploma/equivalent or bachelor’s degree. Those occupations that require a bachelor’s degree do not require work
experience or training, meaning education alone is enough to fill the role.
Saco Professional and Technical Services Skills Summary, 2019 - 2024
Entry Education Median Earnings 2019 - 2024
Sample Jobs 2019 Jobs
Level Range, Hourly Change
No Formal Retail Salespersons, Telemarketer; Industrial Truck
$11.26 - $15.11 0 0
Credential and Tractor Operators
Tellers; Customer Service; Bookkeeping, Accounting,
H.S. or Equivalent $13.64 - $27.50 240 2
and Auditing Clerks
Civil Engineers; Accountants and Auditors;
Bachelor's Degree $25.21 - $59.13 266 21
Management Analysts
Postsecondary $29.83 - $38.95 Lawyers; Urban and Regional Planners; Economists 17 1
Source: EMSI
Skills: Sales and customer relationships are a large component of the Professional and Technical Service sector with
the most in-demand common skills being management, sales, customer service, communications. The most in-
demand hard skills include selling techniques, demonstration skills, Corrective and Preventive Action (CAPAC), and
Medicare.
Retail, Arts, and Accommodation and Food Services
Credentials: Most Retail, Arts, and Accommodation and Food Services occupations have no formal education
requirement. Typical training for occupations in this sector is short term on the job training. While butchers and
meat cutters have no education requirement, they often require long on the job training to advance their skills.
Nationally, automation is increasing efficiencies and reducing labor requirements throughout this sector through
automated hotel concierge, cashiers, etc. This will place increased emphasis on more skilled positions such as
Dietitian and Nutritionists that require higher education and internship training but are relatively rare in the Saco
community with less than 10 positions.
Saco Retail, Arts, and Accomodation and Food Services Skills Summary, 2019 - 2024
Entry Education Median Earnings 2019 - 2024
Sample Jobs 2019 Jobs
Level Range, Hourly Change
No Formal Retail Salespersons; Waiters and Waitresses;
$10.93 - $15.73 1,393 55
Credential Butchers and Meat Cutters
Stock Clerks and Order Fillers; First-Line Supervisors
H.S. or Equivalent $12.80 - $26.78 567 13
of Retail Sales Workers; Customer Service
General and Operations Managers; Bookkeeping,
Bachelor's Degree $10.01 - $26.65 84 2
Accounting, and Auditing Clerks; Coaches and
Postsecondary $20.80 - $62.81 Pharmacists; CuratorsECONOMIC DEVELOPMENT MARKET ANALYSIS FOR THE CITY OF SACO, ME
ACADEMIC COMPLETIONS AT REGIONAL INSTITUTIONS
The table below displays all academic institutions in York and Cumberland County and their attributed degree and
certificate completions in 2018. This represents the offerings in the region and the capacity and skillsets for
supporting businesses. Of the fifteen institutions, none are in the City of Saco and, therefore, the city draws from
regional institutions to educate its workforce. Primary institutions are the University of New England and the
University of Southern Maine. Southern Maine Community College is the primary resource for Associate’s degrees
in the region with 785 of the 1,017 degrees; the region is also served by York County Community College in Wells
for Associate’s degrees. Top programs for completions include social work, register nursing, and business
administration and management.
Academic Completions at York and Cumberland County Institutions, 2018
Certificate Associate's Bachelor's Master's Doctor's All
Institution
Completions Degrees Degrees Degree Degree Completions
University of New England 85 Not Offered 497 770 443 1,795
University of Southern Maine 134 0 1,130 388 85 1,737
Southern Maine Community College 37 785 Not Offered Not Offered Not Offered 822
Bowdoin College Not Offered Not Offered 670 Not Offered Not Offered 670
Saint Joseph's College of Maine 76 5 303 257 Not Offered 641
Northeast Technical Institute 276 Not Offered Not Offered Not Offered Not Offered 276
York County Community College 32 199 Not Offered Not Offered Not Offered 231
Kaplan University-Maine Campus 55 20 80 29 0 184
Spa Tech Institute-Westbrook 146 Not Offered Not Offered Not Offered Not Offered 146
Maine College of Art 30 Not Offered 91 20 Not Offered 141
Empire Beauty School-Maine 78 Not Offered Not Offered Not Offered Not Offered 78
The Landing School 44 8 Not Offered Not Offered Not Offered 52
Seacoast Career Schools-Sanford Campus 38 Not Offered Not Offered Not Offered Not Offered 38
Birthwise Midwifery School 8 Not Offered Not Offered Not Offered Not Offered 8
Institute for Doctoral Studies in the Visual Arts Not Offered Not Offered Not Offered 2 2 4
Total 1,039 1,017 2,771 1,466 530 6,823
Source: EMSI
18ECONOMIC DEVELOPMENT MARKET ANALYSIS FOR THE CITY OF SACO, ME
DEMOGRAPHIC AND SOCIOECONOMIC PROFILE
POPULATION AND HOUSEHOLDS
In 2019, the City of Saco had a population of nearly 20,000 among 8,282 households. Between 2010 and 2019,
Saco’s population grew at an annual rate of 0.89%, which was nearly double the state’s rate but lower than that of
York and Cumberland counties combined. During the same period, Saco’s household growth rate was higher than
the state and slightly higher than the combined counties indicating growth in small households in Saco.
Population, 2010 - 2024
Annual Annual
2010 2019 2024 Growth Rate Growth Rate
2010 - 2019 2019 - 2024
City of Saco 18,482 19,955 20,750 0.89% 0.78%
York and Cumberland Counties 478,805 519,257 541,990 0.94% 0.86%
Maine 1,328,361 1,381,874 1,409,603 0.45% 0.40%
Source: Esri
Households, 2010 - 2024
Annual Annual
2010 2019 2024 Growth Rate Growth Rate
2010 - 2019 2019 - 2024
City of Saco 7,623 8,282 8,633 0.96% 0.85%
York and Cumberland Counties 198,348 214,773 224,170 0.92% 0.88%
Maine 557,219 579,262 590,849 0.44% 0.40%
Source: Esri
AGE
The City of Saco and York and Cumberland Counties have a similar age distribution. As of 2019, the median age in
both geographies was approximately 44 years old. The population of both are highly concentrated in the 45-65 age
range.
19ECONOMIC DEVELOPMENT MARKET ANALYSIS FOR THE CITY OF SACO, ME
Median Age, 2010 - 2024
2010 2019 2024
City of Saco 41.8 43.9 44.1
York and Cumberland Counties 41.8 44.0 44.6
Maine 42.7 45.0 45.8
Source: Esri
INCOME
As of 2019, median household incomes were approximately $63,000 in the City of Saco, $69,000 in York and
Cumberland Counties, and $56,000 in Maine. The city has a lower proportion of households in the upper-income
categories higher than $75,000 compared to the surrounding two-county region. Earnings in the City of Saco, York
and Cumberland Counties, and Maine are projected to rise.
Households by Income, 2019
York and
City of Saco Cumberland Maine
Counties
< $15,000 564 6.8% 8.0% 11.3%
$15,000-$24,999 587 7.1% 7.5% 9.9%
$25,000-$34,999 727 8.8% 8.1% 9.9%
$35,000-$49,999 1,105 13.3% 11.3% 13.1%
$50,000-$74,999 1,853 22.4% 18.6% 19.2%
$75,000-$99,999 1,110 13.4% 15.1% 13.4%
$100,000-$149,999 1,471 17.8% 18.4% 14.4%
$150,000-$199,999 348 4.2% 6.3% 4.7%
$200,000 + 517 6.2% 6.6% 4.2%
Source: Esri
20ECONOMIC DEVELOPMENT MARKET ANALYSIS FOR THE CITY OF SACO, ME
RACE AND ETHNICITY
Esri’s diversity index measures the likelihood that two people, chosen at random from the same area, belong to
different races or ethnic groups. The diversity index is measured on a scale from 0 to 100, with 100 being the most
diverse. Saco, much like the two-county region, is primarily white with low diversity.
Population by Race and Ethnicity, 2019
York and
City of Saco Cumberland Maine
Counties
White 94.2% 92.9% 94.1%
Black/African American 1.2% 2.1% 1.5%
Asian 2.1% 1.9% 1.3%
American Indian/Alaska Native 0.2% 0.3% 0.7%
Pacific Islander 0.1% 0.0% 0.0%
Other Race 0.4% 0.5% 0.4%
Two of More Races 1.9% 2.2% 2.0%
Diversity Index 14.6 17.1 14.6
Source: Esri
21ECONOMIC DEVELOPMENT MARKET ANALYSIS FOR THE CITY OF SACO, ME
EDUCATIONAL ATTAINMENT
This indicator looks at the adult education level as defined by the highest level of education completed by the 25-
64-year-old population. Saco has slightly lower education attainment levels than the two-county region, but higher
than the state.
22ECONOMIC DEVELOPMENT MARKET ANALYSIS FOR THE CITY OF SACO, ME
UNEMPLOYMENT
As of 2019, the unemployment rate for Saco was 3.0%, the lowest of the benchmark geographies.
The figure below displays the annual unemployment rate for York County, Cumberland County, Maine, and the
United States for 2000 to September 2020 (2020 YTD). For all geographies, the 2007-2009 recession led to a spike
in unemployment. Between 2009 and 2018, the unemployment rate slowly declined until 2019.
Now in 2020, the COVID-19 pandemic is causing unemployment rates to rise quickly. As of September,
unemployment rates were as follows: Cumberland County 5.4%, York County 5.5%, State of Maine 6.1%, and United
States 7.9%. In October, the national unemployment rate fell by a percentage point – regional data is not yet
available.
23ECONOMIC DEVELOPMENT MARKET ANALYSIS FOR THE CITY OF SACO, ME
MIGRATION FLOWS
According to the 2013-2017 American Community Survey, York County had a net migration of 2,294 residents
during that 5-year time. Positive net migration and overall population gain demonstrate the county is both attracting
new residents and growing its current population.
Counties contributing the most inbound migration to York County, ME; Middlesex County, MA; Essex County, MA;
and Kennebec County, ME. The top outbound counties, or places that York County residents moved to include
Penobscot County, ME; Lake County, IL; Oxford County, ME; and Bexar County, TX.
The figure below displays the net migration for York County with counties represented in dark and light orange
indicate counties with populations that moved into York County and counties in light and dark blue notate areas
where York County residents migrated to.
Total New Migration Flows for York County, ME
Source: U.S. Census Bureau, American Community Survey 2013 – 2017
The Downeaster Amtrak serves the State of Maine and provides service to New Hampshire and Boston, MA. Saco’s
Amtrak station provided service to 48,158 passengers, including arrivals and departures, in 2018. 6 On average,
passenger trips are 86 miles in length with the top destination by ridership and revenue being the Boston-North
Station. It is important to note that Boston-North is the most southern destination on the Downeaster, and
passengers would need to travel 3.7 miles to Boston-South station to continue trips beyond Boston. Other top
destinations by ridership include Portland, ME; Durham-UNH, NH; Haverhill, MA; and Woburn, MA.
6
National Association of Railroad Passengers
24ECONOMIC DEVELOPMENT MARKET ANALYSIS FOR THE CITY OF SACO, ME
RETAIL SNAPSHOT
SUPPLY
Maine Department of Revenue Services provides data on monthly taxable sales to the public. The City of Saco falls
within the Biddeford Economic Summary Area (ESA) 7 where overall sales have increased across all retail sectors from
2007 to 2019, from $668 million to $972 million. During that period, taxable sales within Saco increased from $244
million to $279 and accounted for roughly 37-41% of the total sales within the Biddeford ESA.
Between 2007 and 2019, the auto/transportation sector increased by nearly $117 million or a 63% growth. Nearly
all that growth occurred within the City of Saco. Conversely, sales within the other retail categories are more
dispersed between municipalities within the Biddeford ESA. As of 2019, Auto/Transportation sales in Saco accounted
for 86% of the sales in the Biddeford ESA while Building Supply sales accounted for roughly 3%.
7
The Biddeford Economic Summary Area includes Bar Mills, Biddeford, Buxton, Dayton, Hollis, Limington, Ocean Park, Old
Orchard Beach, and Saco.
25You can also read