Regional Development Profile City of Cape Town 2013 - Working paper - Western Cape Government Provincial Treasury
←
→
Page content transcription
If your browser does not render page correctly, please read the page content below
Western Cape Government
Provincial Treasury

Regional Development Profile
City of Cape Town

2013

Working paper
To obtain additional information of this document, please contact:

Western Cape Provincial Treasury
Local Government Budget Office
Private Bag X9165
7 Wale Street
Cape Town
tel: +27 21 483 3386 fax: +27 21 483 4680

This publication is available online at www.westerncape.gov.za
City of Cape Town

Contents
Introduction                                                                            3
1.    Demographics                                                                      4
      1.1      Population Size                                                          4
      1.2      Age and Gender Distribution                                              6
      1.3      Population Groups                                                        8
2.    Social Development and Well-being                                                 8
      2.1      Education and Human Development                                          8
      2.1.1    Literacy                                                                 9
      2.1.2    Early childhood development                                              9
      2.1.3    Educational attainment                                                  11
      2.1.4    Learner enrolment, learner teacher ratio and drop-out rates             12
      2.1.5    Access to Further Education and Training Facilities and                 13
               Media Centres/Libraries
      2.1.6    No fee schools                                                          14
      2.1.7    Education Outcomes (Matric Pass Rate)                                   14
      2.2      Healthcare Services                                                     15
      2.2.1    Healthcare Facilities                                                   15
      2.2.2    HIV/AIDS Treatment and Care                                             16
      2.2.3    Child Health                                                            17
      2.2.4    Maternal Health                                                         19
      2.2.5    Community Based Services                                                22
      2.3      Safety and Security                                                     23
      2.4      Poverty and Inequality                                                  24
      2.4.1    Human Development Index                                                 24
      2.4.2    People Living in Poverty                                                25
      2.4.3    Indigent Households                                                     27
      2.4.4    Household Income                                                        27
      2.4.5    Gini Coefficient                                                        27

                                                                                         i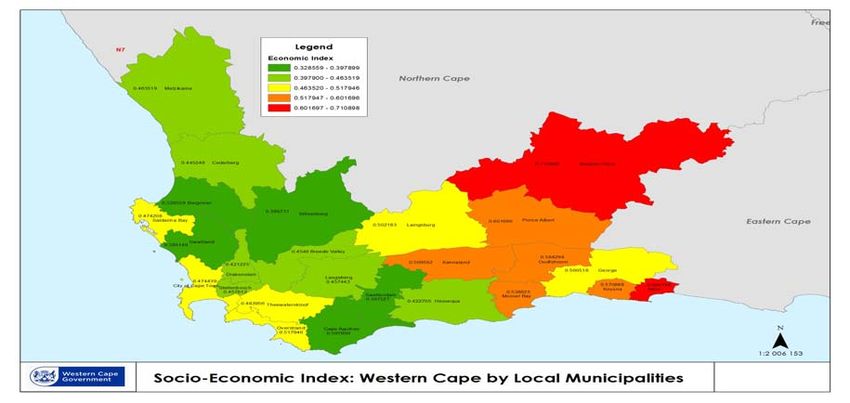
Regional Development Profile 2013
2.5 Poverty indices 28
2.5.1 The socio-economic index (overall index) 29
2.5.2 The household services sub-index 31
2.5.3 The education sub-index 33
2.5.4 The housing sub-index 35
2.5.5 The economic sub-index 37
2.6 Access to Housing 39
2.7 Access to Municipal Services 40
2.7.1 Water 40
2.7.2 Energy 42
2.7.3 Sanitation 43
2.7.4 Refuse Removal 45
3. Economically Active Population 46
3.1 Labour Force 46
3.2 Unemployment 47
3.2.1 The Unemployment Rate 47
3.2.2 Characteristics of the Unemployed 48
4. Economy 49
4.1 The Cape Metropolitan Area (CMA) economy 52
4.2 Growth and employment trends in a provincial context 53
4.3 Macro implications and district economic outlook 56
4.4 Economy: Concluding remarks 58
5. Finance and Resource Mobilisation 59
6. Environmental Management 62
6.1 Regional Water Volumes and Losses 63
6.2 Water Quality 64
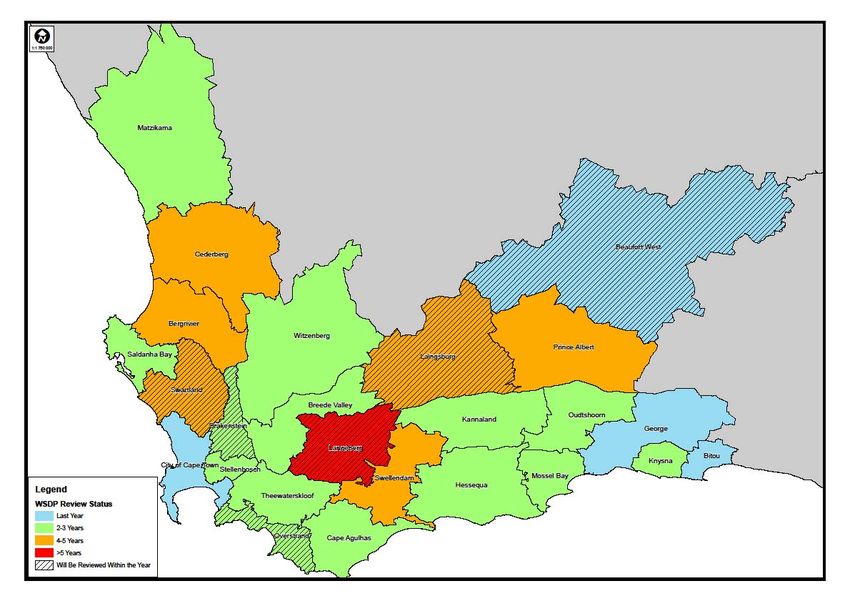
6.3 Current legislation around Water Services Development 65
Plans (WSDPs)
6.4 Waste Water Treatment 68
6.5 Integrated Waste Management Plans 69
6.6 Status of the City’s Spatial Planning 70
6.7 Air Quality Management 72
Cautionary Note 74
References 75
ii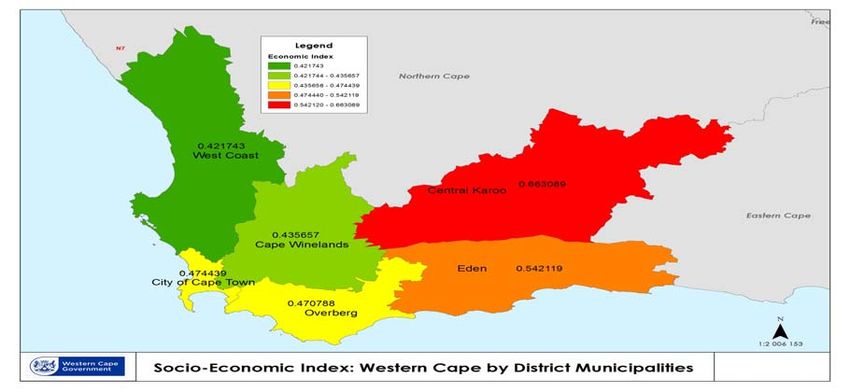
City of Cape Town

Tables
Table 1    Western Cape population numbers 2001 and 2011;                       4
           population projections 2012 and 2013

Table 2    Comparison of population numbers across South Africa’s               5
           Metropolitan Municipalities, Census 2001 and 2011

Table 3    City of Cape Town, 2001 and 2011 Population by Age                   7
           group

Table 4    City of Cape Town Population by Population Group, 2001               8
           and 2011

Table 5    Literacy rates, 2011 intra-provincial comparison                     9

Table 6    Early childhood development facilities, City of Cape Town           11
           2013

Table 7    City of Cape Town Learner enrolment, Learner-teacher                13
           ratio and Dropout rate, 2012 and 2013

Table 8    Schools with Libraries/Media Centres in the City of Cape            13
           Town, 2012 and 2013

Table 9    No Fee Schools in the City of Cape Town, 2012 and 2013              14

Table 10   Number of Western Cape Healthcare Facilities                        16

Table 11   HIV/AIDS Prevalence and Care                                        17

Table 12   Child Health in the Western Cape: Full Immunisation and             18
           Malnutrition

Table 13   Child Health in the City of Cape Town: Full Immunisation            18
           and Malnutrition

Table 14   Maternal Health in the Western Cape: Maternal Mortality             19

Table 15   Maternal Health in the City of Cape Town: Maternal                  19
           Mortality

Table 16   Maternal Health in the Western Cape: Births to Women                20
           under 18 years

Table 17   Maternal Health in the City of Cape Town: Births to                 20
           Women under 18 years

Table 18   Maternal Health in the Western Cape: Termination of                 21
           Pregnancy

Table 19   Maternal Health in the City of Cape Town: Termination of            21
           Pregnancy

Table 20   Community Based Services by Non-profit Organisations:               22
           Western Cape

                                                                                iii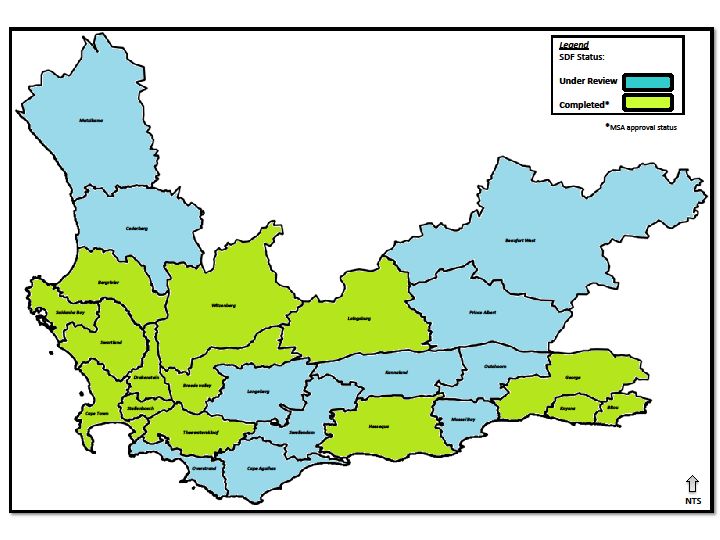
Regional Development Profile 2013

 Table 21       Community Based Services by Non-profit Organisations:       23
                City of Cape Town

 Table 22       Crime in the City of Cape Town: April to March 2003/04 –    24
                2012/13

 Table 23       HDI 2001, 2007 and 2010                                     25

 Table 24       Poverty Rate – Percentage of People Living in Poverty,      26
                2001, 2007 and 2010

 Table 25       Household Income                                            27

 Table 26       Gini Coefficient 2001, 2007, 2010                           28

 Table 27       Access to housing in the City of Cape Town, 2001 and        40
                2011

 Table 28       Access to water in the City of Cape Town, 2001 and 2011     41

 Table 29       Energy Sources used for cooking in the City of Cape Town,   43
                2001 and 2011

 Table 30       Access to sanitation in the City of Cape Town, 2001 and     44
                2011

 Table 31       Access to refuse removal in the City of Cape Town, 2001     46
                and 2011

 Table 32       Working Age Population and Labour Force details, 2001       47
                and 2011

 Table 33       Comparison of Labour Force Information across Western       47
                Cape Municipal Areas, 2011

 Table 34       Characteristics of the Unemployed, 2011                     48

 Table 35       Western Cape economy sectoral growth and                    50
                employment: 2000 – 2011

 Table 36       Western Cape Province: Real GDPR growth forecast:           51
                2013 – 2017

 Table 37       Cape Metro: Sectoral contribution to recovery growth:       52
                2010 - 2011 and employment creation

 Table 38       Cape Metro economy in provincial perspective: Sectoral      54
                composition: 2011

 Table 39       Cape Metro economy in provincial perspective: Real          55
                GDPR growth: 2000 - 2011

 Table 40       Cape Metro GDPR and employment trends: 2000 – 2011          56

 Table 41       National Transfers to the City of Cape Town, 2013/14        60

 Table 42       Provincial Transfers to the City of Cape Town               61

iv
City of Cape Town
Table 43 Provincial Payments and Estimates to the City of Cape 62
Town
Table 44 Summary of Western Cape Regional System Input 63
Volumes and Non-Revenue Water and Water Losses, 2013
Table 45 Number of Water Systems Monitored 64
Table 46 IWMP: City of Cape Town 70
Table 47 Status of the City’s Spatial Planning, 2013 72
Figures
Figure 1 City/district population as a percentage of Western 5
Cape – 2001 and 2011
Figure 2 2001 and 2011 Population figures for SA’s major 6
metropolitan areas
Figure 3 City of Cape Town Population Pyramid, 2001 6
Figure 4 City of Cape Town Population Pyramid, 2011 7
Figure 5 Comparison of City education levels - Census 2001 and 12
2011
Figure 6 Poverty Overview - City of Cape Town, 1996 – 2010 26
Figure 7 2001 - 2011 Districts/City comparison of access to formal 39
housing
Figure 8 2001 - 2011 Districts/City comparison of piped water 41
access
Figure 9 2001 - 2011 Districts/City comparison of access to 42
electricity for cooking
Figure 10 2001 - 2011 Districts/City comparison of access to flush 44
toilets
Figure 11 2001 - 2011 Districts/City comparison of access to refuse 45
removal
Maps
Map 1 Socio-economic index: Inter-municipal comparison 29
Map 2 Socio-economic index: Inter-district comparison 29
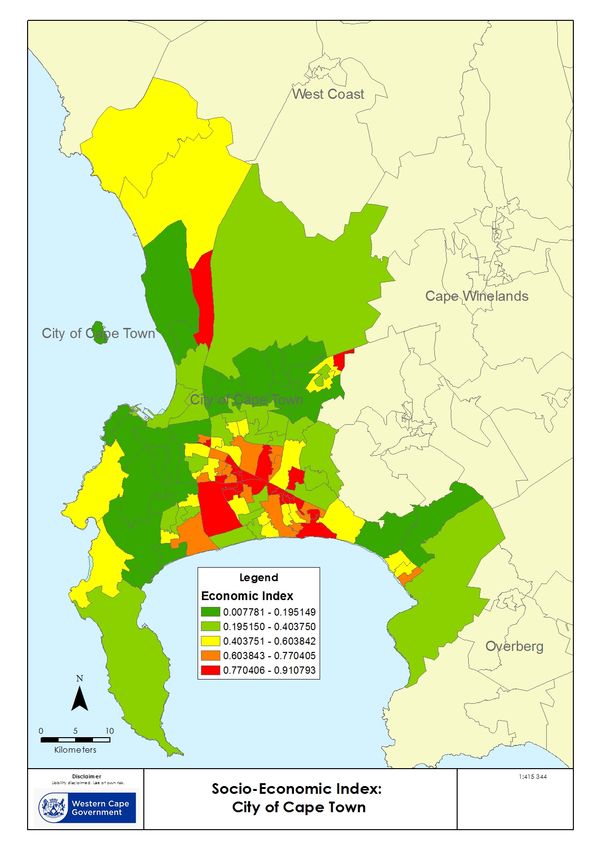
Map 3 Socio-economic index: City of Cape Town wards 30
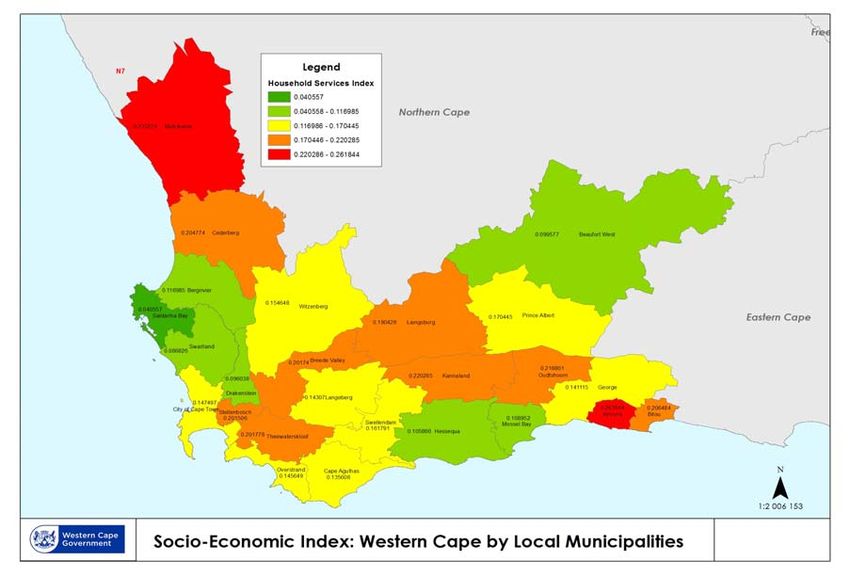
Map 4 Socio-economic index: Household services - inter- 31
municipal comparison
vRegional Development Profile 2013
Map 5 Socio-economic index: Household services - inter-district 31
comparison
Map 6 Socio-economic index: Household services – City of Cape 32
Town wards
Map 7 Socio-economic index: Education - inter-municipal 33
comparison
Map 8 Socio-economic index: Education - inter-district 33
comparison
Map 9 Socio-economic index: Education – City of Cape Town 34
wards
Map 10 Socio-economic index: Housing - inter-municipal 35
comparison
Map 11 Socio-economic index: Housing - inter-district comparison 35
Map 12 Socio-economic index: Housing – City of Cape Town 36
wards
Map 13 Socio-economic index: Economic - inter-municipal 37
comparison
Map 14 Socio-economic index: Economic - inter-district 37
comparison
Map 15 Socio-economic index: Economic – City of Cape Town 38
wards
Map 16 WSDP review status 68
Map 17 SDF status 71
viCity of Cape Town
City of Cape Town
1Regional Development Profile 2013
City of Cape Town at a glance
Population 2001 2011
City of Cape Town 2 893 247 3 740 026
Western Cape 4 524 331 5 822 734
City of Cape Town as a percentage of Western Cape 63.9% 64.2%
Percentage share by race group 2001 2011
African 31.7% 38.6%
Coloured 48.1% 42.4%
Indian/Asian 1.4% 1.4%
White 18.8% 15.7%
Other N/A 1.9%
Socio-economic indicators
Health
Primary Healthcare Facilities 2013 Number
Community Health Centres 9
Community Day Centres 37
Clinics 82
Satellite clinics 17
Mobile clinics 4
District hospitals 9
Regional hospitals 2
2011/12 2012/13
Immunisation rate 87.5% 89.5%
Anti-retroviral patient load (HIV/AIDS) 115 533 134 212
Crime (numbers) 2010/11 2011/12 2012/13
Murder 1 801 1 604 1 860
Total sexual crimes 5 417 5 173 4 790
Drug related crimes 46 506 50 326 53 715
Poverty levels 2001 2010
Poverty rate (percentage of people living in poverty) 23.9% 19.7%
Number of indigent households – September 2013 432 385
Unemployment rate 2001 2011
29.8% 23.9%
Access to housing and municipal services (Percentage 2001 2011
share of households with access)
Formal dwellings 77.2% 78.4%
Informal dwellings 18.4% 20.5%
Electricity for cooking 80.1% 88.2%
Flush toilets (sewerage system) 85.3% 89.1%
Piped water inside dwelling 69.3% 75.0%
Refuse removal (by local authority at least once a week) 94.2% 94.3%
Economy
GDP-R (R billion) 2010
City of Cape Town - current prices 250.281
City of Cape Town as percentage of Western Cape 73.6%
City of Cape Town – Constant 2005 prices 179.052
Average annual growth, 2000 - 2010 4.1%
Largest sector contributions to GDP-R in 2010-2011 2010 2011
Finance, insurance, real estate and business services 34.2% 36.1%
Wholesale and retail trade, catering and 16.3% 15.2%
accommodation
Manufacturing 14.3% 15.9%
Transport, storage and communication 10.9% 10.9%
2City of Cape Town
Introduction
Regional profiles provide Western Cape municipalities with information which may
assist in planning, budgeting and the prioritisation of municipal services. It is
acknowledged that municipalities across the Western Cape have different capacities
and therefore will use the information in this profile in a way that suits their own needs.
The areas covered in this profile include information on demographics, education,
health, crime, poverty, housing, municipal services, labour force, economy,
government finance and environmental management.
The indicators reflect the socio-economic reality of municipalities. As such, valuable
insight can be gained as to the developmental challenges faced by communities
residing within a specific geographical area.
This profile uses data1 primarily sourced from Statistics South Africa, administrative
data from sector departments, the Municipal Economic Review and Outlook and
Quantec. The data from sector departments are the most recent, while Statistics
South Africa’s 2011 Census represents the latest municipal level data; comparisons
are also made with the 2001 Census.
The format of the profiles allow for easy readability with data being displayed in
tabular or graphical format, with the relevant descriptive analysis.
The information contained in this profile highlights information for the City of Cape
Town in relation to the Western Cape and its district municipalities. Since the greater
part of the Province’s population (63.9 per cent in 2011) as well as the greatest Rand
value of the Province’s economic activity (73.6 per cent in 2010) takes place within
the City’s borders, the City often dominates Western Cape discussions on socio-
economic realities. Yet, the City only accounts for 1.9 per cent (2 440 km2) of the
Province’s total geographic space (129 462 km2)2.
1 A caveat to the data used to inform the analysis contained in this profile has been attached in the form
of a cautionary note at the end of the profile.
2 Demarcation Board.
3Regional Development Profile 2013
1. Demographics
The demographics of a population refer to selected population characteristics such
as age, gender, population group and income levels. Demographic characteristics
inform key policy decisions, for example, a household’s income level determines
whether or not the household qualifies to be classified as indigent. Having indigent
status in turn entitles that household to certain benefits, such as free basic services as
stipulated in the Indigent Policy of the municipality.
A thorough understanding of population changes is necessary to ensure that
planning is informed. This section outlines the gender, age and racial (population
group) distribution of the population of the City of Cape Town.
1.1 Population Size
The Western Cape population increased to 5 822 734 in 2011 from 4 524 331 in 2001
according to survey results from Statistics South Africa. Table 1 below shows the
growth rates in population figures for district municipalities and the metro in the
Western Cape Province between 2001 and 2011.
Table 1 Western Cape population numbers 2001 and 2011; population projections
2012 and 2013
Percentage
Stat SA 2001 Stats SA 2011 Average annual
Population num bers population grow th
Census Census grow th rate
2001 - 2011
City of Cape Tow n 2 893 247 3 740 026 29.3% 2.6%
West Coast 282 673 391 766 38.6% 3.3%
Cape Winelands 629 490 787 490 25.1% 2.3%
Overberg 203 520 258 176 26.9% 2.4%
Eden 454 919 574 265 26.2% 2.4%
Central Karoo 60 482 71 011 17.4% 1.6%
Western Cape 4 524 331 5 822 734 28.7% 2.6%
Source: Statistics South Africa Census 2001 and Census 2011
The City of Cape Town had the second largest increase in population, having
expanded nearly 30 per cent between the two Census years. The West Coast District
registered the biggest increase in population, with over 100 000 more people (or
38.6 per cent) living in the District in 2011 compared to 2001. The Central Karoo, which
has the smallest population in the Province, grew the least between 2001 and 2011.
The average annual growth for the districts and the Metro between 2001 and 2011 is
2.6 per cent.
Close to two thirds of the Western Cape population lives in the City of Cape Town as
depicted in Figure 1 below. The Cape Winelands and Eden district municipalities are
second and third respectively in terms of population numbers as shown in Figure 1
below.
4City of Cape Town
Figure 1 City/district population as a percentage of Western Cape – 2001 and 2011
70%
% Western Cape Population
60%
50%
40%
30%
20%
10%
0%
City of Cape Cape
West Coast Overberg Eden Central Karoo
Town Winelands
2001 63.9% 6.2% 13.9% 4.5% 10.1% 1.3%
2011 64.2% 6.7% 13.5% 4.4% 9.9% 1.2%
Source: Statistics South Africa Census 2001 and Census 2011
The City’s population as a proportion of the Western Cape’s population increased
from 63.9 per cent in 2001 to 64.2 per cent in 2011 due to increased urbanisation. The
West Coast District’s population as a proportion of the province also increased to
6.7 per cent. While the City and West Coast populations have shown an increase in
proportion to that of the Western Cape, there are marginal declines in the
proportions for the Cape Winelands, Overberg, Eden and Central Karoo.
Table 2 below shows a comparison of population figures for metropolitan
municipalities around the country.
Table 2 Comparison of population numbers across South Africa’s Metropolitan
Municipalities, Census 2001 and 2011
Average annual
Stats SA 2001 Stats SA 2011
Metro Province growth rate
Census Census
2001 - 2011
City of Johannesburg Gauteng 3 308 568 4 434 827 3.0%
City of Cape Town Western Cape 2 799 496 3 740 026 2.9%
eThekwini (Durban) KwaZulu-Natal 3 091 938 3 442 361 1.1%
Ekurhuleni Gauteng 2 538 320 3 178 470 2.3%
City of Tshwane Gauteng 2 055 720 2 921 488 3.6%
Nelson Mandela Bay Metro Eastern Cape 1 036 774 1 152 115 1.1%
Source: Statistics South Africa Census 2001 and Census 2011
Table 2 above shows that the population in the City of Tshwane increased by 3.6 per
cent between 2001 and 2011 while the City of Johannesburg and the City of Cape
Town both grew by approximately 3 per cent over the same period. The population
of eThekwini Municipality grew the least between the two Census years, growing by
just over 1 per cent. Figure 2 below illustrates the population increases in the major
metropolitan areas in South Africa.
5Regional Development Profile 2013
Figure 2 2001 and 2011 Population figures for SA’s major metropolitan areas
5 000 000
4 500 000
4 000 000
3 500 000
3 000 000
2 500 000
2 000 000
1 500 000
1 000 000
500 000
0
Nelson
City of City of Cape eThekwini City of
Ekurhuleni Mandela Bay
Johannesburg Town (Durban) Tshwane
Metro
2001 3 308 568 2 799 496 3 091 938 2 538 320 2 055 720 1 036 774
2011 4 434 827 3 740 026 3 442 361 3 178 470 2 921 488 1 152 115
Source: Statistics South Africa Census 2001 and Census 2011
Compared to other metropolitan municipalities, the City of Cape Town is one of the
larger metros in the country, second only to the City of Johannesburg with 3.7 million
people. In terms of population numbers, it is most similar to eThekwini (Durban), with
approximately 3.4 million people.
1.2 Age and Gender Distribution
The population pyramids in Figures 3 and 4 below shows the age and gender
distributions of the City of Cape Town’s population in 2001 and 2011.
In both 2001 and 2011, it is evident that the bulk of the population is between the
ages of 15 and 65 years, the economically active population.
Figure 3 City of Cape Town Population Pyramid, 2001
City of Cape Tow n
2001
85 +
80 - 84
75 - 79
70 - 74
65 - 69
60 - 64
55 - 59
50 - 54
45 - 49
Age
40 - 44
35 - 39
30 - 34
25 - 29
20 - 24
15 - 19
10 - 14
5-9
0-4
200 000 150 000 100 000 50 000 0 000 50 000 100 000 150 000 200 000
Male Female
Source: Statistics South Africa Census 2001
6City of Cape Town
Figure 4 City of Cape Town Population Pyramid, 2011
City of Cape Town
2011
85 +
80 - 84
75 - 79
70 - 74
65 - 69
60 - 64
55 - 59
50 - 54
Age
45 - 49
40 - 44
35 - 39
30 - 34
25 - 29
20 - 24
15 - 19
10 - 14
5-9
0-4
300 000 200 000 100 000 0 100 000 200 000 300 000
Male Female
Source: Statistics South Africa Census 2011
When comparing the shape of the 2001 and 2011 population pyramids, population
decreases are particularly noticeable at ages 5 to 14 years. This will have particular
implications for the provision of facilities and services related to children and child
care. However, the youth population between 15 and 40 years remains robust
between the two Census years. This growth in the labour force will also have a direct
impact in a greater need for employment opportunities.
A crude breakdown of different age groups is presented in Table 3 below; 0 to
14 years representing children, 15 to 64 years the working age population and
65 years and older the aged; the 15 to 34 year group represent the youth.
Table 3 City of Cape Town, 2001 and 2011 Population by Age group
Annual
Percentage Percentage
Average
Age group 2001 2011 population population
Grow th
2001 2011
2001 - 2011
0 -14 years Children 771 066 928 329 26.65 24.80 1.87%
15 - 64 years Working age 1 977 994 2 604 210 68.37 69.60 2.79%
65+ years Aged 144 190 207 487 4.98 3.90 3.71%
15 - 34 years Youth 1 111 807 1 414 221 38.43 37.80 2.44%
Source: Statistics South Africa Census 2001 and Census 2011
Between 2001 and 2011 there have been changes in the proportion of each of the
age groups in relation to the total population size. It is noted that the City’s overall
population shows some signs of ageing, with the proportions in the relatively older
age groups increasing the most as shown by the relatively high average annual
growth of 3.71 per cent for the 65 and older age group. An increase in the proportion
of the working age population is also noted.
The child dependency ratio for the City, based on the 2011 Census, is 35.6 per cent
and the aged dependency ratio during the same period is 8 per cent. Adding these
two ratios together, the total dependency ratio for the City amounts to 43.6 per cent
7Regional Development Profile 2013
in 2011, which is nearly half the population. This highlights the extent of support that
the City needs to take into consideration when planning service delivery. For the
Province as a whole, the total dependency ratio is slightly higher, at 44.9 per cent.
1.3 Population Groups
As is evident in Table 4, increases in the City’s population numbers are noted across
all population groups between 2001 and 2011.
Table 4 City of Cape Town Population by Population Group, 2001 and 2011
Average
Percentage of Percentage of Annual
Population Group 2001 Population 2011 Population Grow th rate
2001 2011 2001 - 2011
%
African 916 695 31.7 1 444 939 38.6 4.7%
Coloured 1 392 426 48.1 1 585 286 42.4 1.3%
Indian or Asian 41 552 1.4 51 786 1.4 2.2%
White 542 567 18.8 585 831 15.7 0.8%
Other - - 72 184 1.9 -
Total 2 893 240 100.0 3 740 026 100.0
Source: Statistics South Africa Census 2001 and Census 2011
The African group showed the largest proportional changes between 2001 and 2011,
increasing from 31.7 to 38.6 per cent. The Coloured population group’s proportion
declined from 48.1 to 42.4 per cent while the White population group’s proportional
size of the City’s population decreased from 18.8 to 15.7 per cent. The Indian/Asian
population group, although relatively small in actual size, remained stable at 1.4 per
cent.
2. Social Development and Well-being
2.1 Education and Human Development
Education and training improves access to employment opportunities and helps to
sustain and accelerate overall development. It expands the range of options
available from which a person can choose to create opportunities for a fulfilling life.
Through indirect positive effects on health and life expectancy, the level of
education of a population also influences its welfare.
Selected indicators affecting the education and skill levels in communities discussed
here are the literacy rate and access to training facilities in the municipal area. An
indication of the number of no fee schools in the City is also included; this gives a
sense of the extent to which the Department of Education has identified and
prioritised support to households who are unable to make a financial contribution
towards the cost of education.
8City of Cape Town
2.1.1 Literacy
Literacy is used to indicate a minimum education level attained. A simple definition of
literacy is the ability to read and write, which is more strictly defined as the successful
completion of a minimum of 7 years of formal education. Since most learners start
school at the age of 7 years, the literacy rate is calculated as the proportion of those
14 years and older who have successfully completed a minimum of 7 years of formal
education.
A comparison of the intra-provincial literacy rates for 2011 is provided in Table 5
below. In 2011, the Western Cape’s literacy rate3 was 87.2 per cent.
Table 5 Literacy rates, 2011 intra-provincial comparison
Municipal area Literacy rate 2011
City of Cape Town 90.5%
West Coast 79.1%
Cape Winelands 81.7%
Overberg 81.1%
Eden 82.6%
Central Karoo 73.4%
Western Cape 87.2%
Source: Statistics South Africa, Census 2011
Compared with other Western Cape district averages, the City of Cape Town ranked
highest with a literacy rate of 90.5 per cent. The City was followed by the Eden district
at a rate of 82.6 per cent.
2.1.2 Early childhood development
The Western Cape Government has prioritised investment in Early Childhood
Development (ECD) as:
• A vehicle for early intervention and child protection;
• The basis for improving school outcomes and laying the foundation for lifelong
learning;
• A means to reduce childhood poverty; and
• An opportunity to develop the skills and competencies required for economic
opportunities in later life.
The vision is that, in a world fit for children, the outcomes for every child should be:
“…A nurturing, caring and safe environment to survive, be physically healthy,
mentally alert, emotionally secure, socially competent and be able to learn.” (United
Nations, A World Fit for Children 2002)
3 Based on Census 2011 data.
9Regional Development Profile 2013 The mission is to facilitate, measure and monitor the provision of a range of ECD services and programmes that include a developmentally appropriate curriculum, knowledgeable and trained staff and educators, and support the health, nutrition, physical and social well-being of children. To reach the goal, to ensure that children have opportunities to access a range of quality, developmentally appropriate ECD programmes that promote their care, protection and development. Objectives of the ECD Programme is to: 1. To develop a range of quality, developmentally appropriate inclusive ECD programmes that promote the care, protection and development of all children to their full individual potential, particularly their intellectual development in respect of mathematical concepts and language acquisition, with a focus on home language and English. 2. To offer comprehensive services to children that support their health, nutrition and social well-being. 3. To encourage ECD programmes which build on the strengths, traditions and resourcefulness of families and communities. 4. To promote the development of healthy and accessible physical environments for children in ECD programmes. 5. To promote quality services through the implementation of norms and standards and on-going research. 6. To train ECD service providers as well as parents and caregivers. 7. To develop and implement mechanisms for integration, co-ordination and inter- sectoral collaboration. 8. To promote the implementation of an integrated management information system. As seen in Table 6 below, there is a total of 832 registered ECD facilities within the City of Cape Town serving nearly 38 000 children, 584 of which are funded by the Western Cape Department of Social Development. 10
City of Cape Town

Table 6       Early childhood development facilities, City of Cape Town 2013

                                                                       Number of
                                                  Number of
                                                                  children accessing     Number of
          Region                Area             ECD facilities
                                                                   ECD services in facilities registered
                                                   funded
                                                                   funded facilities

Metro South                                                                                       271
                          Athlone                          36                2 964
                          Mitchell’s Plain                 36                2 856
                          Wynberg                          29                2 224
                          Gugulethu                        116               8 189
                                                           217              16 233
Metro East                                                                                        255
                          Khayelitsha                      199              12 383
                          Eerste River                     94                5 043
                                                           293              17 426
Metro North                                                                                       306
                          Bellville                        54                2 769
                          Cape Town                        20                1 495
                                                           74                4 264
Total                                                      584              37 923                832

Source: Department of Social Development, 2013

2.1.3     Educational attainment

An advantage of having access to the educational attainment levels of the
communities of a municipal area is that it allows the Western Cape Education
Department (WCED) and the Municipality to proactively plan services by taking into
account the needs as well as the developmental potential of the region.
Municipalities may further use the information of the education profiles to attract
businesses while providing specific motivation for the retention of specific types of
businesses and industries already in the municipal area. It further equips the
municipality with the relevant information in making presentations to businesses,
industries and satellite offices where decision on the possible location is a
consideration.

Comparison of education levels - Census 2001 and 2011

Figure 5 below shows that the most significant change in education levels (for those
aged 5 years and older) for the City of Cape Town was in the number of people with
some primary schooling, which jumped nearly 200 per cent from 216 414 people in
2001 to 647 356 people in 2011.

                                                                                                        11
Regional Development Profile 2013
Figure 5 Comparison of City education levels - Census 2001 and 2011
1 400 000
1 200 000
1 000 000
800 000
600 000
400 000
200 000
0
Complete Some Grade 12/
No Schooling Some primary Higher
primary secondary Std 10
2001 77 191 216 414 130 388 713 308 466 625 230 946
2011 80 207 647 356 173 530 1 194 105 773 987 411 401
Source: Statistics South Africa Census 2001 and Census 2011
An increase can also be seen in the number of people with higher education in the
City of Cape Town, which increased by 78.1 per cent from 230 946 in 2001 to 411 401
in 2011. There is also a marked increase in the number of people with some
secondary education and Grade 12 or Standard 10 between 2001 and 2011. The
number of people with some secondary schooling has increased by 67.4 per cent
between 2001 and 2011 while those with Grade 12 have increased by 65.9 per cent.
The number of people in the City of Cape Town with no schooling has increased by
only 3.9 per cent between 2001 and 2011. On average, there was an increase in
education levels amongst the people living in the City of Cape Town between 2001
and 2011.
2.1.4 Learner enrolment, learner teacher ratio and drop-out rates
Population dynamics, which include knowledge of the current population profile and
projected learner growth, provide a basis for sound education planning. Knowing the
learner enrolment numbers of a municipality enables the Western Cape Education
Department (WCED) to determine the level of demands placed on schools for the
current year as well as anticipated demands for future years. Having a sense of the
exit points allows the WCED to plan more effectively with respect to Further Education
and Training (FET).
This information should further be used by local government and business partners in
the region to assess the current and potential skills base in a region. Learners in a
farming area for example may be encouraged through various support initiatives
such as learnerships, apprenticeships and bursaries to consider agriculture related
studies, often offered at FET colleges, the Department of Agriculture (through various
diploma courses) and tertiary studies at universities. These are often done in an effort
to retain skills in the region or to develop the potential of the people in this area. One
area where challenges exist is to ensure that sufficient technical curricula exists,
12City of Cape Town
particularly those of engineers, agricultural extension officers and various categories
of artisan training are available within municipal areas.
The learner teacher ratio is very important, because it is closely related to the amount
of money spent per child. It also has an impact on the education outcomes.
Table 7 City of Cape Town Learner enrolment, Learner-teacher ratio and Dropout
rate, 2012 and 2013
Learner
Learner
enrolment Public & Dropout
teacher
Independent Schools rate
ratio
(Gr 1-12 + LSEN)
2012 2013 2012 2013 2012
City of Cape Town 594 313 633 999 36.4 31.7 40.1%
Western Cape 936 515 988 524 31.2 38.9%
Source: Western Cape Department of Education, 2012 and 2013
In 2013, the City of Cape Town accommodates 64.1 per cent of the Western Cape’s
988 524 learners. The City’s learner-teacher ratio dropped significant since the
previous year to 31.7.
In calculating the drop-out rate, the grade 10 enrolment for 2010 is compared with
the grade 12 enrolment; the dropout rate for 2012 was 38.5 per cent. From 2013, the
Education Department no longer calculates dropout rates.
2.1.5 Access to Further Education and Training Facilities and Media Centres/
Libraries
Access to higher and further education and training institutions is essential to equip
individuals to access employment opportunities. A number of universities and further
education and training institutions are located within the City of Cape Town’s
boundaries. Amongst others, these include the University of Cape Town, the University
of the Western Cape, the Cape Peninsula University of Technology, as well as satellite
campuses of the University of South Africa. The University of Stellenbosch is also
situated within commuting distance to the City’s population. In 2012, there were also
27 FET Colleges within the City’s borders.
Table 8 Schools with Libraries/Media Centres in the City of Cape Town, 2012 and
2013
Education facilities
Number of
schools with libraries/
media centres
2012 2013
City of Cape Town 707 725
Western Cape 1 280 1 318
Source: Western Cape Education Department, 2012 and 2013
13Regional Development Profile 2013
School libraries and media centres make a difference to student achievements and it
has a positive impact on students and on learning. We live in the ‘information age’,
and therefore, information literacy has become the universal currency, the single
common denominator required for success at any stage of life. This is especially true
for children who, now more than ever, must be equipped to access, use, and
evaluate information competently in both print and electronic formats.
In 2013, a total of 725 schools within the City of Cape Town have access to libraries or
media centres.
2.1.6 No fee schools
No fee schools make provision for learners who live in low income communities where
the majority of learners are unable to make a financial contribution towards the cost
of education. No fee school status ensures extra state support to schools where
contributions in the form of school fees are not possible.
The three poverty indicators utilised for this purpose are income, unemployment rates
and the level of education of the community, which are weighted to assign a
poverty score for the community and the school.
Table 9 No Fee Schools in the City of Cape Town, 2012 and 2013
Number/proportion of
no fee schools
2012 2013
City of Cape Town 186 182
Western Cape 677 673
Source: Western Cape Education Department, 2012 and 2013
In City of Cape Town in 2012, 186 or 24.9 per cent of the schools were no fee schools.
This was relatively low compared with other local municipalities within the Western
Cape, with the highest being in Langeberg (87.7 per cent), Oudtshoorn (85 per cent)
and Beaufort West, Bitou, Cape Agulhas and Prince Albert (each 80 per cent). In
2013, the number of no fee school within the City decreased from 186 to 182 schools.
2.1.7 Education Outcomes (Matric Pass Rate)
Education remains one of the key avenues through which the state is involved in the
economy. In preparing individuals for future engagement in the labour market, policy
choices and decisions in the sphere of education play a critical role in determining
the extent to which future economic and poverty reduction plans can be realised.
The impact of the education and training system on the lives of the general
population is an important barometer of the contribution to development, and
human resource development in particular, that the South African education and
training system has achieved. The matric results are among the most important
indicators of the performance of the schooling system.
In the 2011 matric examinations, 79.2 per cent of the City’s matriculants passed which
improved marginally, topping the 80 per cent mark in 2012 to 80.6 per cent.
14City of Cape Town
2.2 Healthcare Services
Good health is vital to achieving and maintaining a high quality of life. A diverse
range of factors play a role in ensuring the good health of communities and that
those diseases, especially preventable and contagious/communicable ones, are
kept at bay. Some of the factors include lifestyle features that also depend on the
provision of high quality municipal services, such as clean water and sanitation. It is
the function of healthcare services not only to restore bad health, but also to prevent
communities from contracting preventable diseases.
In September 2000, 191 United Nations member states signed the United Nations
Millennium Declaration that commits world leaders to combat poverty, hunger,
disease, illiteracy, environmental degradation and discrimination against women. The
eight Millennium Development Goals are derived from this declaration, and although
they are all interdependent, three are specifically focused on achieving improved
health outcomes; these are to reduce child mortality, to improve maternal health
and to combat HIV/AIDS, malaria and other diseases.
The Western Cape Provincial Strategic Objective 4: Increasing Wellness has also
identified a number of these factors identified in the MDGs as key indicators of
wellness; these include maternal mortality, child mortality and HIV and TB incidence.
This section on healthcare services focuses on selected health outcomes and speaks
to the ability of the healthcare system to deal with these pertinent issues. Some of the
key health indicators, identified also through the MDGs as well as the Province’s
Strategic Objective 4: Increasing Wellness, will also be discussed below.
Although healthcare is provided by both public and private institutions, information
provided by the Department of Health, as detailed in this section, pertains only to
public sector healthcare institutions. Any privately provided facilities or services are
not reflected in the information below.
2.2.1 Healthcare Facilities
Access to healthcare facilities is directly dependent on the number and spread of
facilities within a geographic space. South Africa’s healthcare system is geared in
such a way that people have to move from primary, with a referral system to
secondary and tertiary levels; the first point of contact is at the primary healthcare
level.
The Western Cape has a range of healthcare facilities (see Table 10) which includes
community health centres (9), community day centres (51) and clinics (213),
including satellite (65), mobile clinics (97), district hospitals (34) and regional
hospitals (8).
15Regional Development Profile 2013
Table 10 Number of Western Cape Healthcare Facilities
T ota l P rima ry
List o f Co mmu nity Commun ity He a lthc a re
S a te lite Mobile Distric t Re g iona l
fa c ilitie s He a lth Da y Clinic s Fa c ilitie s* - F ixe d,
Clinic s Clinic s Hospita ls* Hospita ls*
2 0 13 Ce ntre s Ce ntre s sa te lite a nd mo bile
c linic s, CH Cs, C DCs
2 0 13 2 0 12 2 0 11 2 0 13 2 0 12 2 0 11 2 0 13 2 0 12 2 0 11
City of Cape
9 37 82 17 4 149 149 159 9 9 9 2 5 5
Town
West Coast
0 1 26 20 20 67 67 69 7 7 7 0 0 0
District
Cape Winelands
0 6 42 6 28 82 82 84 4 4 4 2 2 2
District
Overberg
0 1 22 7 14 44 44 47 4 4 4 0 0 0
District
Eden District 0 5 33 12 21 71 71 76 6 6 6 1 1 1
Central Karoo
0 1 8 3 10 22 22 20 4 4 4 0 0 0
District
We ste rn
9 51 2 13 65 97 435 435 455 34 34 34 5 8 8
Ca pe
*Information for 2010 and 2011 from 2010/11 and 2011/12 Annual Performance Plans
Source: Western Cape Department of Health, 2011, 2012 and 2013
Of these facilities, 9 Community Health Centres, 37 Community Day Centres, 82 clinics
with 17 satellite and 4 mobile clinics are situated or operational within the City. In
addition hereto, the City also has 9 district and 2 regional hospitals.
2.2.2 HIV/AIDS Treatment and Care
According to the 2009 National HIV Survey, the estimated HIV prevalence for the
Western Cape was 16.9 per cent (CI: 95 per cent: 13.8 – 20.5 per cent). The weighted
Provincial Survey estimate from the larger sub-district survey was 16.8 per cent
(95 per cent CI: 16 - 17.7 per cent). The highest HIV prevalence estimates remain
amongst the age groups of 25 - 29 and 30 - 34 years (Department of Health, Annual
Performance Plan 2012/13: 29).
The information presented in Table 11 shows how authorities responsible for health
services in the City and health districts in the Western Cape have responded to the
healthcare need with respect to HIV/AIDS treatment and care. Although treatment
and care is essential in managing the disease, in the case of HIV/AIDS the need and
importance of preventative care must be emphasised, especially since to date, there
is still no known cure.
At the end of June 2011, the Province highlighted that anti-retroviral treatment (ART)
was provided to over 100 000 persons. Within a year from this date, the number of
patients on ART has increased by 15 146 additional patients and by an additional
18 679 by the end of March 2013.
The Western Cape prevalence rate of 16.8 per cent (2009) of the 2007 population
(5 278 572) translates into a total number of infected persons of 886 800; given that
the population is almost certainly higher by 2009 and later years, this is likely to
represent an underestimate of the total number HIV/AIDS infected to date. Even if this
crude approximation is used, it still provides an indication of the gap between the
number of infected persons and the number of HIV/AIDS positive persons on anti-
retroviral treatment. It becomes evident that there is still a lot of work to be done in
ensuring that an even greater proportion of the population get tested and receive
treatment.
16City of Cape Town
Table 11 HIV/AIDS Prevalence and Care
Number of Number of Number of
Anti- Anti- Anti-
Retroviral Retroviral Retroviral ART Patient ART Patient ART Patient
Treatment Treatment Treatment Load Load Load
(ART) (ART) (ART) 2011* 2012* 2013*
Sites Sites Sites
2011 2012 2013
City of Cape Tow n 61 64 66 75 652 85 791 99 223
West Coast District 17 28 36 3 205 3547 4 561
Cape Winelands District 23 31 40 9 750 11 830 14 170
Overberg District 6 17 17 3 259 4253 4 907
Eden District 23 34 49 7 847 9 397 10 402
Central Karoo District 3 3 7 674 715 949
Western Cape 133 177 215 100 387 115 533 134 212
*Patient load at June 2011 and 2012 at end June; at end March 2013
Source: Western Cape Department of Health, 2011, 2012 and 2013
Approximately 74 per cent of the Western Cape’s total ART patient load is in the City.
The increase in patient load in the City between June 2012 and March 2013 has been
supported by a further increase in the number of ART sites from 64 to 66.
2.2.3 Child Health
Children, infants and especially new-born babies are particularly vulnerable to
malnutrition and the contraction of infectious diseases, many of which are
preventable or can be treated.
Two other indicators of child health will be discussed here, namely, immunisation and
malnutrition.
Immunisation4
Immunisation protects both adults and children against preventable infectious
diseases; the administration of a vaccine stimulates the body’s own immune system
to protect the person against subsequent infection or disease. Low immunisation rates
speak to the need for parents to understand the critical importance of immunisation,
as well as the need to encourage parents to have their young children immunised.
The National Department of Health has set an immunisation target of 90 per cent
against which the Western Cape results can be benchmarked. The Western Cape
Health Department has set its immunisation target for the 2011/12 as well as the
2012/13 financial years at 95 per cent, higher than that of the national target
(Department of Health APP 2012/13: 129).
4 The immunisation rate is calculated as the number of children immunised as a percentage of the total
number of children less than one year of age. If children who are one year or older are immunised, the
immunisation rate for that year could be greater than 100 per cent because more than 100 per cent of
children aged less than one year would have been immunised in that particular year.
17Regional Development Profile 2013
In the 2011/12 financial year, full immunisation levels for the Western Cape were
87.8 per cent, increasing to 89.0 per cent in 2012/13. At 89.5 per cent, the full
immunisation rate for the City was slightly higher than that of the Province; an
improvement from 87.5 per cent in the previous financial year.
Table 12 Child Health in the Western Cape: Full Immunisation and Malnutrition
Number of severely Number of severely
Population Population underw eight underweight
< 1 year fully < 1 year fully children children
immunised immunised < 5 years per 1 000 < 5 years per 1 000
2011/12 2012/13 population population
2011/12 2012/13
Western Cape Province 87.8% 89.0% 3.0 2.8
Cape Tow n 87.5% 89.5% 3.2 2.8
West Coast DM 97.1% 96.3% 1.8 1.6
Cape Winelands DM 90.0% 91.8% 3.2 2.9
Overberg DM 74.4% 75.8% 2.8 2.5
Eden DM 88.6% 102.8% 2.9 4.2
Central Karoo DM 80.3% 77.0% 2.0 3.7
Source: Western Cape Department of Health, 2012 and 2013
When looking at the breakdown of immunisation across the City (refer to Table 13), it
is apparent that certain areas, particularly Khayelitsha (67.3 per cent) and the
Southern (78.1 per cent) sub-districts, were significantly below the City’s average
while, at 122.5 and 97.3 per cent the Western and Klipfontein sub-districts respectively
were significantly above the City’s average.
Table 13 Child Health in the City of Cape Town: Full Immunisation and Malnutrition
Number of severely Number of
Population underw eight severely
Population
underweight
< 1 year fully < 1 year fully children
children
immunised immunised < 5 years per 1 000
< 5 years per 1 000
2011/12 2012/13 population
population
2011/12 2012/13
Cape Tow n 87.5% 89.5% 3.2 2.8
CT Eastern SD 82.8% 89.5% 1.8 1.2
CT Khayelitsha SD 70.4% 67.3% 2.4 8.7
CT Klipfontein SD 101.9% 97.3% 2.0 1.7
CT Mitchell's Plain SD 82.8% 83.9% 2.5 2.0
CT Northern SD 88.1% 91.6% 7.6 5.0
CT Southern SD 78.9% 78.1% 3.6 1.1
CT Tygerberg SD 82.8% 89.1% 1.8 0.9
CT Western SD 124.2% 122.5% 3.2 2.6
Source: Western Cape Department of Health, 2012 and 2013
18City of Cape Town
Malnutrition
Malnutrition (either under- or over nutrition) refers to the condition whereby an
individual does not receive adequate amounts or receives excessive amounts of
nutrients. The indicator is measured by the number of severely underweight children
less than 5 years per 1 000 of the population.
The number of malnourished children under five years (see Tables 12 and 13 above)
in the Western Cape in 2012/13 was 2.8 per thousand population. The City recorded a
slightly higher number of malnourished children with the Khayelitsha and Northern
Sub-districts standing out with a total of 8.7 and 5.0 malnourished children per
thousand population in 2012/13 respectively.
2.2.4 Maternal Health
Maternal health refers to the health of women during pregnancy, childbirth and the
postpartum period. Even though it may not strictly fit the definition, information on
births to teenage mothers and termination of pregnancies is also included here.
Maternal deaths
In 2012/13 there was a significant increase in maternal mortality for the Western Cape
Province especially in the City itself, increasing from 26 to 64 and from 19 to 49 in the
Province and City respectively.
Table 14 Maternal Health in the Western Cape: Maternal Mortality
Ma te rn a l Ma te rn a l Ma te rn a l
Total Total
Total Mo rta lity Total Mo rta lity Total Total number Mo rta lity
number of number of
number of pe r number of pe r number of of maternal pe r
maternal maternal
Maternal mortality live births in 10 0 0 0 0 live births in 10 0 0 0 0 live births in deaths in 10 0 0 0 0
deaths in deaths in
fac ilities live facilities live fac ilities fac ilities live
facilities fac ilities
2010/11 b irth s 2011/12 b irth s 2012/13 2012/13 b irth s
2010/11 2011/12
2 0 10 / 11 2 0 11/ 12 2 0 12 / 13
Western Cape Provinc e 92 462 40 43.3 89 394 26 28.7 93 321 64 68.6
Cape Town 59 786 33 55.2 61 898 19 30.7 6 2 14 3 49 78.9
West Coast DM 5 124 0 0.0 4 854 0 0.0 4 972 6 12 0 . 7
Cape Winelands DM 13 856 4 28.9 10 500 2 17 . 0 12 6 8 3 5 39.4
Overberg DM 3 150 0 0.0 2 838 0 0.0 3 051 0 0.0
Eden DM 9 507 2 2 1. 0 8 220 5 60.8 9 405 4 42.5
Central Karoo DM 1 039 1 96.2 1 084 0 0.0 1 067 0 0.0
Source: Western Cape Department of Health, 2011, 2012 and 2013
Table 15 Maternal Health in the City of Cape Town: Maternal Mortality
Total M a te rn a l Total Ma te rn a l Total Ma t e rn a l
Total Total Total
number of M o rta lity number of Mo rta lity number of Mo rta lity
number of number of number of
maternal pe r maternal pe r maternal pe r
Maternal mortality live births in live births in live births in
deaths in 10 0 0 0 0 deaths in 10 0 0 0 0 deaths in 10 0 0 0 0
fac ilities fac ilities fac ilities
fac ilities live b irth s fac ilities live b irth s fac ilities live b irth s
2010/11 2011/12 2012/13
2010/11 2 0 10 / 11 2011/12 2 0 11/ 12 2012/13 2 0 12 / 13
Cape Town 59 786 33 55.2 61 898 19 30 .7 6 2 14 3 49 7 8.9
CT Eastern SD 5 189 0 0.0 4 733 0 0 .0 5 241 4 7 6.3
CT Khayelitsha SD 5 094 2 39.3 5 150 0 0 .0 6 700 3 4 4.8
CT Klipfontein SD 4 384 1 22.8 3 801 1 26 .3 3 617 1 2 7.6
CT Mitc hell's Plain SD 3 471 0 0.0 3 243 0 0 .0 2 687 0 0.0
CT Northern SD 1 788 0 0.0 1 757 0 0 .0 1 480 0 0.0
CT Southern SD 10 712 1 9.3 13 197 1 7 .6 13 015 1 7.7
CT Tygerberg SD 14 854 18 12 1. 2 15 211 10 65 .7 16 878 15 8 8.9
CT Western SD 14 294 11 77.0 14 806 7 47 .3 12 525 25 19 9 . 6
Source: Western Cape Department of Health, 2011, 2012 and 2013
19Regional Development Profile 2013
For the City this translates into a total number of 78.9 deaths per 100 000 live births
compared to the previous years’ 30.7 in public healthcare facilities.
Births to teenage mothers
Teenage pregnancy is almost always unplanned; as a result when young parents are
placed in a position to care for their children, they often have to postpone or
sacrifice their own lives’ dreams. For these young people life can become particularly
tough, especially if they do not have family or social support. Women with unplanned
pregnancies, whether teenage or other, may also opt to terminate their pregnancy.
Table 16 Maternal Health in the Western Cape: Births to Women under 18 years
De live ry De live ry De live ry
Delivery to to wome n De live ry to wome n De live ry Tota l to wome n
women Total un de r to wome n Tota l unde r to wome n de live rie s unde r
Delivery to women
under deliveries 18 ye a rs und e r de live rie s 18 ye a rs unde r in 18 ye a rs
under 18 years
18 years 2010/11 pe r 1 0 0 0 18 ye a rs 2 0 11/ 12 pe r 1 0 0 0 18 ye a rs fa c ilitie s pe r 1 0 0 0
2010/11 de live rie s 2 0 11/ 12 de live rie 2 0 12 / 13 2 0 12 / 13 d e live rie s
2 0 10 / 11 s 2 0 11/ 12 2 0 12 / 13
Western Cape Provinc e 6484 93 192 69.6 6 320 9 3 19 9 40.2 5 906 9 2 12 5 64.1
Cape Town 3911 63 082 62.0 3 756 64 116 58.6 3 448 6 3 17 8 54.6
West Coast DM 416 4 921 84.5 472 4 926 95.8 451 4 932 9 1. 4
Cape Winelands DM 1136 12 156 93.5 1 085 11 905 9 1. 1 993 11 146 89.1
Overberg DM 279 2 948 94.6 241 2 906 82.9 231 2 879 80.2
Eden DM 650 9 042 7 1. 9 657 8 244 79.7 683 8 883 76.9
Central Karoo DM 92 1 043 88.2 109 1 102 98.9 100 1 107 90.3
Source: Western Cape Department of Health, 2011, 2012 and 2013
Of the total 92 125 deliveries in the Province (see Table 16 above) in the 2012/13
financial year, 5 906 were born to mothers under 18 years; which translates into a
teenage delivery rate of 64.1 per 1 000 deliveries. With a teenage delivery rate of
54.6 per 1 000 deliveries, the City’s teenage delivery rate was lower than that of the
Province; all other districts topped that of the Province, with West Coast, Central
Karoo and Cape Winelands districts with the highest rates in the Province of 91.4 and
90.3 and 89.1 per 1 000 deliveries for the 2012/13 financial year respectively.
Table 17 Maternal Health in the City of Cape Town: Births to Women under 18 years
Deli very Deli very Deli very
to women De livery to women Delivery to women
Delivery to
under to under to Total under
w omen Total Total
Delivery to women 18 years w om e n 18 years w om e n de liverie s 18 years
under deliveries de liverie s
under 18 years per under per under in facilities per
18 years 2010/11 2011/12
1 000 18 years 1 000 18 years 2012/13 1 000
2010/11 del iveri es deli veri es deli veri es
2011/12 2012/13
2010/11 2011/12 2012/13
Cape Tow n 3 911 63 082 62.0 3 756 64 116 58.6 3 448 63 178 54.6
CT Eastern SD 426 5 383 79.1 441 5 533 79.7 342 5 034 67.9
CT Khayelitsha SD 353 3 960 89.1 108 5 339 20.2 401 6 942 57.8
CT Klipf ontein SD 342 3 833 89.2 689 3 966 173.7 231 3 639 63.5
CT Mitchell's Plain SD 230 3 616 63.6 727 3 568 203.8 177 3 161 56.0
CT Northern SD 121 1 811 66.8 303 1 785 169.7 63 1 476 42.7
CT Southern SD 574 12 807 44.8 302 13 162 22.9 680 13 160 51.7
CT Tygerberg SD 1 105 15 094 73.2 203 14 974 13.6 998 16 971 58.8
CT Western SD 760 16 578 45.8 983 15 789 62.3 556 12 795 43.5
Source: Western Cape Department of Health, 2011, 2012 and 2013
20City of Cape Town
Within the City (see Table 17 above), the teenage delivery rate for 2012/13 was higher
in certain areas, notably in the Eastern and Klipfontein sub-districts, with rates of 67.9
and 63.5 per 1 000 deliveries respectively. The 2012/13 figures represent sharp
decreases from 2011/12, particularly for the Mitchell’s Plain, Klipfontein and Northern
sub-districts.
Termination of pregnancy
These teenage delivery rates can also be seen in conjunction with the termination of
pregnancy rates as unplanned or unwanted pregnancies may result in terminations.
Table 18 Maternal Health in the Western Cape: Termination of Pregnancy
TO P pe r TO P pe r TO P pe r
1 000 1 000 1 000
Female Female Female
Total TOPs fe ma le Total TOPs fe ma le Total TOPs fe ma le
Termination of population population population
performed popula tion performed popula tion performed popula tion
pregnancy (TOP) 15 - 44 years 15 - 44 years 15 - 44 years
2010/11 15 - 4 4 2011/12 15 - 4 4 2012/13 15 - 4 4
2010/11 2011/12 2012/13
ye a rs ye a rs ye a rs
2 0 10 / 11 2 0 11/ 12 2 0 12 / 13
Western Cape Province 14 359 1 380 716 10 . 4 14 474 1 405 654 10 . 3
15 2 4 8 1 4 7 0 17 6 10 . 4
Cape Town 10 233 923 847 11. 1 10 753 945 028 11. 4 119 3 0 987 390 12 . 1
West Coast DM 847 74 942 11. 3 675 74 262 9.1 341 7 8 6 13 4.3
Cape Winelands DM 1 378 186 405 7.4 1 533 189 863 10 . 5 1 490 19 6 7 8 0 7.6
Overberg DM 282 53 927 5.2 288 55 017 5.2 330 5 7 19 9 5.8
Eden DM 1 262 128 498 9.8 1 225 128 259 9.6 1 15 6 13 6 7 11 8.5
Central Karoo DM 357 13 096 27.3 0 13 225 0.0 1 13 4 8 4 0.1
Source: Western Cape Department of Health, 2011, 2012 and 2013
Compared to Western Cape districts, the City recorded the highest rate of
12.1 terminations per 1 000 female population in 2012/13. The overall Western Cape
rate in 2012/13 was 10.4 per 1 000 population.
Within the Province, the Central Karoo district only recorded only one termination of
pregnancy for the 2012/13 financial year. Other districts which recorded relatively low
termination of pregnancy rates5 for the 2012/13 financial year were the West Coast
and Overberg districts with rates of 4.3 and 5.8 terminations respectively per 1 000
(female population aged 15 to 44 years).
Table 19 Maternal Health in the City of Cape Town: Termination of Pregnancy
TO P pe r TO P pe r TO P pe r
1 000 1 000 1 000
Total Female Total Female Total Female
fe ma le fe ma le fe ma le
Termination of TOPs population TOPs population TOPs population
popula tion popula tion popula tion
pregnanc y (TOP) performed 15 - 44 years performed 15 - 44 years performed 15 - 44 years
15 - 4 4 15 - 4 4 15 - 4 4
2010/11 2010/11 2011/12 2011/12 2012/13 2012/13
ye a rs ye a rs ye a rs
2 0 10 / 11 2 0 11/ 12 2 0 12 / 13
Cape Town 10 233 923 847 11. 1 10 753 945 028 11. 4 11 9 3 0 987 390 12 . 1
CT Eastern SD 312 105 305 3 .0 590 107 719 5.5 498 112 548 4.4
CT Khayelitsha SD 477 120 754 4 .0 833 123 523 6.7 1 681 129 060 13 . 0
CT Klipfontein SD 4 349 108 974 3 9 .9 3 990 111 472 30.8 3 446 116 469 29.6
CT Mitc hell's Plain SD 837 131 556 6 .4 911 134 572 8.6 955 140 604 6.8
CT Northern SD 2 83 780 0 .0 51 85 700 0.6 126 89 542 1. 4
CT Southern SD 775 126 524 6 .1 629 129 425 4.7 698 135 227 5.2
CT Tygerberg SD 2 324 143 776 16 . 2 2 710 147 073 18 . 4 3 294 153 666 2 1. 4
CT Western SD 1 157 103 178 11. 2 1 039 105 544 9.3 1 232 110 275 11. 2
Source: Western Cape Department of Health, 2011, 2012 and 2013
5 Termination of pregnancy rate is calculated as the percentage of terminations as a proportion of the
female population aged 15 to 44 years.
21Regional Development Profile 2013
In 2012/13 within the City, the Klipfontein and Tygerberg sub-districts stand out as the
areas with the highest termination of pregnancy rates of 29.6 and 21.4 respectively,
per 1 000 female population. Most sub-districts within the City showed slight increases
from the previous year.
The teenage delivery and termination of pregnancy rates together suggests that the
City may have particular challenges in respect of unplanned and unwanted
pregnancies.
2.2.5 Community Based Services
Community Based Services (CBS) in the Western Cape are provided by Non-profit
Organisations (NPOs), subsidised by the Provincial Government. Patients who require
on-going care upon discharge from hospital are referred to a primary healthcare
facility in the area in which they live. The Home Community Based Services (HCBS)
Coordinator at the primary healthcare facility refers the patient to the NPO partner
responsible for HCBS services in the area. The caregiver will render the service
according to the instruction on the care plan and the sister will visit the individual to
make sure the plan is being carried through.
HCBS does not replace the family as the primary caregiver; it is meant to be a
complementary and supportive service to the family to prevent ‘burn-out’ for family
caregivers who care for sick relatives.
Table 20 Community Based Services by Non-profit Organisations: Western Cape
Monthly average number of
Non-profit Organisation appointed
Community Based Services
home carers
2012/13
Western Cape Province 3 064
Cape Town 1 856
West Coast DM 278
Cape Winelands DM 303
Overberg DM 240
Eden DM 312
Central Karoo DM 74
Source: Western Cape Department of Health, 2013
The total number of NPOs appointed carers in the Western Cape during 2012/13 was
3 064 with about 60 per cent of these, 1 856, being split between the City regions, with
highest number of carers in Khayelitsha (326) and Tygerberg (295).
22City of Cape Town
Table 21 Community Based Services by Non-profit Organisations: City of Cape Town
Monthly average number of
Non-profit Organisation appointed
Community Based Services
home carers
2012/13
Cape Town 1 856
CT Eastern SD 254
CT Khayelitsha SD 326
CT Klipfontein SD 260
CT Mitchell's Plain SD 292
CT Northern SD 133
CT Southern SD 158
CT Tygerberg SD 295
CT Western SD 138
Source: Western Cape Department of Health, 2013
2.3 Safety and Security
The safety of persons and property is vitally important to the physical and emotional
well-being of people and business. Without the respect of person and property, it is
impossible for people to live peacefully, without fear of attack. Peoples’ general
impressions, as well as official statistics on safety and crime issues mould perceptions
of areas as living spaces as well as places in which to establish businesses.
In this way, crime can also have a significant impact on the economy. It can hamper
growth and discourage investment and capital accumulation. If it is not tackled with
seriousness, it has the potential to derail both social and economic prosperity.
The discussion on recorded crimes in this section is limited to contact and property
related crime such as murder and sexual crimes, as well as crime heavily dependent
on police action for detection such as drug related crimes and driving under the
influence of alcohol/drugs; these are detailed in Table 22 below.
Although it was positive to note a decline in the total number of murders and
burglaries at residential premises for the latest years up to 2011/12, the number of
these crimes increased again to 1 860 murders and 29 310 residential burglaries in
2012/13. The total number of sexual crimes remained on a downward trend since
2009/10.
23You can also read