University City 2018 THE STATE OF - University City District
←
→
Page content transcription
If your browser does not render page correctly, please read the page content below
T H E S TAT E O F
University City 2018
PENNSYLVANIA
            Montgomery      Bucks

  University                           NEW
     City Philadelphia                JERSEY
  Chester
               Delaware                Burlington

       New                        Camden
                     Gloucester
      Castle

                 Salem
DELAWARE

                           PHILADELPHIA

                          University
                             City
                            Center City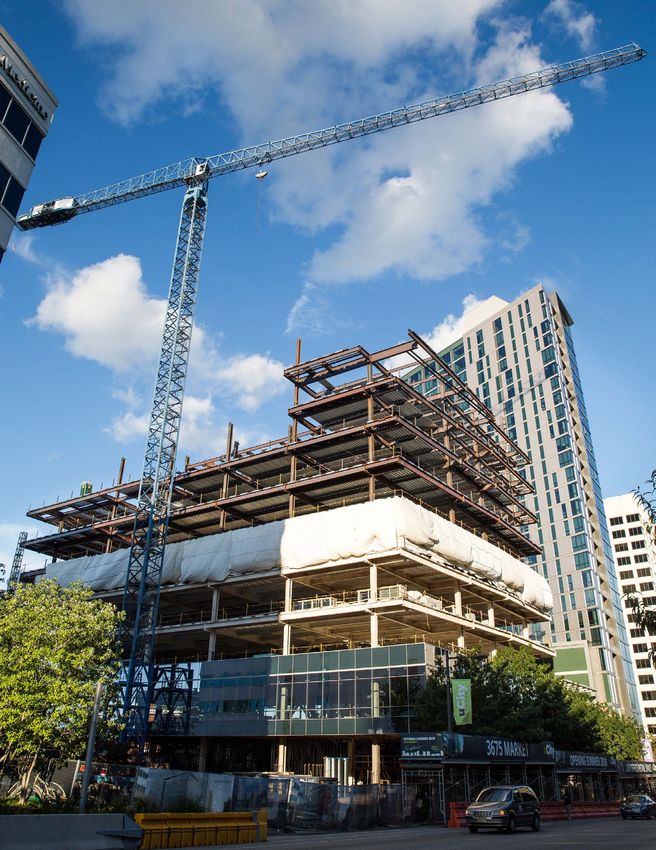
A Letter from UCD’s President    4

  Spotlight on University City   6

    Real Estate Development      10

                Employment       26

                       Office    32

        Retail and Hospitality   36

    Colleges and Universities    42

                  Healthcare     46

              Transportation     48

                      People     56

     Life in the Neighborhood    60

                   Innovation    66

About University City District   74

        Membership Program       82

         Acknowledgements        84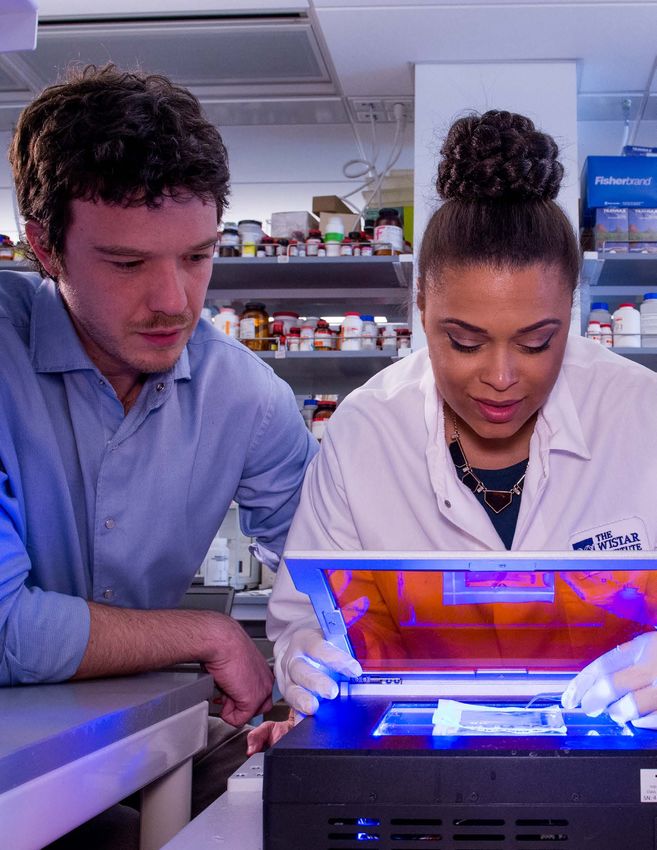
THE STATE OF UNIVERSITY CITY 2018

                                     A Letter from UCD’s President

                                     It’s a special time for University City District as we celebrate our 20th anniversary
                                     and reflect on two decades of partnership with world class institutions, business
                                     leaders and community members to shape one of the country’s leading innovation
                                     neighborhoods. This collaboration has transformed our district through pioneering
                                     efforts to reclaim public space and re-imagine transit infrastructure, activation
                                     of dormant commercial corridors, a nationally-acclaimed initiative to connect
                                     local residents to career-changing jobs, and, always at our core, attention to
                                     the foundational community services that comprise our role as stewards of a
                                     wonderful place.

                                     UCD’s founders came to this work with a bold vision for this neighborhood, but the
                                     trajectory of University City has surpassed even the biggest of aspirations. New
                                     discoveries over the past year by University City researchers and practitioners in
A Letter from UCD’s President

                                     the fields of immunotherapy, precision medicine and vaccine development promise
                                     to change the course of disease treatment and prevention for millions around the
                                     world. New accelerators and incubators are poised to help translate the discoveries
                                     emanating from our universities and health systems into job-generating commercial
                                     ventures. With nearly 80,000 jobs and $1 billion in aggregate annual R&D expenditures,
                                     University City’s real estate boom continues unabated, as it keeps pace with
                                     economic growth. Nearly 1.5 million square feet of development projects were
                                     completed in the last year, and construction activity shows no signs of slowing. The
                                     neighborhood has become a magnet for millennials, and an ongoing surge in multi-
                                     family housing has spurred an 11% increase in University City’s residential population

 4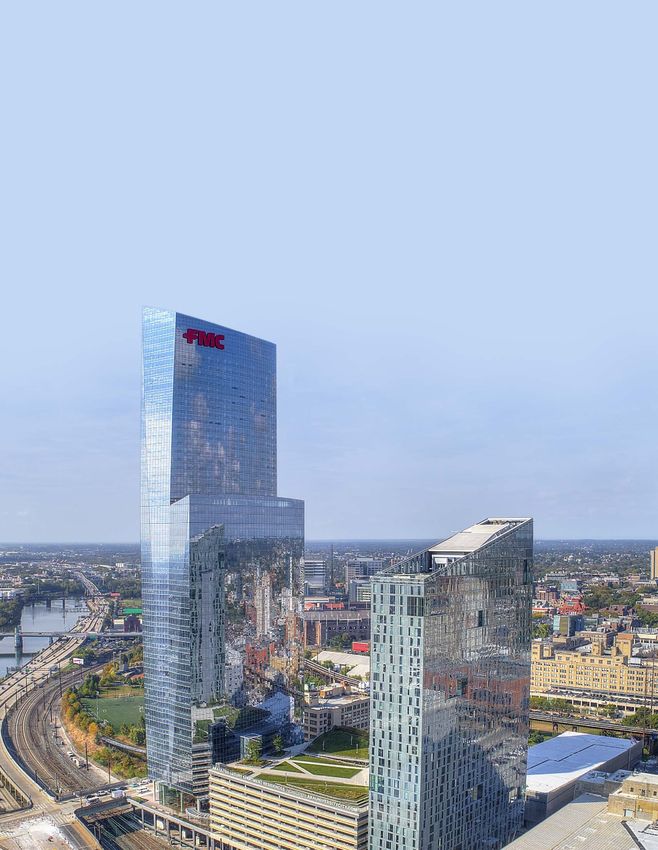
THE STATE OF UNIVERSITY CITY 2018
since 2010. Similarly, retail and hotel development push forward, drawn by University
City’s growing workforce, student population and status as the regional hub for the
knowledge economy.

While the neighborhood has transformed over the past twenty years, the next twenty
years will witness a University City that reshapes Greater Philadelphia’s economic
foundation. Schuylkill Yards, Pennovation and uCity Square are three focal points
of commercialization and discovery, all tightly bound within a walkable, bikeable,
transit-oriented neighborhood of eclectic food options, gorgeous Victorian homes
and gathering spaces that spur the kinds of serendipitous collisions among creators
and dreamers that are necessary for breakthrough innovation.

As talented workers and visionary entrepreneurs make informed choices about                 A Letter from UCD’s President
where to live, work, play and grow, increasingly they are choosing University City. Here,
the confluence of proximity, knowledge, diversity and rich amenities is reshaping
the very notion of a great urban place. If past is prologue, there’ll be no better place
to invent the future over the next twenty years than right here in University City.

Sincerely,

Matt Bergheiser
President, University City District
                                                                                                 5
Spotlight on University City

                               University City is the region’s leader in education, science and innovation.
                               The 2.4 square mile neighborhood boasts world-class institutions that
                               have catalyzed nearly 80,000 jobs in fields including medicine, higher
                               education, technology, professional services and hospitality. University
                               City is a destination for culture seekers and food lovers, a transportation
                               hub with some of the most bicycle- and pedestrian-friendly streets in the
                               city, and is home to some of the most significant development projects
                               in the region. With a diverse population, a blend of housing options,
                               top notch schools and hospitals, and amenities galore, University City
                               is a neighborhood where quality of life and quality of place spur growth
                               and opportunity.
Spotlight on University City

 6
THE STATE OF UNIVERSITY CITY 2018
University City By The Numbers

                                     69%
79,692 53,884
     Jobs           Residents
                                     Residents Who
                                     Walk, Bicycle or
                                       Ride Public
                                     Transit to Work
                                                        148
                                                         Home Sales

93%                     20-24
                  22-24 minutes                         $393,100
    Office           Median                             Median Home
                                     Median Resident     Sale Price
  Occupancy           Age            Commute Time

                 57%                                    $1,500
 147
   Retailers
                    Residents
                 Aged 25 or Older
                 with a Bachelor’s
                 Degree or Higher
                                     4,328,718
                                     Annual Amtrak
                                     Passengers at
                                     30th St. Station
                                                          Median
                                                         Apartment
                                                           Rent

266 5
 Restaurants
  and Bars
                   Colleges and
                   Universities
                                      1,058
                                          Hotel
                                         Rooms
                                                          4
                                                         Hospitals
                                                                      Spotlight on University City

87% 43,267 79% 85,048
 Ground Floor      College and         Hotel Room          Hospital
 Commercial         University         Occupancy          Inpatient
Occupancy Rate      Students                             Admissions

                                                                            7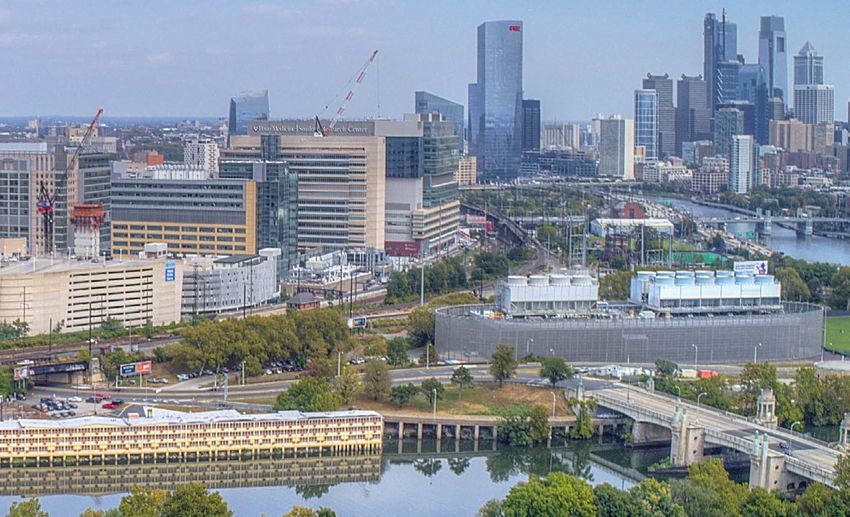
University City
    is a leader in…
    • Job Growth
    University City remains one of the top employment hubs
    in the region, with more than 33,000 jobs per square mile.
    The number of jobs rose substantially in 2017 and is on
    pace to reach 80,000 for the first time.

    • Development
    With nearly 1.5 million square feet of real estate projects
    completed in the last year and continued growth in the
    number of construction permits - rising more than 500%
    from pre-recession levels - the development boom in
    University City shows no signs of slowing.

    • Attracting Millennials
    An ongoing boom in multi-family housing has contributed
    to an estimated 5,300 new residents since 2010 (up 11%).
    The people choosing to live here are getting younger,
    with the number of millennials (aged 20-34) up by 13%
    since 2000.

    • Transportation
    How does living in paradise sound? University City earned
    three “paradise” distinctions from Walkscore.com,
    notching top marks for getting around on bicycle, public
    transportation or foot.

    • Healthcare
    The neighborhood’s medical institutions are on track
    to admit over 85,000 patients in 2017 and are leading
    the way in new treatments, procedures and medical
    technologies. Two of University City’s hospitals - Hospital
    of the University of Pennsylvania-Penn Presbyterian and
    Children’s Hospital of Philadelphia - were ranked top ten in
    the nation, according to U.S. News and World Report.
8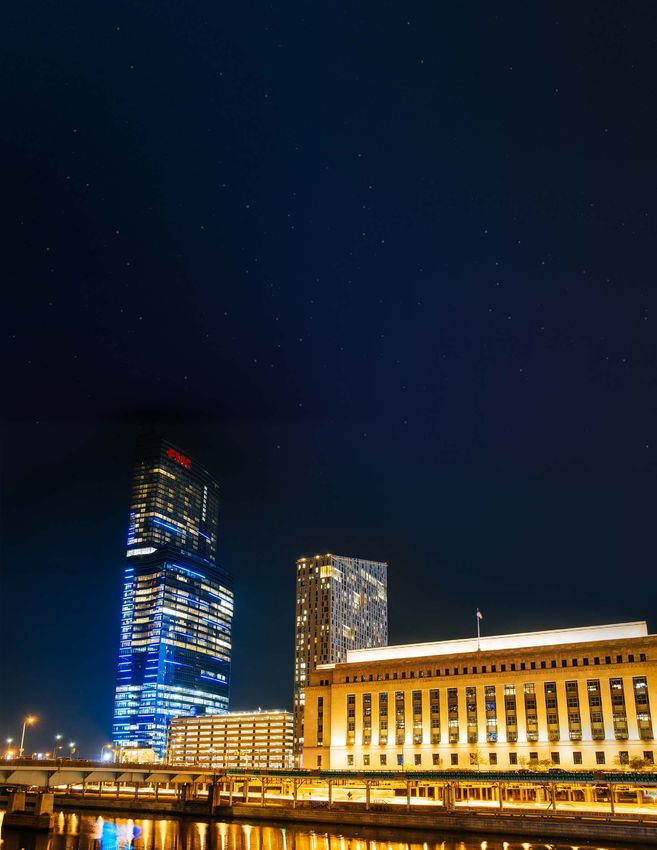
• Dining Options
University City is home to a whopping 266 places
to eat and drink, and more are on the way. In 2017
the neighborhood welcomed new fine dining
establishments Dim Sum House, CO-OP, and
the Walnut Street Café to the roster of excellent
options from around the globe.

• Innovation
In 2016, R&D investment at University City's
universities rose by $34 million, and 175 patents
were issued to local businesses and institutions.
The next wave of coworking spaces, laboratories
and incubators - anchored by the arrival of Boston’s
Cambridge Innovation Center to 3675 Market
Street - will help further University City’s status as
the region’s pacesetter for innovation.

• Retail Attractions
Retailers love University City’s mix of college
students, employees and residents, and shoppers
love the 147 local retailers back, leading to 87%
occupancy of ground floor commercial storefronts.

• Hotel Offerings
Neighborhood hotel inventory exploded in 2016 with
a 48% increase in rooms, split between the new
AKA University City and The Study at University
City. Existing inventory saw improvements, too, as
the Sheraton University City completed a 20,500
square foot renovation.

• Housing
The number of home sales increased 6% over
last year - up to the highest level since the
recession - and the median home price grew by
an extraordinary 18%. At the same time, home
and rental prices remain remarkably affordable
compared to peer innovation hubs such as
Cambridge and San Francisco.
                                                         9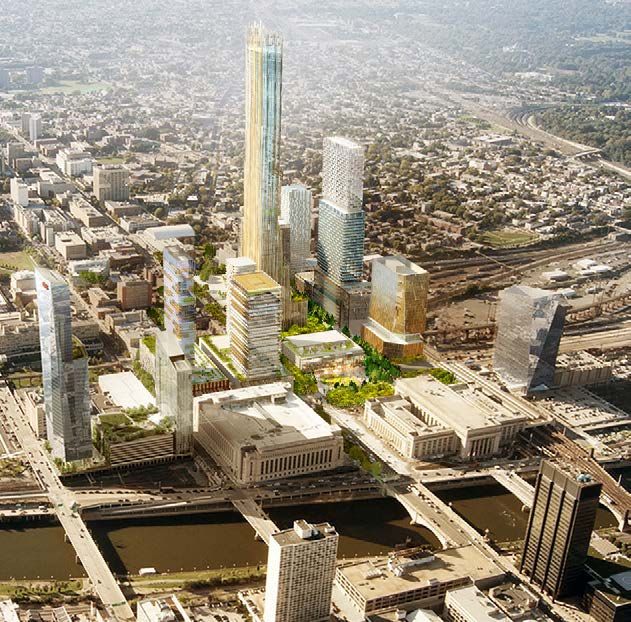
THE STATE OF UNIVERSITY CITY 2018

                                     Real Estate Development

                                     Rapid transformation and accelerated growth continue to define
                                     University City’s real estate sector, where progress moves at a breakneck
                                     pace. Highlights from the past year include the completion of the FMC
                                     Tower, University City’s tallest building; the opening of CHOP’s Roberts
                                     Center for Pediatric Research; the debut of Vue32, a 16-story mixed-use
                                     tower adjacent to Drexel; and the addition of The Study at University City,
                                     a combined hotel, restaurant, and banquet space. Three major projects
                                     - uCity Square, Schuylkill Yards, and the 30th Street Station District Plan -
                                     make up a long-term vision that will further cement University City’s status
                                     as the region’s economic and technological powerhouse.

                                     New Construction or Major Renovations (Square Feet)

                                     3,000,000

                                     2,500,000

                                     2,000,000

                                     1,500,000
Real Estate Development

                                     1,000,000

                                       500,000

                                               0
                                                    2002      2003      2004      2005   2006   2007   2008   2009   2010   2011   2012   2013   2014   2015   2016

                                     Note: excluding parking sructures • Source: UCD

10
THE STATE OF UNIVERSITY CITY 2018 Real Estate Development
11
UCity Square's 3675 MarketTHE STATE OF UNIVERSITY CITY 2018
New Construction New Construction Permits
or Major Renovations
50 1,500
Square Footage by Primary Use (2002 - 2016)
40 1,200
Hotel:
268,260
University City
30 900
Philadelphia
Academic:
2,660,110 Cultural:
Medical & 46,500
Medical Research: 20 600
3,043,700
Office:
3,308,250 10 300
Residential:
4,387,675
0 0
2007 2008 2009 2010 2011 2012 2013 2014 2015 2016
Education*:
Retail: 253,000
352,513
University City Philadelphia
* Primary / Secondary Source: UCD Source: City of Philadelphia Department of Licenses & Inspections
Cumulative Units of New Multi-family
Housing in University City
4,000
3,500
3,000
2,500
2,000
Real Estate Development
1,500
1,000
500
0
2002 2003 2004 2005 2006 2007 2008 2009 2010 2011 2012 2013 2014 2015 2016
Source: UCD
12THE STATE OF UNIVERSITY CITY 2018
Approximate Value of New
Real Estate Development Projects
$1,400
$1,200
$1,000
Dollars (Millions)
$800
$600
$400
$200
$0
2009 2010 2011 2012 2013 2014 2015 2016
Source: UCD
Real Estate Development
13THE STATE OF UNIVERSITY CITY 2018
CURRENT DEVELOPMENT
In the past year, 28 new development projects in University City opened their doors or made significant
progress towards completion. Together, this represents approximately 4.5 million square feet of office,
residential, academic, research, restaurant and medical space that will enhance the neighborhood’s
already robust inventory. What follows is a summary of the current projects continuing to transform
University City’s blocks and skyline.
Academic Commercial
1. Evans Building Main Dental Clinic 5. 3.0 University Place
2. Korman Center Improvements 6. 3675 Market
3. The Perelman Center for Policial Science and Economics 7. 4614-18 Woodland Avenue
4. Richards Medical Research Laboratories 8. Campus Commerce Center
5
ST.
MARKET
ST. POW ELTO N AV E.
50 TH
19
C H E ST N U
T ST. 17 12
28
21
WA L N U T
ST. 20
24
8
ST.
T.
4 0 TH S
.
4 2 ND ST
4 5 TH
S P RU C E 1
ST.
18 16
LARCHW 14
O O D AV E
.
E AVE.
BALTIMOR .
E
AV 45
D TH
IEL ST
GF .
Real Estate Development
N
RI .
SP E
50 AV 26
G
TH
IN
ST
E SS 7
.
N GS
49 KI
E.
AV
TH
ST
D
.
N
LA
D
O
O
W
14THE STATE OF UNIVERSITY CITY 2018
Medical Public Space
9. Center for Healthcare Technology 13. Korman Quadrangle
10. The Pavilion at Penn Medicine 14. 40th Street Trolley Portal Gardens
11. Roberts Center for Pediatric Research
12. Philadelphia Ronald McDonald House Expansion
Residential / Mixed Use
15. 3700 Lancaster 22. Hamilton Court
16. 400 South 40th Street 23. Hill College House
17. 4001-4003 Chestnut Street 24. The Simon
18. 4045 Baltimore Avenue 25. Summer Twelve
19. 4215 Chestnut Street 26. USciences Residence Hall
20. 43rd & Sansom 27. Vue32
21. Chestnut Street Apartments 28. West Lofts
SC
ARDEN ST.
H
S P R IN G G
U
YL
KI
LL
RI
VE
15 Philadelphia
R
30th Street
25 District
. 27 Site
uCity
Square
Expansion
Site
12 6 Schuylkill
22 Yards
.
2
3 8 TH ST
13 Site
3 MARKET
ST.
23
C H E ST N U
T ST.
WA L N U T
ST.
.
3 4 TH ST
4 S P RU C E
ST.
10 R
IVE
L LR
KI
UYL
9 11 H
SC Real Estate Development
Pennovation
Works
15THE STATE OF UNIVERSITY CITY 2018
ACADEMIC
EVANS BUILDING MAIN DENTAL CLINIC
1 Penn’s School of Dental Medicine is undertaking a renovation of its flagship
main clinic, featuring new energy-efficient windows and a new roof. Along with
the construction of a two-story addition to the west of the Schattner Building
entrance hall, this renovation will result in a new 2nd floor patient waiting room.
Developer: University of Pennsylvania
Location: 40th & Spruce Streets
Size: 16,500 square feet
Completion Date: Summer 2018
KORMAN CENTER IMPROVEMENTS
2 The project will give the 1958 Korman Center a new look and comfortable
lounges that enhance the link between learning and high-tech connectivity. A
cantilevered terra cotta screen will give the building a new, modern identity,
creating a “front porch” that will act as an outdoor living room for students.
Behind the screen, a new two-story glazed wall will brighten the façade.
Developer: Drexel University
Location: Between Market & Chestnut and
between 32nd & 33rd Streets
Size: 9,000 square feet
Completion Date: Fall 2017
THE PERELMAN CENTER FOR POLITICAL
3 SCIENCE AND ECONOMICS
The Perelman Center will merge Penn’s academic departments of Political
Science and Economics in one new facility. The project combines a
rehabilitation of the Philadelphia Trust building with a significant new
addition to the north.
Developer: University of Pennsylvania
Location: 36th & Walnut Streets
Size: 111,140 square feet (54,440 existing, 56,700 new)
Completion Date: Spring 2018
RICHARDS MEDICAL
4 RESEARCH LABORATORIES
Real Estate Development
The Richards Medical Research Laboratory, along with the adjacent David
Goddard Laboratories, was designated a National Historic Landmark in
2009. This project will repurpose obsolete wet labs for use by the Center
for Cognitive Neuroscience for “dry” research, office and conference
room space.
Developer: University of Pennsylvania
Location: 3700 Hamilton Walk
Size: Towers C & D: 29,600 square feet
Towers A & B: 30,300 square feet
Completion Date: Towers C & D: Fall 2015; A & B: Spring 2019
16THE STATE OF UNIVERSITY CITY 2018
COMMERCIAL
3.0 UNIVERSITY PLACE
A new five-story office building, 3.0 University Place is the world’s first
5
commercial office building pre-certified LEED Platinum® V4 BD+C Core
and Shell. Among other sustainable features, 3.0 University Place will
capture and treat 95% of the rainwater that falls on the site and reuse
the water for irrigation of the vegetated roof and in the cooling tower.
Developer: University Place Associates, LLC
Location: 41st and Market Streets
Size: 170,000+ square feet
Completion Date: Fall 2019
3675 MARKET
A 14-story office and laboratory building broke ground in Q4 2016. The 6
building, which is designed by ZGF Architects to be LEED Silver or Gold, will
feature 25,000 square foot floor plates and 12,000 square feet of retail. It
will be the new home of the Science Center’s corporate offices and Quorum,
its clubhouse for entrepreneurs, which will triple in size to 15,000 square
feet. The anchor is Cambridge Innovation Center, which houses start-ups.
Developer: A joint venture between the University City Science
Center, Ventas and Wexford Science + Technology
Location: 3675 Market Street
Size: 345,000 square feet
Completion Date: Summer 2018
4614-18 WOODLAND AVENUE
This new three-story commercial building will feature both intensive and 7
extensive green roofs where rainwater will be collected and stored as
greywater to be reused in toilets to reduce water consumption.
Developer: 4614 Woodland Partners LP
Location: 4614-18 Woodland Avenue
Size: 15,000 square feet
Completion Date: 2018
CAMPUS COMMERCE CENTER
8
Real Estate Development
Following the 2012 completion of the first phase of the Campus Commerce
Center, a 136 room extended-stay hotel, phase two will be a Class-A office
building partially occupied by the developer, Campus Apartments.
Developer: Campus Apartments
Location: 41st & Walnut Streets
Size: 130,000 square feet
Completion Date: Phase 1: 2012, Phase 2: 2020
17THE STATE OF UNIVERSITY CITY 2018
MEDICAL
CENTER FOR HEALTHCARE TECHNOLOGY
9 Penn Medicine’s Center for Healthcare Technology will include an 8-story
office building for Penn Medicine corporate functions, and a new childcare
center. Construction began in early 2017. A second phase will support
future needs and will increase the building to 18 stories, with a total of
540,000 square feet.
Developer: Penn Medicine
Location: Civic Center Boulevard
Size: Phase 1: 250,000 square feet
Phase 2: 290,000 square feet
Completion Date: Early 2019 (Phase 1)
THE PAVILION AT PENN MEDICINE
10 The University of Pennsylvania will build a new $1.5 billion hospital
on Penn Medicine’s West Philadelphia campus. The facility will be
the largest capital project in Penn’s history and Philadelphia’s most
sophisticated and ambitious healthcare building project. The Pavilion
will house 500 private patient rooms and 47 operating rooms in a 1.5
million square foot, 17-story facility across the street from the Hospital
of the University of Pennsylvania.
Developer: Penn Medicine
Location: Civic Center Boulevard
Size: 1.5 million square feet
Completion Date: 2021
ROBERTS CENTER FOR PEDIATRIC RESEARCH
11 A 21-story building that houses office-based clinical research sits on
CHOP’s newest campus, a 9-acre site along the Schuylkill River. As one of
the City’s largest redevelopment projects, this campus will revitalize the
waterfront property, integrating CHOP spaces with the Schuylkill River
Trail and landscaping the area to create pedestrian walkways and green
spaces for public use that connect the neighborhood to the South Street
Bridge and University City.
Developer: The Children’s Hospital of Philadelphia
Location: Schuylkill Avenue & South Street
Size: 466,000 square feet
Completion Date: 2017
PHILADELPHIA RONALD MCDONALD
12
Real Estate Development
HOUSE EXPANSION
Along with the renovation of existing structures, this expansion will enable
PRMH to go from serving approximately 800 families annually over the
past three years to an estimated 1,900 families, and will increase available
room nights from roughly 16,000 to more than 40,000 per year.
Developer: Philadelphia Ronald McDonald House
Location: 3925 Chestnut Street
Size: 93,000 square feet
Completion Date: Late 2018/Early 2019
18THE STATE OF UNIVERSITY CITY 2018
PUBLIC SPACE
KORMAN QUADRANGLE
This green space adjacent to the improved Korman Center will feature
13
new walkways, landscaping and seating that will make the area more user-
friendly and appealing as a public gathering place. Renamed the Korman
Quadrangle, it will unify this section of campus by strengthening its
connections to Chestnut Street, Market Street and Drexel’s Perelman Plaza.
Developer: Drexel University
Location: Between Market & Chestnut and
between 32nd & 33rd Streets
Size: 1 acre
Completion Date: Fall 2017
40TH STREET TROLLEY PORTAL GARDENS
Through a unique public-private partnership with SEPTA, the City of 14
Philadelphia and neighborhood stakeholders, University City District
will transform the 40th Street Trolley Portal from an expanse of concrete
into a vibrant and social space featuring beautiful landscaping, movable
seating, and a new restaurant called Trolley Car Station that will serve as a
community asset for neighbors, commuters and local employees.
Developer: University City District
Location: 40th Street & Baltimore Avenue
Size: 43,000 square feet
Completion Date: Spring 2018
RESIDENTIAL / MIXED USE
3700 LANCASTER
A six-story residential building at the corner of Powelton and Lancaster
15
Avenues is expected to break ground in Q4 2018. The building is the second
residential project at uCity Square, and will feature 300 market-rate
apartments and 16,000 square feet of ground-floor retail.
Developer: A joint venture between the University City Science
Center, Ventas & Wexford Science + Technology
Location: 3700 Lancaster Avenue
Size: 300,000 square feet
Completion Date: Spring 2020
400 SOUTH 40TH STREET
16
Real Estate Development
Planning for a five-story apartment building with 119 individual units
continues for this site. Designed for graduate and professional students,
the building at 40th and Pine is close enough to campus that those with
non-traditional work and study schedules can get to and from their
laboratories, hospitals and research spaces sa fely and easily.
Developer: University of Pennsylvania in partnership with Equinox
Management & Construction, LLC, of Philadelphia
Location: 40th and Pine Streets
Size: 70,000 square feet
Completion Date: Summer 2018
19THE STATE OF UNIVERSITY CITY 2018
RESIDENTIAL / MIXED USE
4001-4003 CHESTNUT STREET
17 Plans are in the works to completely renovate the existing
vacant buildings at 4001-4003 Chestnut Street to create
retail and office spaces and three residential apartments.
The project area includes a 2,200 square foot landscaped
green space at the northern end of the site.
Developer: University of Pennsylvania in partnership
with Stockton Real Estate Advisors
and U3 Ventures, of Philadelphia
Location: 40th and Chestnut Streets
Size: 10,500 square feet
Completion Date: Summer 2018
4045 BALTIMORE AVENUE
18 Plans call for 49 one-bedroom apartment units to be
built as an “addition” to the existing site located at 4045
Baltimore Avenue. The five-story project built over on-
grade parking will include spaces for Zipcar vehicles.
Developer: New Horizons Housing
Location: 4045 Baltimore Avenue
Size: 33,850 square feet
Completion Date: February/March 2019
4215 CHESTNUT STREET
19 A 28-unit condominium building, 4215 Chestnut includes
one- and two-bedroom units with a common roof deck
and enclosed parking.
Real Estate Development
Developer: HOW Properties & Monte Resnick
Location: 4215 Chestnut Street
Size: 27,678 square feet
CompletionDate: July 2017
20THE STATE OF UNIVERSITY CITY 2018
RESIDENTIAL / MIXED USE
43RD & SANSOM
This mixed-use space is a four-story building with two 20
commercial spaces at grade.
Developer: Apartments at Penn
Location: 43rd & Sansom Streets
Size: 35,000 square feet
Completion Date: April 2017
CHESTNUT STREET APARTMENTS
Several multifamily buildings are rising on a short stretch 21
of Chestnut Street, collectively adding a substantial new
residential presence to this high traffic corridor.
Developer: Multiple developers
Location: Chestnut St. from 40th – 43rd Streets
Size: Minimum 200 units in total
Completion Date: Late 2017 – 2018
HAMILTON COURT
22
Hamilton Court is an iconic off-campus student
housing building at the University of Pennsylvania. The
property is undergoing a comprehensive renovation
and redevelopment, which includes the construction of
Real Estate Development
a ground-up, modern amenity center in the building’s
courtyard. Nearly 21,000 square feet of street level retail
will be opened, which will further amenitize the building
and enliven a previously underutilized street corner.
Developer: Post Brothers
Location: 39th Street & Chestnut Street
Size: 20,600 square feet commercial,
133,500 square feet renovated residential
Completion Date: Spring 2018
21THE STATE OF UNIVERSITY CITY 2018
RESIDENTIAL / MIXED USE
HILL COLLEGE HOUSE
23 Designed by Finnish-American architect and industrial
designer Eero Saarinen in 1958, Hill College House is an
internationally recognized architectural landmark that has
undergone a complete building renovation. Originally a
women’s dormitory, Hill is now a fully modern college house
with upgraded bathrooms, common spaces, kitchen and
dining areas, and mechanical systems including, for the first
time, air conditioning.
Developer: University of Pennsylvania
Location: 33rd & Walnut Streets
Size: 195,000 square feet
Completion Date: August 2017
THE SIMON
24 This new apartment building will feature 23 luxury
apartments. The design includes a state-of-the-art
fitness center and limited parking.
Developer: Campus Apartments
Location: 121 South 41st Street
Size: 45,000 square feet
Completion Date: August 2018
SUMMER TWELVE
25 Adjacent to the recently completed 16-story Vue32
apartment building, Radnor Property Group is also
developing three low-rise residential buildings consisting
of 12 for-sale condominiums. Each unit will have 2
bedrooms, 2.5 bathrooms, yard/roof deck amenity spaces
Real Estate Development
and access to onsite parking.
Developer: Radnor Property Group
Location: 32nd & Summer Streets
Size: Approximately 16,000 square feet
Completion Date: Summer 2018
22THE STATE OF UNIVERSITY CITY 2018
RESIDENTIAL / MIXED USE
USCIENCES RESIDENCE HALL
To better meet the needs of its students, University 26
of the Sciences is planning to construct a new, mixed-
use residence hall that will incorporate numerous
sustainable features for Green Globe certification. The
426-bed building will also house ground floor multi-use
classrooms, retail spaces and support offices. The building
has a U-shaped courtyard that opens onto Woodland
Ave., which will provide opportunities for interaction and
collaboration - key facets of an overall campus master
plan to activate Woodland Ave.
Developer: University of the Sciences
Location: 4514-22 Woodland Avenue
Size: 126,000 square feet
Completion Date: Winter 2018-19
VUE32
This $56 million, mixed-use project developed in 27
partnership with Drexel University provides residences and
a preschool to a mix of Drexel graduate students, faculty,
professional staff and non-Drexel professionals working in
the area. The 16-story residential tower features 164 luxury
one- and two-bedroom units and top flight amenities.
Developer: Radnor Property Group
Location: 3201 Race Street
Size: 176,000+ square feet
Completion Date: July 2017
WEST LOFTS
The historic West Philadelphia High School building is
28
being converted to loft style apartments with soaring
ceilings and oversized windows. Features of the original
building that are being preserved include the restored 1911
gym with suspended running track.
Real Estate Development
Developer: WPHS Venture Partners LLC
Location: 47th & Locust Streets
Size: 268 units
Completion date: Beginning Summer 2017
23THE STATE OF UNIVERSITY CITY 2018
uCity Square
University City Science Center and Wexford
Science + Technology announced a strategic
development partnership in 2015 to create
uCity Square, a mixed-use, transit-oriented
community in the heart of University City. In
total, the project combines 2.5 million square
feet of existing mixed-use development along
Market Street with an additional 4 million
square feet of planned office, laboratory, clinical,
residential, retail and green space on 14 acres of
land. Construction is underway on the first new
building in uCity Square, 3675 Market Street,
which is scheduled to deliver in summer 2018.
Building on the success of Innovation Plaza, additional placemaking activities are in progress
in uCity Square. The Pennsylvania Horticultural Society opened a pop-up beer garden at
36th and Filbert in spring 2017. University City District, Wexford, TinyWPA and the Science
Center are collaborating on The Meadow, a one-acre wildflower meadow and urban tree
farm at uCity Square inspired by recommendations from a local community design process.
In partnership with Drexel University, Wexford has begun construction on a new street and
utility grid on land Drexel and Wexford acquired from the School District of Philadelphia in
2014. The project will include three new streets - Cuthbert, Warren and 37th - which will further
integrate uCity Square into the surrounding neighborhoods. The new streets are expected to
take 10-12 months to complete. The growth of uCity Square will continue to elevate University
City as one of the nation’s leading innovation districts.
Pennovation Works
Innovators in fields from robotics to health
sciences have found offices, labs, production
space and a collaborative community at
Pennovation Works, a 23-acre site development
by the University of Pennsylvania. The site’s
centerpiece, the Pennovation Center, opened
in September 2016 and today hosts more
than 20 companies housed in labs, offices,
startup garages and co-working desks. The
Real Estate Development
site’s capacity is expanding, with the fit-out of
8,000 square feet in the Pennovation Center
and the availability of 24,000 square feet in the recently renovated office building. Penn
is also studying future use in a 69,000 square foot lab building. Programming in the past
year has included a hackathon, launch events, industry speaker panels, collaborative art
activity and a music concert open to the community. By grouping facilities for innovation,
technological development and artistic production/exhibition, Penn’s Master Plan
envisions a multifaceted workshop for harnessing and commercializing the tremendous
creative potential in the region.
24THE STATE OF UNIVERSITY CITY 2018
Schuylkill Yards
Drexel University and Brandywine Realty
Trust have partnered to create Schuylkill
Yards, a 14-acre master planned community.
Schuylkill Yards will be an integrated urban
environment, offering a collaborative and
connected knowledge community comprised
of educational and medical institutions,
businesses, residents and visitors bound
together by the pursuit of innovation. Situated
adjacent to Amtrak’s 30th Street Station, the
third-busiest passenger rail station in the
country, Schuylkill Yards will be connected
to the Philadelphia International Airport and
the major cities along the Northeast corridor,
making it a key innovation hub on the East Coast.
Brandywine has secured zoning approval for the first phases of Schuylkill Yards, allowing
for 1.3 million square feet of new vertical development, the re-imagining of the Bulletin
Building and the development of Drexel Square – a 1.3-acre park at the corner of 30th and
Market Streets. This initial development will further connect Drexel University’s main
campus, Amtrak’s 30th Street Station and Brandywine’s Cira Centre and Cira Centre South
to solidify the gateway to University City. Construction of Drexel Square is projected to
commence by the end of 2017.
Philadelphia 30th Street District
In 2017, Amtrak took the next big step
toward a comprehensive redevelopment
of Philadelphia 30th Street Station and
adjacent properties with the release of a
Request for Qualifications (RFQ) seeking a
Master Developer partnership. This multi-
phase solicitation follows the successful
completion of the Philadelphia 30th Street
District Plan in 2016, which envisioned
the district around 30th Street Station as
Philadelphia’s next great neighborhood: a
Real Estate Development
place to live, work, learn and play near one
of the nation’s busiest and most important
transportation hubs, and accessible to
one-of-a-kind urban and natural amenities.
In addition, Amtrak is advancing planning and design for Station Plaza, the grand civic place
surrounding all four sides of 30th Street Station. During the year, Amtrak engaged a wide-
range of stakeholders - including the public - on ways to enhance the public space around
the station. A preferred alternative will be selected by the end of 2017.
25THE STATE OF UNIVERSITY CITY 2018
Employment
In recent years, University City’s employment growth has been on par with
that of peer innovation neighborhoods in Seattle, Austin and Atlanta, and
shows no signs of slowing. With more than 33,000 jobs per square mile,
University City remains one of the top employment hubs in the region,
and plays a significant role on the national level as well: for the first time in
25 years, Philadelphia outpaced New York in terms of job growth. Buoyed
by the neighborhood’s largest employers and the opening of several
new offices, the number of jobs in University City continues to rise,
and is expected to reach 80,000 for the first time in 2017. The continued
development of uCity Square, Schuylkill Yards and University City's health
systems will continue spurring employment for years to come.
Employment in University City Percentage of Jobs Paying
90,000
at Least $40,000 per Year
12% 70%
80,000
70,000 10% 60%
60,000 50%
8%
50,000
40%
6%
40,000
30%
30,000
4%
20%
20,000
2%
10%
10,000
0 0% 0%
2002
2003
2004
2005
2006
2007
2008
2009
2010
2011
2012
2013
2014
2015
2016*
2017*
2002
2003
2004
2005
2006
2007
2008
2009
2010
2011
2012
2013
2014
2015
Employment
Jobs in University City University City
% of Philadelphia Jobs in University City Remainder of Philadelphia
Source: U.S. Census Bureau. 2015. OnTheMap Application. Longitudinal-Employer Household Note: Percentages reflect jobs paying at least $40,000 per year in nominal (currrent) dollars, and
Dynamics Program. Excludes federal civilian employees (prior to 2010), uniformed military, are not adjusted for inflation. Source: U.S. Census Bureau. 2015. OnTheMap Application.
self-employed workers, and informally employed workers. * UCD Estimate Longitudinal-Employer Household Dynamics Program. Excludes federal civilian employees (prior
to 2010), uniformed military, self-employed workers, and informally employed workers.
2627 THE STATE OF UNIVERSITY CITY 2018 Employment
THE STATE OF UNIVERSITY CITY 2018

                                    University City’s Largest Employers
                                     60,000

                                     50,000
                                                                                                     IRS: 3,855

                                                                                                     VA Hospital: 2,544
                                                                                                     Drexel University: 3,441
                                     40,000

                                                                                                     Children's Hospital
                                                                                                     of Philadelphia: 12,161

                                      30,000

                                                                                                     Penn Medicine: 15,311

                                      20,000

                                      10,000                                                         University of
                                                                                                     Pennsylvania: 17,655

                                             0
                                             2008          2009          2010          2011   2012   2013         2014         2015   2016   2017

                                    Source: Individual Employers

                                     Jobs By Industry

                                          Education and Health Care: 79.5%

                                          Office: 5.2%

                                          Entertainment, Hospitality
                                          & Retail: 8%

                                          Public Services: 4.4%

                                          Transportation, Warehousing &
                                          Wholesale Trade: 0.3%

                                          Manufacturing: 0.1%

                                          Other Services: 1.1%
Employment

                                          Real Estate & Construction: 1.4%

                                    Source: U.S. Census Bureau. 2015. OnTheMap Application.
                                    Longitudinal-Employer Household Dynamics Program.

28
THE STATE OF UNIVERSITY CITY 2018
Residents Commuting to University City Jobs
BY ZIP CODE
19116
283
Philadelphia
19115 19154
305 336
19150 19114
19118 417 252
352 19152
19111
19126 740 297
19138
19128 19119
510 256
1,039 901
19136
19149 419
19144 19141 619
406 19120
19127 721
145 717
19135
19124 302
607
University
19129 19140
366 451
City 19132
480 19133 19134
19137
137
19131 145 425
1,014 19121
463 19122
19125
19151 224
573
912 19130
19102 19123
1,069
19139 334 419
1,163
BY COUNTY
19104 19103
1,988 1,798 19107 19106
525 531
19146
19143 2,220 19147
2,813 1,529
19142
643
19145
1,041 19148
1,050
Pennsylvania
Bucks
2,441
19153
Montgomery
389 19112 8,790
4
Philadelphia
32,331
Chester
2,872
University
City New Jersey
Delaware Burlington
10,697 1,960
Camden
4,104
New Gloucester
Castle 2,255
1,146
Salem
150
Employment
Delaware
LOW HIGH
Source: U.S. Census Bureau. 2014. OnTheMap Application.
Longitudinal-Employer Household Dynamics Program.
29Employment THE STATE OF UNIVERSITY CITY 2018 30
THE STATE OF UNIVERSITY CITY 2018
University City and Peer Employment Centers
Employment Percentage of Jobs Paying
at Least $40,000 per Year
275,000 100%
250,000 90%
225,000
80%
200,000
70%
175,000
60%
150,000
50%
125,000
40%
100,000
30%
75,000
50,000 20%
25,000 10%
0 0%
02
03
04
05
06
07
08
09
10
11
12
13
14
15
02
03
04
05
06
07
08
09
10
11
12
13
14
15
20
20
20
20
20
20
20
20
20
20
20
20
20
20
20
20
20
20
20
20
20
20
20
20
20
20
20
20
Atlanta (Midtown) Research Triangle Park Seattle (South Lake Union)
Austin (Downtown) San Francisco (Mission Bay) Washington DC (Downtown)
Boston (Innovation District) San Jose (Downtown) University City
Cambridge (Kendall Square)
Percentage of Employees with Bachelor's or Advanced Degrees
45%
40% 42.3%
39.5%
35% 38.3% 37.8%
34.6% 35.0% 34.1% 35.4%
33.8%
30%
25% 26.8%
20%
15%
10%
5%
Employment
0%
Atlanta Austin Boston Cambridge Research San Francisco San Jose Seattle Washington DC University City
(Midtown) (Downtown) (Innovation (Kendall Square) Triangle Park (Mission Bay) (Downtown) (South Lake (Downtown)
District) Union)
Notes: Comparisons are between University City and equally sized areas (2.4 square miles) encompassing the peer employment center. Percentages reflect jobs paying at least $40,000 per year
in nominal(current) dollars, and are not adjusted for inflation. • Source: U.S. Census Bureau. 2015. OnTheMap Application. Longitudinal-Employer Household Dynamics Program
31THE STATE OF UNIVERSITY CITY 2018
Office
At 93% occupancy in Q3 2017, University City’s office market remains
among the tightest in the Philadelphia region. In the past year, three major
companies - FMC Corporation, NASDAQ, and Brandywine Realty Trust -
relocated to University City. The anticipated completion of the Science
Center’s and Wexford Science + Technology’s 3675 Market Street will
add nearly 350,000 square feet of new innovation space and has already
attracted the Boston-based Cambridge Innovation Center (CIC) as an
anchor tenant. The 1.5 million square feet of new development occurring
across the neighborhood was among the highest in the last 15 years, and
growth in construction permits drastically outpaces Philadelphia overall.
Office Occupancy Rates Among 25 Regional Submarkets
Submarket Occupancy Rate* 100%
University City 92.6%
Main Line 90.7%
Conshohocken 89.3%
Market West 88.7% 95%
Market East 88.7%
Bala Cynwyd 88.7%
Delaware County 88.1%
Lehigh Valley West 87.5% 90%
King Of Prussia/Valley Forge 87.0%
Exton/West Chester 86.2%
Independence Hall 84.9%
Jenkintown 84.6% 85%
New Castle County Suburbs 84.4%
Burlington County 84.3%
Central Bucks County 84.1%
Plymouth Meeting 84.0% 80%
Horsham/Willow Grove 83.4%
Upper Main Line 82.8%
Gloucester County 81.7%
Camden County 81.5% 75%
Blue Bell 80.8%
Wilmington CBD 80.6%
Fort Washington 80.0%
Office
Lehigh Valley East 79.3%
70%
Lower Bucks County 78.8% 2010 2011 2012 2013 2014 2015 2016 2017
*2017 (Q3) Source: CBRE
3233 THE STATE OF UNIVERSITY CITY 2018 Office
THE STATE OF UNIVERSITY CITY 2018

                                    Total Vacancy Rate                                                                          Asking Gross Rent (per sq ft)

                                    20%                                                                                          $45
                                                                                                                                 $40
                                                                                                                                 $35
                                    15%
                                                                                                                                 $30
                                                                                                                                 $25
                                    10%
                                                                                                                                 $20
                                                                                                                                  $15
                                    5%                                                                                            $10
                                                                                                                                  $5
                                    0%                                                                                            $0
                                          2007

                                                 2008

                                                        2009

                                                               2010

                                                                      2011

                                                                             2012

                                                                                    2013

                                                                                           2014

                                                                                                  2015

                                                                                                         2016

                                                                                                                2017

                                                                                                                                        2007

                                                                                                                                               2008

                                                                                                                                                      2009

                                                                                                                                                             2010

                                                                                                                                                                    2011

                                                                                                                                                                           2012

                                                                                                                                                                                  2013

                                                                                                                                                                                         2014

                                                                                                                                                                                                2015

                                                                                                                                                                                                       2016

                                                                                                                                                                                                              2017
Office

                                                                                                                            Note: Downtown Philadelphia includes University City and Center City
                                      University City                 Downtown Philadelphia                        Region   Source: CBRE

34
THE STATE OF UNIVERSITY CITY 2018
Net Absorption (sq ft) Under Construction (sq ft)
1,500,000 3,000,000
1,000,000
2,500,000
500,000
2,000,000
0
1,500,000
-500,000
1,000,000
-1,000,000
-1,500,000 500,000
-2,000,000 0
2007
2008
2009
2010
2011
2012
2013
2014
2015
2016
2017
2007
2008
2009
2010
2011
2012
2013
2014
2015
2016
2017
Office
University City Center City Remainder of Region (excluding Downtown Philadelphia) Source: CBRE
35THE STATE OF UNIVERSITY CITY 2018
Retail and Hospitality
Local and national retailers, restaurants, and hotels view University
City - with its diverse mix of employees, commuters, college students
and residents - as a prime location. Hotel options abound due to the
openings of AKA University City and The Study at University City, plus
renovations at the Sheraton. Need food options? The neighborhood
contains a whopping 266 places to eat and drink, including new fine dining
establishments Dim Sum House, CO-OP, and the Walnut Street Café and
casual eateries Fuel, Schmear It, and Beiler’s Donuts. These new amenities
draw customers and employees, leading to a 3% average annual increase
of pedestrian activity on University City streets.
Busy Sidewalks and Thriving Businesses
Hourly Ground Floor
Pedestrian Counts Commercial Storefronts
100 1
11AM - 1PM
31st St
500 5 Garden
St 32nd St
33rd St
Spring
6PM - 8PM 10
37th St
39th St
La
1,000 nc
as
te r
Av
e n Ave
Powelto
184
Market St 249 Race St
50th St
49th St
48th St
370 Arch St
46th St
542
45th St
Chestnut Arch St
44th St
St
43rd St
42nd St
41st St
Sansom St
84 728
47th St
368
39th St
788 279
38th St
964
37th St
Walnut St 547 286 209
120 438
36th St
427 515 1,224
Ave
744
579
ylkill
Locust St 426 1,155
1,157 361 507
Schu
436 236
973
Spruce St 865 688 994
885
30th St
898 1,030
Pine St
282
34th St
Osage Av 552
40th St
e
Larchwoo
d Ave
159
Ha zel Ave
133 226
90
Cedar Ave 254 1,163 So
Retail and Hospitality
159 ut
155 hS
682 t
103 273
133 Baltmore Ave 276 l vd
rB
n te
University
233 e
ic c
ve Civ
o nA
gt
Ave
rin 43
ar e rd
W Av e St
d
f el r Av
i ng te ve
143
pr es
S Ch gA
in 104
ss
se
ng
Ki
ve
dA
lan
od
Wo
Source: UCD
3637
THE STATE OF UNIVERSITY CITY 2018 Retail and Hospitality
CO-OPTHE STATE OF UNIVERSITY CITY 2018
All Storefronts Food & Beverage
Retail: 147 Casual Dining: 131
Food and Beverage: 266 Full Service Dining: 67
Services: 237 Bakery and Cafe: 44
Bar and Night Club: 17
Ice Cream: 7
Retail Services
Food: 43 Beauty: 52
Apparel: 11 Laundromat and Dry Cleaning: 21
Books and Music: 11 Real Estate: 20
Pharmacy: 11 Childcare: 15
General Merchandise: 10 Health Care: 14
Home and Garden: 8 Auto Service: 15
Cell Phones and Electronics: 10 Bank and Financial Institutions: 11
Retail and Hospitality
Gas Station: 7 Copy and Print: 11
Art Galleries and Supplies: 5 Tax Preparation and Accounting: 7
Gifts and Flowers: 6 Fitness: 8
Beauty Supplies: 5 Arts and Music Instruction: 10
Bicycles: 3 Hotels: 7
All Other: 17 Car Rental: 7
Social Services: 7
Source: UCD
Religious: 5
Tutoring: 4
All Other: 23
3839
THE STATE OF UNIVERSITY CITY 2018 Retail and Hospitality
The Nesting HouseTHE STATE OF UNIVERSITY CITY 2018
Clarkville
Food & Beverage Retail Services
300 300 300
250 250 250
200 200 200
150 150 150
100 100 100
50 50 50
Retail and Hospitality
0 0 0
2017 (Q2)
2015
2009
2016
2010
2011
2012
2013
2014
2015
2016
2009
2010
2011
2012
2013
2014
2017 (Q2)
2009
2010
2011
2012
2013
2014
2015
2016
2017 (Q2)
Ice Cream & Other Bar/Nightclub
Full Service Dining Bakery/Café
Casual Dining
Source: UCD
40THE STATE OF UNIVERSITY CITY 2018
AKA University City
Hotel Occupancy and Two New Hotels Boost
Average Room Rate University City’s Appeal
90% $250
80% Visiting University City has never
70% $200
been easier, or more comfortable.
60%
$150 In 2016, hotel room inventory surged
50%
40% 48% with the addition of 345
$100
30% combined units at the newly opened
20% $50 AKA University City and The Study at
10%
0% $0
University City. The Study features
2008 2009 2010 2011 2012 2013 2014 2015 2016
212 rooms, approximately 7,000
Center City Ocupancy
University City Occupancy square feet of banquet and meeting
UC Average Rate CC Average Rate
space, and CO-OP, a new restaurant
Average Daily Hotel Room Supply and lounge offering urban dining
with an emphasis on seasonal and
and Demand in University City
local ingredients. AKA University
1,200
City - located on the top 18 floors of
1,000
Retail and Hospitality
the new FMC Tower - features luxury
800
hotel, extended stay and apartment
600
options. It also offers proximity to
400
the ground-level Walnut Street Café
200 from the owners of the Michelin star
0 winning Rebelle in New York City,
2008 2009 2010 2011 2012 2013 2014 2015 2016 2017
Room Supply
plus some of the most breathtaking
Room Demand
Source: CBRE Hotels - Provided by the Philadelphia Convention and Visitors Bureau views in the entire city.
41THE STATE OF UNIVERSITY CITY 2018
Colleges and Universities
True to its name, University City provides top options in the region and
nation for undergraduate and graduate/professional studies. Over
43,000 students are enrolled in the neighborhood’s institutions of higher
education. Students from around the country and world are drawn
to the dynamism of University City’s global dining scene, proximity to
employment opportunities and excellent transit system. Nearly 25,000
undergraduate and graduate students live in apartments and houses
spread throughout the neighborhood. According to a Campus Philly poll
of undergraduates, 67% of respondents want to stay in Philadelphia
after graduation and approximately 88% believe there are many job
opportunities in Greater Philadelphia. In 2010, only 55% of respondents in
a similar poll indicated they’d recommend Philadelphia as a place to live.
Student Population in University City and Peer Employment Centers
25,000
20,000
15,000
10,000
Colleges and Universities
5,000
N/A*
0
University
City
Atlanta
Austin
Boston
Cambridge
Research
Triangle Park
San Francisco
(Mission Bay)
San Jose
Seattle
(Midtown)
(Downtown)
(Innovation District)
(Kendall Square)
(Downtown)
Washington DC
(Downtown)
(South Lake Union)
Undergraduate
Graduate Note: Comparisons are between University City and equally sized areas (2.4 square miles) encompassing the peer employment center.
*No date due to limited residential population • Source: U.S. Census Bureau, 2011-2015 American Community Survey
4243 THE STATE OF UNIVERSITY CITY 2018 Colleges and Universities
THE STATE OF UNIVERSITY CITY 2018

                                     Degrees Awarded at University City's Colleges and Universities
                                                                    Architecture and Related Services

                                                                    Biological and Biomedical Sciences

                                     Business, Management, Marketing, and Related Support Services

                                                  Communication, Journalism, and Related Programs

                                           Computer and Information Sciences and Support Services

                                                                                             Education

                                                                                            Engineering

                                             Engineering Technologies and Engineering-related Fields

                                                              English Language and Literature/Letters

                                                       Foreign Languages, Literatures, and Linguistics

                                                            Health Professions and Related Programs

                                                                                                 History

                                                                         Legal Professions and Studies

                                           Liberal Arts and Sciences, General Studies, and Humanities

                                                                                        Library Science

                                                                           Mathematics and Statistics

                                                                        Multi/Interdisciplinary Studies

                                                                      Philosophy and Religious Studies

                                                                                      Physical Sciences

                                                                                            Psychology

                                                 Public Administration and Social Service Professions

                                                                                        Social Sciences

                                                                            Visual and Performing Arts

                                                                                                           0         500        1,000       1,500       2,000       2,500       3,000   3,500   4,000

                                          Bachelor's                   Master's                  Doctor's research/ scholarship                             Doctor's professional practice
                                     Source: National Center for Education Statistics, IPEDS, Degrees Awarded July 1, 2015 - June 30, 2016 (fields with 50 or more degrees awarded)
Colleges and Universities

44
THE STATE OF UNIVERSITY CITY 2018
Student Population Living University Enrollment
in University City
25,000 45,000
40,000
5,325
20,000
4,020 35,000
30,000
15,000
25,000
20,000
10,000
19,221
17,719 15,000
10,000
5,000
5,000
0 0
2000 2015 2007 2008 2009 2010 2011 2012 2013 2014 2015 2016
Graduate USciences Grad Drexel Grad Penn Grad
Undergraduate USciences Undergrad Drexel Undergrad Penn Undergrad
Source: U.S. Census Bureau, 2000 Census, Source: Individual institutions
2011-2015 American Community Survey
2017 Enrollment
University The Restaurant Community
of the School at College of
University of Drexel Sciences in Walnut Hill Philadelphia
Pennsylvania University* Philadelphia College West Campus
Students
Undergraduate 11,716 15,499 2,094 326 1,455†
Graduate 13,244 8,733 442 0 0
Total Students 24,960 24,232* 2,536 326 1,455†
Student Housing
Undergraduate
Colleges and Universities
in campus residences 5,723 3,018 457 121 0
in fraternity/sorority 424 178 n/a 0 0
off campus (total) 5,569 12,481 1,700 205 1,455†
in University City 4,602 n/a n/a 26 n/a
Graduate
on campus 670 134 34 0 0
off campus (total) 12,574 8,599 380 0 0
in University City 5,098 n/a n/a 0 0
*Includes 2,166 students on co-op and 4,868 distance learning students. Total students on University City campus is 15,445.
†Includes credit and non-credit students who took classes at the West Regional Center including summer terms
45THE STATE OF UNIVERSITY CITY 2018
Healthcare
Nearly 40% of all people employed in University City work in the
healthcare sector, making it an essential component of University City’s
economy. The neighborhood’s medical institutions - Hospital of the
University of Pennsylvania (HUP), Penn Presbyterian Medical Center,
Children’s Hospital of Pennsylvania (CHOP) and Philadelphia Veteran
Affairs Medical Center - are on pace to treat nearly 4 million patients in
2017, and are leading the way in new treatments, procedures and medical
technologies. Two of University City’s health systems are ranked within
the top ten in the nation according to U.S. News and World Report, with
the Hospital of the University of Pennsylvania-Penn Presbyterian ranked
#9 overall and Children’s Hospital of Philadelphia coming in at #2 for
best children’s hospital.
Admissions Beds Births
40,000 800 5,000
788
34,691 4,000
30,000 600 4,078
29,065
520 3,000
20,000 400
354 2,000
15,388
280
10,000 200
1,000
5,904
0
0 410 0
0 0
Outpatient Visits Employees
Hospital of the University
1,690,429 of Pennsylvania
1,500,000 15,000 3400 SPRUCE STREET
Penn Presbyterian
1,259,581 13,326
Medical Center
1,000,000 10,000 51 NORTH 39TH STREET
10,043 Children’s Hospital
Healthcare
of Philadelphia
714,773
3401 CIVIC CENTER BOULEVARD
500,000 5,000
Philadelphia Veterans
Affairs Medical Center
216,352 2,322 3900 WOODLAND AVENUE
2,133
0 0 Source: American Hospital Association
4647 THE STATE OF UNIVERSITY CITY 2018 Healthcare
THE STATE OF UNIVERSITY CITY 2018

                                    Transportation

                                    Need to get around the neighborhood? You’re in luck. University City
                                    boasts excellent options for bicyclists, pedestrians or commuters using
                                    public transit, earning Walkscore.com's “paradise” status for all three
                                    modes of transportation. Transit ridership at neighborhood rail stations
                                    has increased by 16% since 2010, bike traffic to Center City is up 11%
                                    annually and pedestrian counts are up at an annualized rate of 3%.
                                    Overall, University City rates as more accessible by transit than any of
                                    its peer innovation hubs, including San Francisco, Seattle and Cambridge.
                                    Bike sharing has proven to be a smash success: 2016 saw a 27% increase
                                    in the inventory of local stations, and four of the top six most frequent
                                    trips in the city were to University City stations.

                                    Commute Mode of Residents                                                  Travel Time to Work (Minutes)
                                    100%             1.2%                  1.2%                   1.3%         45%                            41%
                                                                                                  2.6%                                                                40%
                                                                                                               40%
                                                    9.5%                   8.6%
                                                                                                               35%                                   32%
                                     90%                                                                       30%                                              26%
                                                                                                               25%         24%
                                                                                                 21.7%
                                                                                                               20%
                                     80%                                                                       15%
                                                                                                                                15%
                                                                                                                                                                                      10%
                                                                                                               10%
                                                                                                                                                                                 5%          4% 4%
                                                                                                  5.1%          5%
                                     70%
                                                                                                                0%
                                                                          50.4%                   8.2%
49 THE STATE OF UNIVERSITY CITY 2018 Transportation
THE STATE OF UNIVERSITY CITY 2018
Average Daily Transit Boardings and Bike Share Trips by Station
Transit Stations/Boardings Bike Share Stations/Trips
Market-Frankford Line
1,000 10
Subway-Surface Trolley Lines
50
5,000
SEPTA Regional Rail/New Jersey Transit St
Garden
100 Spring
29
Amtrak 31st St
33rd St
10,000 25
35th St
37th St
39th St
n Ave
25 Powelto
La
46th Street nc
as
Station te
rA 30th Street
ve
4,366
40th Street Station
Station
32nd St
15
36th St
Market St
34 th Street
5,792
44th St
Station 13,434
50th St
49th St
28 25
48th St
Chestnut
47th St
79
46th St
St
36th Street 6,318 12,119
45th St
315
Portal
43rd St
890
5,670
37
41st St
33 rd Street
40th St
31 Walnut St 104
39th St
36 Street
th
Station
34th St
Station 1,045
ve
Locust St
71
ill A
25
30th St
uylk
38th St
Spruce St
Sch
55
Pine St
Larchwoo
d Ave 40 Street
th 30 1,745
Portal University
42nd St
37th Street
Cedar Ave 2,386 Station City Station
6 91
3,125
So
ore Ave ut
Baltim 35 53 hS
t
ve l vd
University
B
eA te r
nc e en 25
or
e Av ic c
Fl on Civ
gt
Transportation
rin
Ave
ar e
W Av ve
d
el rA
fi te ve
rin he
s
Sp C gA
s in
s es
ng
Ki
ve
dA
od la n
Wo
Source: SEPTA, New Jersey Transit, Amtrak, City of Philadelphia, Bicycle Transit Systems Note: Bike Share counts are for Q2 2017
50THE STATE OF UNIVERSITY CITY 2018
Annual LUCY Riders Average Daily Boardings
1,000,000 at University City Stations
900,000
800,000
700,000 25,000
600,000
500,000
400,000
300,000 20,000
200,000
100,000
0
2003 2004 2005 2006 2007 2008 2009 2010 2011 2012 2013 2014 2015 2016
15,000
Source: SEPTA
Total Amtrak Riders to/from Philadelphia
(30th Street Station) 10,000
4,500,000
4,000,000
3,500,000
5,000
3,000,000
2,500,000
2,000,000
Transportation
1,500,000
0
1,000,000
Market- Subway Regional
500,000 Frankford Surface Rail
0 Line (Trolley)
2010 2011 2012 2013 2014 2015 2016
Source: Amtrak 2010 2016 Source: SEPTA
51THE STATE OF UNIVERSITY CITY 2018
100
90 98 Walk, Transit and Bike Scores
80 92 90 Walk Score measures walkability based on the
70 79 distance to nearby places and pedestrian friendliness
60 68 on a scale of 0 to 100.
67
50 Transit Score measures how well a location is served
40 by public transit based on the distance and type of
30
nearby transit lines.
20 Bike Score measures whether an area is good for biking
10 based on bike lanes and trails, hills, road connectivity,
and destinations.
0
Walk Score Transit Score Bike Score University City Philadelphia Source: walkscore.com
Most Frequent One-Way Trips on Indego Bike Share
University City Station / 23rd & South
Rodin Museum / 26th & Pennsylvania
36th & Sansom / Rittenhouse Square
21st & Catharine / Rittenhouse Square
Dornsife Center / 33rd & Market
University City Station / 21st & Catharine
Rodin Museum / 18th & JFK
4th & Bainbridge / 15th & Spruce
15th & Spruce / 21st & Catharine
11th & South / 15th & Spruce
23rd & South / Amtrak 30th Street Station
Rodin Museum / Rittenhouse Square
University City Station / 19th & Lombard
23rd & South / The Children's Hospital of Philadelphia
18th & JFK / 21st & Catharine
26th & Pennsylvania / 18th & JFK
23rd & South / 15th & Spruce
University City Station / 15th & South
18th & JFK / 11th & Pine, Kahn Park
Darien & Catharine / 15th & Spruce
0 2 4 6 8 10 12
Trips to/from University City Other trips Average Daily Trips
Source: City of Philadelphia, Bicycle Transit Systems, 2017 (Q2)
Bicycle Traffic Between Percentage of Residents
University City & Center City Commuting to Work by Bicycle
800 9%
Average hourly bicyclists at rush hour
8% 8.2%
700
7%
600
6%
500
5%
400
4%
3.9%
300
3%
200
Transportation
2% 2.1%
100 1%
0.9%
0.6%
0.4%
0 0%
U.S. Philadelphia University City
2005
2006
2007
2008
2009
2010
2011
2012
2013
2014
2015
2016
2000 2015
Note: Includes Schuylkill River bridges excluding Spring Garden Street
Source: Bicycle Coalition of Greater Philadelphia Source: U.S. Census Bureau, 2011-2015 American Community Survey
52You can also read