Smart City Solutions for a Riskier World - How innovation can drive urban resilience, sustainability, and citizen well-being
←
→
Page content transcription
If your browser does not render page correctly, please read the page content below

Smart City Solutions for a Riskier World
 How innovation can drive urban resilience, sustainability, and citizen well-being

                                                                                     START

Sponsored by
RESEARCH BACKGROUND           KEY FINDINGS           CHANGING GOALS & PRIORITIES         LEVERS OF CHANGE          DRIVING RESULTS BY DOMAIN   BECOMING A CITY 4.0                   SPONSORS & PARTNERS

       Introduction
       In the pandemic era, ensuring a healthy, safe, and prosperous future for citizens has been a burning imperative
       for city leaders. But with city budgets under pressure, it also has been their biggest challenge. COVID-19 has
       served as a stress test for cities as businesses and services were shut down and medical facilities stretched to
       their limit. It also exposed weaknesses in digital infrastructure and resilience as disruptions emerged
       unexpectedly with far-reaching aftershocks. Simultaneously, cities are facing mounting pressures to address
       vulnerabilities related to cybersecurity and climate change.
       Yet the pandemic also has been a catalyst for change. It is accelerating the reliance on technology, smart
       innovation, and e-commerce, while transforming citizen behaviors and expectations, and redefining how
       people work and live. It is also underscoring the role of collaboration among business, government, and
       academia to achieve social, environmental, and economic goals.
       To succeed in the post-COVID world, urban leaders need access to evidence-based analysis showing the
       innovative technologies, solutions, and business models that will work best, particularly when the next
       disruption hits.
       ESI ThoughtLab has collaborated with a global coalition of business, government, and academic leaders to
       provide city decision-makers with such an evidence-based roadmap. Called Smart City Solutions for a Riskier
       World, this research initiative explores how 167 cities—with diverse populations and economies—use smart
       innovation and public-private partnerships to drive results.

       Our goal is to provide an evidence-based roadmap to urban resilience
       and sustainability and to open a valuable dialogue on the future of cities
       among government, business, and academic leaders.

                                                                                                    Lou Celi, CEO
                                                                                                   ESI ThoughtLab

BACK                                                                                                                                                           Smart City Solutions for a Riskier World 2   NEXT
RESEARCH BACKGROUND   KEY FINDINGS   CHANGING GOALS & PRIORITIES   LEVERS OF CHANGE   DRIVING RESULTS BY DOMAIN         BECOMING A CITY 4.0                   SPONSORS & PARTNERS

                                                                                                               “The challenges we faced with the
                                                                                                               pandemic—the need for a good health
                                                                                                               system, a good education system, less
                                                                                                               inequalities, and a more resilient
                                                                                                               economy—were already on the agenda.
                                                                                                               The pandemic just made us believe more in
                                                                                                               the agenda.”
                                                                                                               Miquel Rodriguez Planas, 2030 Agenda
                                                                                                               Commissioner, Barcelona City Council

         Research background

BACK                                                                                                                                    Smart City Solutions for a Riskier World 3   NEXT
RESEARCH BACKGROUND           KEY FINDINGS           CHANGING GOALS & PRIORITIES              LEVERS OF CHANGE                    DRIVING RESULTS BY DOMAIN    BECOMING A CITY 4.0                   SPONSORS & PARTNERS

   Our research methodology
       To explore how cities are achieving their social,                            The five interconnected stages of our research
       environmental, and economic goals—and the solutions that
       work best—ESI ThoughtLab conducted a five-pronged
       research program:
       1. Surveyed and benchmarked 167 cities. We analyzed                           Benchmarking                                               Insights from                                         Multi-
          their use of smart technologies and data analytics across                    survey of                  Sustainability                urban leaders   Secondary city                      disciplinary
          all parts of their urban ecosystem, as well as in-depth                      167 cities                 Progress Index                 and experts      data from                          advisory
                                                                                       worldwide                                                                    trusted                            board
          data on their city investments, outcomes, and returns.
                                                                                                                                                                   sources
       2. Created a City Sustainability Progress Index. We used
          the survey data to develop a scoring methodology
          allowing us to categorize cities by their progress against
          the UN’s 17 Sustainable Development Goals (SDGs).
                                                                                    The UN’s Sustainable Development Goals
       3. Gathered city data from trusted sources. We collected
          data on city services and quality of life from the World
          Bank, Numbeo, IESE, and other respected sources. This
          data was integrated and correlated with our survey data.
       4. Conducted interviews with urban leaders and experts.
          To identify best practices and provide case studies, we
          had in-depth discussions with government decision-
          makers and business leaders in smart cities around the
          world.
       5. Established a multi-disciplinary advisory board. Our
          advisory board of city leaders, corporate executives, and
          academic experts provided valuable guidance and
          insights to ensure the acuity of our analysis.

BACK                                                                                                                                                                           Smart City Solutions for a Riskier World 4   NEXT
RESEARCH BACKGROUND            KEY FINDINGS               CHANGING GOALS & PRIORITIES          LEVERS OF CHANGE                DRIVING RESULTS BY DOMAIN           BECOMING A CITY 4.0                   SPONSORS & PARTNERS

       We surveyed decision-makers in 167 cities

                 167   Cities
                                               82
                                               Countries
                                                                           526.8
                                                                            million residents
                                                                                                          6.8%
                                                                                                         of global population
                                                                                                                                           We administered the survey through personal phone
                                                                                                                                           interviews with city officials from 167 pre-screened cities in 82
                                                                                                                                           countries. The cities are home to over 526 million residents,
                                                                                                                                           representing 6.8% of the world population.
                                                                                                                                           Twenty-one percent of the respondents were mayors or chief
                                                                                                                                           executives; an additional 15% were city managers.
                                                                                                                                           Approximately 30% held policy or operational roles, including
                                                                                                                                           chief of staff, or director of planning or policy. About 20% had
                                                                                                                                           senior positions overseeing technology or smart city
                                                                                                                                           initiatives.
                                                                                                                                           Respondents from emerging markets tended to be mayors or
                                                                                                                                           deputy mayors, while those from developed economies were
                                                                                                                                           more likely to be city managers or directors of technology or
                                                                                                                                           policy.
                                                                                                                                           The survey responses helped us understand how cities are
                                                                                                                                           achieving their social, environmental, and economic goals and
                                                                                                                                           how these may change due to the pandemic. We used the
                                                                                                                                           UN’s Sustainable Development Goals (SDGs) as a framework.
                                                                                                                                           We followed strict quality control measures to ensure the
                                                                                                                                           accuracy of the reported data, including vetting it with
                                                                                                                                           analysis from respected third-party sources, checking
                                                                                                                                           questionable data with cities, and reviewing the output with
                                                                                                                                           the advisory board.

BACK                                                                                                                                                                               Smart City Solutions for a Riskier World 5   NEXT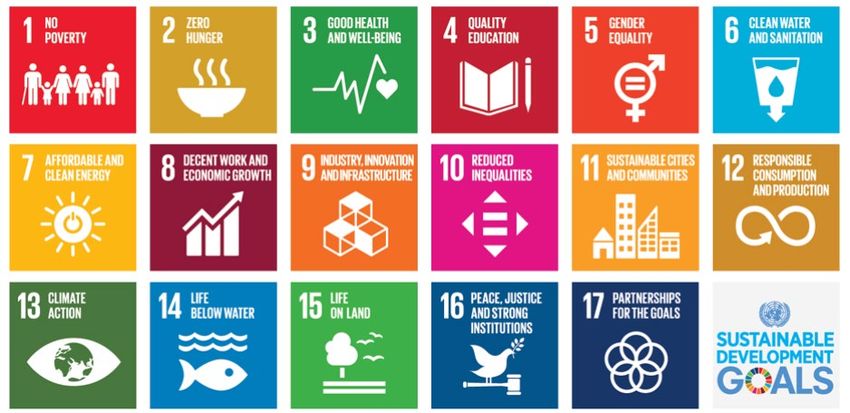
RESEARCH BACKGROUND           KEY FINDINGS           CHANGING GOALS & PRIORITIES          LEVERS OF CHANGE           DRIVING RESULTS BY DOMAIN                 BECOMING A CITY 4.0                   SPONSORS & PARTNERS

       Our sample covered cities of varying sizes across six regions
       The 167 cities range in population from 80,000 to nearly 27 million. Thirty-nine percent of the cities have less than one million inhabitants. The cities vary by level of economic
       development. Fifty-three percent are in emerging markets and 47% in developed countries.

       Number of cities by region                                                                                                                 By population

                                                                                                                                                           7%                              Less than 600,000
                                                                                                                                                                      23%
                                                                                                                                                   14%
                                                                                                                                                                                           600,000 to 1 million

                                                                                                                                                                                           1 million to 5 million

                                                                                                                                                                          16%              5 million to 10 million

                                                                  Europe                                                                             40%                                   Over 10 million
                       North America                                37
                            40                                                                Asia
                                                                     MENA                      46
                                                                      10                                                                          By level of development

                                                                  Africa
                                   Latin America                   19
                                         15
                                                                                                                                                                                              Advanced
                                                                                                                                                                             47%
                                                                                                                                                  53%                                         Emerging

BACK                                                                                                                                                                           Smart City Solutions for a Riskier World 6   NEXT
RESEARCH BACKGROUND          KEY FINDINGS            CHANGING GOALS & PRIORITIES            LEVERS OF CHANGE   DRIVING RESULTS BY DOMAIN              BECOMING A CITY 4.0                   SPONSORS & PARTNERS

       We categorized cities into three stages of SDG progress

       A prime objective of this research was to assess how smart urban solutions—such as use of
       emerging technologies and forging of new partnerships—can help cities achieve the SDGs. To                             Our SDG progress framework
       measure the headway that cities have made in driving the SDGs, we developed an SDG
       progress framework.                                                                                                    We grouped the cities into three stages of sustainable
                                                                                                                              development progress: implementers, advancers, and
       Our framework categorizes cities into three groups: implementers, which are in an early stage
                                                                                                                              sprinters. We classified them based on their scores across
       of SDG adoption; advancers, which are making progress on a range of SDGs; and sprinters,
                                                                                                                              the following criteria:
       which are making fast progress on most areas of sustainable development. Twenty percent of
       cities are classified as implementers, 58% as advancers, and 22% as sprinters.
                                                                                                                              1. The number of SDGs a city has included in its plans

       Three stages of SDG progress                                                                                           2. The progress a city has made on each of the SDGs

                                                                                                                              3. The steps a city is taking to achieve the SDGs:

                                                                                                                                       •    Regularly monitors SDG efforts
                                                                                                                                       •    Assesses areas where the city lags
                                                                              Sprinter 22%                                             •    Designates a department to implement SDGs
                                                                              Advanced in most SDGs                                    •    Gathers high-level support for its SDG program
                                                    Advancer 58%                                                                       •    Conducts a voluntary local review (VLR)
                                                    Making progress on SDGs                                                            •    Enjoys a reputation as a leader in SDG adoption

                                 Implementer 20%
                                 Including SDGs in plans

BACK                                                                                                                                                                  Smart City Solutions for a Riskier World 7   NEXT
RESEARCH BACKGROUND           KEY FINDINGS            CHANGING GOALS & PRIORITIES               LEVERS OF CHANGE     DRIVING RESULTS BY DOMAIN           BECOMING A CITY 4.0                   SPONSORS & PARTNERS

       We also classified cities by their progress in applying smart solutions

       Our economists created a smart city maturity framework to assess which cities are ahead in using
       digital solutions and technologies to achieve their social, environmental, and economic goals. We                        Our smart city maturity framework
       classified cities based on their progress on harnessing technology and data across the urban
       domains, as well as their ability to foster citizen and stakeholder engagement. Twenty-nine                              We categorized each city into one of three stages of smart
       percent of cities are classified as beginners, 49% as intermediates, and 22% as smart city leaders.                      city maturity: beginners, intermediates, and leaders. We
                                                                                                                                classified cities based on scores across the following criteria:

                                                                                                                                1. Level of digitization across the urban domains

                                                                                                                                2. Competence in using data and analytics
       Three stages of smart city progress
                                                                                                                                3. Progress on fostering citizen engagement

                                                                                                                                We applied an additional filter for leaders. To be classified as
                                                                                                                                a leader, a city had to self-identify as either advanced or very
                                                                                     Leader 22%                                 advanced in its implementation of smart city initiatives.
                                                                                     Advanced in the use of
                                                    Intermediate 49%                 technology and data across the
                                                                                     urban domains
                                                    Making progress on using
                                                    technology and data
                                                    across the urban domains
                               Beginner 29%
                               Starting to use technology and
                               data to achieve goals

BACK                                                                                                                                                                     Smart City Solutions for a Riskier World 8   NEXT
RESEARCH BACKGROUND   KEY FINDINGS   CHANGING GOALS & PRIORITIES   LEVERS OF CHANGE    DRIVING RESULTS BY DOMAIN   BECOMING A CITY 4.0                   SPONSORS & PARTNERS

                                                                                       “The SDGs are holistic on a global level. When you take them
                                                                                       down to the local level, with how you measure things, how
                                                                                       you create local ecosystems, or how you create partnerships,
                                                                                       if you can keep the three dimensions—social, environmental,
                                                                                       and economic—and the principles of the SDGs, then you can

         Key findings
                                                                                       create useful policies, useful projects, and more useful
                                                                                       discussions.”
                                                                                       Øyvind Tanum, Head of Smart City, Trondheim

BACK                                                                                                                               Smart City Solutions for a Riskier World 9   NEXT
RESEARCH BACKGROUND             KEY FINDINGS             CHANGING GOALS & PRIORITIES           LEVERS OF CHANGE               DRIVING RESULTS BY DOMAIN            BECOMING A CITY 4.0                   SPONSORS & PARTNERS

       When smart and sustainable meet: Cities 4.0
       To analyze the impact of smart city solutions on
                                                                                        What sets Cities 4.0 apart?
       sustainability, we identified a subset of SDG sprinters
       that also lead in using advanced technology and data
       analytics.                                                                         They are further ahead in smart          They have superior                     They have made the greatest
                                                                                          city initiatives                         infrastructure                         progress on nearly all SDGs
       The pandemic has been a catalyst for remarkable
       technological, business, and social change, which will                             On average, they widely deploy 14        Better public transportation, roads,   On average, 86% have made
       continue after the health crisis ends. With the                                    smart city projects vs. an average       parks, healthcare, and digital         progress across all SDGs vs. 62% of
                                                                                          of seven for others                      connectivity                           all cities
       expectations of citizens rising, and businesses gearing up
       for the Fourth Industrial Revolution, the most successful
       cities will be those that are advanced in using smart
       technology and data and deploy them to drive the SDGs.                           Smart meets sustainable: 20 cities                                                 Cities 4.0
       Such cities will be far along in their digital
       transformation, fully sustainable, and skilled in the new                                                                                                              Aarhus                  Los Angeles
       ways of doing business.
                                                                                                                                                                              Athens                  Madrid
       We call these cities, Cities 4.0.
                                                                                                                                                                              Baltimore               Moscow

       “The importance of cities to advance SDG policies                                            36                   20                        37                         Barcelona               New York
       cannot be understated. Smarter cities will lay the                                           SDG                  Cities           Smart city                          Berlin                  Orlando
       groundwork for collaborative governance in dealing                                           sprinters                               leaders
       with the world's most wicked problems. This research
                                                                                                                          4.0                                                 Birmingham              Paris
       goes to the heart of the resiliency of 21st-century cities,                                                                                                            Boston                  Philadelphia
       which we labeled Cities 4.0."
                                                                                                                                                                              Copenhagen              Singapore
       Frank V. Zerunyan, Professor of the Practice of
       Governance, University of Southern California                                                                                                                          Helsinki                Tallinn
                                                                                                                                                                              London                  Vienna

BACK                                                                                                                                                                              Smart City Solutions for a Riskier World 10   NEXT
RESEARCH BACKGROUND KEY FINDINGS CHANGING GOALS & PRIORITIES LEVERS OF CHANGE DRIVING RESULTS BY DOMAIN BECOMING A CITY 4.0 SPONSORS & PARTNERS
Our cities categorized by SDG progress
Sprinter (22%) Advancer (58%) Implementer (20%)
Aarhus Mexico City Abu Dhabi Chengdu Honolulu Monterrey Raleigh, NC Tunis Allentown Kampala
Accra Montevideo Addis Ababa Chennai Istanbul Montreal Reykjavik Vancouver Bamako Kano
Amman Moscow Adelaide Chicago Jakarta Munich Rio de Janeiro Victoria Benin City Kinshasa
Athens Mumbai Ahmedabad Cincinnati Jerusalem Nanjing Riyadh Warsaw Blantyre Kochi
Baltimore New York Almaty Colima Kansas City Nashville Rotterdam Washington, DC Cairo Lagos
Barcelona Orlando Amsterdam Columbus Kigali Newark San Antonio Wuhan Changchun Lahore
Berlin Osaka Asuncion Dehradun Kuala Lumpur Ningbo San Diego Xiamen Chongqing Libreville
Birmingham Paris Atlanta Denver Kuwait City Oakland San Francisco Cotonou Lusaka
Bogota Philadelphia Auckland Detroit Liege Oslo San Jose Dalian Monrovia
Boston Pittsburgh Austin Doha Lima Panama City Santiago de Chile Dar es Salaam Pearland
Bratislava Quebec Bangkok Dublin Lisbon Phnom Penh Seattle Guiyang Pune
Buenos Aires Sao Paulo Beijing Edmonton Ljubljana Phoenix Seoul Harare Qingdao
Copenhagen Singapore Belgrade Ekurhuleni Lucknow Portland Shanghai Hefei San Juan
Helsinki Stockholm Brantford El Paso Ludhiana Porto St Petersburg Ibadan Tianjin
Kyiv Suzhou Bucharest Fukuoka Manama Prague Tbilisi Jaipur Toyama
London Tallinn Busan-Ulsan Galway Manchester Quezon City Toronto Jena Yangon
Los Angeles Tokyo Calgary Hangzhou Manila Quito Touba Jiaozuo
Madrid Vienna Canberra Hanoi Mariupol Rabat Tulsa Jinan
Cities in bold are also classified as Cities 4.0.
BACK Smart City Solutions for a Riskier World 11 NEXTRESEARCH BACKGROUND KEY FINDINGS CHANGING GOALS & PRIORITIES LEVERS OF CHANGE DRIVING RESULTS BY DOMAIN BECOMING A CITY 4.0 SPONSORS & PARTNERS
Our cities categorized by smart city progress
Leader (22%) Intermediate (49%) Beginner (29%)
Aarhus Los Angeles Accra Denver Kyiv Pittsburgh Suzhou Ahmedabad Jena Quezon City
Abu Dhabi Madrid Addis Ababa Doha Lisbon Portland Tokyo Allentown Jinan San Jose
Amsterdam Montreal Adelaide Edmonton Ljubljana Porto Tulsa Almaty Kampala San Juan
Athens Moscow Amman Ekurhuleni Lucknow Pune Victoria Bamako Kigali Tbilisi
Atlanta New York Asuncion El Paso Ludhiana Quebec Warsaw Bangkok Kochi Tianjin
Auckland Orlando Austin Fukuoka Manama Quito Benin City Lagos Touba
Baltimore Paris Beijing Guiyang Manila Rabat Blantyre Lahore Toyama
Barcelona Philadelphia Belgrade Hanoi Monterrey Raleigh Brantford Libreville Tunis
Berlin Prague Bogota Harare Montevideo Reykjavik Changchun Liege Wuhan
Birmingham Rotterdam Bratislava Hefei Mumbai Rio de Janeiro Chongqing Lima Xiamen
Boston Seattle Bucharest Honolulu Munich Riyadh Colima Lusaka Yangon
Chicago Seoul Buenos Aires Jakarta Nanjing San Antonio Cotonou Manchester
Columbus Singapore Busan-Ulsan Jerusalem Nashville San Diego Dalian Mariupol
Copenhagen Tallinn Cairo Jiaozuo Newark San Francisco Dar es Salaam Mexico City
Detroit Toronto Calgary Kano Oakland Santiago de Chile Dehradun Monrovia
Dublin Vancouver Canberra Kansas City Osaka Sao Paulo Galway Ningbo
Helsinki Vienna Chengdu Kinshasa Oslo Shanghai Hangzhou Pearland
Istanbul Washington Chennai Kuala Lumpur Panama City St Petersburg Ibadan Phnom Penh
London Cincinnati Kuwait City Phoenix Stockholm Jaipur Qingdao
Cities in bold are also classified as Cities 4.0.
BACK Smart City Solutions for a Riskier World 12 NEXTRESEARCH BACKGROUND KEY FINDINGS CHANGING GOALS & PRIORITIES LEVERS OF CHANGE DRIVING RESULTS BY DOMAIN BECOMING A CITY 4.0 SPONSORS & PARTNERS
Cities are focusing on the SDGs around people and prosperity
The UN categorizes the SDGs into five Ps: people, planet, prosperity, peace, and partnerships. Most cities include SDGs under each of these Ps in their urban development
plans. Cities are doing the most with SDGs relating to people: 91% include no poverty, 89% include good health and well-being, and 86% include quality education in their plans.
Cities are also focusing on prosperity, with 86% including decent work and economic growth in their plans, and 78% incorporating sustainable cities and communities. The SDGs
around planet, peace, and partnerships are included slightly less often.
% of cities including SDGs in their plans
77% PEOPLE
End poverty and hunger in all forms
PROSPERITY
Ensure prosperous and fulfilling lives
average and ensure dignity and equality in harmony with nature
percentage of No poverty (91%) Decent work and economic growth (86%)
cities that Good health and well-being (89%) PEOPLE Industry, innovation, and infrastructure (79%)
PROSPERITY
include each of Quality education (86%) Sustainable cities and communities (78%)
the SDGs in Gender equality (77%) Affordable and clean energy (72%)
their plans Zero hunger (75%) Reduced inequalities (60%)
SUSTAINABLE PEACE
DEVELOPMENT Foster peaceful, just, and inclusive societies
Peace and justice strong institutions (78%)
PLANET PLANET
Protect our planet’s natural resources
PEACE
and climate for future generations PARTNERSHIPS
Life on land (83%) Revitalize the global partnership for
Clean water and sanitation (78%) sustainable development
Life below water (77%) Partnerships for the goals (71%)
Responsible consumption and production (69%) PARTNERSHIPS
Climate action (64%)
Q6a: Which of the SDGs are included in your city’s plans and on which of them has your city made considerable progress?
BACK Smart City Solutions for a Riskier World 13 NEXTRESEARCH BACKGROUND KEY FINDINGS CHANGING GOALS & PRIORITIES LEVERS OF CHANGE DRIVING RESULTS BY DOMAIN BECOMING A CITY 4.0 SPONSORS & PARTNERS
SDG scorecard: Where cities have made the most progress
Cities have made the most headway on areas related to people and prosperity: no poverty, decent work and economic growth, quality education, and good health and well-being.
They have made the least progress on zero hunger, climate action, and reduced inequalities, the same SDGs that are least included in their plans. With more manageable populations,
small cities are typically making more progress on the SDGs than large ones: 64% vs. 58%. On average, 74% of cities in advanced economies are making progress on the SDGs,
compared with half of those in emerging markets. Not surprisingly, SDG sprinters are making far more headway than implementers or advancers. Cities 4.0 are the top performers, with
almost nine out of 10 making considerable progress on 11 of the SDGs.
Population* Economic development SDG leadership
SDGs All Small Medium Large Advanced Emerging Implementers Advancers Sprinters Cities 4.0
No poverty 82% 80% 79% 91% 84% 81% 53% 88% 100% 90%
Decent work and economic growth 74% 72% 79% 66% 89% 60% 41% 80% 88% 85%
Quality education 70% 72% 70% 66% 82% 59% 38% 75% 88% 85%
Good health and well-being 70% 77% 69% 60% 90% 52% 29% 77% 81% 95%
Sustainable cities and communities 67% 74% 64% 60% 81% 55% 35% 77% 69% 70%
Industry, innovation, infrastructure 66% 75% 61% 60% 87% 48% 18% 77% 69% 95%
Life on land 65% 77% 60% 51% 87% 44% 18% 74% 75% 90%
Clean water and sanitation 63% 71% 58% 57% 82% 45% 18% 71% 88% 80%
Gender equality 61% 65% 60% 57% 77% 47% 9% 70% 81% 90%
Affordable and clean energy 57% 57% 55% 60% 63% 51% 35% 55% 81% 85%
Responsible consumption, production 56% 55% 54% 63% 61% 52% 32% 57% 69% 85%
Partnerships for the goals 56% 57% 54% 60% 67% 47% 29% 59% 69% 80%
Peace and justice strong institutions 56% 69% 49% 46% 73% 41% 24% 58% 88% 80%
Life below water 55% 49% 61% 54% 57% 53% 41% 52% 69% 85%
Zero hunger 53% 58% 58% 34% 77% 32% 6% 59% 81% 85%
Climate action 50% 37% 55% 66% 35% 64% 56% 42% 69% 65%
Reduced inequalities 47% 46% 51% 40% 63% 32% 18% 48% 63% 75%
Average 62% 64% 61% 58% 74% 51% 29% 66% 78% 84%
* Small = 600,000 to 1m inhabitants; medium = 1m to 5m inhabitants; large = 5m to 10m inhabitants.
Q6a: Which of the SDGs are included in your city’s plans and on which of them has your city made considerable progress? blue=high, gray=low
BACK Smart City Solutions for a Riskier World 14 NEXTRESEARCH BACKGROUND KEY FINDINGS CHANGING GOALS & PRIORITIES LEVERS OF CHANGE DRIVING RESULTS BY DOMAIN BECOMING A CITY 4.0 SPONSORS & PARTNERS
European cities lead the way, while African cities trail behind
European cities have made the most progress, with an
average of 77% making considerable headway on each of Where cities have made considerable progress
the SDGs.
North American cities are close behind with 71%. Africa has Less Moderate More
made the least progress, with an average of just 33%,
Africa Asia Europe
followed by Latin America with 47% and Asia with 58%.
Climate action 58% No poverty 91% Good health 95%
Every city in MENA and 87% of those in Latin America have
Partnerships 47% Decent work 74% Decent work 92%
made considerable progress on poverty. European and North
Life on land 42% Quality education 72% Clean water 86%
American cities are well ahead on good health, decent work,
Good health 42% Climate action 67% Sustainable cities 86%
industry and innovation, and sustainable cities.
Quality education 42% Life on land 67% Industry, innovation 84%
With increasing temperatures and sea levels threatening Decent work 42% Good health 61% No poverty 86%
their citizens and economies, African cities are moving most No poverty 42% Sustainable cities 59% Quality education 84%
aggressively on climate action. Average 33% Average 58% Average 77%
Of course, many of these differences are related to
budgetary capacity, with cities in advanced economies
having greater resources to devote to the SDGs. Latin America MENA North America
No poverty 87% No poverty 100% Industry, innovation 90%
“Africa faces the most challenges in meeting the SDG Sustainable cities 60% Affordable & clean energy 90% Good health 85%
commitments, with its high levels of environmental Gender equality 60% Partnerships 90% Sustainable cities 85%
degradation, poverty, and unemployment. However, Responsible consumption 60% Industry & innovation 80% Decent work 85%
social media and high mobile broadband penetration Decent work 53% Gender equality 80% Life on land 85%
provide some unique opportunities for smart city Climate action 53% Quality education 70% No poverty 83%
solutions.” Average 47% Average 63% Average 71%
Gerald Uche Maduabuchi, Director of Sales, Panorama
Data Solutions
Q6a: Which of the SDGs are included in your city’s plans and on which of them has your city made considerable progress?
BACK Smart City Solutions for a Riskier World 15 NEXTRESEARCH BACKGROUND KEY FINDINGS CHANGING GOALS & PRIORITIES LEVERS OF CHANGE DRIVING RESULTS BY DOMAIN BECOMING A CITY 4.0 SPONSORS & PARTNERS
SDG sprinters take five key steps to ensure success
More than nine out of 10 sprinter cities monitor their SDG
Five steps to SDG sprinter success
progress and 58% conduct voluntary local reviews.
In addition, 72% of sprinters assess their SDG performance
against other cities. Monitor progress
94% regularly monitor SDG progress vs.
SDG programs do well when they have the backing of different
70% of other cities. Only 12% of
parts of the government, which is the case with 86% of sprinters.
implementers track progress. Gain wide support
Another best practice is to assign a department to lead the SDG
efforts, followed by more than three-quarters of sprinters.
86% enjoy wide support across city
government, including high levels, vs.
57% of other cities.
Select a department to lead
78% have a department that leads
SDG efforts vs. only 46% of other cities
and none of the implementers.
Assess results against peers
72% measure SDG progress against
peers to identify strengths and
Conduct a voluntary local review weaknesses vs. 40% of other cities.
58% have done voluntary local
reviews of SDG progress vs. only 40%
of other cities.
“Cities are about people, not gadgets. We should be mindful of diversity, equity, and inclusion to ensure that
any techniques or technology are based on improving quality of life for all.”
Karen Lightman, Executive Director, Metro21: Smart Cities Institute, Carnegie Mellon University
Q6b: Which of the following statements about your city’s adoption of the SDGs do you agree with?
BACK Smart City Solutions for a Riskier World 16 NEXTRESEARCH BACKGROUND KEY FINDINGS CHANGING GOALS & PRIORITIES LEVERS OF CHANGE DRIVING RESULTS BY DOMAIN BECOMING A CITY 4.0 SPONSORS & PARTNERS
Cities will face headwinds over the next three years
Half of cities believe complex policies and difficulty in finding
Top 5 challenges Challenges: Emerging vs. advanced markets
the right partner or supplier will bog down their SDG efforts.
These hurdles are most acute in the Middle East, where
fragmented policies and the scarcity of local top-tier suppliers 52% Complex policies, regulations 42%
63%
can stymie SDG efforts. Other top impediments include data Complex policies and
security and privacy, the fast pace of digital change, and the 43%
regulations Finding right suppliers, partner
58%
need to provide basic services—a particular pain point during
35%
the pandemic. 50% Data security & privacy risks
54%
The prevalence of these SDG hurdles depends partly on a city’s Finding the right Need to focus on basic services 23%
partner or supplier 38%
level of economic development. Cities in advanced countries
more often face problems relating to policies, suppliers, and Fast pace of technological change 40%
34%
data security and privacy. Emerging market cities suffer more 44% 24%
from high costs, budget constraints, and weak economic Coordinating across departments
Data security and 29%
conditions, as well as insufficient support from both the privacy 16%
government and citizens. These barriers are most pronounced Unclear implementation roadmap
18%
in African cities.
37% Shortage of skills & expertise 16%
18%
Fast pace of
Initiatives seen as helping the rich 16%
technological change 15%
“Many cities can learn from leaders like New York, Copenhagen,
London, and Singapore but they must realize that adaptations High costs & budget constraints 32%
must be context specific—it is important for the ‘model’ cities to 30% 10%
reveal the conditions that allowed them to undertake their Need to focus on Inadequate physical infrastructure 24%
innovations and equally important for the adapting city to 9%
basic services
understand its own conditions—not to adopt something without
adapting it.” Emerging Advanced
Eugenie L. Birch, Nussdorf Professor and Co-director, Penn IUR
Q7: What are the main challenges that your city faces in achieving its social, environmental, and economic goals over the next three years?
BACK Smart City Solutions for a Riskier World 17 NEXTRESEARCH BACKGROUND KEY FINDINGS CHANGING GOALS & PRIORITIES LEVERS OF CHANGE DRIVING RESULTS BY DOMAIN BECOMING A CITY 4.0 SPONSORS & PARTNERS
“We always keep in mind
the principles of the SDGs,
and we have a lot of
programs working to
alleviate poverty, hunger,
the digital divide. The SDGs
pinpoint critical issues for
every city. But COVID really
amplified very quickly the
challenges, both internally
and externally.”
Emily Yates, Smart City
Changing goals and priorities Director, Philadelphia
The impact of the pandemic
BACK Smart City Solutions for a Riskier World 18 NEXTRESEARCH BACKGROUND KEY FINDINGS CHANGING GOALS & PRIORITIES LEVERS OF CHANGE DRIVING RESULTS BY DOMAIN BECOMING A CITY 4.0 SPONSORS & PARTNERS
The pandemic was a watershed event
COVID-19 was by far the biggest upheaval that cities faced in recent memory. Every region Top external disruptions The pandemic’s
ranked it as the top disruption in 2020, except for Africa, where it was tied with declining
lasting impacts
economic growth, an offshoot of the crisis. 81%
On average, 81% of cities said the pandemic was a major disruption. It was even more Pandemic 69% Reconsider
troubling for cities in advanced markets, such as North America (98% of cities) and Europe and its repercussions urban planning & use
(92%), which struggled to contain the virus. Declining economic growth and rising digital of space
expectations—both repercussions of the pandemic—came in a distant second and third.
46%
Decline 54% Rethink mobility
Other challenges, such as climate change, resource constraints, shifting demographics, and
in economic growth & transportation
social unrest paled in comparison.
Even after the pandemic ends, the shockwaves will persist. Over two-thirds of cities will 28% 54% Accelerate the
reconsider urban planning and use of space and 54% will rethink mobility. Strikingly, over half Rising digital shift to online
of urban leaders believe the crisis will forever alter how people, live, work, socialize, and expectations of citizens healthcare
travel in cities.
25% 53% Permanently
The impacts vary by region. Over nine out of 10 cities in Latin America will reconsider urban Climate change
planning and use of space. Eight out of 10 cities in the Middle East plan to re-examine their change how people
mobility and transportation approaches. And 68% of cities in Europe expect the way people 23% live, work, socialize,
live, work, and travel to permanently change. Lack of resources & travel in cities
18% 36% Expose the
Shifting demographics weaknesses in cities’
“The pandemic has taught us both low-tech and high-tech lessons. It has laid bare issues operational
of social and economic vulnerability, increasing our focus on public health, diversity, and
and diversity
continuity
inclusion. It has underscored the importance of a city’s social fabric; the seemingly
intangible benefits of a neighborhood—and neighbors—are now strikingly tangible.”
18% capabilities
Social unrest
Jarendra Reddy, Director, Urban Solutions, Hatch
Q8: Please select the top three external disruptions facing your city today. Q9: Which of the following statements about the impact of COVID-19 on your city and its stakeholders do you agree with?
BACK Smart City Solutions for a Riskier World 19 NEXTRESEARCH BACKGROUND KEY FINDINGS CHANGING GOALS & PRIORITIES LEVERS OF CHANGE DRIVING RESULTS BY DOMAIN BECOMING A CITY 4.0 SPONSORS & PARTNERS
The pandemic heightened the SDG imperative
The pandemic made the social good a higher priority for more than one-third of cities around the Pandemic impacts
world. The number is even higher in Europe, where it has prompted 43% of cities to do further soul
searching.
The health crisis elevated the importance of the SDGs for over a quarter of cities surveyed. Cities in
36%
The pandemic has stimulated
developed markets were almost 2.5 times as likely as those in emerging economies to give the
new thinking about our priorities
SDGs higher priority as a result of the pandemic.
to build the social good.
For 14% of cities, social distancing and other containment measures have generated environmental
28%
benefits that they will strive to maintain. African cities, for example, saw improvements in
biodiversity conservation, which 26% of them hope to sustain after the pandemic ends.
SDG programs have helped nearly one out of five cities cope with the pandemic and these cities The COVID-19 health crisis has
will use them as a platform for recovery. Partnerships with the private and public sector, for made the SDGs a higher priority
example, helped municipalities weather the storm. For cities in developed countries, the for our city.
percentage that benefited from the SDGs was even higher—25%.
18%
Our SDG program has helped
our city to respond to the
“The pandemic will upturn traditional urban development models and compel cities to COVID-19 pandemic.
reimagine mobility, health infrastructure, housing, education, energy consumption, and more.
It has laid bare the inequities in access and has impacted disadvantaged communities more.
Along with inclusion, addressing these systemic inequities in the current urban development
model will be critical for cities.”
14%
The pandemic has led to
Michael Flynn, Global Government & Public Services Financial Advisory Leader, Deloitte
environmental benefits that our
city is striving to maintain.
Q6b: Which of the following statements about your city’s adoption of the SDGs do you agree with? Q9: Which of the following statements about the impact of COVID-19 on your city and its stakeholders do you agree with?
Q10: What were the biggest lessons learned from the pandemic?
BACK Smart City Solutions for a Riskier World 20 NEXTRESEARCH BACKGROUND KEY FINDINGS CHANGING GOALS & PRIORITIES LEVERS OF CHANGE DRIVING RESULTS BY DOMAIN BECOMING A CITY 4.0 SPONSORS & PARTNERS
COVID-19 highlighted the value of smart city programs
With social distancing preventing physical interaction in cities,
smart technology became the only game in town. Smart city lessons learned during the pandemic
For 65% of cities, the biggest lesson learned during the pandemic
was just how crucial smart city programs were for their future. Smart city programs are crucial for the future 65%
This was a particularly critical lesson for cities in the Middle East
Pay more attention to citizens' health 54%
(80%) and Europe (68%). Also, 43% learned the importance of
operational continuity and agility, and about the same percentage Operational continuity and agility are critical 43%
realized the merit of timely access to data and analytics.
Timely access to data analytics is crucial 40%
The pandemic also drove home the need to work differently.
Almost four out of 10 cities learned the value of collaboration Need to invest in upgrading core infrastructure 37%
between the public and private sectors to address today’s issues.
About a third found that remote working could boost staff Business & government need to collaborate more 37%
productivity, while 28% learned that crisis management was vital
for city leaders and workers to cope with unexpected disruptions. Remote work can improve employee productivity 33%
COVID-19 also convinced cities of the need to invest more in Crisis management is vital for city leaders 28%
upgrading core infrastructure (37%) and in reliable and affordable
connectivity (25%). Need to provide more reliable & affordable internet 25%
“Technology enables SDG progress because it can integrate both technical and social solutions. It optimizes use of scarce resources, connects governments with their citizens, and scales
quickly to respond to dynamically changing conditions. Further, it enables both front-end insights and feedback loops that power a cycle of continuous improvement.”
Andrew Caruso, Director, Strategy and Operations, Urban Solutions, Hatch
Q10: What were the biggest lessons learned from the pandemic?
BACK Smart City Solutions for a Riskier World 21 NEXTRESEARCH BACKGROUND KEY FINDINGS CHANGING GOALS & PRIORITIES LEVERS OF CHANGE DRIVING RESULTS BY DOMAIN BECOMING A CITY 4.0 SPONSORS & PARTNERS
But the pandemic also underscored the need for cybersecurity
Smart city innovation is a double-edged sword. As cities increase their % of cities that are well/very well prepared for cyberattacks by size
investments in digital technologies, they also expose their cities to and smart city maturity
greater risks if they do not put safeguards in place up front.
The pandemic was a stress test for urban cybersecurity systems. Attacks
on state and local governments went up dramatically as cybercriminals
sought to take advantage of the crisis.
Many cities fell victim to ransomware and other attack vectors. For
example, Knoxville, TN was hit in June of 2020 with an attack that crippled
its IT systems. The disruption escalated when hackers began publishing
data online in a move to extract a ransom payment. Hackers also took
advantage of pandemic-related disarray by shamelessly targeting some
hospitals.
Our study shows that cities need to do more to keep their urban centers
and citizens secure. Most cities, 60%, report they are not well prepared
for cyberattacks. Although small cities feel more confident about their
cybersecurity systems than others, the smallest urban areas are in a more
precarious situation, with only 29% reporting they are well prepared. This 95%
is borne out by the number of smaller cities in the US, for example, that
were attacked during the pandemic (including Florence, AL, Pensacola, FL,
and Torrance, CA).
In fact, one sign of a smart city leader is their level of cybersecurity—95% 40%
are well prepared for cyberattacks against just 8% of beginners. 33%
8%
Beginner Intermediate Leader All
Q25: How prepared is your city for cyberattacks?
BACK Smart City Solutions for a Riskier World 22 NEXTRESEARCH BACKGROUND KEY FINDINGS CHANGING GOALS & PRIORITIES LEVERS OF CHANGE DRIVING RESULTS BY DOMAIN BECOMING A CITY 4.0 SPONSORS & PARTNERS
Where smart city leaders invest more in cybersecurity
City managers should take a sheet from the lesson book of smart city leaders.
There are five key cybersecurity steps that leaders take far more often than Areas where smart city leaders invest more
other cities to address their cybersecurity vulnerabilities. Leader All Difference
1. Prioritize assets and create access control policies. Protecting a city's most Prioritize assets & create access control policies 68% 49% 19%
valuable assets is a smart first step, as is making sure the city imposes tight
controls on who can access systems. Disaster recovery, response, & event management technology 46% 31% 15%
2. Invest in disaster recovery, response, and event management technology. Cybersecurity training for staff 54% 40% 14%
No matter how strong a city’s firewalls, it only takes one bad guy to get
Protect critical infrastructure, including security testing 49% 35% 14%
through. So smart city leaders invest more heavily in specialized recovery
and response technology to act quickly to mitigate impacts. Develop incident response & recovery plan 43% 29% 14%
3. Provide cybersecurity training to staff. This is a critical step for cities since Augment staff with outside specialists or outsourced functions 32% 23% 9%
cybercriminals often capitalize on employees’ mistakes.
End-point security, such as securing mobile devices & laptops 19% 12% 7%
4. Protect critical infrastructure. This includes security testing of electricity
Cloud & network security 70% 65% 5%
grids, traffic lights, hospitals, and other urban assets. Interconnecting city
assets and domains through IoT and other technologies can expose cities to Hire more cybersecurity specialists & staff 78% 76% 2%
a catastrophic attack if they do not adequately safeguard their
infrastructure.
5. Develop a cyber incident response and recovery plan. Smart city leaders
“Resilience and agility are a must to survive and to thrive. Governments move at a
understand they not only need to be act quickly to stop an attack, but also
slower pace because we have fiduciary responsibility. We have oversight by our
have processes in place to limit the aftereffects, including those related to
elected officials and the public. We don’t have the luxury of time. It’s not if, it’s when
liability, and financial and reputational impacts.
we’ll have another crisis, and it’s all about creating a state of readiness.”
Aram Chaparyan, City Manager, City of Torrance
Q26. In which cybersecurity areas is your city planning to make large investments of money and time over the next three years?
BACK Smart City Solutions for a Riskier World 23 NEXTRESEARCH BACKGROUND KEY FINDINGS CHANGING GOALS & PRIORITIES LEVERS OF CHANGE DRIVING RESULTS BY DOMAIN BECOMING A CITY 4.0 SPONSORS & PARTNERS
“The SDGs are seen as a strategy for
communities to tie a global framework
with important local urban challenges
that we’re facing around housing,
affordability, homelessness, climate
change, and many others.”
Chris Castro, Director of Sustainability
and Resilience, City of Orlando
Levers of change
BACK Smart City Solutions for a Riskier World 24 NEXTRESEARCH BACKGROUND KEY FINDINGS CHANGING GOALS & PRIORITIES LEVERS OF CHANGE DRIVING RESULTS BY DOMAIN BECOMING A CITY 4.0 SPONSORS & PARTNERS
Driving results through five levers of change
Our economists created an analytical framework to examine how 167 cities apply a variety of change
drivers across urban domains to advance sustainability, economic growth, social change, and citizen
well-being.
The importance of these levers of change became apparent during the pandemic. To cope with the health
crisis, cities relied on partnerships, digital technology, data analytics, and new funding models to get things
done. Proactive governance and leadership helped cities keep citizens safe and businesses intact.
Five levers of change
1. Partnerships and
ecosystems
How cities work with citizens,
businesses, universities, NGOs,
and others to achieve the SDGs. While many cities have smart city initiatives,
4. Data management and
transforming aspirations into
analytics
2. Finance and business models How cities manage data and implementation can be challenging,
Financing and business models analytics to support their especially for cities with limited fiscal and
that cities use to pay for needed smart, sustainable practices. technical capacity in emerging markets. A
investments. lot of work needs to be done to develop
5. Governance, leadership, projects to be commercially viable. Cities
and vision can better implement their smart city goals
How cities govern and by working with development partners that
3. Digital technology
manage their SDG programs
The use of digital technology
and engage with stakeholders.
understand what it takes and can support
to drive operational, social, this journey.
environmental, and economic
improvements. Lisa Da Silva, Global Cities Lead,
International Finance Corporation
BACK Smart City Solutions for a Riskier World 25 NEXTRESEARCH BACKGROUND KEY FINDINGS CHANGING GOALS & PRIORITIES LEVERS OF CHANGE DRIVING RESULTS BY DOMAIN BECOMING A CITY 4.0 SPONSORS & PARTNERS
1. Partnerships: SDG sprinters leverage their ecosystems
By working with the private sector during the crisis, urban leaders were better equipped to Partnership priorities over next three years
keep citizens safe and their cities operational. It sent a powerful message to the world.
The pandemic was a painful learning experience: for 47% of sustainability sprinters, the need for Academic, research institutions 67% 32% 40%
businesses and government to collaborate was a clear lesson. Also, 25% of sprinters learned that a
resilient ecosystem of partners and suppliers is vital for coping with disruptive events. Multilateral organizations 58% 47% 49%
Sprinters work with a range of partners to achieve their results. They are twice as likely as others National government 56% 73% 69%
to team up with financial institutions and academic and research institutions. They also work
more with community groups, NGOs, foundations, and industry and trade associations. Businesses 56% 37% 41%
SDG sprinters have a different approach to the public sector than cities in earlier stages of Financial institutions 53% 24% 31%
sustainability development. They are more apt to draw on multilateral organizations and
collaborate with other cities. SDG implementers and advancers are much more likely to look to Start-ups & tech firms 47% 50% 49%
national, state, and regional groups for support.
Regional agencies/authorities 47% 66% 62%
How Trondheim works with academia Neighborhood associations 47% 24% 29%
Taking advantage of its proximity to the Norwegian University of Science and Technology (NTNU), the city State/provincial government 42% 60% 56%
of Trondheim has recruited volunteers and students interested in sustainability to conduct research and
suggest smart solutions. In the city of 200,000 people, over 4,000 students work on these initiatives each Other cities or city networks 42% 23% 27%
year. The city also has created innovation boards that bring together university directors and deans to
discuss the latest sustainability strategies. NTNU’s artificial intelligence center, the Norwegian AI Lab, also NGOs and civil society groups 36% 24% 27%
works closely with the city. AI technology can provide essential data insights enabling cities to improve
Industry associations/trade unions 36% 24% 26%
infrastructure, mobility, sanitation, public security, and the environment.
Consultants, outsourcing firms 33% 50% 47%
“We are quite systematic in how we work across institutions. With the university-city agreement, we tried
to align the governance system within the city and within the university. We can give the students and Foundations, advocacy groups 22% 21% 21%
scientists easier access to the city, and insights into the problems we are having, and we can also bring
new knowledge faster into the way we run the city,” said Øyvind Tanum, Head of Smart City, Trondheim.
Sprinters Others All cities
Q13: Considering your city’s experience with the pandemic, which of the following partnerships will your city prioritize over the next three years?
BACK Smart City Solutions for a Riskier World 26 NEXTRESEARCH BACKGROUND KEY FINDINGS CHANGING GOALS & PRIORITIES LEVERS OF CHANGE DRIVING RESULTS BY DOMAIN BECOMING A CITY 4.0 SPONSORS & PARTNERS
1. Partnerships: Cities want smart, secure, sustainable solutions
Cities are blazing a trail on achieving the SDGs—and expect their partners to Criteria to evaluate partners over next three years
do their part as well.
Seventy-eight percent of cities cite sustainability and resilience as a priority Technical approach & level of innovation 83%
when choosing a partner. For cities just starting to adopt the SDGs, smaller cities,
and cities in Africa and Latin America it is the top criterion. Sustainability & resilience 78%
In addition, cities want their partners to offer solutions that enable a high level
Safety & security 65%
of innovation (83%) while also ensuring safety and security (65%). Sprinters
(92%), North American cities (92%), and European cities (92%) value innovation
Compliance with regulations 59%
the most.
Price is not top of mind for most cities when evaluating smart city proposals—it Relevance of proposal 40%
is cited by only 21% of them. Cities just beginning to make progress on the SDGs
(41%) and those in Africa (47%) are more cost conscious than their counterparts Technical expertise 33%
in other regions.
Value for money 32%
SDG sprinters are three times as likely as implementers to use the smart city
proposal process to help achieve social goals by including the participation of
Synergies with other smart city projects 28%
local and disadvantaged populations in evaluating partners (28% of sprinters vs.
6% of implementers).
Experience/established track record 26%
Vendor financing availability 26%
“The first tool that cities should leverage is a culture of collaboration. If the
pandemic has taught us anything, it has revealed that no one person, stakeholder,
Lowest price 21%
or department in government has all the answers to solve all the needs of the
community.”
Local/disadvantaged business role 18%
Kevin Taylor, Segment Development Manager, Smart Cities, Axis Communications
Q12: What criteria will be most important to your city when evaluating smart city proposals over the next three years?
BACK Smart City Solutions for a Riskier World 27 NEXTRESEARCH BACKGROUND KEY FINDINGS CHANGING GOALS & PRIORITIES LEVERS OF CHANGE DRIVING RESULTS BY DOMAIN BECOMING A CITY 4.0 SPONSORS & PARTNERS
2. Funding: Finding new sources of financial support
Funding for the SDGs is a major challenge: the financing gap in the emerging markets alone is Main funding techniques to support SDGs
estimated to be $2.5 trillion to $3.0 trillion per year, according to the UN.*
Given their central role in achieving the SDGs, cities will bear a large portion of the funding burden. This
will require them to find new sources of financial support. 86%
Private-sector financing
70%
Today, cities rely on private-sector financing, government-based borrowing, funding from national and
state governments, and user fees and taxes to pay for their social, environmental, and economic 84%
Government-based borrowing
programs. Over the next three years, these mechanisms will decline in usage. 75%
In their place, cities will draw more heavily on philanthropic support, vendor financing, crowdfunding, Public funding & grants from federal, 64%
state, or provinces 48%
and multilateral and development funding. For example, in Asian cities, such as China and Japan,
philanthropy has long been a source of funding for the public good. But the practice is spreading around Funding through user fees/taxes
52%
the world as business leaders embrace the SDGs. 41%
Today, SDG sprinters mostly tap government-based borrowing, private-sector financing, public funding 38%
Crowdfunding from public
and grants, and user fees and taxes. In three years, they will turn more to crowdfunding, government- 60%
based borrowing, private-sector financing, and vendor financing and business models. Public-private 31%
Multilateral & development funding
partnerships likely will be one key means to draw in private-sector financing. 48%
20%
Top funding mechanisms used by sprinters Vendor financing & business models
46%
17%
Today 3 years Privatization of assets
17%
Government-based borrowing 94% Crowdfunding from public 81% 16%
Philanthropic support
Private-sector financing 83% Government-based borrowing 75% 50%
Public funding, grants 61% Private-sector financing 67% Now Three years
Funding through user fees, taxes 61% Vendor financing & business models 64%
Q15: Please select the main financing/funding techniques that your city now uses/will use to achieve your social, environmental, and economic goals. * Roadmap for Financing the 2030 Agenda for Sustainable Development.
BACK Smart City Solutions for a Riskier World 28 NEXTRESEARCH BACKGROUND KEY FINDINGS CHANGING GOALS & PRIORITIES LEVERS OF CHANGE DRIVING RESULTS BY DOMAIN BECOMING A CITY 4.0 SPONSORS & PARTNERS
3. Technology: Placing the right bets
Cities are adopting a wide array of smart technologies, especially cloud, mobile, IoT, biometrics, and AI.
% increase in cities making large investments
Cities 4.0 are moving even faster to leverage advanced technologies: 100% have made hefty investments in cloud and over next 3 years
IoT, and slightly fewer are spending significantly on mobile, biometrics, blockchain, AI, and RPA.
Over the next three years, cities plan to increase investments significantly in digital twins, 3-D printing (off a an
extremely small base), data warehouses, augmented and virtual reality, blockchain, digital dashboards, and drones. 282% 200%
Digital twins 3-D printing
The share of cities making large investments will jump the most for digital twins, from 11% today to 31% in three
years—a rise of almost 300%. For Cities 4.0, the increase in digital twins will be even greater, from 20% today to 70%
149% 147%
in three years. Data warehouse/ AR/VR
lakes
127% 126%
Blockchain Digital
% of cities making large investments today dashboards
100% 95% 100% 95% 95% 126% 124%
90% 90%
Drones, AVs Telematics/
70% 70% 70% geospatial
60% 65% 60%
45% 121% 119%
AI Online
88% 86% 84% collaborative
74% 66% 20%
56% 54% 15% tools
50% 43% 43% 43% 42% 37% 5%
19% 17% 11% 4%
“Smart technology, data, and analytics will need to
be translated into new sustainable economic and
environmental policies. AI and analytics-based
solutions providing real-time and predictive
information will be key alongside having better data
and multiple data sources.”
All cities Cities 4.0 William Baver, Vice President, Smart Platform, NTT
Q16: In which of the following digital technologies and solutions has your city made large investments and in which will you make large investments over the next three years?
BACK Smart City Solutions for a Riskier World 29 NEXTRESEARCH BACKGROUND KEY FINDINGS CHANGING GOALS & PRIORITIES LEVERS OF CHANGE DRIVING RESULTS BY DOMAIN BECOMING A CITY 4.0 SPONSORS & PARTNERS
3. Technology: Cities are getting smarter through AI and the cloud
Sixty-six percent of cities are investing heavily in AI and 80% will do so over the next three Types of AI usage
years. North American (83%) and small cities (74%) lead in AI use. Over the next three years,
European cities (97%) will surpass North American cities (88%) in AI investments.
For cities adopting AI, machine learning and digital assistants/chatbots are table stakes, used by 79% 75% 75%
72% 70%
seven out of ten cities and nearly eight out of 10 sprinters. Computer vision is gaining ground, 63%
while use of deep learning and natural language processing is still relatively nascent. 50%
44%
50%
39%
31% 31%
While nearly every city uses the cloud (88%), how they use it varies. Ninety percent use a public 25% 16% 18%
cloud based in their home country and 82% use a private cloud. One thing is clear: cities prefer
that their data stay within their national borders—only 23% use a public cloud outside of their Digital Machine Computer Deep learning NLP
country and over 60% are not permitted to use a public cloud outside of their country. assistants learning vision
Using one type of cloud is not enough. To achieve their goals, cities need to become omni-cloud, Implementer Advancer Sprinter
combining multiple formations—69% of sprinters use multi-clouds and 81% use hybrid clouds.
Sprinters also prefer to have control. Eighty-nine percent prefer to deploy their smart city Cloud deployments by SDG progress
solutions “on premise” in their own data center and 83% prefer to use a private cloud server.
Public cloud (in
80% 92% 89%
country)
How Philadelphia is using AI to improve the streets
Hybrid cloud 55% 78% 81%
AI has proved useful to Philadelphia as it seeks to improve the quality of its streets. It
partnered with a start-up that provides a low-cost imaging device that takes images every
half second, 30 feet wide, and uses AI and visual ML to assess the quality of the Private cloud 55% 84% 94%
pavements—one of the top complaints of citizens in the city. The project covered 1,200
miles of pavement in three months and led to the development of a five-year pavement Multi-cloud 20% 36% 69%
strategy. Fixing pavements contributes to better social equity, as well. For example, if 10%
public transportation rides on smoother streets, maintenance costs are reduced as is the Public cloud (out of
22% 33%
need to raise transit fares. The partner company also now is training its AI to map manhole country)
locations and street signs. Implementer Advancer Sprinter
Q16, 16a, and 16b: Which of the following technologies has your city made large investments in, and in which will you make large investments over the next three years? What types of AI technologies is your city using? What types of cloud is your
city using to deploy your smart city solutions?
BACK Smart City Solutions for a Riskier World 30 NEXTRESEARCH BACKGROUND KEY FINDINGS CHANGING GOALS & PRIORITIES LEVERS OF CHANGE DRIVING RESULTS BY DOMAIN BECOMING A CITY 4.0 SPONSORS & PARTNERS
4. Data: SDG sprinters leverage diverse data sets
Timely access to data is vital for running today’s cities, according to 40% of urban leaders. That is why they will use multiple types of data in the future.
On average, cities today use six different types of data and in three years they will be using seven. SDG sprinters already use an average of seven types of data, and this will increase
to nine. Administrative, IoT, and citizen usage and satisfaction data are the main types of data used now. While predictive, peer-based, channel-usage, and geospatial data are
tapped less frequently, they are slated for a meteoric rise over the next three years.
Although biometric data was beneficial during the pandemic—particularly in preserving workplace safety—many cities expect to moderate its use in the future. One reason is rising
concerns that biometric surveillance could infringe on civil rights. With resistance growing in the Middle East and North America, use of biometrics is expected to decrease 50% and
23%, respectively, in those regions. Latin America will be the only region to bump up its use of biometrics, by 21%. Governments there see it as a tool to combat terrorism, crime,
and fraud.
There are biometrics use cases that are more acceptable: 43% of citizens across cities have a positive view of facial recognition tools to improve security. Cities in advanced markets
see it more favorably than those in emerging markets.
% having positive view of facial Types of data used today vs. next 3 years
recognition to improve security
Today 3 years
78% 73% 78%
All Advanced Emerging 70% 65%
60% 58% 56% 55% 57% 57%
49% 48% 44% 49% 47% 48%
41% 36% 36%
34% 35%
29% 29% 25% 25% 23% 18%
43% 53% 34%
Q22: Which of the following types of data does your city actively use to support its operations, and which will your city actively use in the next three years?
Q24: What is the general sentiment of citizens regarding the following uses of data and technology, given their perceived benefits and drawbacks?
BACK Smart City Solutions for a Riskier World 31 NEXTYou can also read