HEALTH DATA ADVISORY AND CO-ORDINATION COMMITTEE (HDACC) REPORT 3 - FOR PERIOD 2009-2014 - National Department of Health
←
→
Page content transcription
If your browser does not render page correctly, please read the page content below
HEALTH DATA ADVISORY AND
CO-ORDINATION COMMITTEE
        (HDACC)

        REPORT 3

     FOR PERIOD 2009-2014
Publishing details and suggested citation
Health Data Advisory and Co-ordination Committee (HDACC). Health Data
Advisory and Co-ordination Committee Report 3. Pretoria: National Department of
Health; 2016.
iTable of Contents
Acronyms and abbreviations .......................................................................................... iii
Executive summary ........................................................................................................ vii
1. Introduction ................................................................................................................ 1
2. Outputs 1 and 2: Extending life expectancy and reducing maternal and child
mortality ...................................................................................................................... 6
Life expectancy (1.1) .................................................................................................. 6
Adult mortality (1.2) .................................................................................................... 9
Child mortality (2.1–2.3) ............................................................................................. 9
Maternal mortality ratio (2.4) ..................................................................................... 11
Nutritional status of children (2.5–2.6) ...................................................................... 12
Burden of disease .................................................................................................... 12
Review of indicators and targets............................................................................... 14
Future HDACC activities........................................................................................... 14
3. Output 3: Combating HIV and AIDS and tuberculosis ........................................... 15
Estimated incidence of HIV in women aged 15–49 years (3.1) ................................. 15
Rate of mother-to-child transmission of HIV6. Strengthening health information systems ............................................................ 51
Monitoring and evaluation (M&E) ............................................................................. 51
Civil Registration and Vital Statistics (CRVS) ........................................................... 52
District Health Information System ........................................................................... 53
Disease surveillance and disease registers .............................................................. 56
Patient information systems ..................................................................................... 57
Population-based surveys ........................................................................................ 58
Aligning private sector information systems .............................................................. 59
International and national health statistics ................................................................ 59
7. Conclusions and reflection ..................................................................................... 61
8. References ................................................................................................................ 63
Annexure 1: Members of the Health Data Advisory and Co-ordination
Committee ..................................................................................................... 69
Annexure 2: Terms of Reference of the Health Data Advisory and Co-ordination
Committee ..................................................................................................... 73
Annexure 3: Information for 2014 and 2015 for selected indicators ..................... 76
List of Tables
Table 1: Health sector outputs, indicators, targets, values and data sources (Outputs 1
and 2) ................................................................................................................. 7
Table 2: Comparison of estimates of HIV incidence among women 15–49 years ............ 16
Table 3: Health sector outputs, indicators, targets, values and data sources (Output 3) .. 28
Table 4: Health sector outputs, indicators, targets, values and data sources (Output 4) .. 35
Table 5: Comparison of the health systems effectiveness priorities of the NSDA 2010–
2014 and the MTSF 2014–2019 ....................................................................... 43
Table 6: Health sector inputs, indicators, baseline and data sources (health financing) .. 46
Table 7: WHO 100 Core Indicators by Results Chain ...................................................... 50
Table 8: Percent difference between mid-year estimate (MYE) for 2011 and 2011 Census
estimate by age ................................................... Error! Bookmark not defined.
List of Figures
Figure 1: Estimated causes of death of children under five years, South Africa 2010 ...... 10
Figure 2: Leading causes of years of life lost (YLLs), South Africa 2010 ......................... 13
Figure 3: Age-standardised mortality rate from selected main causes of death, South
Africa 2009–2013.............................................................................................. 13
Figure 4: Median time to treatment of multi-drug-resistant TB patients ............................ 24
Figure 5: Comparison of 2011 Census population and mid-year estimates by age group
............................................................................ Error! Bookmark not defined.
Figure 6: DHIS data completeness by month as at September 2015............................... 53
iiAcronyms and abbreviations
AGSA – Auditor-General of South Africa
AIDS – Acquired Immune Deficiency Syndrome
ANC – Antenatal care
APP – Annual Performance Plan
ART – Antiretroviral therapy
ARV – Antiretrovirals
ASSA – Actuarial Society of South Africa
AZT – Azidothymidine
BAS – Basic Accounting Systems
BHF – Board of Health Care Funders
BMI – Body Mass Index
CARe – Centre for Actuarial Research (University of Cape Town)
CD4 – Cluster of differentiation 4
CI – Confidence interval
CoMMiC – Committee of Mortality and Morbidity in Children
CRVS – Civil Registration and Vital Statistics
DBE – Department of Basic Education
DCST – District Clinical Specialist Teams
DHIS – District Health Information System
DHMIS − District Health and Management Information System
DHA – Department of Home Affairs
DoH – Department of Health
DoJ&CS – Department of Justice and Correctional Services
DPME – Department of Planning, Monitoring and Evaluation
DR-TB – Drug-resistant tuberculosis
EDR.Web – Electronic drug-resistant tuberculosis register
EPP – Estimation and projection package
ETR.Net – Electronic TB register
FACTS – Follow-on African Consortium for Tenofovir Studies
FDC – Fixed-dose combination
FFC – Financial and Fiscal Commission
FY -- Financial year
GDP – Gross Domestic Product
iiiGeneXpert MTB/RIF – Test for Mycobacterium tuberculosis and resistance to
rifampicin
HASA – Hospital Association of South Africa
HDACC – Health Data Advisory and Co-ordination Committee
HEMIS − Higher Education Management Information System
HIV – Human Immunodeficiency Virus
HMIS − Health Management Information System
HST – Health Systems Trust
HSRC – Human Sciences Research Council
HMIS – Health and Management Information System
ICU – Intensive care unit
IHR – International Health Regulations
IMR – Infant mortality rate
INH – Isoniazid
KMC – Kangaroo mother care
LAg-Avidity EIA – Limiting-Antigen Avidity Assay
LiST – Lives Saved Tool
LPA – Line probe assay
MPAT – Management Performance Assessment Tool
M&E – Monitoring and evaluation
MDG – Millennium Development Goals
MDR-TB – Multidrug-resistant tuberculosis
MMC – Medical male circumcision
MMR – Maternal mortality ratio
MPAT – Management Performance Assessment Tool
MTB/RIF – Drug-resistant tuberculosis
MTCT – Mother-to-child transmission of HIV
MTSF – Medium-term Strategic Framework
MYE – Mid-year estimate
NAPHISA – National Public Health Institute of South Africa
NBD – National Burden of Disease [Study]
NCCEMD – National Committee for Confidential Enquiries into Maternal
Deaths
NDoH – National Department of Health
NDP – National Development Plan
NGO – Non-governmental organisation
NHI – National Health Insurance
ivNHIS/SA – National Health Information System of South Africa
NHLS – National Health Laboratory Service
NICD – National Institute for Communicable Diseases
NIDS – National Indicator Data Set
NMR – Neonatal mortality rate
NSDA – Negotiated Service Delivery Agreement
NVP – Nevirapine
OHSC – Office of Health Standards Compliance
OPD – Outpatient Department
PCR – Polymerase chain reaction
PHC – Primary health care
PHC-PIS – Primary Health Care Patient Information Systems
PMTCT – Prevention of mother-to-child transmission of HIV
QRS – Quarterly Reporting Systems
RMS – Rapid Mortality Surveillance (RMS) System
RR-TB – Rifampicin-resistant tuberculosis
SABSSM – South African National HIV Prevalence, Incidence,
Behaviour and Communication Survey
SADHS – South African Demographic and Health Survey
SAMRC – South African Medical Research Council
SANHANES – South African National Health and Nutrition Examination
Survey
SAPMTCTE – South African Evaluation of the Programme to Prevent
Mother-to-Child Transmission of HIV
SDG – Sustainable Development Goals
sdNVP – Syrup-dose nevirapine
Stats SA – Statistics South Africa
TB – Tuberculosis
TIER.Net – Three-tier HIV monitoring information system
U5MR – Under-five mortality rate
UN – United Nations
UNAIDS – Joint United Nations Programme on HIV/AIDS
VOICE – Vaginal + Oral Interventions to Control the Epidemic
VMMC – Voluntary medical male circumcision
VR – Vital Registration
WBPHCOT – Ward-based Primary Health Care Outreach Teams
WHO – World Health Organization
vWITS – University of the Witwatersrand
WRHI – WITS Reproductive Health and HIV Institute
XDR-TB – Extensively drug-resistant tuberculosis
YLLs – Years of life lost
viExecutive summary
Established in 2010 to advise the Minister of Health, the Health Data Advisory and Co-
ordinating Committee (HDACC) focused mainly on identifying high-level indicators to
monitor the health-related outcomes of the Negotiated Service Delivery Agreement
(NSDA) relating to Output 2: A long and healthy life for all South Africans. The committee
reviewed the targets for the high-level indicators, and identified guiding principles for
developing the indicators as well as the data sources for estimating these indicators, and
provided baseline values for 2009 (HDACC, 2011).
The four outputs are:
Output 1: Increasing Life Expectancy
Output 2: Decreasing Maternal and Child Mortality rates
Output 3: Combating HIV and AIDS and Tuberculosis
Output 4: Strengthening Health Systems Effectiveness.
HDACC consolidated data for monitoring the high-level indicators and reported on
progress achieved by 2012/13 since the 2009 baseline in its second report (HDACC,
2014). In the latter, the committee also reported on the further development of a
framework to monitor the performance of health systems and for the first time, reported
information on health systems financing and information gaps.
The current report of HDACC allows for reflection on the progress made on the NSDA
targets over a four-year period, comparing the 2013 data with the baseline from 2009. In
summary, the data show a mixed performance. Compared to the baselines that were set
from 2009 data, there has been very good progress on Outputs 1 and 2 – Extending life
expectancy and reducing maternal and child mortality. The targets set for the five-
year period have all been exceeded. A major contributor to this achievement has been the
extensive roll-out of antiretroviral therapy (ART) and the implementation of the prevention
of mother-to-child HIV transmission (PMTCT) programme. However, other factors such as
pneumococcal and rotavirus immunisation may also have contributed to this. The
Millennium Development Goal (MDG) targets for maternal and child mortality have,
however, not yet been reached, and a lack of baseline data to monitor the nutritional
status of children has made it impossible to assess progress in this regard.
In terms of Output 3: Combating HIV and AIDS and tuberculosis, some of the targets
have been met while others have not. Of major concern is the lack of a clear indication of
a reduction in the incidence of HIV over the period. While achievements have been made
in the provision of treatment, unless the spread of the disease can be halted, the country
viiwill be faced with an ever-growing challenge in health services. In addition, while there
appears to have been some progress in the TB control programme, the high number of TB
drug-resistant cases poses a key threat to TB control.
The performance on Output 4: Strengthening health systems effectiveness has been
mixed, with evidence of some progress, but with few targets being met. It is not clear
whether the targets were unrealistic, whether there were insufficient resources for
implementation, or whether the mechanisms for health systems strengthening have thus
far been inadequate to respond to the complexities of the health system.
Achievements of HDACC include the network of local institutions involved in the
production and use of health data. The committee has advised government on high-level
indicators, baselines and targets for the health outcomes of the NSDA, defined the
relevant domains for measuring these and grappled with the data systems required to
monitor them.
This report reflects on the indicators identified on the Medium-term Strategic Framework
(MTSF) for the period 2014 to 2019, the Department of Health Strategic Plan 2015/16–
2019/20 (NDoH, 2015) and the National Development Plan (NDP) 2030. Progress has
been made on the identification of a comprehensive set of indicators required to monitor
the performance of the health system, but the task has yet to be completed. This will need
to be done with the future-oriented Sustainable Development Goals in mind.
Targets were set for the high-level NSDA indicators. Maintaining the balance between
aspirational and incremental targets was challenging and it would have been ideal to use
stronger methodologies, such as modelling, for setting targets to ensure consistency
between targets, and linking them with planned programmes. Capacity for such an
approach needs to be developed to review the targets set for the MTSF.
The need to strengthen elements of the health information system has been identified, as
has the need for a strategic plan for population-based health surveys. HDACC also found
it challenging to obtain the necessary data to monitor progress on the selected indicators,
and has continually been ‘behind the curve’ with its reporting. Better co-ordination with the
data producers would be helpful as would additional resources to undertake specific
investigations to allow the committee to fulfil its advisory role more fully. It is
recommended that the work of HDACC, and the processes HDACC has to follow in doing
its work, be reviewed with the aim of defining the niche contribution that HDACC can
make including its contribution to the monitoring of the Sustainable Development Goals
(SDGs).
viii1. Introduction
The Health Data Advisory and Co-ordinating Committee (HDACC) was set up by the
Director-General of the Department of Health in 2010 to advise the Minister of Health on
improving the quality and integrity of data used to monitor health outcomes after the
Minister had signed a Negotiated Service Delivery Agreement (NSDA) with the President.
The current membership list is shown in Annexure 1 and the Terms of Reference are
shown in Annexure 2.
In the first year, the committee focused mainly on identifying high-level indicators to monitor
the health-related outcome of the NSDA relating to Output 2: A long and healthy life for all
South Africans. The four outputs are:
Output 1: Increasing life expectancy
Output 2: Decreasing maternal and child mortality rates
Output 3: Combating HIV and AIDS and tuberculosis
Output 4: Strengthening health systems effectiveness.
HDACC agreed on guiding principles for developing the indicators, identified data sources
for estimating these indicators and provided baseline values for 2009. The committee also
attempted to set realistic targets for the high-level indicators and began to consider a
framework to monitor the performance of the health system (HDACC, 2011).
During the second and third years, HDACC consolidated data for monitoring the high-level
indicators and reported on progress achieved by 2012/13 since the 2009 baseline. The
committee further reported on the development of a framework to monitor the performance
of health systems, and for the first time, reported information on health systems financing.
The report also reflected on information gaps (HDACC, 2014).
In this, third report, the committee attempts to review the progress made during the five-
year NSDA period relative to the 2009 baseline. Subsequent to the compilation of
indicators for this report, further data have been reported in NDOH annual reports. For
ease of access, these updates are provided in Annexure 3. It also reflects on the indicators
identified in the Medium-term Strategic Framework (MTSF) for the period 2014 to 2019, the
Department of Health Strategic Plan 2015/16–2019/20 (NDoH, 2015) and the National
Development Plan (NDP) 2030.
Following each electoral cycle, the government of South Africa develops a five-year plan
known as the Medium-term Strategic Framework (MTSF), which is linked to the term of
1office of government, and which outlines in detail the government’s programmes for
delivering on the commitments made during elections. The MTSF 2014–2019 was adopted
by Cabinet in December 2014. The MTSF 2014–2019 is aligned with the country’s macro
plan, the National Development Plan 2030, adopted in 2012.
The government of South Africa has identified 14 priority outcomes, which are embodied in
the NDP together with the key actions and targets to be achieved by 2030. In terms of
health, the NDP envisions a health system that works for everyone and is not out of reach.
The NDP asserts that it is possible by 2030 for South Africa to have:
(a) raised the life expectancy of South Africans to at least 70 years;
(b) ensured a generation of under-20s that is largely free of HIV;
(c) reduced significantly the prevalence of non-communicable disease, and
(d) achieved an infant mortality rate of fewer than 20 deaths per 1 000 live births,
including an under-5 mortality rate of fewer than 30 deaths per 1 000 live births.
To attain this vision, the NDP 2030 sets out nine goals, namely:
(a) Raise the life expectancy of South Africans to at least 70 years
(b) Progressively improve TB prevention and cure
(c) Reduce maternal, infant and child mortality
(d) Significantly reduce the prevalence of non-communicable disease
(e) Reduce injury accidents and violence to 50% of 2010 levels
(f) Complete health systems reforms
(g) Deploy primary health care teams to provide care to families and communities
(h) Provide access to an equal standard of care for everyone, regardless of cost
(i) Fill posts with skilled, committed and competent individuals.
The MSTF 2014–2019 is the first five-year implementation phase of the NDP 2030. It
encompasses 10 key priority areas or sub-outcomes focused on health systems
strengthening and reducing the burden of disease:
Sub-outcome 1: Universal health coverage progressively achieved through
implementation of National Health Insurance
Sub-outcome 2: Improved quality of health care
2Sub-outcome 3: Implement the re-engineering of primary health care
Sub-outcome 4: Reduced health care costs
Sub-outcome 5: Improved human resources for health
Sub-outcome 6: Improved health management and leadership
Sub-outcome 7: Improved health facility planning and infra-structure delivery
Sub-outcome 8: HIV and AIDS and tuberculosis prevented and successfully managed
Sub-outcome 9: Maternal, infant and child mortality reduced
Sub-outcome 10: An efficient Health Management Information System developed and
implemented for improved decision-making.
The MTSF has identified nine high-level impact indicators and outlines 2019 targets:
(The 2019 target for the U5MR is incorrectly specified as 23 rather than 33 per 1,000 live births).
Source: The Presidency, 2014
Through the Programme of Action (POA) progress reports, the Presidency monitors the
implementation of the MTSF 2014–2019 on a quarterly basis. The National Department of
Health has aligned its Annual Performance Plans and its Strategic Plan 2015–2020 with the
NDP 2030, as shown in the following extract from the Annual Performance Plan (APP).
3Extract: NDoH, 2015
In the context of evolving policies, HDACC continues to aim to provide guidance on high-
level indicators for Outcome 2: A long and healthy life for all South Africans. Non-
communicable diseases, injuries and nutrition have been added to the health and
development policy agenda and should be included in HDACC’s measurement activities.
At the global level, 2015 marked the final year of the Millennium Development Goals
(MDGs) era. The MDGs have served to focus attention on eight goals and 21 targets with
48 indicators. Health played a dominant role in this vision of development, accounting for
three of the goals and reflecting the prevailing consensus that health and education were
critical drivers of a country’s progress. It is clear that the MDGs enabled the galvanisation
of concerted actions and consequently progress was accelerated in many settings.
However, there is agreement that there is still a need to commit to the full realisation of
MDGs, particularly in low-income countries.
4Extensive consultations to define the post-2015 development agenda culminated in the UN
Sustainable Development Summit held from 25 to 27 September 2015 and the adoption of
17 Sustainable Development Goals (SDGs) by the UN General Assembly (United Nations,
2015). These aim to guide development in the next 15 years and seek to realise the human
rights of all. The SDGs look more broadly at sustainability and improving quality of life and
aim to balance the three dimensions of sustainable development: the economic, social and
environmental. A total of 169 targets to be met by the 2030 have been adopted.
The third goal, to ensure healthy lives and promote well-being for all at all ages, is
focused directly on health, but the other goals embrace many issues that will impact on
health. The health goal includes 13 sub-goals which embed the completion of the MDGs,
ensure universal access to health care and address adult health concerns beyond
HIV/AIDS, TB and malaria as well as reproductive health and environmental health. The
inter-linkages and integrated nature of the SDGs form an important aspect of the new
agenda, as does the recognition of importance of reducing inequalities.
The UN declaration notes that national ownership is key to achieving sustainable
development and the foundational role of the national-level review processes and country
statistics. The indicators to monitor the SDGs are expected to be finalised early in 2016.
HDACC will need to assess the global indicators and advise on the processes for
monitoring them.
52. Outputs 1 and 2: Extending life expectancy and reducing
maternal and child mortality
High-level indicators related to life expectancy and maternal and child mortality for Outputs
1 and 2 have been updated in Table 1. Most of the estimates come from the Rapid
Mortality Surveillance (RMS) report for 2013 based on deaths from the National Population
Register, adjusted for under-registration of deaths as well as the proportion of the
population who are not on the population National Population Register. Until 2011, the
reports of RMS indicators were calculated using the Actuarial Society of South Africa’s
2008 (ASSA2008) population estimates. Analysis of the 2011 Census revealed higher
levels of in-migration and a different trend in fertility than had been allowed for in the
ASSA2008 population estimates, and thus the indicators were subsequently revised using
a set of mid-year estimates consistent with the migration reported by, and age distribution
observed of, the 2011 Census (Dorrington, 2013). It was therefore necessary to revise the
actual 2014 target value to ensure consistency with the series. Although there are other
estimates for these indicators, it was considered that the method adopted in the RMS
report best satistifed the critiera identified by HDACC for producing a suitable consistent
series for monitoring progress (HDACC, 2011).
It can be seen from Table 1 that there have been steady improvements in mortality in South
Africa, with the 2014 targets achieved for all the indicators.
Life expectancy (1.1)
Estimates for 2013 show that the average life expectancy in South Africa has reached 62
years, an increase of five and eight years since the baseline in 2009 and the low in 2005,
respectively. The improvement has occurred for both males and females but is still
somewhat short of the estimated global average of 71 years (WHO, 2015). The increase in
life expectancy is due to a drop in the levels of child as well as adult mortality.
6Table 1: Health sector outputs, indicators, targets, values and data sources (Outputs 1 and 2)
BASELINE SOURCE OF
OUTPUT INDICATOR TARGET 2014 2010 2011 2012 2013
2009 DATA
1.INCREASING LIFE EXPECTANCY
1.1 Life expectancy 59.1 57.1 58.5 60.5 61.2 62.2 Rapid Mortality
at birth Surveillance
Report
Male 56.6 Male 54.6 Male 56.0 Male 57.8 Male 58.5 Male 59.4
Female 61.7 Female 59.7 Female 61.2 Female 63.2 Female 64.0 Female 65.1
(an increase of 2
years)
1.2 Adult mortality 43% 46% 43% 40% 38% 36% Rapid Mortality
(45q15) Surveillance
Report
Male 48% Male 51% Male 48% Male 46% Male 44% Male 42%
Female 37% Female 40% Female 38% Female 35% Female 32% Female 30%
(10% reduction)
2. DECREASING MATERNAL AND CHILD MORTALITY
2.1 Under-five 50 per 1 000 live 56 per 1 000 52 per 1 000 40 per 1 000 41 per 1 000 41 per 1 000
mortality rate (U5MR) births live births live births live births live births live births
(10% reduction) Rapid Mortality
Surveillance
Report.
7BASELINE SOURCE OF
OUTPUT INDICATOR TARGET 2014 2010 2011 2012 2013
2009 DATA
2.2 Infant mortality 35 per 1 000 live 39 per 1 000 35 per 1 000 28 per 1 000 27 per 1 000 29 per 1 000
rate births live births live births live births live births live births
(10% reduction)
2.3 Neonatal 12 per 1 000 live 14 per 1 000 13 per 1 000 13 per 1 000 11 per 1 000 11 per 1 000 Rapid Mortality
mortality rate (Adult mortality (1.2)
The adult mortality rate (45q15) has decreased from 46% in 2009 to 36% in 2013 with similar
decreases for males and females. Thus the NSDA target of 43% by 2014 was already
exceeded by 2011. The provision of ART is probably the main contributor to this
improvement. The adult mortality rate for males is somewhat higher than that for females
(42% vs. 30%). These rates are much higher than the global average adult mortality rates
which are estimated to be 19% for males and 13% for females (WHO, 2015).
Child mortality (2.1–2.3)
Although the infant and under-five mortality rates in South Africa are lower than the global
average (29.0 vs. of 33.6 infant deaths per 1 000 live births and 41.0 vs. 45.6 under-five
deaths per 1 000 live births), compared to the levels in 2011 the infant and under-five
mortality rates in South Africa have stagnated. In contrast, neonatal mortality rates have
continued a very gradual improvement since 2009 and are now at 11 per 1 000 live births.
Although there is some uncertainty as to the exact level of the neonatal mortality, at current
levels of infant mortality, it is unlikely to be much above 15, somewhat lower than the global
average estimated by WHO at 20 neonatal deaths per 1 000 live births (WHO, 2015).
The National Population Register does not include information about the cause of death
(other than a crude division between natural and non-natural deaths). Annual cause-of-
death statistics are compiled by Stats SA based on death notifications incorporating a
medical certificate on the cause of death (Stats SA, 2014). In 2013, a total of 35 094 under-
five deaths were registered, a drop from 52 010 in 2009. However, about 14% of the under-
five deaths were ascribed to ill-defined natural causes, with 13% in 2009 and 15% in 2013.
Furthermore, not all deaths are registered and HIV deaths are under-reported. The 2nd
National Burden of Disease Study used the cause-of-death data from Stats SA but made
adjustments for under-registration of deaths and the misclassification of causes to provide
estimates of the causes of death (Pillay-van Wyk et al., 2014). National estimates of the
causes of death of children under-five years (Figure 1) show that HIV/AIDS accounted for
28% of the under-five deaths (Msemburi et al., 2014). Neonatal conditions accounted for
23% of the deaths in 2010. Complications from pre-term birth, birth asphyxia and severe
infections were the three main causes of death in this age group. Diarrhoeal diseases
accounted for 18% and lower respiratory infections (pneumonia) accounted for 11%. The
childhood deaths are often aggravated by malnutrition and a high proportion of the deaths
are preventable.
9Figure 1:: Estimated causes of death of children under five years, South Africa 2010
Source: 2nd National Burden of Disease Study
Based on the analysis of Saving Babies 2010–2011
2010 data on perinatal deaths, Lloyd and de
Witt (2013) discuss the opportunities for reducing neonatal mortality in South Africa. They
raise the possibility that some regions may have insufficient neonatal intensive
sive care unit
(ICU) beds or inadequate referral systems and problematic transport systems. They
highlight that simple preventative measures including training healthcare providers on
resuscitation, promoting breastfeeding and Kangaroo mother care (KMC) programmes, and
the use of polyethylene wrappings for neonatesthe need to improve quality of care through the District Clinical Specialist Teams to improve
clinical governance, clinical supervision, response to local audit finding, and leadership
functions.
The 2nd triennial report of the Committee on Morbidity and Morbidity of Children Under-5
years (CoMMiC, 2014) has focused on issues of access to health care. They urge that work
on the Essential Package of Care be completed, emphasise that Ward-based Outreach
Teams should ensure health promotion and disease prevention activities, and highlighted
the need for capacitation of healthcare workers. They draw attention to the importance of
early childhood development and the first 1 000 days of life, and recommend that the Road-
to-Health booklet be used as the health record for each child. They also call for the
introduction of standard data sets for children for monitoring, evaluation and feedback.
Maternal mortality ratio (2.4)
From Table 1, it can be seen that the maternal mortality ratio peaked in 2009 (302 per
100 000 live births), whereafter it declined substantially to 166 per 100 000 live births in
2012 – a level below the NSDA target. According to the Saving Mothers Report 2010–
2013, the institutional maternal mortality ratio (iMMR) decreased from 176 per 100 000 live
births in 2008–2010 to an iMMR of 154 per 100 000 live births in 2011–2013 (NCCEMD,
2014). Tracking the causes of maternal death in the 2nd National Burden of Disease Study,
it was observed that there was a substantial increase in the number of indirect maternal
deaths, which began in 2003 and peaked in 2008. The Saving Mothers Report noted that
there was a significant reduction in deaths due to complications of antiretroviral therapy.
The NCCEMD emphasises the need for knowledgeable and skilled healthcare providers,
appropriately resourced and accessible healthcare facilities (including equipment and
human resources) as well as rapid inter-facility emergency transport systems to further
reduce maternal mortality.
Modelling the impact of effective interventions using the Lives Saved Tool (LiST) has
clearly demonstrated the potential for saving the lives of mothers, newborns and children.
At the height of the AIDS epidemic, the work by Chopra et al. (2009) emphasised the
impact of prevention of mothe- to-child transmission of HIV. More recently, Chola and
colleagues (2015a) have demonstrated that a suite of 15 interventions would have a major
impact on further reducing maternal deaths and child mortality, including diarrhoea (2015b).
Using a complementary Family Planning module (FamPlan) in Spectrum, Michelow et al.
(2015) have demonstrated the additional impact of these interventions on reducing the loss
from stillbirths, highlighting a substantial return on investment. The authors note that family
planning should also be prioritised to reduce mortality and overall costs.
11Nutritional status of children (2.5–2.6)
While there are no additional data for monitoring trends in childhood under-nutrition, a
diagnostic and implementation evaluation of government-driven nutrition programmes
targeting children under five years was undertaken by the Department of Health, the
Department of Programme Monitoring and Evaluation and the Department of Social
Development (DOH, DPME, DSD, 2014). The evaluation has stressed the importance of
malnutrition in childhood as it results in continued ill health, poor cognitive abilities and
reduced productivity into adulthood. It pointed out that the most critical time for nutrition is
the first 1 000 days of life – between conception and a child’s second birthday. The high
levels of stunting are creating a debilitating and intergenerational problem for South Africa
in terms of longevity, educational outcomes and productivity of people, and its related
contribution to economic growth. Furthermore, SANHANES-1 has revealed that there is
also a growing obesity problem in children aged two to five years, with 18.9% of girls being
overweight and 4.9% obese, and 17.5% of boys being overweight and 4.4% obese
(Shisana et al., 2014). The diagnostics and implementation evaluation (DOH, DPME, DSD,
2014) has identified the need for stronger co-ordination of programmes to address nutrition.
They recommend that a National Nutrition Plan be developed and that a Nutrition Council
be established.
Burden of disease
To improve life expectancy further, it is important to know the major causes of death and
the changes that are under way. The 2nd National Burden of Disease Study has estimated
trends in cause of death after adjusting for under-registration and misclassification of cause
(Pillay-van Wyk et al., 2014). Estimates show that in 2010, HIV/AIDS remained the leading
single cause of death and accounted for 42% of premature mortality measured as years of
life lost (YLLs). The top 10 causes of premature mortality are shown in Figure 2. While
HIV/AIDS dominates the loss of life experienced in 2010, there was a wide range of
conditions contributing to premature mortality. In addition to HIV/AIDS and TB, these
feature non-communicable diseases such as cerebrovascular disease, ischaemic heart
disease, hypertensive heart disease and diabetes mellitus, other infectious diseases such
as lower respiratory infections and diarrhoeal diseases, and injuries arising from
interpersonal violence and road traffic collisions.
It would be ideal for the National Burden of Disease (NBD) study approach to be applied
routinely with annual updates on the estimated cause of death profile. In the meanwhile,
unit record cause of death data from Stats SA have been used by the Department of Health
to track more recent trends of major cause groupings (Figure 3). These include major
infectious diseases (HIV/AIDS, TB, pneumonia and diarrhoea), cardiovascular conditions
12together with diabetes, cancers, chronic respiratory diseases
diseases, and injuries. Mortality rates
reported in the Annual Health Statistics (2015) are calculated using mid-year
year population
estimates produced by Dorringt
Dorrington (2013) and age-standardised to the World Health
Organization (WHO) world standard (Ahmad et al
al., 2001).
Figure 2:: Leading causes of years of life lost (YLLs), South Africa 2010
Source: 2nd National Burden of Disease Study
Figure 3: Age-standardised
standardised mortality rate from selected main causes of death, South
Africa 2009–2013
Source: Annual Health Statistics,
Statistic 2015
13Review of indicators and targets
It is clear that the high-level indicators identified for the NSDA are relevant for the MSTF
2014–2019 and should not change. However, indicators related to non-communicable
diseases and injuries need to be developed.
More challenging has been the setting of appropriate targets. It is important to identify
motivational (aspirational) yet achievable targets, as these can help focus programmes and
service delivery to achieve the best possible outcomes. Without a full intervention model to
quantify the impact of potential interventions, it has been difficult to set such targets. At the
beginning of the NSDA period, HDACC made use of the ASSA2008 model to temper the
original NSDA targets. This model underestimated the extent of the provision of
antiretroviral drugs (ARVs) and its use clearly erred on the side of caution. Until
comprehensive impact models (preferably coupled with costing) are developed and
applied, setting of targets will remain challenging. Nonetheless, information about the
recent trends, as well as work done using the LiST model for interventions on maternal and
child health and on the Thembisa model for HIV-related interventions, are helpful in
reviewing proposed targets. These insights have already been incorporated in the MSTF
targets.
Future HDACC activities
Government’s strategic initiative to improve Civil Registration and Vital Statistics (CRVS) is
noted. In the meanwhile, there is a need to benchmark the indicators. The forthcoming
Demographic and Health Survey will be of great use in evaluating the estimates of the
neonatal, infant and under-five mortality rates as well as the maternal mortality ratio. The
survey will also provide information on the nutritional status of children.
Population estimates are essential to provide the denominator for the calculation of these
indicators. The implications of the 2011 Census on population estimates needs to be fully
reviewed. A further issue that should be addressed by HDACC is identifying the best
methodology for estimating these indicators at the sub-national level. This is particularly
important as national averages mask some of the inequities experienced in South Africa.
There is a need to investigate the cause-of-death data. In recent years, there has been an
impressive improvement in the turnaround time for production of the cause-of-death reports
with, for example, the 2013 deaths being reported before the end of 2014. However, there
are some concerns that the completeness of reporting/processing of the Vital Registration
(VR) data since 2011 may have declined. This needs to be investigated as part of the
strategic initiative to improve CRVS.
143. Output 3: Combating HIV and AIDS and tuberculosis
In the 2nd HDACC report it was noted that considerable progress had been made with the
implementation of the National Strategic Plan (NSP) for HIV, STIs and TB 2012–2016
(NDoH, 2011) and the extensive roll-out of ART. The challenge of monitoring the incidence
of HIV – a key indicator needed to track progress in prevention – was highlighted, as were
concerns about the TB control programme and the data used to monitor it. In addition to
incidence of HIV, HDACC identified strengthening the PMTCT programme as an important
strategy to be monitored. The transmission of HIV from mother to child was identified as the
key impact indicator and the proportion of HIV-positive pregnant women initiated on ART
was identified as a strategic indicator of an intervention that would have significant impact
on child and maternal mortality. In terms of TB, HDACC identified two indicators focused on
outcomes of the TB control programme, an indicator focused on the management of drug-
resistant TB (DR-TB), and a final indicator to track the management of HIV/TB co-infection.
Table 3 provides an update of the indicators for monitoring Output 3 of the NSDA for the
period 2009–2013. Data issues as well as additional indicators for future monitoring are
discussed. Given the severity of the impact of drug-resistant TB, it is suggested that the
success rate for DR-TB as well as the primary defaulter rate be considered for future
monitoring.
Estimated incidence of HIV in women aged 15–49 years (3.1)
HDACC recommended that the incidence of HIV be tracked on an annual basis by a
calculation based on prevalence results obtained from the antenatal HIV prevalence survey
of pregnant women adjusted to represent the population of all women aged 15–49 years.
This was to be done by making use of the fact that the survey in one year represented
cohorts of women who were a year older than they were in the preceding survey, as well as
allowing for the fact that the survey covers a selected population. The major weakness of
any method used to produce these estimates is the need to estimate the adjustment
needed to convert the antenatal survey prevalence to a prevalence of all women aged 15–
49 years. The method used to produce the results in the previous report fitted a trend line
to adjustment factors estimated using results from the household prevalence surveys in
2005 and 2008. After the release of the prevalence results from the the 2012 South African
National HIV Prevalence, Incidence, Behaviour and Communication Survey (SABSSM IV)
(Shisana et al., 2014), it was apparent that the method HDACC was using to estimate
incidence on an annual basis was quite inaccurate, mainly because of inaccuracy in
extrapolating the pregnant women to all women bias beyond the most recent household
prevalence survey.
15After much investigation, it was decided rather to determine the adjustment by estimating
the expected age-specific bias in antenatal estimates from the Thembisa model (Johnson,
2014) in 2016, assuming that the biases in each of the years between 2012 and 2016
followed a linear trend between the bias estimated from the 2012 HSRC survey and that
estimated by the model for 2016. In addition, since projecting bias for prevalence rates at
both the start and the end of the year contributes to variability of the estimates of incidence,
the method was changed to a ‘variable-r’ approach (Timæus, unpublished) which requires
only one series of projected bias rather than projections of the bias of the antenatal survey
prevalence for both of the 15–49 (at the start of the year) and 16–50 (at the end of the year)
age groups.
While high incidence rates have been observed in selected populations (e.g., ARV for
prevention studies among young women: VOICE, FACTS), national estimates are lower.
The SABSSM survey measured the HIV incidence in 2012 using the newly developed
Limiting-Antigen Avidity Assay (LAg-Avidity EIA) and estimated it to be 2.28% (95% CI:
1.84%–2.74%), higher than the HDACC estimate for that year derived from the national
antenatal survey.1 Incidence has been estimated from prevalence data using a synthetic
cohort method (Rehle et al., 2010). Rehle et al. (2015) conducted a critical appraisal of
different estimates of HIV incidence and found that assay-based estimates produced
slightly higher estimates than did the model-based estimates (Table 2).
Table 2: Comparison of estimates of HIV incidence among women 15–49 years
Source Method Period HIV Incidence
Women 15–49 years
HDACC Variable-r for cohort 2008/10 2.1%
calculation on adjusted 2012/13 1.2%
antenatal survey
HSRC Lag avidity/ 2012 2.38% (1.84%-2.74%)
ARV testing/VL testing
Synthetic cohort 2008–12 2.10% (1.0%-3.4%)
Thembisa Mathematical model 2011/12 1.88% (1.48%-2.28%)
EPP/Spectrum Mathematical model 2011/12 1.78% (1.67%-1.90%)
Source: Adapted from Rehle et al., 2015
1
As cautioned in previous reports, the interval of uncertainty about the estimate for a single year is
very large and thus one should not read too much into such comparisons.
16The evidence about trends in incidence during this period is mixed. Using the ‘variable-r’ approach to estimate annual incidence, there is substantial year-on-year variation and no clear indication of a downward trend in the incidence of HIV among women aged 15–49 years during this period. Examination of the data by smaller age divisions (which are not reported as indicators because the uncertainty is larger due to the smaller numbers) suggests that incidence appears to have declined slightly over the period in the 15–29-year age group. While a declining trend in the incidence is estimated by the models – Thembisa estimates the drop from 2.19% (1.70%–2.67%) in 2008/09 to 1.88% (1.48%–2.28%) in 2011/12, and EPP/Spectrum estimates the drop from 2.15% (2.06%–2.26%) in 2008/09 to 1.78% (1.67%–1.90%) – the confidence intervals are wide enough to allow for the possibility that there has been limited or no decline and the assay-based approach used in the SABSSM surveys, showed no change in the incidence among women aged 15–49 years (Rehle et al., 2015). The lack of a clear downward trend in the incidence is a matter of significant concern and indicates that prevention efforts need to be strengthened. Rate of mother-to-child transmission of HIV
An additional indicator being considered by HDACC is the proportion of HIV-positive
children enrolled into treatment programmes, as current informal estimates suggest that a
high proportion of these children are being missed. In the previous HDACC report,
concerns were raised that HIV-infected infants are lost to care prior to initiation of ART.
Going forward, infant HIV testing will be conducted at birth to ensure that infants who have
acquired HIV through mother-to-child transmission are identified early and initiated on ART
early. A second infant HIV PCR test is conducted at 10 weeks, reducing the risk of false-
negative tests, as most infants will on be on combination ART HIV prophylaxis.

Proportion of eligible HIV-positive pregnant women initiated on ART (3.3b)
The 2010 SAPMTCT guidelines followed the WHO PMTCT Option A and recommended
(for all HIV-positive pregnant women) maternal AZT prophylaxis from 14 weeks’ gestation
with sdNVP in labour and a stat dose of Truvada® (Tenofovir and Emtracitabine)
immediately post-delivery or ART (if CD4 ≤350 cells/μl or Stage III/IV disease) (NDoH,
2010). All infants received NVP for six weeks if not breastfeeding or until one week
following cessation of breastfeeding. The 2013 SAPMTCT guidelines (WHO PMTCT Option
B) recommended immediate initiation of fixed-dose combination (FDC) ARVs for all newly
diagnosed HIV-positive pregnant women, regardless of their cluster differentiation 4 (CD4)
cell count. Life-long treatment is to be continued if CD4≤350 cells/μl or stage 3–4 disease
are noted. If CD4>350 cells/μl are observed, FDC is stopped one week after breastfeeding
stops. All infants received six weeks NVP (NDoH, 2013a).

The calculation of the indicator to monitor the provision of ART to eligible HIV-positive
pregnant women was revised in the previous HDACC report, as the original indicator did
not capture the required information correctly and and rose to exceed 100%. The proposed
indicator is based on the number of antenatal clients initiated on ART divided by the
estimated number who would be eligible, irrespective of the CD4 guideline. The indicator
has been calculated as the total deliveries (including the births that occurred before arrival)
less the estimated number of women on ART at first visit. The denominator has been
calculated as the total deliveries (including the births that occurred before arrival) multiplied
by the prevalence of pregnant women attending an antenatal clinic for the first visit, less the
estimated number of women on ART at first visit2.

The 2009 baseline proportion of HIV-positive pregnant women initiated on ART was
estimated to be 10% and the target was set at 80%. There was a steady increase in the

2
  The number of women on ART at first visit is currently not reported by the DHIS and thus was
estimated as the number of HIV-positive clients less the number of antenatal clients known to be
HIV-positive but not on ART, the antenatal client HIV 1st test positive and the antenatal client HIV re-
test positive. It has been recommened that the number be captured by the DHIS in future.

                                                  18
proportion to 27% in 2012 and a substantial increase in 2013 with the proportion reaching 68%, following the decision to provide ART to all pregnant women. (As of April 2013, all HIV-positive pregnant women qualify to receive ART; prior to that only pregnant women with CD4
reducing the spread of HIV. Njeuhmeli et al. (2011) estimated the impact and cost of
scaling up adult MMC for 13 countries, including South Africa. This study suggested that
rapid scale-up of voluntary MMC (VMMC) would lead to a substantial reduction in HIV
infections and lower health system costs through averted HIV care costs.

The roll-out of such a programme faces multiple logistical challenges, cultural barriers and
public health messaging challenges. Evaluation of a programme in KwaZulu-Natal over the
period 2010–2013 demonstrated the successful implementation of voluntary medical male
circumcision (Wynn et al., 2015). However, the uptake was lower than had been projected,
highlighting challenges around recruitment, transportation and co-ordination of a
population-based initiative. Another study based in three facilities in KwaZulu-Natal
revealed high attrition rates over time and suggested that the intensive three-visit post-
operative review practice may not be feasible (Phili et al., 2014). A qualitative study based
on focus-group discussions with men in rural KwaZulu-Natal found that VMMC is linked to
perceptions of masculinity and male gender identity including sexual health, sexual
performance and pleasure, possible risk compensation and self-identity (Humphries et al.,
2015). Furthermore, focus-group discussions in the Western Cape have identified the risk
that men may begin sex before complete healing has occurred and the researchers stress
the importance of counselling strategies for the VMMC post-operative period (Toefy et al.,
2015).

TB treatment and default (3.6–3.7)
Patient data pertaining to the drug-sensitive TB treatment programme is collected at
treatment sites using paper-based TB registers, and collated into the electronic TB register
(ETR.Net) at sub-district or district level and then summarised nationally. Indicators on
treatment outcomes for cohorts of patients who enter the treatment programme are
reported quarterly from the ETR.Net.

Although the information system is well established, concerns about the integrity of the
ETR.Net data have been raised and discrepancies exist not only between the paper-based
and electronic registers but also between the levels of ETR.Net from the initial to the final
National ETR.Net database. An evaluation undertaken in 2009 showed that agreement on
the HIV status of TB patients between the data sources was particularly poor (Podewils et
al., 2015). More recent analysis suggests that the TB notifications (i.e. the number of cases
registered for the start of treatment on ETR.Net) remain lower than microbiologically
confirmed cases of pulmonary TB diagnosed by the NHLS (Nanoo et al., 2015), reflecting
the initial loss to follow-up. However, the downward trend in notifications and
microbiologically confirmed cases is similar.

                                                20
Despite the shortcomings in the routine information, ETR.Net data reveal the proportion of all TB cases who were recorded to have successfully completed their treatment has continued to increase from 71.4% in 2009 to 76.1% in 2013. However, it is considerably lower than the target of 85%. There has been no improvement in the recorded secondary loss to follow-up (default) rate which stands at 6.7% for 2013. Increased community involvement and the introduction of Ward-based PHC Outreach Teams (WBPHCOT) (which were not functional during this reporting period) to trace those people lost to follow- up, should enable the target of
Review of the ETR.Net reveals poor correspondence between HIV data management
systems, and likely under-reporting of this indicator by ETR.Net. Patient management
registers and electronic databases for TB and HIV are still separate, adding to the difficulty
in measuring this indicator accurately. A single data system or linkage of the separate
systems with a unique patient identifier is essential if accurate data are to be obtained for
HIV/TB co-infected patients. Despite the challenges with interpreting the trend shown by
this indicator, the available data suggests that there has been a steady and continued
increase in the number of HIV/TB co-infected patients who are being initiated on ART prior
to completion of their tuberculosis treatment (Massyn et al., 2015).

From both the TB notification and the NHLS laboratory data it appears that TB numbers in
South Africa peaked in 2008 and continue to show a downward trend; this has been
associated with increased ART access, and the earlier introduction of ART at higher CD4
cell counts should increase this downward trend (Nanoo et al., 2015).

Naidoo et al. (2013) have highlighted the role of social factors in adherence to TB drugs
and ART. They found that poverty, having one or more co-morbid health conditions, being
at high risk for alcohol misuse and having a partner who is HIV-positive were predictors of
non-adherence. Their study also found that tobacco use was an additional predictor for
non-adherence to anti-TB drugs. Despite free TB diagnosis and treatment, TB patients
incur substantial costs related to their disease and those who are poor are pushed further
into poverty. Consideration should be given to providing social support and financial
protection for these patients to decrease default rates and improve treatment outcomes
(Foster et al., 2015).

MDR-TB patients on treatment (3.9)
The proportion of MDR-TB patients who were enrolled on treatment has increased from
45.7% in 2009 to 75.4% in 2013. However, the data for this indicator have been erratic from
year to year, reflecting data quality issues as well as raising concerns about the
development of further drug resistance. Multidrug-resistant TB (MDR-TB) is defined as
resistance to the both INH and rifampicin, while extensively drug-resistant TB (XDR-TB) is
defined as resistance to INH, rifampicin, second-line injectables and quinolones. With
increasing resistance, there is a worsening of prognosis. Non-adherence to therapy in an
individual is the original cause of the development of resistance in TB and this is termed
‘acquired resistance’. However, resistant organisms can be transmitted and there is
evidence that the proportion of transmitted cases is on the increase. In an elegant study
presented at the Conference for Retroviruses and Opportunistic Infections in February

                                             22
2015, Shah and colleagues showed that 79% of cases of XDR-TB diagnosed from August
2011 to November 2014 in KwaZulu-Natal were transmitted. Studies conducted in the
Western Cape suggest that XDR-TB was acquired following the transmission of MDR-TB
(Streicher et al, 2015).
The treatment of MDR-TB requires a minimum of 18 months of at least five medications
and includes a six-month period of intramuscular injections. Outcomes are measured after
24 to 36 months and in most provinces, successful outcomes occur in fewer than 50% of
cases. Rapid tests to identify drug susceptibility are paramount.
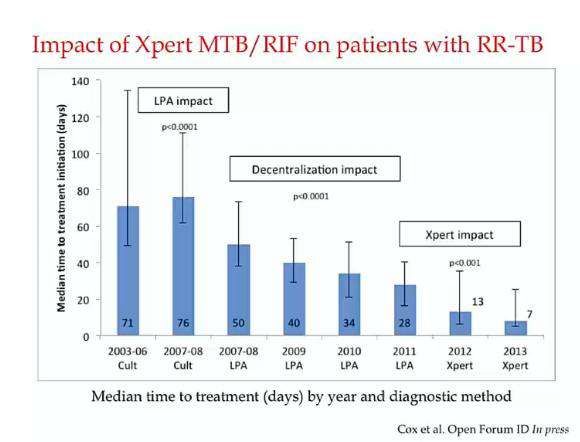
There have been two recent significant changes in the approach to the treatment of MDR-
TB. In August 2011, the NDoH published the Policy Framework on Decentralised and
Deinstitutionalised Management for South Africa.” The previous NDoH policy dictated that
all laboratory diagnosed MDR- and XDR-TB patients be hospitalised in centralised MDR-
and XDR-TB units until they had two consecutive negative TB cultures taken at least 30
days apart. Consequently, patients were hospitalised for many months and there were
waiting lists for patients needing to be admitted to the centralised units. This delayed the
initiation of treatment in some provinces for three or four months. In addition, several
patients died before starting treatment. The rationale behind the framework was to provide
treatment for some drug-resistant TB patients closer to their homes as outpatients.
The second significant change has been the method of diagnosis of MDR-TB. The
GeneXpert MTB/RIF is a novel molecular test for TB. It was recommended as an initial TB
diagnostic by the WHO for countries with high HIV prevalence and rifampicin-resistant TB,
This recommendation was adopted by the South African NDoH in March 2011, and
complete coverage was achieved by the end of 2013. Over 5 million GeneXpert MTB/RIF
diagnostic tests have been performed in South Africa. Prior to 2011, the diagnosis of
resistance was made on culture of the mycobacterium tuberculosis. The turnaround time
for culture-based resistance tests is six weeks, resulting in a delay in starting appropriate
therapy and possible ongoing transmission. This compares to a turnaround time of 48
hours with the GeneXpert MTB/RIF. With the improved more rapid diagnosis of rifampicin-
resistant TB, more cases are being detected and the time to treatment initiation is
decreasing, as is shown by data from Khayelitsha (Figure 4).
23You can also read


