CAVISAP: CONTEXT-AWARE VISUALIZATION OF AIR POLLUTION WITH IOT PLATFORMS - Nurgazy Meruyert
←
→
Page content transcription
If your browser does not render page correctly, please read the page content below

CAVISAP: CONTEXT-AWARE
    VISUALIZATION OF AIR
POLLUTION WITH IOT PLATFORMS

                      Nurgazy Meruyert

      Computer Science and Engineering, master's level
                           2019

                     Luleå University of Technology
      Department of Computer Science, Electrical and Space Engineering
This thesis is prepared as part of a European Erasmus Mundus programme
        PERCCOM - Pervasive Computing & COMmunications for sustainable
                                       development.

This thesis has been accepted by partner institutions of the consortium (cf. UDL-DAJ,
no1524, 2012 PERCCOM agreement).

Successful defence of this thesis is obligatory for graduation with the following national
diplomas:

   •    Master in Complex Systems Engineering (University of Lorraine)
   •    Master of Science in Technology (LUT University)
   •    Master in Pervasive Computing and Communications for Sustainable Development
        (Luleå University of Technology)
ABSTRACT

LUT University
School of Engineering Science
Erasmus Mundus Master’s Program in Pervasive Computing & Communications for
Sustainable Development (PERCCOM)

Meruyert Nurgazy

CAVISAP: Context-aware visualization of air pollution with IoT platforms
Master’s Thesis

2019

95 pages, 31 figures, 22 tables, 1 appendix

Examiners:     Professor Eric Rondeau (University of Lorraine)
               Professor Jari Porras (LUT University)
               Associate Professor Karl Andersson (Luleå University of Technology)

Keywords: context-aware, data visualization, air pollution, Internet of Things

Air pollution is a severe issue in many big cities due to population growth and the rapid
development of the economy and industry. This leads to the proliferating need to monitor
urban air quality to avoid personal exposure and to make savvy decisions on managing the
environment. In the last decades, the Internet of Things (IoT) is increasingly being applied
to environmental challenges, including air quality monitoring and visualization. In this
thesis, we present CAVisAP, a context-aware system for outdoor air pollution visualization
with IoT platforms. The system aims to provide context-aware visualization of three air
pollutants such as nitrogen dioxide (NO2), ozone (O3) and particulate matter (PM2.5) in
Melbourne, Australia and Skellefteå, Sweden. In addition to the primary context as
location and time, CAVisAP takes into account users’ pollutant sensitivity levels and
colour vision impairments to provide personalized pollution maps and pollution-based
route planning. Experiments are conducted to validate the system and results are discussed.

                                     ii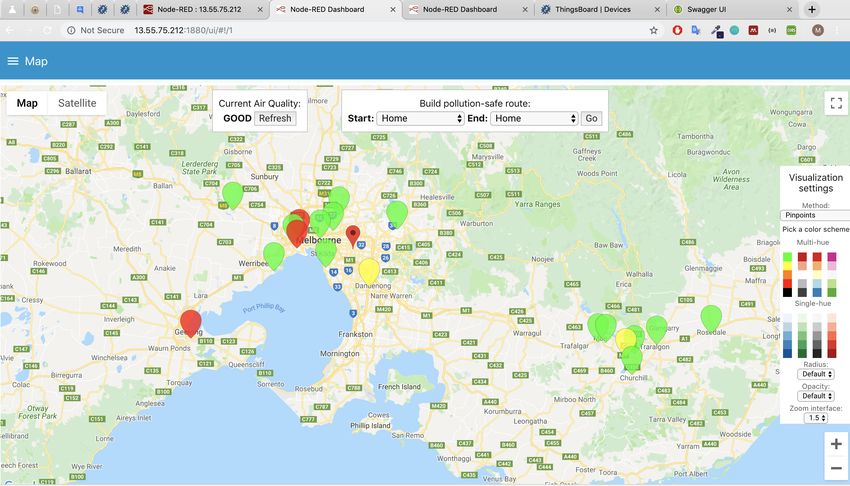
ACKNOWLEDGEMENTS

I would like to thank PERCCOM consortium and partners for selecting me to be a part of
such an excellent program and for providing an opportunity to grow both professionally
and personally.
I would like to express my sincere gratitude to Prof. Arkady Zaslavsky for his continuous
supervision and support. Thanks to Dr. Prem Jayaraman, Dr. Sylvain Kubler, Dr. Karan
Mitra and Dr. Saguna Saguna for their help and guidance during different phases of the
research. Moreover, I would like to thank Deakin University and Lulea University of
Technology for provided facilities and financial aid to successfully accomplish this thesis.
I am thankful to all PERCCOM mates for incredible two years of journey together. Special
thanks to Caroline for her continuous support.
Last but not least, I would like to express my deepest gratitude to my family and friends for
their unconditional love and infinite support.

Melbourne, 11 April 2019

Meruyert Nurgazy

                                      iii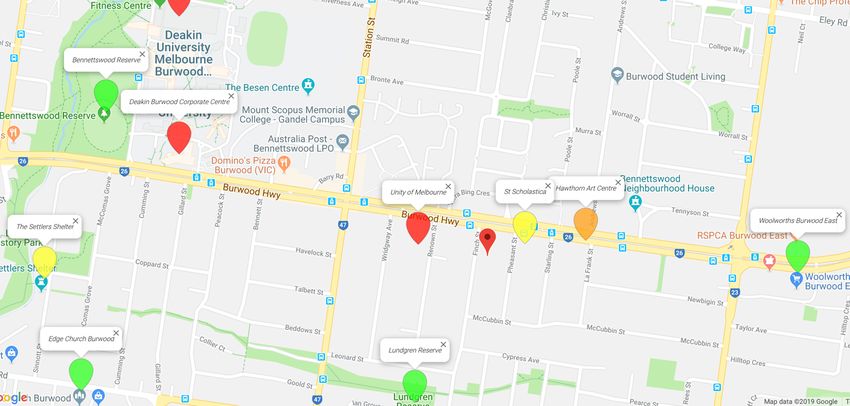
TABLE OF CONTENTS

1      INTRODUCTION .............................................................................................. 9

    1.1       RESEARCH MOTIVATION........................................................................................ 11
    1.2       PROBLEM DEFINITION............................................................................................ 12
       1.2.1     Research Aim, Questions and Objectives .................................................... 13
       1.2.2     Research Methodology ................................................................................ 13
    1.3      RESEARCH SCOPE .................................................................................................. 14
    1.4       CONTRIBUTION ...................................................................................................... 14
    1.5       IT FOR SUSTAINABILITY ........................................................................................ 15
    1.6       THESIS OUTLINE .................................................................................................... 16

2      THEORETICAL BACKGROUND AND RELATED WORK ............................ 17

    2.1       THE INTERNET OF THINGS ..................................................................................... 17
       2.1.1    IoT Architecture ........................................................................................... 17
       2.1.2    IoT Platforms ............................................................................................... 20
       2.1.3    IoT Application Areas .................................................................................. 23
    2.2      CONTEXT-AWARE COMPUTING ............................................................................. 25
       2.2.1    Defining Context .......................................................................................... 25
       2.2.2    Context Spaces Theory ................................................................................ 27
    2.3      DATA VISUALIZATION ........................................................................................... 28
       2.3.1    Context-driven Visualization ....................................................................... 29
       2.3.2    GIS Data Visualization ................................................................................ 30
    2.4      AMBIENT AIR POLLUTION ..................................................................................... 31
       2.4.1     Air Pollution Monitoring ............................................................................. 32
       2.4.2     The Role of Air Pollution Monitoring .......................................................... 35
    2.5      STATE-OF-THE-ART ON CONTEXT-AWARE AIR POLLUTION VISUALIZATION ......... 37
    2.6       SUMMARY.............................................................................................................. 42

3      CONTEXT-AWARE AIR POLLUTION VISUALIZATION MODEL ................ 44

    3.1       CONTEXT MODELLING ........................................................................................... 44
    3.2       SITUATION REASONING ......................................................................................... 48
    3.3       SUMMARY.............................................................................................................. 52

4      SYSTEM ARCHITECTURE AND IMPLEMENTATION.................................. 53

                                                      4
4.1     SYSTEM ARCHITECTURE AND COMPONENTS ......................................................... 53
    4.2     DATA ACQUISITION AND STORAGE ........................................................................ 54
    4.3     DATA PROCESSING ................................................................................................ 55
    4.4     DATA VISUALIZATION ........................................................................................... 57
    4.5     SUMMARY.............................................................................................................. 62

5     EXPERIMENTS, RESULTS AND DISCUSSION ........................................... 63

    5.1     EXPERIMENTS AND RESULTS ................................................................................. 63
    5.2     SUSTAINABILITY ANALYSIS ................................................................................... 70

6     CONCLUSIONS AND FUTURE RESEARCH ................................................ 75

    6.1     CONCLUSIONS ........................................................................................................ 75
    6.2     FUTURE RESEARCH DIRECTIONS ........................................................................... 76

7     REFERENCES ............................................................................................... 77

                                                    5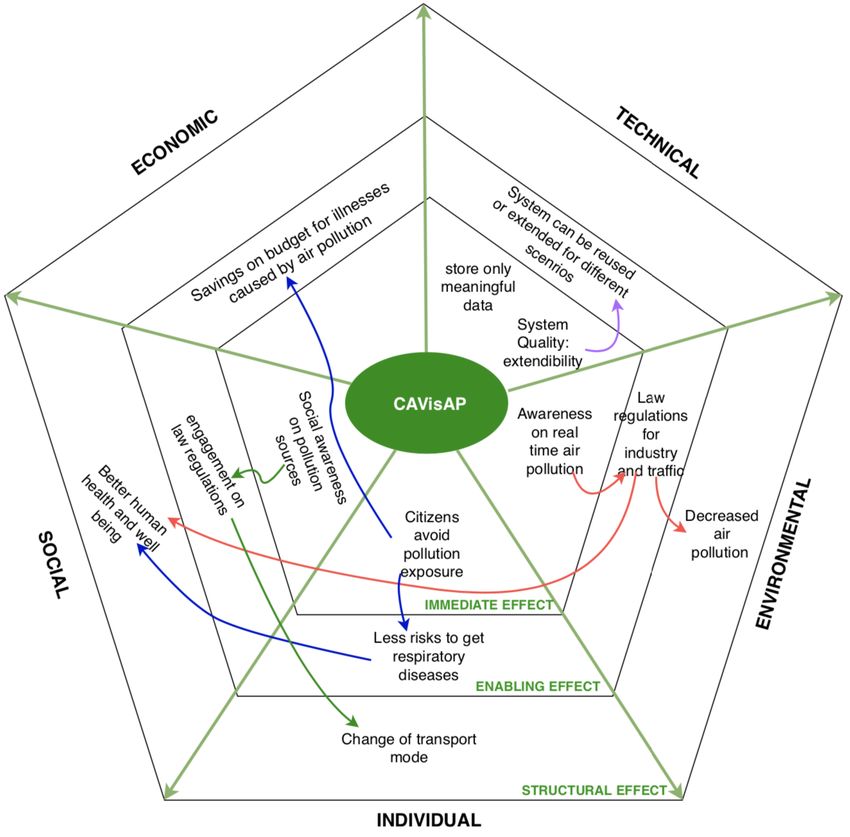
LIST OF FIGURES

Figure 1. UN Sustainability Development Goals. [12]........................................................ 11
Figure 2. CAVisAP motivating scenario illustration. .......................................................... 12
Figure 3. DSRM methodology. [16] .................................................................................... 14
Figure 4. CAVisAP positioning in the sustainability triangle. ............................................ 15
Figure 5. IoT Architecture versions: a) Three-layered; [28] b) Five-layered; [30] c) CISCO
reference model. [31] ........................................................................................................... 19
Figure 6. A Reference Architecture for IoT. [34] ................................................................ 20
Figure 7. Building blocks of IoT platform [36] ................................................................... 21
Figure 8. Context Space illustration. [70] ............................................................................ 28
Figure 9. The role of monitoring in air quality management. [5] ........................................ 36
Figure 10. Application Space example based on CST......................................................... 45
Figure 11. The CAVisAP layered system architecture. ....................................................... 53
Figure 12. System Architecture and Components. .............................................................. 54
Figure 13. Screenshots from ThingsBoard: a) Virtual sensors; b) Latest telemetry data. ... 55
Figure 14. Example question to define pollutant sensitivity levels. .................................... 56
Figure 15. Example of user profile information. ................................................................. 56
Figure 16. Query to find devices in a proximity radius. ...................................................... 57
Figure 17. NodeRED workflow. .......................................................................................... 58
Figure 18. Initialization of map object................................................................................. 59
Figure 19. Different visualization methods applied for the same dataset: a) heat map; b)
pollution spots map; c) pinpoints; d) pinpoints with indices. .............................................. 60
Figure 20. Set of colour hues used for visualization: a) multi-hue; b) single-hue. .............. 60
Figure 21. Function to calculate distance between coordinates........................................... 61
Figure 22. Pollution-safe route visualization implementation. ............................................ 61
Figure 23. Visualization of context-aware route planning: a) for healthy person; b) for
pollutant-sensitive person. ................................................................................................... 62
Figure 24. Location of the stations in the first experiment. ................................................. 64
Figure 25. Visualization of the same air pollution data for users with different sensitivity
levels: a) neutral; b) low; c) moderate; d) high e) extremely high ...................................... 65
Figure 26. Visualization colour schemes: a) default; b) colour-blind safe. ......................... 66
Figure 27. Route alternatives from origin to destination. .................................................... 67
Figure 28. Context-aware pollution-safe route suggestions for: a) Alice; b) Bob; c) Jack. 70
Figure 29. Conceptual framework of influence of data visualization on policy-making. ... 71
Figure 30. Data compact. [142] ........................................................................................... 72
Figure 31. CAVisAP five-dimensional sustainability analysis. .......................................... 72

                                                      6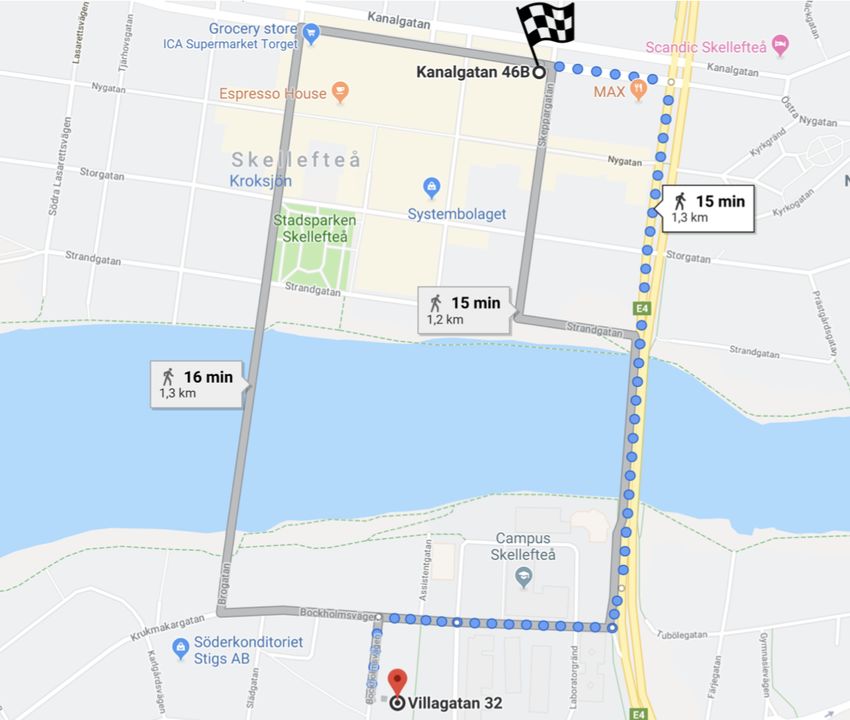
LIST OF TABLES

Table 1. IoT platforms comparison...................................................................................... 22
Table 2. AQI values, meaning and actions to protect health. [88] ...................................... 32
Table 3. AQI pollutant-specific categories. [88] ................................................................. 34
Table 4. European AQI standards. [89] ............................................................................... 34
Table 5. Australian AQI standards. [90] .............................................................................. 35
Table 6. A taxonomy to compare the state-of-the-art. ......................................................... 37
Table 7. The state-of-the-art literature comparison. ............................................................ 39
Table 8. A list of selected context attributes. ....................................................................... 46
Table 9. Context attributes, their value types and ranges. ................................................... 47
Table 10. Situation Spaces of the proposed model. ............................................................. 51
Table 11. Colour schema for CAVisAP data visualization. ................................................ 51
Table 12. Pollutant sensitivity levels of users...................................................................... 63
Table 13. AQI values at each station. .................................................................................. 64
Table 14. Situation Reasoning at each station. .................................................................... 64
Table 15. Sensitivity to NO2, O3 and PM2.5. ........................................................................ 65
Table 16. Air quality at each station. ................................................................................... 66
Table 17. Simulated user profiles for pollution-safe route suggestions experiment. .......... 66
Table 18. Air quality at each station. ................................................................................... 67
Table 19. Distance of stations from the route alternatives. ................................................. 68
Table 20. Situations along the route alternatives. ................................................................ 68
Table 21. Situation reasoning at each route alternative. ...................................................... 69
Table 22. Immediate, enabling and structural effects of CAVisAP .................................... 73

                                                   7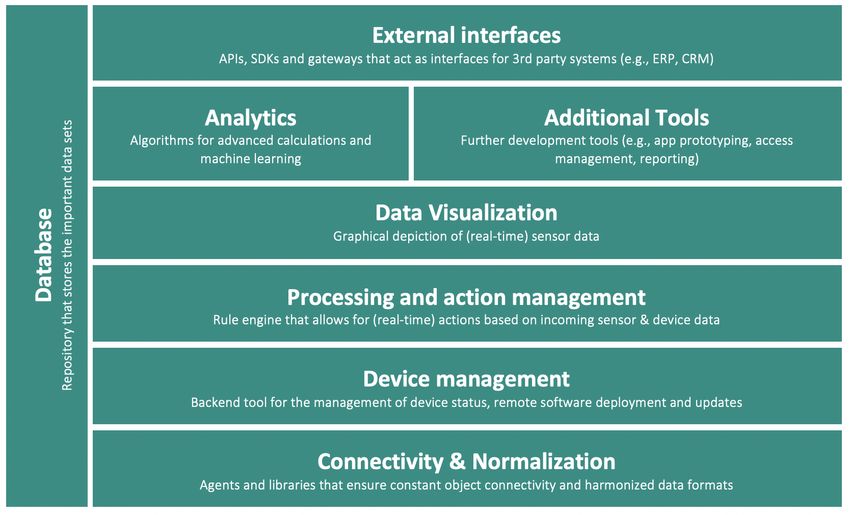
LIST OF SYMBOLS AND ABBREVIATIONS

AMQP     Advanced Message Queuing Protocol
AQI      Air Quality Index
AWS      Amazon Web Services
CoAP     Constrained Application Protocol
CST      Context Spaces Theory
DDS      Data Distribution Service
ECSTRA   Enhanced Context Spaces Theory Based Reasoning Architecture
EEA      European Environmental Protection Agency
GIS      Geographical Information Systems
GPLv3    GNU General Public License, version 3
HTTP     Hypertext Transfer Protocol
HTTPS    Hypertext Transfer Protocol Secure
IERC     Internet of Things European Research Cluster
IoT      Internet of Things
LGPLv3   GNU Lesser General Public License, version 3
MQTT     Message Queue Telemetry Transport
M2M      Machine to Machine
NFC      Near-field Communication
REST     Representational State Transfer
UN       United Nations
XMPP     Extensible Messaging and Presence Protocol
CO       Carbon Monoxide
CO2      Carbon Dioxide
NO2      Nitrogen Dioxide
O3       Ozone
PM       Particulate Matter
SO2      Sulphur Dioxide

                               8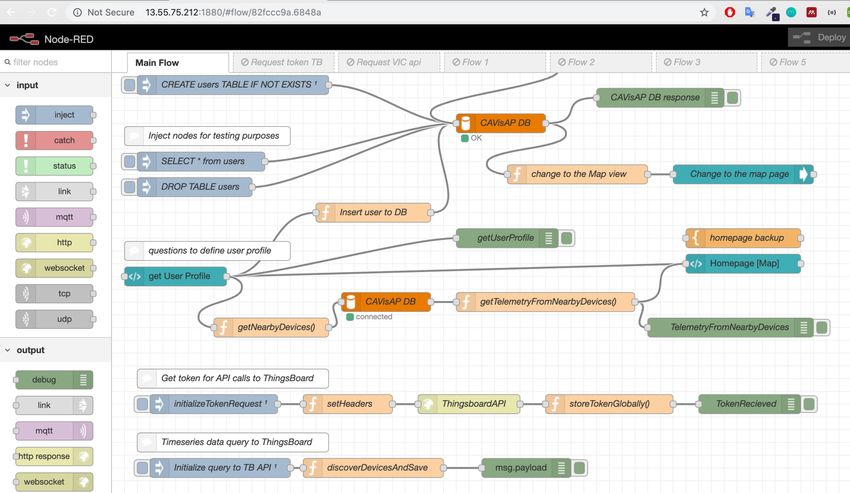
1   INTRODUCTION

Air pollution is a rapidly evolving concern in the past decades with the growth of pollution
sources worldwide. According to the European Environment Agency (EEA) pollutants are
released to the air from a wide range of sources including transport, agriculture, industry,
waste management and households [1]. Rapid urbanization and industrial growth
exacerbate the problem and the pressure felt severely in big cities. However, air pollution
does not respect borders. Air pollutants and heavy metals are carried by wind,
contaminating water and soil far from the origin [2]. Therefore, air pollution is not a
problem of solely industrial regions but a global burden which affects all parts of society.
According to the World Health Organization (WHO), 92% of population in our planet lives
in the areas that exceed ambient air quality limits. In addition, the report states that air
pollution is the largest environmental risk to health, being responsible to each ninth deaths
per year. Moreover, statistics show that outdoor air pollution alone is a cause of 3 million
deaths annually [3].
Human exposure to air pollution may cause different health issues depending on the
duration of exposure, type of pollutant and the toxicity level of the pollutant. The WHO
present air quality guidelines to explain in details health effects of various pollutants [4].
The health effects of air pollution can vary from difficulty in breathing, nausea or skin
irritation to cancer. The most widespread health effects observed by different
investigations include reduced lung functioning, asthma attacks, development of
respiratory diseases and premature death [5].
Atmospheric environmental protection, including air quality management, response
policies, health impact and risk assessment as well as air pollution modelling would be
impossible without quantitative description of air quality with measurable quantities. The
aim of the air quality management is to keep the ambient air clean enough so that it is safe
for the public health and the environment. In order to assess status of the air, current air
quality must be monitored. Public awareness of air pollution can contribute to both
reducing emission levels and decreasing exposure. Moreover, the air quality information is
required by scientists, regional and national policy-makers and planners to enable them to
make savvy decisions on managing the environment. Air quality monitoring provides
necessary scientific basis for developing policies, setting objectives and planning

                                      9
enforcement actions [5]. Despite the importance of measurements, in many cases,
monitoring alone may be insufficient for the purpose of fully defining population exposure
in the environment. Therefore, monitoring often needs to be combined with other objective
assessment techniques, including modelling, personalization and visualization of
measurements. Traditionally air quality monitoring is based on air quality stations operated
by national environmental protection agencies. These stations provide highly accurate
measurements; however, the coverage area is limited. Therefore, numerous new
approaches are emerging in order to provide highly resolved air quality visualization [6].
In the last decades Internet of Things (IoT) is increasingly being applied to environmental
challenges, including air quality monitoring, visualization and prediction. [7] defines IoT
as “an interconnection of sensing and actuating devices providing the ability to share
information across platforms through a unified framework.” Introducing IoT into the field
of environmental monitoring provides opportunity to get more accurate data in near real-
time [6]. However, there are numerous challenges in adopting IoT for environmental
issues. According to CISCO’s report, in 2017 there were 18 billion Internet-connected
smart devices, their forecasted number by 2022 is 28.5 billion [8]. This leads to the
generation of an enormous amount of data that has to be stored, computed and visualized
in an easily interpretable and efficient form.
Data generated by billions of devices might not have any value unless it is processed and
interpreted. Numerous data collection, modelling and reasoning techniques are evolved to
add a value to raw data coming from IoT devices [9]. One of the fields which gained
increased significance on processing raw data is context-aware computing. Context-aware
approach deals with raw information to provide meaningful context information which can
characterize the user’s situation and provide personalized services. Location, time, user and
activity can be considered as primary context types. Systems which use context in order to
provide service are considered as context-aware [10].
Application of the context-aware approach to outdoor air pollution monitoring enable
systems to understand user’s needs and provide relevant information. Consequently,
context-aware computing enables to process data efficiently and store only meaningful
information which is crucial in the era of billions of smart connected devices and big data.
101.1 Research Motivation
In September 2015, countries around the world adopted global Sustainable Development
Goals (SDGs) defined by United Nations (UN). The set of goals are aimed to end poverty
and hunger, protect the planet and resources and increase the quality of life and others as
presented in Figure 1. Sustainable Development Goal 3, target 3.9 focuses on ensuring
well-being and good health for world population considering substantially reducing the
number of illnesses and deaths caused by air pollution by 2030 [11].
Figure 1. UN Sustainability Development Goals. [12]
The 2009/10 Global Information Technology Report from World Economic Forum’s
(WEF) stated that “information and communication technologies meant to play important
role to enable sustainable growth”. The 2019 WEF IoT for Sustainable Development
project analysis found that 84% of IoT deployments are currently addressing, or have the
potential to address, the SDGs as defined by the UN [13].
The main motivation of this thesis is to apply IoT to create public awareness on outdoor air
pollution. Creating knowledge and awareness of air quality status which citizens can view
and personalize is critically important, because it affects health and well-being [14]. The
study aims to use context-aware approach to provide personalized and task-relevant
information on air quality which enables citizens and policy-makers to take immediate
actions and avoid polluted sites.
Motivating scenario. Consider the following example illustrating the necessity for real-
time visualization of outdoor air pollution according to user context. Alice and Jack live in
11the same neighbourhood in Skellefteå. They both work downtown and commute to there
by bike. Figure 2 illustrates possible routes from their neighbourhood to the work.
Figure 2. CAVisAP motivating scenario illustration.
Jack has extremely high sensitivity to small particles; therefore, he always needs to be
cautious about air pollution. However, Alice is a healthy person. The same level of
pollution exposure can affect them differently.
The illustration shows three routes A, B and C with low, moderate and high levels of
particulate matter pollution respectively. For Jack even moderate level of particulate matter
is critical and his overall AQ situation is poor at route B and C. Therefore, Jack needs to
take route A. Even though high level of particulate matter is critical for Alice, she is
tolerant for the moderate level. Therefore, Alice can take route B which is shorter but more
polluted than route A. Conventional navigation systems such as Google Maps [15] do not
consider user’s context when providing route alternatives. Therefore, there is a need to
build a context-aware system which enable walkers and bikers to avoid polluted areas.
1.2 Problem Definition
The core problem of this work is to incorporate context-awareness to IoT data visualization
in outdoor air pollution use case. The same levels of air pollution data streams received
12from IoT devices might have different meaning for users with different pollution
sensitivity levels. Therefore, data visualization must be personalized according to the user
context.
1.2.1 Research Aim, Questions and Objectives
The research aim of this thesis is to model, build and validate a real-time IoT-enabled
context-aware visualization system applied for outdoor air pollution use case.
To address this aim, we define the following research questions:
1. What is the state-of-the-art in the literature applied for IoT-based context-aware
air pollution visualisation?
2. How to build a context-aware model to personalize air pollution visualisation?
3. How to implement and validate the proposed context-aware system for air pollution
visualisation?
In order to answer to each of the research questions the research objectives are defined.
Each objective tackles a research question in respective order.
1. To investigate the state-of-the art literature applied for IoT-based context-aware
air pollution visualisation.
2. To define personalization criteria and develop a generic model for context-aware
visualisation of air pollution maps.
3. To implement and validate the system prototype in a real-life scenario.
1.2.2 Research Methodology
It is important to follow a predefined methodology to perform a reliable research. A type of
methodology chosen for a research is defined by objectives. This study aims to create an
artefact to solve a real-life problem, therefore, Design Science Research Methodology
(DSRM) introduced in [16] is chosen as a methodology. The DSRM consists of six steps as
shown in Figure 3. The first step is problem identification and motivation. A state-of-the-
art literature review must be conducted in order identify research gaps. The next step is
13defining objectives of the research. At this stage a novel contribution of the study must be
investigated. The next step is design and development. A model of the solution must be
designed, then implemented. At the demonstration and evaluation steps solution of the
problem must be experimented and validated. The last step is communication where results
of the research must be published and shared with the research community.
Figure 3. DSRM methodology. [16]
1.3 Research Scope
This thesis is concerned with efficient visualization of air pollution heatmaps for outdoor
environments and providing users with pollution-based route planning. The scope of the
project covers IoT enabled smart objects with air quality sensing capabilities and open air
quality data collection, preliminary processing and aggregation in the IoT platform-based
prototype system.
1.4 Contribution
The thesis contribution can be listed as follows
• to propose a model to define user context and provide personalized situation
reasoning based on outdoor air pollution;
• to develop a system prototype to illustrate personalized outdoor air pollution
visualization and pollution-safe route planning;
• to evaluate the developed system in real-life scenario;
14• Moreover, two research papers, containing findings of this thesis were submitted
and accepted for publication in the 2019 International Conference on High
Performance Computing & Simulation (HPCS 2019) and the 9th International
Conference on the Internet of Things [17] [18].
1.5 IT for Sustainability
Numerous definitions for sustainability are given, but the most common one is from United
Nations (UN) [19] which states that sustainability is “a development that meets the needs
of the present without compromising the ability of future generations to meet their own
needs”. As a part of PERCCOM program [20], [21] this thesis aims to use ICT capabilities
to solve global sustainability issues.
The most popular framework to evaluate sustainability of a system is a triple-bottom-line
perspective which considers economic, environmental and social aspects. This thesis
considers air pollution use case. Moreover, provision of personalized air pollution
heatmaps prevents citizens from inhalation of polluted air. Therefore, the thesis can be
considered more as a social project than financial. The three-dimensional sustainability
positioning of the CAVisAP system illustrated in Figure 4.
Figure 4. CAVisAP positioning in the sustainability triangle.
Creating awareness on air pollution can contribute to both reducing exposure and
decreasing emission levels. Moreover, the air quality information is required by scientists,
regional and national planners and policy-makers to support them in taking savvy decisions
on managing and controlling the environment. Air quality monitoring provides necessary
15scientific basis for developing policies, setting objectives and planning enforcement
actions [5].
The sustainability aspect of the thesis lies on creating awareness on environmental
problems by harnessing potential of IoT to sense pollution and providing context-aware
visualization which can help citizens to avoid pollution exposure and governments to make
informed decisions. At the discussions section a detailed sustainability analysis of the
thesis is provided.
1.6 Thesis Outline
The remainder of the thesis is structured as follows.
Chapter 2 – Theoretical Background and Related Work. The second chapter presents
state-of-the-art literature review and background knowledge in context-aware air quality
monitoring and visualization. Related existing systems were analyzed according to a
predefined criterion. The research gaps were identified. The conclusion of this chapter sets
up a foundation for the proposed thesis.
Chapter 3 – Context-Aware Air Pollution Visualization Model. In the third chapter we
present Context-Spaces Theory (CST)-based context modelling. Algorithms to define user
context in terms of pollutant sensitivity, situation reasoning and pollution-safe route
building is presented.
Chapter 4 - System Architecture and Implementation. The fourths section demonstrates
system architecture, its components and presents system implementation process.
Chapter 6 - Experiments, Results and Discussion. In the sixth chapter the outcome of
system testing in real life scenario is presented and model validation is illustrated.
Chapter 7 - Conclusion and Future Research. The last chapter concludes the results of
the research and discusses the future work.
162 THEORETICAL BACKGROUND AND RELATED WORK
This chapter introduces the theoretical background work and related literature analysis of
the thesis.
2.1 The Internet of Things
A term Internet of Things (IoT) was first introduced by Kevin Ashton in 1999 on supply
chain management [22]. According to ITU, IoT is a major enabler of ubiquitous computing
which provides a connectivity anytime, anywhere, by anyone and anything [23]. As
identified by [24] IoT can be considered as a result of convergence of three paradigms such
as Internet-oriented vision(middleware), things-oriented vision(sensors) and semantic-
oriented vision(knowledge).
Despite small differences on defining IoT, the vision of IoT has been massively
strengthened by statistics and forecasts. Gartner states that there will be 20 billion devices
connected to the Internet by 2020 [25]. 98% of survey respondents conducted by
McKinsey report that majority of companies in their sector consider IoT initiatives in their
roadmap. Moreover, the same source claims that IoT has a potential to generate about $4
billion to $11 trillion in economic value by 2025 [26]. The reason of such huge figures to
be forecasted is that connectivity and communication in the IoT paradigm enables its
application in many domains. As an example, IoT Analytics group shortlisted the most
popular IoT application areas including industry, smart city, energy, agriculture, e-health
and supply chain [27].
2.1.1 IoT Architecture
As it was mentioned, the term IoT was coined only two decades ago. Therefore, the
paradigm is relatively new to have a single standardized architecture for IoT system.
Numerous proposals were made by different research groups. The most simplistic model is
three-layered architecture consisting of the Application, Network and Perception layers
presented in [28], [29]. Moreover, in [30] authors illustrate extended version of this
architecture overall consisting of five layers: Perception, Network, Middleware,
17Application and Business layers. Since five-layer architecture comprises the one with three
layers, we give a brief description of a former one:
1. Perception layer consists of all physical devices such as sensors and actuators and
connects physical and virtual worlds.
2. Network layer handles communication between devices and data transmission to
the processing layer.
3. Middleware layer or processing layer covers device services management, data
storage, filtering and processing.
4. Application layer is responsible for global management of a system based on the
object information processed in the lower level. Examples of services in this layer
can be smart home or e-health applications.
5. Business layer handles complete management of an IoT system. Business layer
builds business models and defines future strategies depending on the data provided
by application layer.
These proposals give a basic idea on building blocks of IoT; however, they are limited to
describe holistic system architecture of IoT. Therefore, there is a need for a reference
model, which could provide a more descriptive overview of the system in a greater level of
abstraction. There were several attempts to establish a reference model by numerous
research groups. Cisco presented a seven-layer IoT reference model at IoT World Forum in
2014 [31]. The main difference of Cisco’s model from the five-layered IoT architecture is
introduction of Edge Computing as a layer. Moreover, the model divided middleware layer
into two separate layers of Data Accumulation and Data Abstraction, where former is
responsible for data storage and latter for data filtering and processing. Figure 5 illustrates
three-layered and five-layered IoT architectures as well as Cisco’s IoT reference model.
18Figure 5. IoT Architecture versions: a) Three-layered; [28] b) Five-layered; [30] c) CISCO
reference model. [31]
The same year with Cisco, WSO2 and year later IoT-A demonstrated their versions of
reference models for IoT [32], [33]. Overall architecture of the WSO2 model consists of
five layers as Devices, Communications (MQTT, HTTP), Aggregation (Enterprise Shared
Bus and Message Broker), Event Processing and Analytics and Client/External
Communications (Web Portal, Dashboard, APIs), which can be correlated with five-layer
architecture. However, by introducing cross-cutting layers as Device Manager and Identity
and Access Management the model differentiated itself from traditional IoT architectures.
Device management layer maintains the list of device identities and map thesis into
owners. Identity and Access Management layer handles token issuing and validation,
policy management for access control and manages directory of users. More extended
version of WSO2 reference model was developed by authors in [34]. The model extended
by Service Layer between data aggregation and event processing layer. The layer consists
of Resources Management and Service Repository and Discovery services. In addition,
to enhance security and privacy in different layers authors introduced a vertical layer
which enables to uniquely identify objects and control access to them. Figure 6 presents a
visual illustration of a reference architecture proposed in [34].
19Figure 6. A Reference Architecture for IoT. [34]
2.1.2 IoT Platforms
Having in mind a clear picture of IoT architecture from the previous chapter now we are
able to analyse IoT platforms. The IoT platforms consist of a huge number of objects
distributed all around the world. It connects edge devices and gateways to cloud services
and applications. Indeed, IoT Platform is a central piece in the IoT ecosystem that connects
physical world with virtual world. Nowadays, IoT platform functional blocks are a
trending field of research. Authors in [7] define three major IoT components such as
hardware, middleware and presentation which basically covers the three-layer IoT
architecture discussed at the previous section. Another research states that fully functional
IoT system should have six main elements such as sensing, communication, computation,
services, semantics and identification [35]. In addition, IoT Analytics group proposes a
detailed overview of IoT Platform, which consists of 8 major building blocks [36] which is
present in Figure 7.
20Figure 7. Building blocks of IoT platform [36]
Nowadays a number of IoT platforms is rising rapidly. It is hard to state exact figures;
however, different research and analytic groups attempt to identify approximate number of
platforms in the market. The most up to date information from IoT Analytics group
presents a list of 450 IoT Platforms worldwide operating in different sectors [37]. The
same source marks a 25% increase compared to the previous year. Several surveys are
conducted by various research groups to assess different aspects of these IoT platforms. It
is a time-consuming job to compare all existing platforms in the market, in addition, there
is no unified standards to evaluate all platforms. Therefore, researchers select certain
amount of the IoT platforms to review according to their pre-defined comparison criterion.
Authors in [38] present a survey of 28 platforms according to their application domain.
Another research group summarizes 14 publicly available IoT platforms against pre-
defined metrics [35]. A survey of platforms for massive IoT is presented in [39], which
takes into account metrics such as device management and integration, security,
communication protocols, data analytics type and support for visualization. A
comprehensive survey and gap analysis of IoT platforms is conducted by researchers in
[40] which review around 40 IoT platforms with respect to the support for heterogeneous
devices, security and privacy, data processing and data sharing capabilities, support to
21developers, maturity of an IoT ecosystem, and the availability of dedicated IoT
marketplaces.
Taking into account findings from the discussed surveys we shortlisted the most popular
platforms which are a subject of review in most of the papers. Table 1 presents shortlisted
10 platforms which are discussed in the majority of related work.
Table 1. IoT platforms comparison.
Open- Device Last Developer
Platform Architecture Security
source communication update support
Link Encryption,
AWS MQTT, May
no cloud-based Authentication ***
IoT [41] HTTP1.1 2019
(SigV4, X.509)
Carriots no cloud-based MQTT unknown unknown ***
Link Encryption,
IBM
Authentication,
Watson no cloud-based MQTT, HTTPS Jun 2018 ***
Identity
[42]
management
Apache
KAA license unknown MQTT, CoAP unknown Oct 2016 **
2.0
MS
HTTP, AMQP, Link Encryption May
Azure no cloud-based ***
MQTT (SSL/TSL) 2019
[43]
OAuth 2.0
authentication, Nov
OpenIoT LGPLv3 decentralized X-GSN *
permissions and 2015
roles
Apache
Things CoAP, HTTP, Authentication, May
license cloud-based ***
Board MQTT token request 2019
2.0
Thing centralized/ MQTT, 2-level April
no *
Speak cloud-based WebSocket authentication 2019
WebSocket, Identity
Thing AMQP, MQTT, Management,
no cloud-based Jan 2019 *
Worx XMPP, CoAP, Standards (ISO
DDS 27001),
Sockets/
no
WebSocket, Link Encryption
Xively (except cloud-based Sep 2018 **
HTTP, HTTPS, (SSL/TSL)
libraries)
MQTT
Commercial IoT platforms provided by world-known companies such as Amazon, IBM
and Microsoft are definitely of high standard and excellent support for developers.
However, their services come with price and are not within delimitations of this research
[41]–[43]. After several years of open availability platforms such as ThingSpeak and
ThingWorx are turned into commercial projects [44], [45]. Xively is now part of the
22Google Cloud Platform [46]. Another former open-source platform Carriots is acquired by
Altair global technology company [47]. OpenIoT open source IoT platform had a huge
vision at the start of the project, however, the last release was four years ago [48]. Majority
of the dependencies of the platform are outdated and developer support is in a poor level.
KAA is one of the popular IoT platforms which has both commercial and open-source
versions [49]. However, the open-source version was last updated in 2016 and developer
support of the project is in a moderate level. ThingsBoard is relatively new platform which
is gaining increased popularity in the recent years in open source community and among
researchers [50]–[52]. The platform provides near to real-time developer support and
constant releases. In addition, quick installation process, easy-to-use administration
interface makes the platform desirable to use for any IoT solution. Taking into account the
comparison results, for this research ThingsBoard is selected as an IoT platform of choice.
2.1.3 IoT Application Areas
Potential applications of the IoT are various and diverse, spreading out to all intents and
purposes of every-day life of people, businesses and society as an entire. European
Research Cluster for Internet of Things (IERC) has a vision of “the major application fields
for IoT are the creation of smart environments/spaces and self-aware things for climate,
food, energy, mobility, digital society and health applications” [53] Authors in [24] state
that a wide range of IoT application domains can be grouped into Transportation and
Logistics, Healthcare, Smart Environment and Personal and Social domain. However,
IERC has defined a more extended version of IoT application fields which consists of
Smart Planet, Smart Cities, Smart Energy, Smart Buildings, Smart Transport, Smart
Industry, Smart Health and Smart Living [53]. In [54] IERC researchers presented a list of
the most trending IoT application scenarios in 12 different domains:
1. Smart city is relatively more popular domain where IoT is applied to create
awareness on status of different buildings, visualize traffic congestion and urban
noise as well as to monitor availability of parking spaces. Moreover, waste
management, street lights and transportation systems are optimized by adoption of
IoT.
232. Smart environment is another key area where IoT enables air pollution monitoring
and control, forest fire detection, soil moisture detection and earthquake early
detection.
3. Smart water is an area where IoT is applied for studies of water quality in rivers
and sea as well as for pipe water leakages and river floods detection.
4. Smart metering area enhanced by IoT with energy consumption monitoring and
management in smart grids, solar energy plants control, silos stock calculation and
other.
5. Security & Emergencies area applies IoT for access control to restricted areas,
liquid detection in data centers and other sensitive buildings, to assess radiation
levels and detect explosive and hazardous gases.
6. Retail domain utilizes IoT for NFC payments, smart shopping applications and
smart warehouse management.
7. Logistics domain applies IoT for monitoring item location, shipment conditions and
storage incompatibility detection.
8. Industrial Control harnesses IoT for indoor air quality and temperature monitoring,
automation of vehicle control in mining fields, and etc.
9. Smart Agriculture is enhanced by IoT with soil moisture control, green houses
micro-climate control, monitoring of meteorological conditions, and control of
compost humidity.
10. Smart Animal Farming applies IoT for offspring care and health anomalies
detection, animal tracking and study of ventilation in farms.
11. Home Automation: IoT is applied for monitoring of utility resources consumption,
remote control of appliances and home security, and good preservation in
museums.
12. eHealth is one the critical areas where IoT can be applied for fall detection of
disabled people, control conditions of medical fridges, monitoring of sportsmen
health in high performance centres or patients conditions in hospitals as well as to
detect ultraviolet radiation and warn people about peak hours [54].
This work lies within the bound of Smart Environment domain and focuses on monitoring
and visualizing outdoor air pollution.
24To summarize, this section discussed the notion of IoT, reviewed existing reference
architectures and surveyed major IoT platforms. Moreover, application areas of IoT and
the most trending domains are presented. The most important takeover of the chapter is the
chosen IoT platforms as a result of the survey. A specific list of criteria was defined in
order to select the most appropriate platform for this research. The next section reviews
context-aware computing, which enables optimal processing of the raw data from the IoT
devices.
2.2 Context-Aware Computing
Currently many web, mobile, desktop applications use context-aware approach to the
Internet of Things. The ultimate goal of the context-aware computing is to support the
appropriate response to the users and the environment. Therefore, the context-aware
applications have an ability to adapt to the user’s situation without the user being
distracted. The context-aware computing has been widespread after the introduction of the
term ubiquitous computing by Mark Weiser in 1991 [55]. A paper by Schilit and Theimer
used the term context-aware computing for the first time in 1994 [56]. The research focus
is on providing context-aware location information of administrative entities.
In order to implement context-driven applications as mentioned above, it is crucial to
understand context and its evolution. The following section presents definitions of context
and its different characteristics.
2.2.1 Defining Context
Numerous researchers attempt to define context in their work. In the definition given by
Ryan et al. [57] context can be seen as user’s identity, current location, environment, and
time. Dey et al. [58] consider as context information as the user’s emotional state, location,
orientation, date, time and surrounding objects. Some papers use synonyms of the context
such as an environment or a situation [59]–[62].
Abowd et al. [10] present a review of these definitions and discuss weaknesses. With
highlighted limitations of the previous attempt the researchers present a broader definition
for context as following:
25“Context is any information that can be used to characterize the situation of an entity. An
entity is a person, place, or object that is considered relevant to the interaction between a
user and an application, including the user and applications themselves [10].”
In this research we accept definition of the context by Abowd et al. since it is more
generalized definition that can be found in the literature. After clarifying the definition of
the term context, now we are able to determine what is context awareness.
Schilit and Theimer were the first to introduce the term context-awareness [56]. Numerous
researchers refer to context-aware applications as the ones that based on the context of the
user and application itself dynamically adapt their behaviour [63]–[66]. Abowd et al. [10]
present a review of papers which refer to context-aware by synonyms such as reactive,
adaptive, situated, responsive, context-sensitive and environment-directed. Abowd claims
that definition provided earlier are too specific and restrictive to identify context awareness
of applications. Therefore, they propose the following definition: “A system is context-
aware if it uses context to provide relevant information and/or services to the user, where
relevancy depends on the user’s task [10].” Researchers in [67] define context-awareness’
five major elements such as context acquisition, modelling, reasoning, dissemination and
context adaptation. The main focus of context acquisition is on context data collection
from different types of sensors, then this context data is converted to a machine-readable
form with context modelling. Next, context reasoning is used to reason high level situation
awareness from a low-level context. Afterwards, context is presented to a user or an
environment via context dissemination. Lastly, context adaptation focuses on selection of
relevant services for a user according to the context.
A more simplified context lifecycle is presented in [68], which is based on a review of the
previous works and contains all essential phases. The proposed context lifecycle consists
of four phases including context acquisition, context modelling, context reasoning and
context dissemination. The phases have the same focus as in [67], however, context
adaptation phase is not considered.
A good context modelling reduces the complexity of an application and enables to provide
relatively accurate context-aware service. Moreover, context modelling is necessary to
have a common picture of a system and its components. In addition, context modelling
helps to deal with mobility and heterogeneity of the context sources. Many context
modelling approaches has been proposed over the last decades with evolvement of the
26context-aware computing. The survey in [68] illustrates six most widespread context
modelling techniques such as mark-up schemes, key-value, logic based, object-based,
graphical based, and ontology-based modelling. The paper presents a comparison of these
approaches as well. However, there is no standard for context modelling and choice of
approach is subjective decision. [69] claims that all context models have their strength and
weaknesses. For this research Context Spaces Theory is used to model a context. The
definition, main components and benefits of the model are discussed in the following
section.
2.2.2 Context Spaces Theory
Context Spaces Theory (CST) is a conceptual framework for context-aware systems
introduced by Padovitz et al. [70]. The main idea of the approach is to represent context as
a multidimensional space. In order to understand the CST, it is necessary to introduce the
following set of new terms.
A context attribute (denoted as ai) is any type of data that is used to reason a context. A
context attribute can be a reading from sensors or derived from other context attributes. For
example, readings from a temperature sensor can be a context attribute.
An application space (denoted as R) is a multidimensional space that is composed of an
entire set of relevant context attributes. Each context attribute is an axis of the application
space and a specific value on the axis is referred as a context attribute value.
A context state (denoted as Ci) is a collection of all relevant context attribute values at
specific time t. A context state can be illustrated as a point or subspace in space.
Ci = (a1V, a2V, a3V, … , anV)
For example, a context state can be made up from context attributes such as light
level(a1V), temperature(a2V) and humidity(a3V).
A situation space is a subspace of application space and represents a reallife situation
(denoted as Si). Situation space is a subspace of application space and contains a set of
regions of context attribute values.
Si = (a1R, a2R, a3R, … , anV)
For example, if we assume a situation space for a comfortable indoor environment,
acceptable region of values for a room temperature can be between 22℃ to 24℃ and the
27range of values for relative humidity can vary from 40% to 60%. Figure 8 shows a visual
illustration of context space and its elements.
Figure 8. Context Space illustration. [70]
The CST provides an abstraction which enables to achieve a coherent context
representation. In addition to the aim of comprehensively and insightfully representing
context, the theory addresses challenges of reasoning about context in uncertain
environment [71]. Since this thesis aims to implement context aware system which uses
uncertain raw environmental data as one of the data sources, the use of the CST can help
with accurate context modelling.
To sum up, this section discussed a briefly context-aware computing, highlighted different
definitions of context and context-awareness, reviewed context lifecycle as well as
introduced CST on the basis of which the thesis will be implemented. As it was stated
before the main focus of this thesis is to implement a context-aware visualization system
for outdoor air pollution use case. With the well-presented big picture of the context-aware
system we transit to the background review of data visualization at the next section.
2.3 Data Visualization
Data visualization has an ultimate goal of making data more understandable and
interpretable for humans. According to authors in [72] data visualization is defined as “the
representation and presentation of data that exploits our visual perception abilities in order
28to amplify cognition.” As it was mentioned before [8], [25], there are billions of devices
that are connected to the Internet and the number is growing exponentially. The amount of
data generated by the smart devices already reached a huge extent [73] and mostly cannot
be interpreted without adequate data visualization methods. A report by researchers in [74]
presents a significance of the data visualization for decision-making, improved information
sharing, provision of self-service capabilities to end users and other. On the other hand,
results in [75] prove that the resulting image of different data presentation techniques
applied to the same data might differ vastly. Therefore, relevant techniques have to be
applied depending on the current context or situation.
2.3.1 Context-driven Visualization
The variety of existing visualization techniques and their endless configuration options
makes it a hard and tedious procedure to choose the most suitable representation approach
even for experts.
Several studies attempt to apply context-aware approach for the data visualization. A
comprehensive system for the context-driven data presentation is implemented by Eissele
et al. [76], where authors consider device performance and connectivity as a context to
provide visual data. Authors in [77] demonstrate a visualization framework for context-
aware systems, which focuses on efficient communication and parallel processing. The
researchers claim that mobile devices lack a computational power to perform complex
tasks and provide context-aware services. However, with the use of stream processing
which supports parallel computation on distributed and shared memory multiprocessors
authors demonstrate effective context-aware visualization approach. Another work in [78]
illustrates a framework for smart cars, which enables to interpret and disseminate context
to provide context-aware visualization. Context-aware approach is used to visualize traffic
accidents in [79], where focus was not on the user interface but the content of data to be
visualized. The primary challenges of context-aware visualization services implementation
are discussed in [80]. The paper points out run-time issues of the correlation of context
elements changes and simultaneous reconfiguration of the user interfaces, interoperability
of heterogeneous visualization services, information sharing throughout different services
and integration of separate services into one homogenous view. As a solution of the
aforementioned problems, the authors present a framework called visualization mosaics
29(ViMos), which generates user interfaces dynamically. The framework applies context-
awareness to visualize adapted interfaces. The generation of user interfaces comprises of
several steps such as acquisition of the context, selection of candidate data, selection of
candidate design pattern and information pieces and finally incorporation of all awareness
elements.
To summarize, some of the previous studies attempt to adapt their content according to the
user interface and device characteristics, while others provide dynamically changing
interfaces. However, all studies agree that there are a great number of issues to be
considered, when implementing context-aware visualization solutions, such as user
preferences, user’s current task and surrounding environment status.
2.3.2 GIS Data Visualization
The previous section discussed different aspects of context-aware visualization. Since this
thesis focuses on context-aware visualization of air pollution maps, it is necessary to
review previous works on location-based systems.
Recently Geographical Information Systems (GIS) is increasingly being applied for
various geospatial disciplines. According to Aronoff [81], GIS is a computer-based system
that provides the following four capabilities to handle georeferenced data such as (i) data
capture and preparation, (ii) data management, (iii) data manipulation and analysis, and
(iv) data presentation. Georeferenced data or spatial data mean data that contains position
values, such as (x,y) coordinates [82].
GIS is applied to visualize spatial data in different fields. Example giving, in [83] authors
use GIS to visualize statistical information on population density distributed
geographically. The study proposes a model of 3D space, where two dimensions are used
for coordinates and one for population density. An investigation of 3D visualization of GIS
data based on context-sensitive middleware is presented in [84]. However, the study can be
considered as a preliminary discussion of context-aware approach adoption for the GIS
data visualization due to the minimum consideration of a context. Another study presents
GIS data visualization in the field of Augmented Reality [85]. This research aims to use
GIS for outdoor air pollution visualization as it is a perfect fit for the temporal and spatial
data representation.
30You can also read


