The Effects of School Reopenings on COVID-19 Hospitalizations
←
→
Page content transcription
If your browser does not render page correctly, please read the page content below
The Effects of School Reopenings on COVID-19 Hospitalizations

 Douglas N. Harris
 Engy Ziedan
 Susan Hassig

 January 14, 2021

Abstract: We provide the first broad-scale evidence regarding the effect of school reopenings on
COVID-19 health outcomes. We specifically focus on COVID-19-related hospitalizations, which
directly measure the health outcomes of greatest interest and are not subject to the numerous
measurement problems that arise with virus positivity rates and contact tracing. We also address
selection bias in school reopening decisions by using panel analysis of weekly school reopening
and COVID-19 hospitalization data for almost every county in the nation. In addition to fixed
effects and matched difference-in-differences methods, we use teacher bargaining power as an
instrumental variable. For counties whose pre-opening total new COVID-19 hospitalization rates
were relatively low in the summer months, we find no effect of in-person school reopening on
COVID-19 hospitalization rates. For these counties, the estimates are robust to alternative school
reopening and hospitalization data sources, the addition of controls for general state social
distancing policies and college opening modes, and alternative estimation methods. For counties
where total baseline new hospitalizations were relatively high in the summer, the estimates are
inconsistent across methods and are therefore inconclusive. Our work contributes to the ongoing
debate on teaching modes during the COVID-19 pandemic and the costs and benefits of remote
education.

Acknowledgements: This research was carried out under the auspices of the National Center for
Research on Education Access and Choice (REACH) based at Tulane University, which is supported by the Institute
of Education Sciences, U.S. Department of Education, through Grant R305C100025 to The Administrators of the
Tulane Educational Fund. The opinions expressed are those of the authors and do not represent views of the
Institute, the U.S. Department of Education, Change Healthcare, or any other organization. For their helpful
comments, we thank Sarah Cohodes, Austin Denteh, Dan Goldhaber, Michael Hansen, Scott Imberman, Robert
Kaestner, Wei Long, Katharine Strunk, Jon Valant, and Jeffrey Wooldridge. We also thank Sumedha Gupta, Chris
Marsicano, and Kosali Simon, as well as Burbio, MCH, Change Healthcare, and the COVID-19 research database, a
pro-bono cross-industry collaborative https://covid19researchdatabase.org/, for access to data and assistance in data
cleaning and coding. Olivia Carr and Daniel Oliver provided invaluable research assistance. All remaining errors are
those of the authors.

Author Information: Douglas Harris (corresponding author) is professor and chair of economics at Tulane and
director of REACH (dharri5@tulane.edu). Engy Ziedan is Tulane assistant professor of economics at Tulane
(eziedan@tulane.edu). Susan Hassig is associate professor of epidemiology at Tulane (shassig@tulane.edu).

JEL Codes: H4, I1, I2
Keywords: Pandemics, Education, Health Outcomes

 1
I. Introduction

 Since it began to spread in January, COVID-19 has led to 1.7 million deaths worldwide
and more than 300,000 in the United States. The health crisis has also precipitated substantial
additional economic, social, and health side effects. Economic activity is predicted to decline by
$16 trillion in the U.S. alone (Cutler & Summers, 2020). Bankruptcies, unemployment, and food
insecurity are up (Bauer et al., 2020). Mental health is worsening (Czeisler et al., 2020; Pan et
al., 2020). People are putting off visits to doctors for non-COVID-19 ailments, potentially
creating unintended health consequences (Ziedan et al. 2020; Mehotra et al. 2020, Skinner et al.
2020).
 Another significant effect of the virus has been to keep children, adolescents, and
teenagers home from school. By April, more than 1.5 billion children worldwide were no longer
in school and 263 million remain so (UNESCO, 2020). The U.S. has closed a larger share of
school buildings than other developed countries.1 More than two-thirds of U.S. students in large
districts started the school year fully online (Center for Reinventing Public Education, 2020).
While this number gradually dropped to 37 percent, the vast majority of the remainder are still in
some form of hybrid learning.
 While closing school buildings has been a reasonable reaction to an uncertain and fluid
pandemic, the school closures are likely to compound the social and economic crisis in the short-
term and the long-term. Remote learning has forced many parents to leave the workforce or work
from home while also supporting their children’s learning. This has reduced labor force
participation and hindered career trajectories, especially among women (Tedeschi, 2020). Even
when their parents are helping with remote learning, children also learn less at home, which will
affect their human capital, future productivity, and broader well-being (Hanushek and
Woessman, 2020). While data collection during the pandemic has been problematic, there are
already signs of learning loss and rising achievement gaps (Bacher-Hicks, Goodman, and
Mulhern, 2020; Chetty et al., 2020; Kuhfeld et al., 2020).2
 When children are home, they are also more likely to experience physical abuse. While
the number of reports of abuse have plummeted, this is likely because schools, when operating
in-person, are among the primary reporters of abuse to local government agencies (Mathematica,
2020). There are signs that the declining reports of abuse are masking a significant rise in the
underlying abuse frequency (Schmidt & Natanson, 2020), which might arise as children spend
more time at home with parents who themselves are more likely to be suffering social and
economic hardship. Therefore, as we try to grapple with the possible health costs of reopening

1
 https://en.unesco.org/covid19/educationresponse
2
 The Kuhfeld et al. (2020) study provides a seemingly more positive picture than the other two listed
above, but the Kuhfeld et al. study also reports a 25 percent drop in the share of students tested in
participating schools and a 50 percent drop in the share of schools participating at all. The authors
attempt to simulate the effects of the former, but do not address the latter form of selection bias, so their
results likely under-state learning losses.

 2
schools, it is also important to consider the health and other costs to keeping them closed. Having
children in school in-person has important benefits.
 The extent of this trade-off between the costs and benefits of reopening schools depends
on how the virus spreads, the steps that schools take to reopen safely, and the counterfactual
social interactions that occur when schools are closed (e.g., parent “pods” and other non-school,
group-based interaction). Schools are supervised environments whose leaders are usually
actively engaged with public health officials. When students are at home, in contrast, there may
be less supervision, depending on home circumstances. So, while the number of social
interactions is higher in schools, the effect on COVID-19 spread may be offset, at least in part,
by higher safety of those interactions.
 Partly for these reasons, some experts have suggested that reopening schools to in-person
instruction would create only limited increase in SARS-CoV2, the virus that leads to COVID-19
and its associated health ailments (e.g., American Association of Pediatrics, 2020; Oster, 2020).
School-age children seem less likely to transmit the virus (Viner et al., 2020) or to suffer
mortality (Laxminarayan et al., 2020). Unfortunately, the idea that it might be safe to reopen
schools is based on limited evidence. The problem is that the data likely miss the vast majority of
infections, especially among children, and even the infections we do observe are a function of
self-selection.3 Also, the rate of COVID-19 testing is likely to change when schools reopen in-
person. First, schools may be more likely open in-person where testing capacity is increasing or
expected to increase in the near future. Also, when schools reopen in-person, students, parents,
and school staff might be more likely to get tested when they first feel sick, in order to protect
the larger number of people with whom they are in contact, increasing the frequency of COVID-
19 testing. These factors make it difficult to determine whether any changes in the positivity rate
after school reopening reflect changes in actual virus transmission or changes in the testing
regimes, which may be unrelated to virus transmission.
 Contact tracing is also based on virus testing and therefore suffers from similar
problems.4 A few studies in the U.S. have found limited spread from children (e.g., Hobbs et al.,
2020),5 but a virus “outbreak” is unlikely to be detected given the infrequency of testing. If an
outbreak did become apparent, rare and selective testing makes it difficult to attribute this to
schools as opposed to other places where social interaction occurs. In short, contact tracing might

3
 It is unclear how many people have been tested. The CDC has reported 84 million tests
(https://www.cdc.gov/coronavirus/2019-ncov/covid-data/covidview/index.html), but an unknown share of
these come from the same people receiving multiple tests (e.g., some college students and workers are
being tested on a monthly or even weekly basis). Even if each test were from a different person, this
would mean only one-quarter of the population has ever been tested.
4
 An exception is Sweden where researchers were able to link individual students and teachers to one
another, students to their parents, and teachers to their partners/spouses, an elaborate form of contact
tracing that is without precedent in the U.S. (Vlachos et al., 2020). These authors also rely on the fact that
upper secondary schools remained under remote instruction and lower secondary went back to in-person,
creating exogenous variation in social distancing and potential virus exposure. This research suggests
that school reopenings did increase SARS-CoV2 spread from students to their parents (odds ratio: 1.15)
and from teachers to their partners (odds ratio: 2.01).
5
 There are also two additional studies from the UK (Forbes et al., 2020; Ismail et al., 2020).

 3
not show when schools are actually spreading the virus; and contact tracing might suggest an
outbreak from schools even when the outbreak sources lay elsewhere.6 In any event, the most
rigorous contact tracing studies fall almost entirely outside the United States.7
 A final limitation of analyses based on COVID-19 testing is that they cannot provide
evidence on what ultimately matters: health outcomes. We are left to assume that the effect on
transmission, as reflected in the (imperfect) positivity rates, translates directly into negative
symptoms, but there are good reasons to expect this not to be the case. For example, families
may have more lax social distancing rules for their children if they are unlikely to come in
contact with their grandparents or other older adults, reducing the extent to which the positivity
rate translates into negative health outcomes.
 In this study, we provide the first evidence of the effects of school reopenings on health
outcomes, i.e., without relying on the positivity rate. Specifically, we focus on the effects of
school reopenings on rates of hospitalizations for COVID-19-related diagnoses that include
almost all counties in the nation. Our focus on hospitalizations is important because it gets us
much closer to the outcomes of greatest importance--actual sickness. In addition, the validity and
reliability of this measure is not likely to be affected by whether schools reopen. Unlike the
positivity rate, which is likely to change after schools reopen regardless of school spread effects,
hospitals are not likely to change their rate of illness reporting because schools reopen.8
 Our specific health outcome measure is the number of hospitalizations that involve a
COVID-19 diagnosis, using two data sources: health insurance claims data provided by the
organization Change Healthcare and recently released data from the U.S. Department of Health
and Human Services (HHS) data from essentially all U.S. hospitals. The former include
diagnosis codes for each individual patient, along with the admission date and other information
that allow us to identify the county of residence of the patient (3-digit zip code of the patient’s
home residence), from January through the end of October, providing ample time for effects to
emerge after school reopenings, even if, as we expect, the hospitalizations are delayed by
transmission time and virus incubation. The new HHS data do not begin until the end of July but
they include more fine-grained 5-digit zip code location data (using the location of the hospital
rather than the patient).
 The other key type of data involves the date and form of school reopening. We use data
from three sources—the trade publication Education Week and two private companies, Burbio

6
 To be clear, contact tracing can still be a useful tool for schools trying to contain the virus. As we show
later, reopening schools is likely to spread the virus when there is more of the virus in the community,
regardless of the source.
7
 The Viner et al. (2020) meta-analysis included 16 studies, including six from China, three from the U.S.,
and single studies from various other countries. The study focused on contact tracing studies addressed
these concerns by focusing just on those contact tracing studies that involved fairly universal testing and
tracing. The results of these more credible studies suggest that the “attack rate” (i.e., the probability of
infection when being in contact with an infected person) was consistently lower in children compared with
both adolescents, who in turn had lower attack rates than adults (Viner et al., 2020). However, this does
not tell us whether schools are spreading the virus.
8 As discussed later, we only study in-patient cases and hospitals might not admit patients when hospitals

are already near capacity, but the share of hospitals reaching that capacity has been very low.

 4
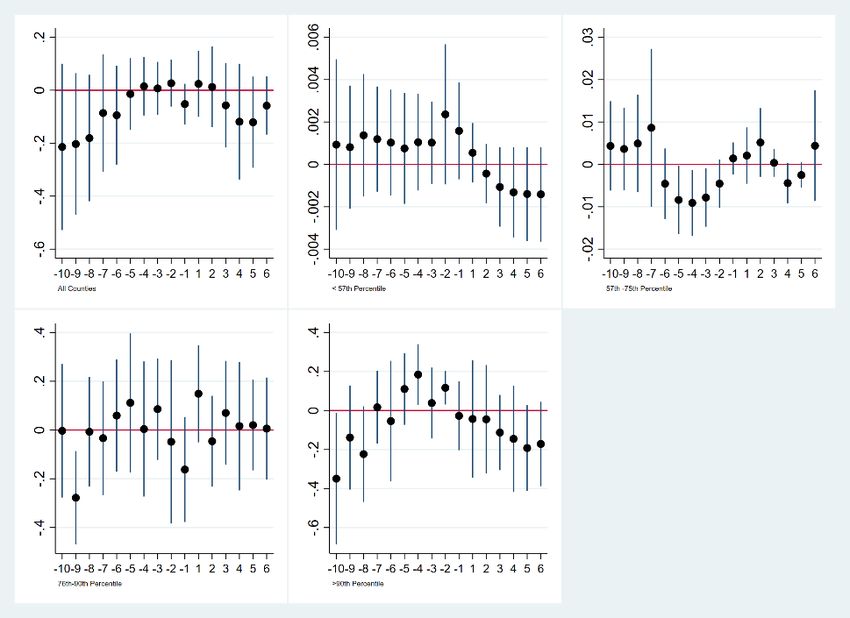
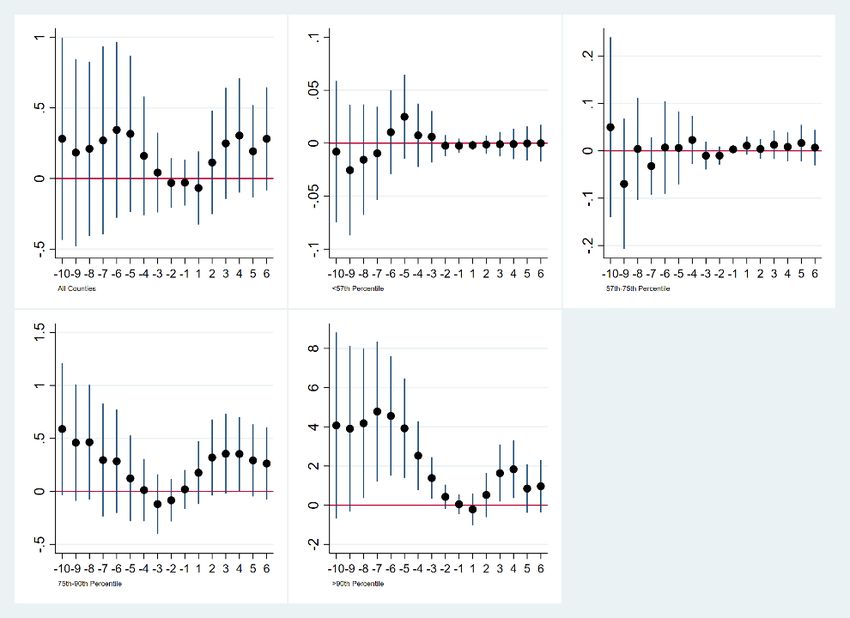
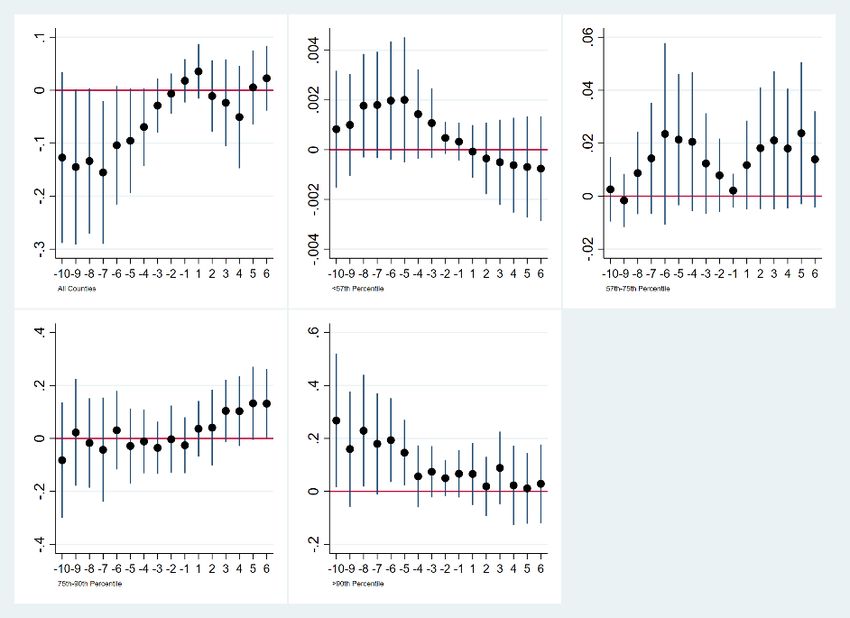
and MCH Strategic Data—regarding the date and mode of school reopening (fully in-person,
fully remote, and hybrid). Each of these data sources has advantages and disadvantages;
however, they generally yield similar conclusions when we apply the analysis with each one
separately.
 We analyze these county-by-week panel data in a generalized difference-in-differences
framework that incorporates both propensity score matching and instrumental variables
estimation. Specifically, we regress the number of COVID-19 hospitalizations on measures of
the instructional mode of school reopening, variables capturing state social distancing guidelines,
college reopening dates and modes, and county-level fixed effects. Both the school reopening
and hospitalizations are at the county-by-week level, allowing us to observe changes in
hospitalizations each week after schools reopened (up to 6 weeks post-treatment).
 Even with the above rich set of controls, it is possible that school reopening decisions are
related to unobserved factors that also affect hospitalizations in other ways; therefore, we also
use teacher bargaining power as an instrumental variable (IV) in the fixed effect analyses. School
districts with more bargaining power are less likely to open in person (Hartney & Finger, 2020).
Our results from the first stage IV estimation confirm this. Also, there are few reasons to expect
that teacher unions affect hospitalizations through any other channel, especially not in a way that
coincides with the timing of school reopening.
 Using these methods, we see no indication that in-person school reopenings have
increased COVID-19 hospitalizations in the counties below 36-44 new COVID-19
hospitalizations per 100,000 population per week (this is roughly 75 percent of U.S. counties as
of October). Neither the levels nor the trends change in any direction when schools open in this
group, even as far as 6 weeks after schools reopened. In fact, we often see precise estimates
suggesting declines in hospitalizations in these low-baseline COVID-19 counties; and we pass
parallel trends tests from roughly 6 weeks prior to school reopening up to the reopening dates
(with some non-parallel trends in the early summer weeks). The results are also robust to the
inclusion of time-varying state social distancing policies, college reopening timing and mode, the
use of alternative school reopening data sets (Burbio versus MCH), and different estimation
strategies (DD, PSM-DD, FE, FE-IV). Our main results focus on the Change Healthcare data
because of the larger number of periods, but the results are also robust to the use of the new HHS
data.
 In the counties with higher pre-opening COVID-19-hospitalization rates, however, the
results are inconclusive. While we still sometimes see evidence of reduced hospitalizations, the
estimates also sometimes suggest the opposite. This possibility of increased hospitalizations is
consistent with the idea that social interaction creates more negative health outcomes when there
is more of the virus to be spread, perhaps despite careful school safety measures. In these cases,
it could still be appropriate to reopen schools, because of the negative effects on students and
parents from keeping schools closed (see above), but there may be more of a trade-off. Opening
schools in these high-COVID-19 locations might spread the virus, but improve other health
outcomes for students and their families in other ways (e.g., reduced abuse and mental illness).

 5
Our method is similar to one in Germany (Isphording, Lipfert, & Pestel, 2020), which
found that school reopening reduced SARS-CoV2 transmission. The authors explain that the
drop is possible because schools instituted strict protocols that quarantine students who tested
positive. This threat, combined with strong messages sent by educators to encourage safe
behaviors, may have led students to be more careful in social distancing outside of school,
leading to the net drop in transmissions.9 Also, we have to consider the counterfactual of what
students would have been doing in the absence of going to school in-person. Our study is also
similar to a study using data from Michigan and Washington (Goldhaber et al., 2020). However,
these studies both rely on the positivity rate.
 The inadequacies with the positivity rate suggest that additional research is necessary to
provide a complete picture of the effects of school reopening on SARS-CoV2 transmission and
COVID-19 health outcomes. In Section II, we summarize more of what is known about the
factors affecting school reopenings and SARS-CoV2 transmission. Section III describes our data
in more detail. We discuss our identification strategy in section IV and finally, in section V,
present our results. Important considerations for interpreting these findings can be found at the
end of section V and in section VI.

II. Prior Research on School Reopenings and COVID-19

 At least two strands of research inform the interpretation of results regarding the effects
of school reopening on COVID-19 transmission. First, we discuss what is known about the
extent and type of school reopenings and the factors affecting these decisions. We also include
information on college reopenings, as these are potential confounders in our analyses. This
discussion also helps us understand the data generating process and identify appropriate
identification strategies.
 Second, we consider what is known about how COVID-19 typically spreads in the
population. This is important particularly for determining how we set up and interpret our
econometric model, i.e., how the length of the virus incubation period and development of
symptoms affect the expected lag between school reopenings and hospitalizations.

II.A. School and College Reopening Rates, Modes, and Predictors

 Several ongoing data collection efforts focus on analysis of the reopening of urban
schools. The Center for Reinventing Public Education (CRPE, 2020), tracking 106 mostly large
urban districts, shows a gradual decline in the percentage of districts operating with fully remote
instruction. CRPE projected that, by the end of October, 37 percent of schools would be fully
remote (down from 76 on September 7) while the number that are fully or mainly in-person has

9
 The study in Germany only covered a three-week post-opening time period (less than half as our study);
however, virus transmission and incubation do normally occur within this time frame.

 6
stayed relatively steady at 18-19 percent.10 That early-fall period is most relevant to the analysis
that follows, but the numbers have remained fairly stable. As of early January, the Burbio data
for large districts suggest that 42 percent are operating in person.11
 Schools vary widely in their approach to reopening. Almost all reports, for example,
indicate that districts allowing students back in-person at all bring back elementary age students
first, and fewer high school students. Reopening decisions have also been driven by state
policies. The states of Arkansas, Florida, Iowa, and Texas have required public schools to give
parents the option for in-person instruction. Rhode Island and some other states have also placed
strong pressure on districts to offer in-person options.
 Others have studied the factors affecting state policies as well as more localized school
reopening decisions. Perhaps surprisingly, the COVID-19 positivity rate has not been the
strongest predictor of reopenings; instead, the strongest predictor is the political persuasion of the
local population (Hartney & Finger, 2020; Valant, 2020). School reopening became a polarizing
issue as President Trump and Secretary DeVos pressured schools to reopen in-person. Prehaps as
a result, and even after controlling for other demographic differences, those areas with strong
Trump support were much more likely to offer in-person options (Hartney and Finger, 2020;
Valant, 2020).
 Hartney and Finger (2020) also report a positive association between the number of
private schools located in the district and reopening in-person. Private schools were under much
more pressure to reopen because of their nearly complete dependence on tuition revenue; this
might also be why they reopened faster than public schools in the spring (Harris et al., 2020).
Traditional public schools may have worried that they would lose enrollments to private schools
if they opened too slowly.
 Teacher union power is another factor and one that figures prominently in the analysis
that follows. The Hartney and Finger (2020) study also concluded there was a role for teacher
unions, but had to base this conclusion on district size as a proxy for union power. This is
problematic given the other ways in which district size might affect school reopening that the
study did not account for. Nevertheless, as we show later, actual data on unionization intensity
reinforces that this was a strong predictor of school reopening mode.
 Understanding the factors determining school reopening decisions is important to
estimating their effects on hospitalizations. In particular, we can expect teacher unionization to
have minimal impact on the rate of COVID-19 hospitalization aside from its effects on school
reopening mode. This creates a natural instrumental variable. Political persuasion and the
number of private schools, in contrast, are likely to directly affect hospitalizations, e.g., political
persuasion likely affected mask-wearing and social distancing and private schools, especially
those that reopened in-person, could spread the virus on their own, independent of the opening

10
 Similarly, in another survey of the 50 largest districts, the Washington Post reported that 24 districts
reported “in-person classes for large groups of students” and another 11 planned to do so in the
forthcoming weeks. https://www.washingtonpost.com/education/school-districts-reopening-
coronavirus/2020/10/19/3791c952-0ffb-11eb-8074-0e943a91bf08_story.html
11 Source: Author’s analysis. See more on Burbio data below.

 7
decisions of traditional public schools. We discuss our use of teacher unionization as an
instrumental variable later, in section III.
 Another factor that could affect SARS-CoV2 transmission and hospitalization is college
reopening. Like private K-12 schools, most colleges (even ostensibly public ones) are heavily
dependent on tuition, fees, and room and board for their financial survival. However, colleges are
apt to spread viruses, especially in residential colleges where students come from a distance and
live in dormitories or other group housing. Students are likely to bring the virus to campus with
them, to spread the virus in dorms and social settings, and then to bring the virus back home
during breaks and vacations. Multiple studies have shown increased COVID-19 positivity of
college-age adults and in the general population living near colleges (Anderson et al., 2020;
Salvatore et al., 2020).
 For this reason, it is important to account for the potential effects of in-person opening of
colleges as we consider how school reopenings affect health outcomes. The instrumental
variables method largely addresses this possibility (see below). However, we also test the
validity of our IV estimates by: (a) including time-varying college reopening mode as a covariate
in some of our models; and (b) estimating the first stage of the IV model regression where we
attempt to predict the county’s college reopening mode (hybrid/in-person) using the county’s K-
12 teacher union power.

II.B. SARS-CoV2 Infection and Relation to COVID-19 Hospitalizations

 One challenge of the pandemic has been tracking its expansion. We have a number of
tools in use to meet this challenge, but each has distinct shortcomings. To understand this, we
need to start with how SARS-CoV2 progresses in human hosts and the opportunities provided
for detection or diagnosis of the infection.
 We all share a vulnerability for infection upon exposure to the virus. When a human is
exposed to any viral pathogen, the immune system reacts by a number of pathways, including
one which produces potential markers of infection, i.e., antibodies. These antibodies have not
been a reliable tool for the identification of persons actively infected with SARS-CoV2.
 While the virus is replicating in the human host, it may be unrecognized, and an infected
person can transmit the infection to others. This infectious phase is when viral detection
diagnostic methods become useful and tracking of active human infections is possible. In the
case of SARS-CoV2, the time needed to reach a detectable level of virus in a human host can
range from 1-14 days, with most individuals reaching a detectable viral load around 4-7 days
after an infection event. Recent research indicates that 97 percent of infected persons will have a
detectable viral load by day 11 post-infection (Wiersinga, et al. 2020). While the virus is
replicating, the body’s immune system is mounting its response which will, within roughly 2
weeks, contain the infection, and disrupt further replication as well as the potential for
transmission to others. Given these constraints, timing of viral detection tests is critical to the

 8
detection of the active infections which drive expansion of the pandemic, and significantly limits
the accuracy of virus tests in delineating viral expansion in populations (CDC, 2020).
 Given the issues with antibody and virus tests, our ability to accurately assess current
levels of actively infected persons is not robust. Implementation of testing efforts is not
consistent across communities, nor even over time within communities. There are many reasons
for this heterogeneity, ranging from availability of test kits and personnel to administer them,
willingness of persons to participate in voluntary testing programs, and support for large-scale
testing efforts by some local and state governments. The selection processes inherent in this
heterogeneity complicates interpretation of test results, expressed as case counts, cases per
population, and/or test positivity (the number of positive tests/tests performed). At any point in
time, we must assume that the cases detected are an underestimate (of unknown magnitude) of
the actual number of persons infected, which provides an incomplete picture of the expansion of
the pandemic.
 Another approach is to track clinical, symptomatic disease as a key health outcome. The
SARS-CoV2 virus appears to cause some form of clinical illness (COVID-19) in 60-70 percent
of infected persons, with a substantial percentage of those ill persons experiencing very mild, and
potentially unrecognized or discounted disease, which may not be captured in any medical
interaction (Wiersinga et al., 2020). It is also a lagging indicator, as persons with SARS-CoV2
may develop serious disease requiring hospitalization anywhere from 1-4 weeks post infection
(Wiersinga et al, 2020). Given that symptoms of infection generally occur 4-7 days after exposure,
if school reopening increased infections leading to hospitalizations, we would expect to see a rise
in COVID-19 hospitalizations 2-5 weeks after schools reopened, if schools are spreading the
virus.
Accessing medical care for symptomatic disease, and especially hospitalization for serious
illness, which constitutes an estimated 5-10 percent of SARS-CoV2 infections, appears to be one
of the most stable and reliable measures we have available to track the clinical impact of SARS-
CoV2 (Wiersinga et al., 2020). Persons experiencing shortness of breath, and other debilitating
symptoms will seek care out of necessity, even if they might normally have a variety of barriers
limiting their interaction with healthcare. Since there appears to be less selection bias in
hospitalizations compared with positivity rates and related measures, we focus our analysis on
COVID-19 hospitalizations, allowing for a 2-5 week, or longer, lag to capture the effects of not
only initial infection and disease associated with school opening, but also the effects of
subsequent generations of infection which may be produced.

III. Data

 We study the effects of school reopening on hospitalizations for COVID-related
diagnoses at the county level. Three key variables drive the analysis: the timing and mode of
school reopening, teacher unionization (the instrumental variable), and hospitalizations. We
discuss these below in turn.

 9
III.A. School Reopening Data

 There are three data sets on school reopenings that are at least partially publicly available
that include large national samples of school districts: Education Week, Burbio, and MCH
Strategic Data. All three collected data on the date of reopening and the instructional mode: fully
in-person, fully remote, and hybrid. These data sources have not provided clear definitions about
the precise distinctions between these categories or how they were operationalized.
 The trade publication, Education Week, began collecting data on school reopenings from
school websites in the summer for 907 of the nation’s largest districts. This constitutes roughly
seven percent of districts but a much larger share of the nation’s public school students. While
not a random sample, Education Week also sought at least five districts per state, since many
states do not have large districts by national standards. Nevertheless, the relatively small, non-
representative sample is problematic. For this reason, we include Education Week data for some
descriptive analysis, but do not include it in our main analyses.
 The private company, Burbio, also collected data from school websites, but from a larger
sample of 1,200 districts, again mostly larger districts. Burbio aggregated these data up to the
county level. The least populous counties, which account for 25 of the student population, are
imputed from other nearby counties. Finally, MCH collected data primarily by calling essentially
all school districts in the United States by phone.12
 Table 1 shows the percentage of schools opened in instructional mode, according to each
data source. The figures vary across sources. For example, the percent in-person ranges from 19
percent in MCH to 43 percent in Burbio and the percent remote varies from 24 percent in MCH
to 49 percent in Education Week. This is no doubt partly a function of the differences in samples,
e.g., Education Week’s sample is more heavily urban, which likely explains why more districts
are labeled remote.
 The differences in school reopening modes across data sources are also likely partly due
to the ambiguous (and generally undefined) nature of the “hybrid” mode. This category may
include districts where elementary schools reopened partially in-person, but where other schools
remained fully remote; or it might include districts where elementary schools were fully in-
person but secondary schools were fully-remote; and districts where all schools opened to
partially-in-person instruction. Those creating the data could have used different definitions and
coding procedures, which, in any event, are not available. As a further check, note that Burbio
reports 35 percent of districts being fully remote as compared with 42 by the Center for
Reinventing Publication (2020) as of early October.
 The three data sources have greater overlap in the opening dates, however. For example,
95 percent of the 907 Education Week districts are listed as having opened in the same week as
the same set in MCH. (The overlap is somewhat lower in the Burbio data.). Nevertheless, given
the differences in definitions and/or coding of instructional mode, we use both Burbio and MCH

12
 MCH also did some web scraping (later verified by phone calling) and sent surveys to some districts.

 10
in most of the main analyses. (The Education Week data provide too few observations and are
used for diagnostic purposes.)
 One challenge in understanding the extent of in-person instruction is that many schools
are allowing students to continue learning remotely even when the schools are officially “fully
in-person.” One of the few studies to differentiate the two is from Michigan where a detailed
analysis of district plans found that 16 percent of districts gave a hybrid option, while only 14
percent were remote only (Education Policy Innovation Collaborative, 2020). Also, 53 percent of
students had an in-person option, but, again, a much smaller share was likely actually attending
in person, especially on a full-time basis. This highlights an important distinction between school
reopening policies regarding instructional modes and actual student experiences.13
 None of the three data sources explicitly include charter or private schools. However,
note that nearly half of charter schools are authorized by traditional public school districts and
likely followed the districts reopening plans. Private schools are not obligated to follow district
reopening policies, but these constitute fewer than 10 percent of all elementary and secondary
schools and an even smaller percentage of the U.S. school-age population; therefore, this is
unlikely to affect our results.14
 While the Burbio and MCH collected data on a continuous basis and therefore have
information about changes in reopening status, we focus our analysis only on the initial fall
reopening and do not attempt to account for changes in instructional mode over time. This is for
two main reasons. First, the data on the timing of those changes is likely less accurate than the
initial reopening; Burbio and MCH began collecting data before schools reopened and had many
weeks to reach schools and collect data before any changes occurred. However, the situation
became more fluid after the first month or so of the semester and the rate of data collection may
not have kept up with the changes. Second, even if we had more recent data, any subsequent
changes likely involve endogeneity in the dynamics of school reopening that would be difficult
to account for in any empirical analysis.
 To test whether the focus on just initial reopening is likely to affect our results, we
created a transition matrix, which shows the percent of districts that initially opened in which
mode in the fall (time t) and the mode shown in the data as of October 10 using MCH data (see
Appendix Table 1). The results suggest that two-thirds of districts were still in the same mode as

13
 Given that many schools are offering the option of reopening, surveys of parents might seem to be a
better source of the extent of in-person instruction. However, we are not aware of good estimates. Since
early August, the U.S. Census has been collecting biweekly survey data on the percentage of students
attending school to varying extents. Nationally, as of October 14-26, 82 percent of families report remote
instruction. Unfortunately, the Census survey items do not distinguish fully remote learning and hybrid
(i.e., the combination of in-person and remote), which is problematic since other evidence suggests that
these are the two most common categories.
14
 Even aside from the small number of charter and private schools, their omission does not affect the
results if they opened either: (a) in the same fashion as nearby traditional public schools we observe; or
(b) they opened differently than traditional public schools but in a way that is similar across counties
within states (more on this later). Other data suggest that these schools did open faster in the spring
(Harris et al., 2020) and anecdotal evidence suggests they opened in-person more commonly this fall as
well

 11
of October 10. This reinforces the usefulness of focusing identification just on the initial
reopening period. This is the time period where the data are most accurate and stable and where
we can cleanly identify effects.
 The Burbio and MCH data are at the county and district level, respectively. As discussed
below, we can also convert the hospitalization data to the county level (weighting by district
enrollment) therefore the county is the main unit of analysis in the study.15

III.B. Teacher Bargaining Power

 For the instrumental variables analyses, we use data on teacher unionization from the
1999-2000 public use Schools and Staffing Survey (SASS) form the National Center for
Education Statistics of the U.S. Department of Education. The SASS is collected on a nationally
representative sample of teachers and administrators periodically. The data include information
for 4,690 school districts, or a bit more than one-third of the total. Like the other education data
in this study, the unionization data are aggregated to the county level; we use the (weighted)
average of the available districts to represent the county as a whole. This yields data for 1,854
counties of the roughly 3,000 counties in the U.S.
 There are newer waves of the SASS, but the use of these older data is necessary to allow
the linkage to hospitalization data.16 Some changes in teacher unionization have occurred since
2000 as some states reduced the power of teacher unions; however, there is little reason to expect
that this would affect our results. The 2000-public-use and 2011-restricted-use SASS data sets
are correlated at +0.80 on the teacher bargaining power variables. Later, we discuss robustness
checks that involve dropping states that have had significant statewide changes in collective
bargaining, which has minimal effect on the results.
 The SASS reports two types of teacher unionization: collective bargaining and meet and
confer. The former means that the district administration is obligated to bargain with the union,
while the latter means that district administration has volunteered to confer with teachers over
issues similar to those that are the subject of collective bargaining, even though such agreements
are not legally binding as contracts. These two teacher bargaining variables are therefore ordinal,
with collective bargaining at one end, no teacher agreements at the other end, and meet and
confer providing a middle ground of teacher bargaining power.
 Some of the variation in teacher bargaining power is at the state level as some states bar
collective bargaining for public employees. However, all but nine states have some meet and
confer districts and, in states where collective bargaining is allowed, the teachers in some
districts have not voted for collective bargaining. This creates variation within states that allows

15
 School districts almost always fall within a single county. In some cases, especially in the South, the
county and district are coterminous.
16
 The restricted use SASS data cannot be moved from the secure computers; the same was true of the
hospitalization data. Using the public use SASS allowed us to move the data into the hospitalization files.

 12
us to keep all states in the analysis and still use fixed effects, which are helpful for absorbing the
influence of time-invariant factors such as unobserved state policies and political orientation.
 Table 2 reports each state’s legal status of unions, the number of total school districts in
the state, the number of districts for which we have SASS bargaining power data, and the shares
of those districts that are labeled as collective bargaining and meet and confer. As expected, we
see zero or near-zero numbers of districts reporting collective bargaining in the states where it is
barred. This reinforces the validity of the data.
 One limitation, however, is that only roughly half the states have much variation in
teacher bargaining power, which is necessary to use these variables as instruments where the first
stage includes state fixed effects. Also, the states with the most variation in bargaining power
tend to have small populations and be located in the South and Plains states.17 Since COVID-19
spread is thought to be biologically universal, we do not expect this to influence the general
findings, but the differences in results could reflect effect heterogeneity, which we test for.

III.C. Hospitalization Data

 We use two sources of hospitalization data. First, we use medical claims data from
Change Healthcare with approval from the COVID-19 Research Database.18 We also use
nationwide facility-level data from the U.S. Department of Health and Human services (HHS).
 Change Healthcare is the nation’s largest claims clearinghouse with a network of 900,000
providers and 5,500 hospitals across the country, processing nearly 55 percent of all commercial
claims (including Medicaid Managed Care and Medicare Advantage, but not Medicare FFS) in
the U.S for nearly 170,000,000 unique individuals. Change Healthcare provided us with de-
identified claims within days after claim processing. We were not provided with all claims in
Change Healthcare’s database. Instead, we received a longitudinal dataset of claims for
individuals ever diagnosed with COVID-19. Specifically, we received all in-patient claims for
any patient ever observed with a COVID-19 diagnosis using the International Classification of
Diseases (ICD) codes: U07.1 and U07.2.19 We observe the entire record for those patients pre-
and post-the COVID-19 diagnosis.
 From this subsample, we count only inpatient hospitalizations (including through
emergency rooms) with diagnoses of COVID-19 or COVID-19 related symptoms.20 The
resulting sample is 660,000 COVID-19 hospital admissions to the inpatient setting or the

17
 There are 19 states that have between 10 and 90 percent in either the collective bargaining and meet
and confer categories. These are (alphabetically): Alabama, Alaska, Arizona, Colorado, Idaho, Kansas,
Kentucky, Louisiana, Missouri, Montana, New Mexico, North Dakota, Oklahoma, South Dakota,
Tennessee, Utah, Virginia, West Virginia, and Wyoming.
18
 https://covid19researchdatabase.org/
19
 We also received outpatient and prescription drugs information, but we do not utilize these data in the
current analyses.
20
 Specifically, we use codes: using 10 ICD codes (U07xx, R50xx, R05xx, R06xx, J18xx, J17XX, J96XX, J80XX,
J12XX, J20XX, J40XX, J22XX, J98XX, Z03.818, Z20XX, Z11XX. These codes were obtained following CDC covid19
coding guidelines https://www.cdc.gov/nchs/data/icd/COVID-19-guidelines-final.pdf

 13
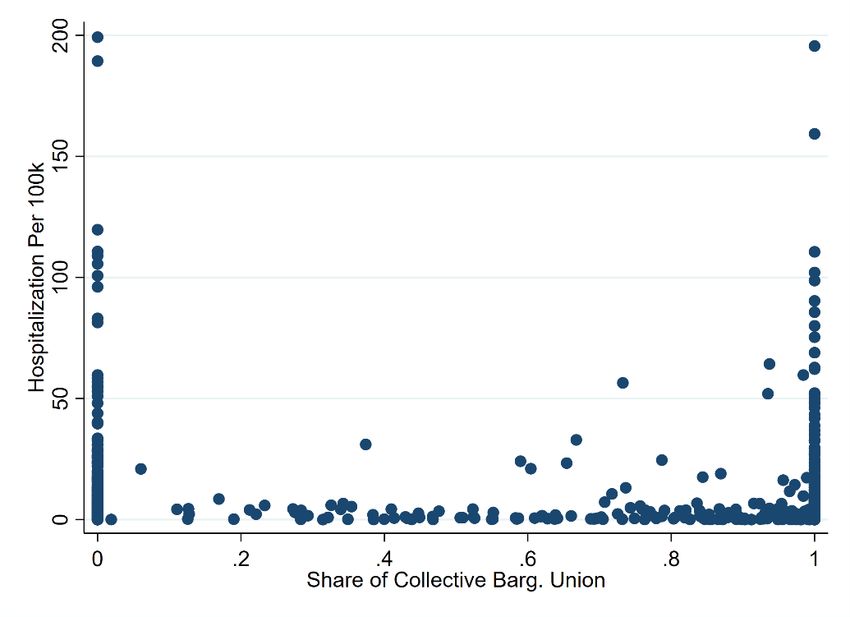
emergency room between January 2020 and October 2020.21 For this group, we observe the
patient’s admission date, discharge date, diagnosis, facility type of admission (inpatient,
outpatient, ER), gender, 3-digit zip code of patient’s residence, year of birth and a de-identified
token that allows us to link the patient’s records over time. (We do not observe information on
race/ethnicity.)
 To give an example, consider a patient who tests positive for COVID-19 in March 2020
(ICD -U07xx) and is therefore observed in our subsample. Subsequently, in September 2020, she
was hospitalized for a bladder infection. We do not count this encounter as a COVID-19
hospitalization because bladder infections are not COVID-19-related. Now, consider a patient
who is diagnosed with COVID-19 (ICD U07xx) and subsequently admitted for Acute
Respiratory Distress Syndrome (eg: ICD J80); we count this as a COVID-19 related admission
(even if the inpatient admission did not explicitly state a COVID-19 ICD-10 code).
 Since we received data at the 3-digit zip code, we generate county-level data, by
reconfiguring the 3-digit zip code level data to the county level. Specifically, to convert to
counties, the 3-digit zip codes were first converted to five-digit zip codes by distributing the
share of hospitalizations across the appropriate zip codes based on population proportions. This
assumes that the distribution of hospitalizations follows the same distribution as the population.
Zip codes were then converted to counties using a zip code-county crosswalk provided by the
Department of Housing and Urban Development.22
 We summarize the trend in COVID-19 hospitalizations in our data in Figure 1A. These
data highlight the steep changes in hospitalizations. The hospitalization rate peeks in week 42
(mid-October) at 15 hospitalizations per 100,000 in the population. While not shown, this trend
reflects a heavily skewed distribution, with most counties having zero hospitalizations and some
have more than a thousand. (As these are per 100,000 in the population, they account for wide
variation in county population size.)
 In addition, on Dec 7th, 2020, HHS released nationwide hospitalization data that was
collected by Teletracking (a third-party contractor). This dataset includes capacity reporting from
almost all individual hospitals in 2,200 counties23. Specifically, the data report weekly counts of
confirmed and suspected COVID-19 admissions at the hospital level starting from the week of
July 31st 2020. The term “suspected” is defined as a person who is being managed as though
he/she has COVID-19 because of signs and symptoms suggestive of COVID-19 as described by
CDC’s guidance, but does not have a laboratory positive COVID-19 test result. This may include
patients who have not been tested or those with pending test results and patients with negative
test results.

21
 The January 2020 data includes admissions for symptoms related to Covid-19 even if Covid-19 was not explicitly
stated at time of admission.
22
 This approach has been used before for example when studying the distribution of opioid prescriptions
across counties from 3-digit zip code data from the Drug Enforcement Agency (Kaestner and Ziedan
2020, among others).
23 The HHS data does not include hospitals associated with the Veterans Affairs system or rehabilitation

facilities.

 14
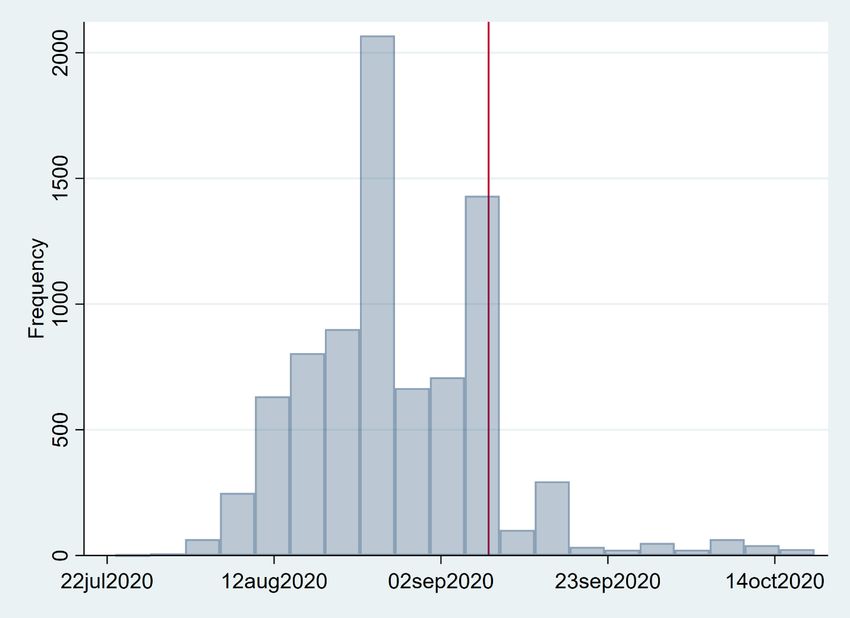
Figure 1B presents nationwide trends in suspected, confirmed, and total (suspected plus
confirmed) admissions over time from the HHS facility-level data. Until week 42, the number of
hospitalizations for COVID-19 suspected cases surpassed the number of hospitalizations for
COVID-19 confirmed cases. After week 42, the number of hospitalizations per 100k for
confirmed COVID-19 cases surpasses the suspected per 100k admissions. This pattern maybe
due to increases in testing availability and turnaround time. Since the Change Healthcare
COVID-19 admissions are for those with positive COVID-19 tests, the counts per 100k from
Change Healthcare (Figure 1A) are most comparable to the counts of confirmed cases in Figure
1B. Also, the number of hospitalizations (per 100k) at any given time may be higher in the HHS
data because our insured sample, which excludes Medicare Fee for Service patients, is younger
and likely less likely to become symptomatic than the overall population.
 Both data sets are useful for purposes of this analysis as they both include large and
consistent samples of institutions (insurers and hospitals, respectively). However, the Change
Healthcare data come with three advantages that lead us to focus on these in our main results.
First, the Change Healthcare data start on January 1st 2020 and provide a longer time series with
which to test for parallel trends. In contrast, the HHS data start on August 1, within four weeks
of the start date of 57 percent of school districts.24
 In addition, the Change Healthcare data provide much more detail regarding patient
diagnoses and allow us to define cases ourselves in a standardized way. In contrast, the HHS data
rely on the somewhat amorphous notion of “suspected” cases; more generally, the HHS data rely
more on the reporting discretion of hospitals than the Change Healthcare data.
 Finally, the Change Healthcare data map COVID-19 hospitalizations to the residence of
the patient, which is likely closer to the point of virus transmission (from school reopenings or
otherwise). In contrast, the HHS data use the location of the hospital. This could be a particular
issue in rural areas where hospitals may not be located nearby. Also, patients may have to travel
to more distant hospitals when they get sick if nearby ones are already full, or if more distant
hospitals have better health care and public health services generally for COVID-19; this
capacity to deal with the virus could affect the virus’s spread, creating an endogeneity problem.
For these reasons, we rely on the Change Healthcare in most of our analyses.
 Even with the richness of the individual-level claims from Change Healthcare, these data
also come with concerns about generalizability, changing samples, and measurement error. As
noted above, one potential problem is school reopenings might affect the insured differently from
the uninsured. Also, the percent of the population insured may have changed as insurance
coverage was dropped as a result of unemployment and the general economic slowdown, which
could occur differentially across counties in ways that are correlated with school reopenings.
That said, one recent report estimated that losses of employer-based coverage will be lower than
some expect across the last three quarters of 2020 because employment losses have been

24
 We observed 2,400 counties with school reopening dates in Burbio. Of them, 1,372 (57%) had opened their
school district(s) by August 30th 2020. Similarly, of 8,283 school districts in the MCH data 4,762 (57.4%) opened by
August 30th, 2020.

 15
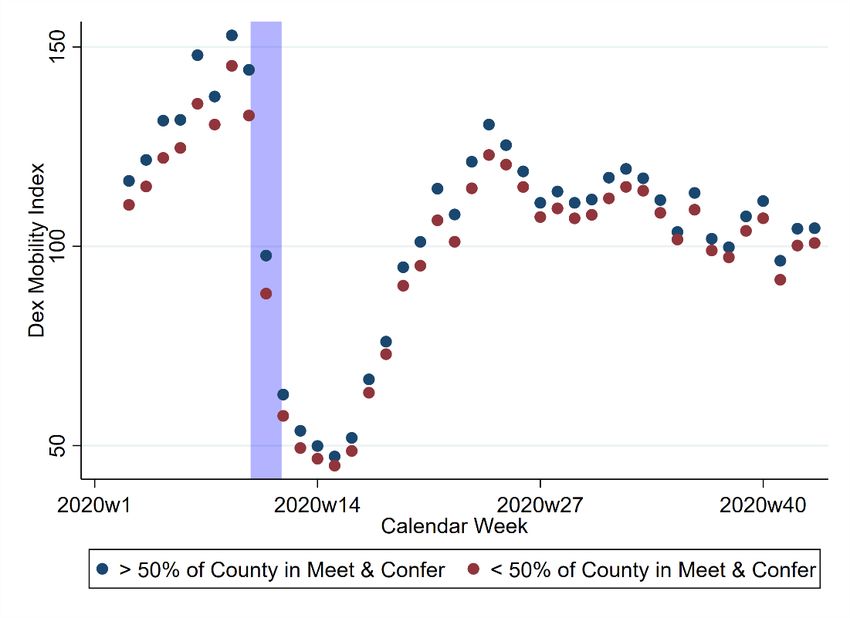
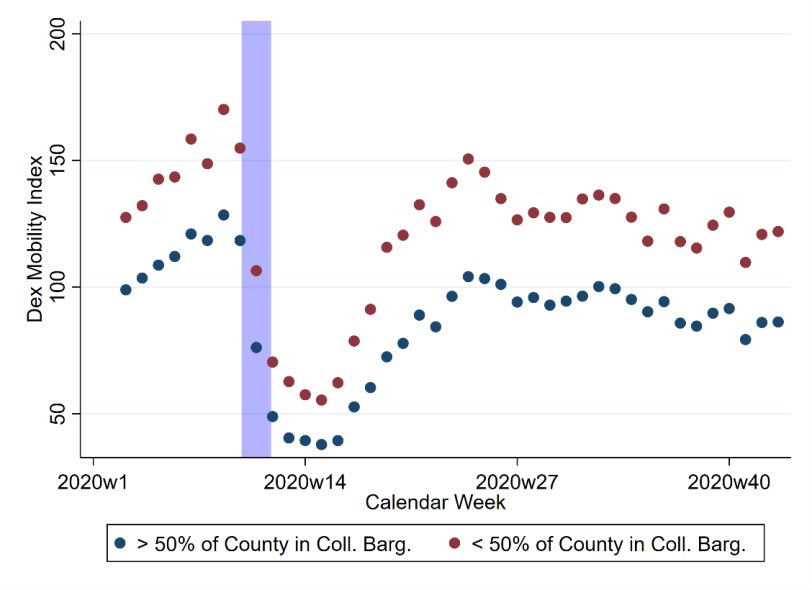
disproportionately concentrated among workers who did not have access to employer-based
coverage before the pandemic (Karpman & Zuckerman, 2020).25 Also, those who did lose
employer-sponsored insurance are eligible for ACA assistance either through Medicaid or
subsidized marketplace coverage (Kaiser Family Foundation, 2020). Since our data include
Medicaid Managed Care claims cleared by Change Healthcare, we are less concerned with
changes in the proportion of individuals moving from employer-sponsored insurance to
Medicaid coverage. In addition, Medicaid Managed care is a much larger group than Medicaid
Fee for Service (approximately 69 percent of Medicaid insured individuals are in Medicaid
Managed Care26). Further, even unemployment, insurance loss, and the mode of school
reopening were all correlated, this is still unlikely to bias our results unless the decline in
insurance coverage happened to coincide with the precise timing of school reopenings.
 A final limitation of the Change Healthcare data is that they have 3-digit zip code (of the
patient), which is less precise than the HHS’s 5-digit zip code (of the hospital). As described
above, some 3-digit zip codes are larger than counties, which required us to make assumptions
about how many occurred in each county, in order to link to the school reopening data.
 Overall, we view the Change Healthcare data as valid and reliable for purposes of
understanding the effects of school reopenings. They provide a large and consistent sample
covering half the U.S. population and provide more detail about patient symptoms and
diagnoses, as well as patients’ home addresses. Also, the main limitations noted above seem
likely to introduce only measurement and not bias our results. Nevertheless, we estimate our
main results using both data sets.

III.D. Other Data

 While the primary data sources pertain to school reopenings, teacher bargaining power,
and hospitalizations, several other data sources provide useful covariates and allow for additional
diagnostics of the main data sources.
 We merged the school reopening data with school district information from the National
Longitudinal School Database (NLSD), which includes all available federal education data from
the Common Core of Data (CCD) and district-level Census data. Most importantly, the NLSD
includes the county in which the school district is located, allowing us to merge the school re-
opening data with the health data (more on this below). In addition, the Census data in the NLSD
allow us to create useful variables for effect heterogeneity analysis.
 We use the Device Exposure Index (DEX) from PlaceIQ to measure social distancing.
The DEX index quantifies the exposure of devices to each other within venues. For a smartphone
whose “home” is in a given county, the DEX indicates how many distinct devices also visited in

25
 Link here https://www.urban.org/sites/default/files/publication/102552/changes-in-health-insurance-
coverage-due-to-the-covid-19-recession_4.pdf
26
 https://www.kff.org/medicaid/issue-brief/10-things-to-know-about-medicaid-managed-
care/#:~:text=Managed%20care%20plays%20a%20key,the%20fiscal%20implications%20for%20states.

 16
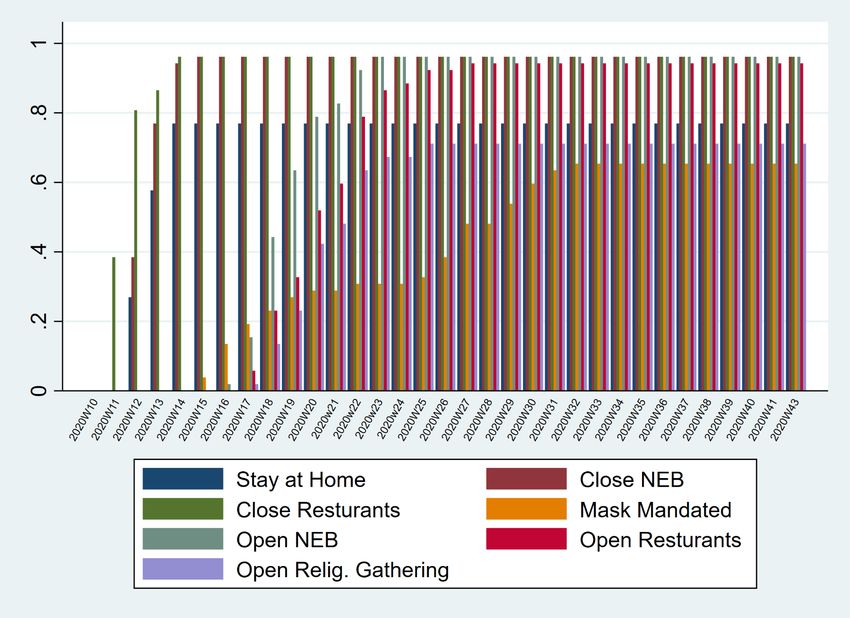
any of the commercial venues that the device visited in a given day. Other studies have also used
the DEX to study social mobility and distancing (Couture et al. 2020; Gupta et al. 2020; Painter
and Qiu 2020; Nguyen et al. 2020). To be clear, we use the DEX only to gauge the relationship
between our instrument and social distancing, since school reopenings are not the only factor
affecting distancing and therefore hospitalizations. This variable is only for diagnostic purposes
to better understand the instrumental variable.
 We also collected data on general state COVID-19 reopenings. Many states have
responded to the COVID-19 pandemic by enacting a variety of laws and policies related to
limiting the spread of the associated virus and ensuring that healthcare resources are freed to
absorb COVID-19 patients. To characterize state policies, we reviewed the range of policies and
dates of implementation used in prior studies (see Gupta et al. (2020a) and from institutions
tracking multiple sources for state policy dates such as the Urban institute27 and Boston
University.28 To accurately identify the implementation date of a policy and to classify in a
parsimonious way main elements of a state’s policy response, we focused on those that could
potentially affect COVID-19 hospitalizations through social interaction and mobility. Based on
our review, we chose the following policy measures: stay at home orders, non-essential business
closures, non-essential business reopening, restaurant closures, restaurant reopenings, mask
mandates and resumption of religious gatherings. Our list is not exhaustive of all state policies.
For example, we did not include in our models the date the states closed or reopened bars
explicitly, since most restaurants and bars resumed operations within the same week and if not
restaurants reopened first. Appendix Figure 7 summarizes the percent of states that had those
various general opening policies. These stabilized at the time that schools were reopened (see the
33rd week). So, while we control for these policies, there is little reason to think that changes in
state (or local policies) had an influence on the before-and-after periods of greatest relevance in
this analysis.
 Finally, we analyzed data on the timing and mode of reopening of colleges from the
College Crisis Initiative (https://collegecrisis.org/). We received college instructional modes for
2,984 colleges. These data cover mostly large higher education institutions in the United States
and identify whether a college opened mostly in-person, hybrid or remotely. Of that sample we
received dates of reopening for 1,430 colleges. These data are similar to the school reopening
data, so we observe the date and mode of reopening. We aggregate this information to the county
level and create a time-varying indicator in our DD models for whether the county has a college
that opened in-person or in hybrid mode at week t. If a county does not have a college present,
and to avoid dropping counties without colleges, we assume that variable is constantly zero in
those cases. We incorporate these data into our models and test the robustness of our estimates
when including college reopening information. We also estimate a “placebo” first stage where

27
 https://www.urban.org/policy-centers/health-policy-center/projects/covid-19-resource-tracker-guide-
state-and-local-responses
28
 https://www.bu.edu/sph/news/articles/2020/tracking-covid-19-policies/

 17
You can also read