REANALYSIS, OR RETROSPECTIVE ANALYSIS, IN METEOROLOGY - QUADERNI DI METEOROLOGIA APERTA
←
→
Page content transcription
If your browser does not render page correctly, please read the page content below

QUADERNI DI METEOROLOGIA APERTA                      n° 2

      REANALYSIS, OR RETROSPECTIVE
          ANALYSIS, IN METEOROLOGY

                                 Massimo Crespi1
                                 Gianluca Ferrari2

In Padova (Italy), autumn 2020

                                         1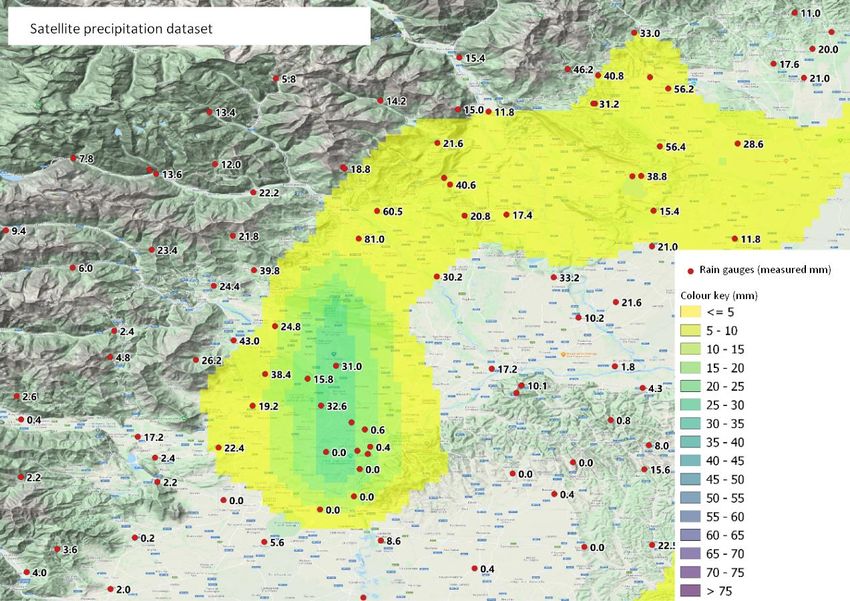
1. INTRODUCTION

1.1. Goals

Meteorology and climatology are gaining importance as quantitative variables in the design of forthcoming
and future configurations of the atmosphere, and in its interactions with man, society and the planet. This
process is encouraged by innovation and digital technology, which have triggered a growing demand for
representative and consistent meteorological records suitable for consistent statistical processing. This need
is met also by applying reanalysis or retrospective analysis techniques, which provide historical and near real-
time datasets arranged in regular territorial grids of varying size, obtained from in situ meteorological
observations.

At market level, we often come across proposals that have little to do with a methodologically correct
application of retrospective analysis. In Italy, if we rule out most of the world of risk management, this is due
to the inadequate specific preparation of users, caused by a lack of criticism and supervision by the academic
world and the institutions. This publication is not a scientific text, but a professional guide to the methods of
acquisition and use of data obtained through reanalysis, and its intention is to address the issue of reanalysis
in pragmatic and operational terms.

Other types of dataset, which have less statistical consistency but are still usable in defined and circumscribed
contexts, are also considered, with the aim of encouraging greater discernment by the user. These datasets
are grouped under the heading of “pseudo-reanalysis” and should not be confused with solid retrospective
construction, with which they compete easily with regard to price but not quality.

As the representativeness of meteorological data is always linked to the use made of said data, it should be
pointed out that this document does not refer to meteorological applications that have an immediate
operational purpose, the value of which is purely informative. It looks rather at the use of meteorological
information as part of a more complex process capable of representing a given state of the atmosphere at a
given time and therefore providing formal, and obviously conventional, content in contractual, insurance,
legal and other evidence-based contexts3.

In order to better define this framework, it should be noted that the text is based on countless in-house
experiences in supplying reanalytical services to risk management companies. The part covering regulations
refers to the indications of the WMO4 and the computations used have been produced by European and
international research centres.

Among the professional uses of climate reanalysis, the most prominent role is expected to be occupied, in
time, by the knowledge of the parameters related to global warming. Consequently, it will be destined to a
wide and transversal audience, before whom it must qualify as a credible and shared reference platform. This
raises a number of fundamental considerations. One of these is the urgent need to initiate public awareness
of meteorological and climatological issues, addressing all those who can or must help mitigate global

                                                       2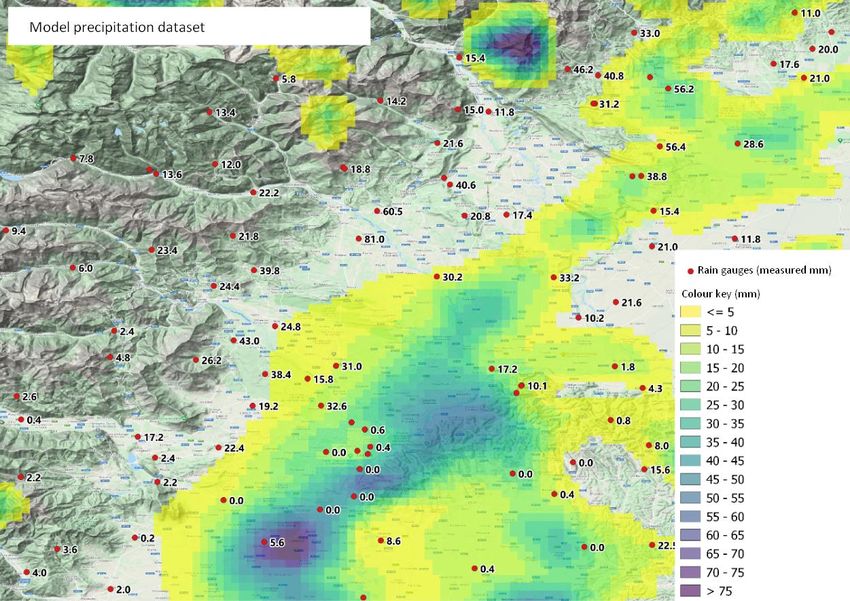
warming. Efforts must be made to enrich the content and multiply the options available, contributing to
broader inclusion, the sharing of choices and, consequently, increased success. These processes are not
defined by law. The worlds of culture and communication play a key role in them, being called upon to
broaden horizons and quickly overcome the narrow confines of meteorology, which has the technical role of
monitoring and certifying, but its limited representativeness and institutional weaknesses are unable to
sustain the cogency of decisions that are incisive and sometimes radical.

Reanalysis, which tells us about the past and forecasts the future, aims to fulfil this role using plain language,
not as some kind of vague oracle, shrouded in a technological haze, but seeking common roots and
vocabulary, to encourage a reading open to transversal paths and other sensibilities.

Once again, meteorology supplies technology, knowledge and sensitivity to offer a unified and global view of
the world, in keeping with its tradition since the birth of the IMO 5 in 1879, and its subsequent co-option into
the WMO4, in 1951, as the intergovernmental technical agency of the UN6.

1.2. Concise cultural contextualisation of the vectorial and
discretized reading of the physical world in the contemporary
era
Meteorological reanalysis is the tool used to quantify our planet's meteorological and climatic dynamics,
both overall, as planetary-scale phenomena, and on a more specific and local level. It gives us an organic and
unitary view of meteorological parameters, distributing them in a uniform grid, suitable for statistical
applications and sophisticated processing. This method is based on a historicist analysis of the past, as the
earth’s atmosphere, like the earth itself, evolves over relatively long periods of time, offering the attentive
observer a view of its trends. Assuming a panoptic continuity between past and future, from a long-term or
infinite perspective, the temporal parameter ceases to exist7. This paradox, which entraps even Zeno's
tortoise8, enables the development of historical series and datasets crystallised in regular grids, backed by a
correct, robust statistical approach that meets our needs.

The future nests in the past and a retrotopic effort9 is to make it easier to read, decipher and compare; in this
sense, reanalysis is a shared, common, objective field of verification and comparison. At times when
temperatures are particularly high, it is important to be aware that the knowledge, accessibility and
transparency of meteorological data, along with its accuracy, should be among the standards for measuring
the characteristics of an open society that is making slow and gradual human progress 10.

Climate is no longer a mere abiotic component of the earth's ecosystem, a factor with which humanity has
shared thousands of years and to which it has adapted, learning to cope with even its strongest
manifestations, albeit with varying periods of resilience. Tolerances, thresholds and return periods could be
exceeded in the years to come, and territorial, environmental, economic and geopolitical balances could be
shattered. So the problem is not technical; on the contrary, it must move outside the borders of digital

                                                        3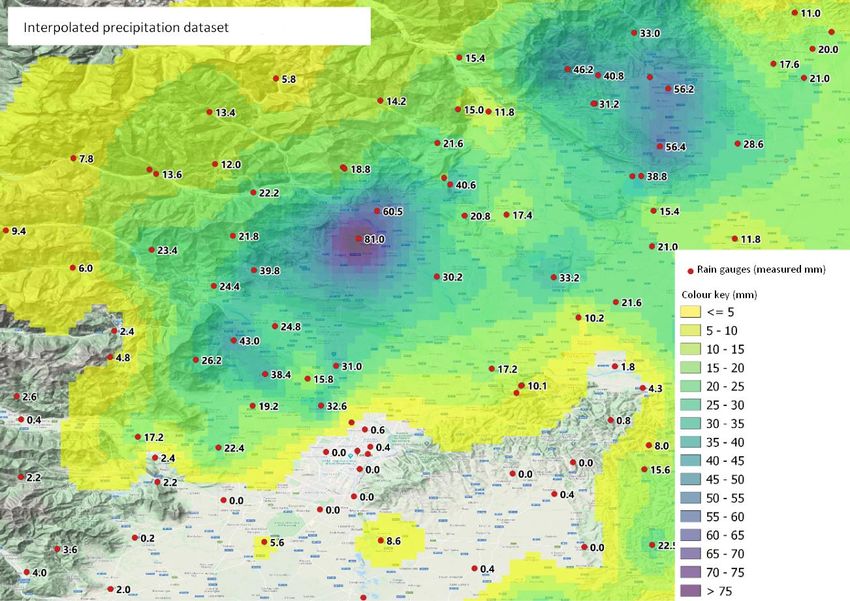
technological hyper-realism and open up to an epistemological paradigm that guarantees understanding,
sharing and awareness by individuals and society as a whole.

The product of reanalysis represents the matrix for objectively plotting and comparing all the different
sensibilities and policies. After all, meteorology and climatology are not detached from the historical, cultural,
social and economic context; they condition it and are, in turn, influenced by it. Growing general attention is
prompting a multiple reading, which could highlight aspects, contents and perspectives that have so far
escaped mere technical analysis and might have a positive and essential impact in terms of solutions and
their effectiveness. Goals of this kind require a strong thematic contextualisation and a historical association
that penetrates and highlights this sensitivity with other levels of knowledge, in order to allow its cultural
appropriation and widespread identification. Being the fruit of its own time, there is no lack of convergence
and affinity with the reanalytical approach, a small sample of which is proposed here in relation to more
recent years.

A fitting definition for this search for correlation, already ripe for the ensuing digital age, was coined in the
1970s by Henry Leborit11 who expressed the need to: “... imagine new conceptual grids, new structures that
capture the essential contribution of biological disciplines as a whole, not separately, but in an integrated form,
from physics to the human species in the biosphere, in the time of evolution and that of the individual, in the
gratifying space of a man and of all men, the planet”. It tells us many things: firstly, it presents a holistic vision
of the grid as a concept; it corresponds to the need for a discretized reading of the world, capable of
portraying large-scale syntheses and the finer details revealed through small-scale presentation; it converges
in man and what we know about him.

This is a structuralist reading, used, ahead of its time, by Claude Lévi-Strauss12 , in applying “savage thought”
to the great eschatologies, and discovering a humanity or, better, a group of individuals, in constant search
of their place in the universe, and hence a better definition of it. This reading is widely confirmed, discussed
and developed by Zygmunt Bauman13 in his portrayal of the individual lost in the sea of liquidity and of a
“modernity” that consists in a constant chase towards an elusive “post-modernity”.

If we wish to mention another convergent starting point in this innovative vision of the physical world, we
should consider the figurative arts, which encompass this experience in their forms and content, offering an
effective, open and universal vision, in keeping with their nature. This seed was sown at the end of the 19 th
century in the refined pictorial research of Georges Seurat who, during the lengthy period between
Impressionism and Expressionism, used pointillism14 to entrust the abstract power of the pixel to canvas. In
its dual role as vector and follower, the pixel transcends the progressive shades of colour to lend subjectivity
and authority to every point of the palette and, with Vincent Van Gogh, to every brushstroke. It is a technique
which, thanks precisely to its pointillist matrix, can display different views of reality, with more or less detail,
more or less depth: from the scant brushstrokes of a landscape synthesis, indicating the application of a fairly
loose mesh for each individual stroke (Figs. 1 and 2), to an analytical breakdown of colours, placed side by
side in an infinitesimal grid, in which the individual pixels almost vanish in the overall image, only to reappear
upon closer analysis of the detail (Figs. 3 and 4).

                                                          4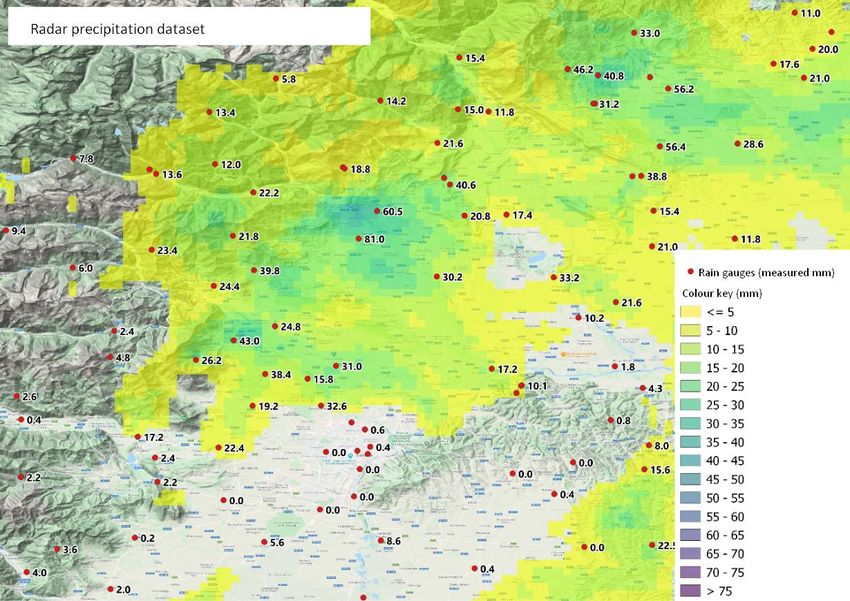
Fig. 1 Paul Signac: “Trees in bloom”. Late 20th century

Fig. 2 Giuseppe Pellizza da Volpedo: “Washing in the sun”. 1894

                               5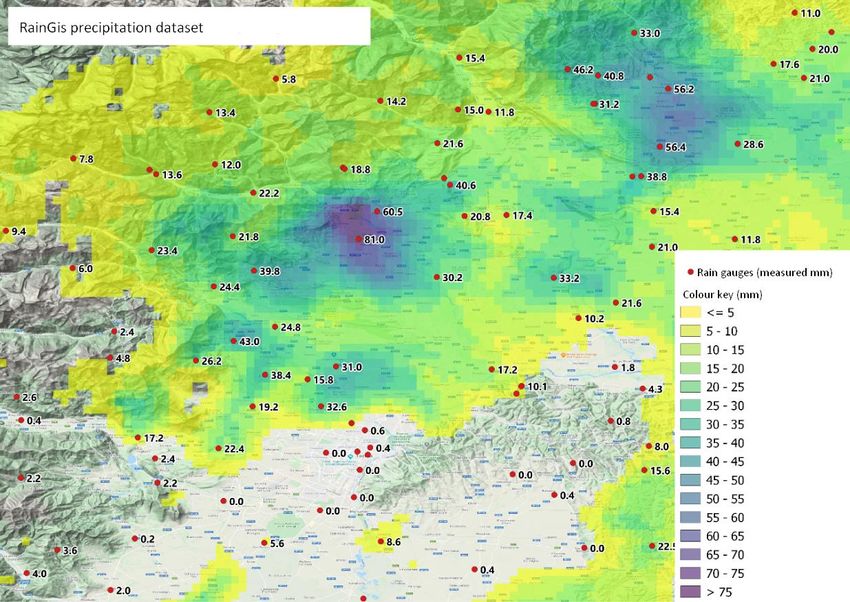
Fig. 3 Georges Seurat: “A Sunday Afternoon on the Island of La Grande Jatte”. 1884-86

                  Fig. 4 Georges Seurat: “A Sunday Afternoon on the Island of La Grande Jatte”.
                                                Detail. 1884-86

Reality materialises and chooses its own forms of representation, the product of a threefold
contemporaneity: of the contingent expressive and cultural moment, which provides the technique and
technology used, of recent and remote influences, with their nostalgia and their signs, and, lastly, of the often
elitist and isolated future vision.

                                                       6
These are profound archetypes, proposed here in their most recent or contemporary interpretations, but
which have distant and remote origins in myth, and in its gradual evolution towards transcendence.
Nowadays, this arcanum is entrusted, at least in part, to digital technology, and converges in an
anthropological portrayal of man in a frantic search for his place in the universe, through a process
characterised not so much by an inescapable temporal constant as by a shift in spaces and contexts, the
relentless liquidity of which drives us to constantly seek safer islands, defined by the rigour of metadata.

1.3. The Italian scenario

The theme of reanalysis is touched marginally by Italian academia, with a vision limited to applications that
are often detached from the economic and social context. For their part, the public meteorological
institutions have insufficient knowledge or at least inadequate operational skill. This is due to the severe flaw
represented by the absence of a National Meteorological Service and its breakdown into a myriad of local
offices and agencies, subject to constant and, unfortunately, reiterated attempts at coordination, which are
pointless when they lack the necessary constitutional seal. A lack of a national meteorological and
climatological vision thwarts the need for a higher level of knowledge, limits the commitment of offices to
operational activities and reduces international exchange, presence and coordination.

This structural poverty has opened the doors to commercial incursion by European and non-European
companies, which present large-scale reanalysis products or products obtained through pseudo-reanalysis.
In actual fact, Italy's historical heritage of meteorological data would allow the elaboration and proposal of
highly refined reanalysis products. Italy has an important meteorological monitoring system made up of
thousands of in situ stations, both public and non-public, the national network of meteorological radars and
numerous private lightning monitoring networks;

Moreover, the “Public Information Guidelines”    15
                                                      issued by the Agency for Digital Italy of the Presidency of
the Council of Ministers, as well as the ISTAT “Charter of services”16 provide a very advanced regulatory
programme in terms of the dissemination of data and the involvement of society in adding value to
meteorological observations, which should be considered as common public property.

1.4. The international and European scenario

The WMO4 devotes considerable attention to this technology. Its prospects and development are of strategic
importance as it is required to coordinate a set of observation systems distributed, in different densities and
with varying types of instrumentation, throughout the world, and used for a variety of purposes which are
not always climatological. Reanalysis is capable of systematising and adding value to this articulate
geography. This is because the datasets obtained produce continuous field estimates based on several
sources of observation, data for all points in space and time, and also make it possible to obtain
meteorological variables that are not easily or regularly observed. Consequently, it helps increase
meteorological knowledge in areas which had previously been poorly monitored or monitored in relation to

                                                          7
secondary parameters. This said, it most certainly cannot replace a good observation system which, despite
various weaknesses, is the only way to extract a good reanalytical product.

A key point in the WMO policy is represented by the indication that the datasets obtained have to be
digitised to standard formats, in order to make as many observations as possible freely available and ensure
that they are supplemented by an adequate framework of metadata. The WMO also presents a list of
possible users:
    •   independent assessors,
    •   members of the public,
    •   businesses,
    •   society in general,
    •   organisations in general,
    •   operators in the sector,
    •   those with an interest in meteorology and climatology,
    •   those with a historical, cultural or statistical interest,
    •   those with an interest in global warming.

From an analytical viewpoint, weather and climate datasets obtained from observations cannot be
considered as absolute values. They should be seen as points of convergence of assumptions related to the
measurement of a specific atmospheric variable for a determined purpose. As such, the organisation would
like to point out that there is no one set of universal analyses that can be applied in all cases. As this goal is
unrealistic and inapplicable, the creation of several specific datasets for different uses, or sets of comparable
data placed side by side, is recommended. This option should lead to a qualitative improvement of the
datasets, as it subjects them to examination by users in the various fields of application.

At European level, this is a multifaceted issue: on one hand, the ECMWF 17, the independent
intergovernmental technical body that operates effectively and to the very highest standards in the creation
of global reanalysis datasets, and on the other, the Presidency of the Commission, responsible for defining
communication policies. Both have worked together for several years now to develop an open and free data
network in all sectors, particularly science. This commitment is summarised in the recent EU Directive
1024/2019 on “open data and the re-use of public sector information”, which offers an enlightened and open
vision and defines the supporting role to be undertaken by public administrations in their relations with the
public, the cultural and economic sectors, and society as a whole.

Outside of Europe, and particularly in the English-speaking world, leading institutes and research centres18
have been pursuing extensive liberalisation for years, both with regard to data obtained from observations
and reanalysis datasets.

                                                           8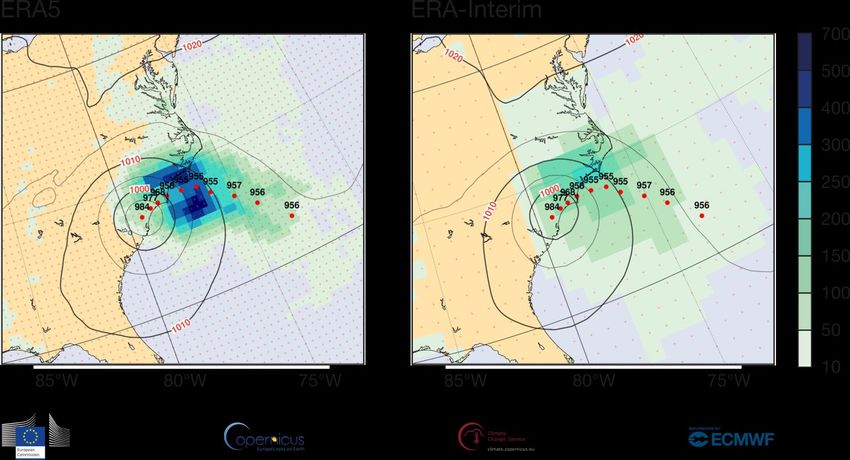
2.      METEOROLOGICAL                         REANALYSIS                 (OR         RETROSPECTIVE
     ANALYSIS)

2.1. Origin and outlook

The reanalysis technique was introduced and used to produce the first datasets in the second half of the
1990s, at a time when computer technology had developed sufficiently to support this type of particularly
complex and computationally demanding modelling analysis.

The origin of this requirement lay in the scientific community’s need to operate on data that is continuous
and homogeneous in terms of time and space, overcoming the problem related to the high rate of
discontinuity associated with traditional measures.

Subsequently, these datasets gained significant weight due to the considerable increase in demand from a
broad industrial market for more definite, precise and representative meteorology. Advanced digital
application sectors are now able to maximise the benefits of these products. In risk management, they play a
strategic role in the assessment of new formulas or types of policy (index, parametric) and in the
development of financial products like weather derivatives. In smart agriculture, they feed the DSSs19
extensively used in agronomy and at environmental level. In the activities of Utilities and Land reclamation
and irrigation authorities, and consequently in energy and the water cycle, they support the design and
management of networks and resources, as well as procurement and sales strategies. This extends to all
smart digital applications.

Lastly, with the insurgence of greater social sensitivity towards global warming, the cultural acquisition of
climatological sensitivity is evolving fully, both among certain social elites and several advanced political
entities, which have begun to accept this need, while not yet undertaking it sufficiently at practical level. The
issue, which seems to have gone beyond scientific standardisation, is still the preserve of descriptive and
generalist communication, which must be supplemented with a solid quantitative reference structure, to
define its dimensions and to monitor any mitigating effects that might be implemented.

2.2. Definition

In meteorology, reanalysis or retrospective analysis defines the scientific method used to create a global
archive of how meteorological parameters change over time. It combines simulation models with real
observations to generate a synthetic assessment of the state of the atmosphere. The datasets obtained
populate a regular grid system, the size and characteristics of which depend on the specific application
required. In logical terms, reanalysis is able to present a more coherent past that we were aware of, and to
use this knowledge to outline an equally historically reliable future.

                                                        9
Reanalysis is not a form of observation, but it generates data based on observations. These observations
supply the essential informative content of the products and also define their qualitative level or precision.
The complexities and uncertainties of the observation system, the selection of data, quality control and the
correction of bias, can be crucial to the outcome of the process. In other words, reanalysis without
observations is purely a modelling process and the resulting dataset is destined to be affected by all the
associated weaknesses.

Reanalysis allows the development of datasets of past weather and climatic trends, both near real-time and
historical, being able to reach as far as the first series of reliable instrumental observations. Consequently, it
represents a crucial tool for studying climate change and understanding climate mechanisms, and, as such,
can be considered one of the main developments of recent meteorology and climatology.

             Fig. 5 Schematic representation of a global grid obtained using the reanalysis process

2.3. Highlights

Starting from an adequate basis of observations, reanalysis is capable of generating meteorological datasets
with the following characteristics:
    •   complete coverage of the earth’s surface,
    •   extensive representation of the effective weather and climate trend across the entire geographic area
        covered, even in areas with no in situ monitoring networks,
    •   elimination or reduction of discontinuity and a lack of spatial-temporal homogeneity.

                                                       10
Another particular feature is the distribution of this data in regular grids of different size, variable on the
basis of the specific application and accuracy required or possible (Fig. 5).
Temporal depth also depends on the type of use, in that it has to be functional to the visibility of the
weather-climate dynamics researched, which could be flattened within an excessively dilated scale.
2.4. Method
From the methodological point of view, reanalysis collects all the data measured by the various
meteorological monitoring systems (in situ and remote sensors); these are assimilated and processed by a
numerical atmospheric forecasting model, and may be post-processed using auxiliary co-variables (DEMs20);
the output of the process comprises the distribution of the data processed in a uniform grid, of variable
scale, which supplies information for each point of the domain, regardless of the presence, in that point, of a
meteorological station or a sensor (Fig. 6).
Fig. 6 The set of observations is the foundation for creating data grids using reanalysis
Two essential characterising elements are required for correct application:
• a deep and broad set of observations, which can come from different sources (in situ and remote),
• an atmospheric forecasting model and relative data assimilation system, the configuration of which is
defined clearly and does not undergo any change during the process.
Furthermore, in specific professional uses, it is often necessary to follow the reanalysis process with post-
processing operations, such as:
• downscaling using DEMs20 with a higher spatial resolution than the original dataset,
• reduction of bias with statistical processes (MOS21),
11• Correction of “derivative” fields, processed on the basis of the reanalysis modelling component
alone, without the contribution of observations (e.g., solar radiation, precipitation, etc.).
2.4.1. Observations
As already highlighted, reanalysis is not an observation, but it generates data based on observations, which
are the foundation of the process. In short, the aim of reanalysis is to consistently portray the observations
available.
Being the main feature of this technique, distinguishing it from other meteorological grid production
processes, observations must undergo in-depth selection. Suggesting the reading of “Characteristics and
Representativeness of Precision Meteorology in Italian National Context” 3, the meteorological data used in a
quality reanalysis process must come from adequate monitoring networks and use suitable and robust
datasets that fall within the following categories:
Characteristics of in situ networks:
• certified: these networks are subject to formal certification procedures with regard to the type of
instrumentation installed, the positioning of the survey sites, maintenance procedures and data
validation,
• WMO compliant: these are networks belonging to associations, research institutes, NGOs, land
management companies that comply with the installation, management, maintenance and validation
procedures defined in the WMO Guidelines,
• Official: these are networks belonging to governmental bodies and organisations that are legally
responsible for meteorological-environmental monitoring. The fact that they are official does not
always guarantee the quality of the network and its correspondence to WMO parameters.
Characteristics of remote sensing networks, used in first assimilation and in post-processing:
• meteorological radars,
• lightning detection,
• geostationary and polar meteorological satellites.
Data characteristics:
• accessibility: standard formats,
• continuity: included in a consistent historical series,
• availability: made available according to open data criteria,
• usability: can be acquired promptly,
• impartiality: not attributable to any party,
• transparency: accompanied by metadata,
• unambiguousness: they lend themselves to a single interpretation.
Dataset characteristics:
• continuity: in time and space,
• coverage: adequate and consistent,
12• invariance: over time of the same native dataset,
• homogeneity: representativeness remains constant in space and time,
• representativeness: defined.
Despite observing these standards, the assimilation system should also carry out a quality control on the data
available and eliminate the bias from certain sets of observations (e.g.: satellite), allowing the reanalysis to
obtain only those observations that are consistent with the real state of the atmosphere.
2.4.2. The atmospheric forecasting model and data assimilation system
In reanalysis, the data assimilation system is coupled with an atmospheric forecasting system; the first
“forces” the system to be consistent with the observations, while the second aims to obtain physical
consistency between the variables, keeping them in line with the laws of physics that govern atmospheric
motion. A sufficiently realistic model is able to extract information from the parameters observed at local
level and extend them to neighbouring locations, also over the course of time.
It should be noted that, in the case of precipitation, the model does not assimilate the data of the parameter
but develops it as a “derivative”, applying the resolution of differential equations that describe the
atmospheric dynamics using other basic variables, such as temperature, humidity, wind and pressure. If
assessed in a meteorological context, this method determines a significant level of uncertainty in the case of
convective precipitation, becoming more contained in stratiform events.
In a climatological context, on the other hand, the offsetting of uncertainties on individual events makes this
type of dataset suitable for use.
The model and basic parameters can also be used to obtain quite accurate estimates of variables that are not
directly measured by the observation systems, such as solar radiation, cloud cover, ground temperature and
temperatures at different altitudes.
Every reanalysis dataset uses its own specific model, characterised by the type of grid, its spatial resolution,
the number of vertical levels, the height of the top level, the formulation of the physical parameters and the
choice of contour conditions. Complex models usually supply higher performance results.
Fig. 7 shows an example of a data assimilation process coupled with an atmospheric forecasting model. This
is a 4D-VAR system (referring to the three spatial dimensions plus time), because the assimilation of the
observations extends beyond the initial instant of the forecast over a continuous window of time. The dashed
red line represents the trajectory of the forecast that the model would have given without the observations. It
is “corrected” during the time window of the reanalysis cycle, minimising the differences with respect to the
observations. The forecast of each cycle (which can last 12 hours, for example) supplies the “first guess” of
the next cycle. The process generates the meteorological reanalysis for broad time windows.
13Fig. 7 Simplified schematic representation of a 4D-VAR incremental system. Source: Fujiwaraa et al. -
Introduction to the SPARC Reanalysis Intercomparison Project (S-RIP) and overview of the reanalysis systems
Another essential element of reanalysis consists in the fact that the configuration of the “forecasting model-
data assimilation system” binomial must be kept constant during the entire process, to ensure spatial-
temporal homogeneity and prevent other spurious results. This is particularly important in the production of
datasets aimed specifically at the study of climate and its variability, and at the identification of any trends
linked to climate change.
Despite the application of this method, it should be noted that the portrayal of climate signals is inevitably
influenced by technological updates and the reorganisation of the global observation system. This has an
impact on reanalysis and on the other forms of historical analysis of observations. The global weather and
climate parameters of the atmosphere, also used to estimate climate change indicators, cannot be measured
directly so it is necessary to use models and statistical analyses that extract information from the
measurements which, in turn, present the well-known limits in terms of representativeness and uncertainty.
These issues have been subject to scientific debate, yet reanalysis is currently considered the most reliable
method; the difficulty that can be encountered in assessing the uncertainty can be mitigated by a
contemporary comparison with the more traditional climatic datasets obtained from observation alone.
2.4.3. Post-processing
As we are often reminded, every meteorological product should be used for and is functional to its specific
application and, as such, different users (insurance, energy, hydrology, agriculture, etc.) require dedicated
post-processing. Post-processing procedures make it possible to fulfil specific requirements, like the
following:
• An increase in spatial (or temporal) resolution of the variables of interest compared to the original
dataset. This procedure is known as downscaling and can be applied dynamically, via a high
resolution modelling system that uses the data from the original reanalysis dataset, and as input or
contour values, or statistically. Processing is often carried out, starting from global or continental
dataset, to obtain more detailed information at national or regional level.
• Statistical correction of the output for a further reduction of the bias of “operational” variables. This
correction can be applied in different ways, one of the most popular techniques being MOS 21.
• Punctual and statistical correction of the meteorological variables produced by “derivative”
reanalysis, i.e., the modelling component alone, in that the observations are not acquired from the
14assimilation system. A significant example is precipitation which, in the reanalysis datasets, is
generated dynamically by the modelling component on the basis of basic variables such as
temperature, humidity and wind. It is, therefore, necessary to apply this type of correction to
precipitation in the post-processing phase, using the observations of rain gauges and meteorological
radars, in order to eliminate the “spurious” drifts of the model.
Sometimes these procedures result in a situation in which the variables are no longer physically consistent, as
they act selectively on target parameters. The effect achieved leads to an improvement in the result of
professional and operational uses, supplying data that is more in line with reality. This may not be the case in
scientific research activities.
In order to portray a specific case, we are going to use the example of the post-processing technique used by
Radarmeteo22 in the processing of the precipitation field. The RainGis® algorithm was developed to merge
the data between rain gauge networks and radar data. This algorithm indicates the precipitation accumulated
with a spatial resolution of 1 km; the field obtained in this way replaces that processed using the reanalysis
modelling component alone.
The process envisages the following sequence:
• acquisition of radar-meteorological data,
• processing of the precipitation field accumulated from radar data alone (conversion using the
Marshall-Palmer relationship23),
• acquisition of data from rain gauges,
• correction of the radar precipitation field with data from rain gauges (merging).
In this specific case, post-processed merging data performs much better in the portrayal of the real levels of
precipitation observed. The correction of the radar precipitation field with data from rain gauges allows the
consistent elimination of drifts and uncertainties derived from radar measuring while maintain information
relating to the spatial variability of the precipitation. Consequently, we are able to reconstruct a precipitation
field that adequately portrays localised precipitation both in terms of quality and quantity, an operation
which is particularly difficult for all other processing techniques (models, satellites, interpolation of stations,
etc.).
2.5. The benefits
The application of reanalysis has brought numerous benefits to weather forecasting, for which data
represents the end of the process, and to countless other applications with meteorological and other
matrices, for which statistically and digitally structured meteorological information is necessary. Here are the
main benefits:
• it uses all the observation sources available, increasing their economic value and expanding the
vocation for multiple uses,
• the output presents a high level of consistency with historical measurements,
15• it carries out a cross validation between various types of sensor, which can also be independent of
one another,
• the data is returned in complete, homogeneous, regular grids; for each point throughout the
territory it is possible to obtain meteorological data that is representative of that area, irrespective of
the presence of in situ weather station or other sensors,
• data spatialisation is carried out in compliance with the physical laws that regulate atmospheric
motion and not using simple isotropic interpolation methods,
• the resulting datasets are homogeneous in time, being based on a constant modelling setup for the
entire analysis,
• in addition to the variables measured, it is also possible to obtain those processed using the
modelling component only (direct solar radiation, evapotranspiration, leaf wetness, etc.),
• it supplies a good basic meteorological knowledge of areas with scarce or inadequate network
coverage,
• the datasets are immediately usable by operators, analysts and statisticians, even without a
consistent background in physics, meteorology or climatology, the elements of which are dealt with
beforehand.
2.6. The main reanalysis datasets
From the point of view of the geographic domain, reanalysis datasets can usually be grouped into two types:
• Global, when the computational grid or domain covers the earth’s entire surface,
• Regional, when the computational grid or domain covers limited portions of the globe.
2.6.1. Global reanalysis
Global reanalysis datasets are usually processed by the world’s main weather centres, the only structures
which have adequate economic, scientific and computational resources to sustain such complex modelling
processes. Here we are going to consider the two most important:
• ECMWF17 - European Union
• NCEP18 - USA
The processes are distinguished by a grid with a very broad spatial resolution of over 30 km. They perform
two main functions:
• supporting the meteorological and climatological analyses of synoptic scale phenomena or
phenomena which have an impact on large areas of the globe,
• supplying contour data and initialisation data for regional reanalysis.
Consequently, they can be used to study global warming and synoptic phenomena (hurricanes, non-tropical
cyclones) in the scientific field and other spheres, such as risk assessment in the insurance sector.
16Fig. 8 Comparison between reconstructions of hurricane Florence at 09 UTC on 15 September 2018 between
ERA5 (left) and ERA-Interim (right). Thanks to the higher resolution and developments of the model’s physics,
the ERA5 dataset supplies a more detailed reconstruction of the cyclone's intensity (lower pressure values,
contours in hPa) and of the precipitation field (higher accumulations in mm, represented by coloured pixels in
shades of blue). Source: ECMWF
Since the 1990s, both centres have developed global reanalysis datasets, which have gradually been
upgraded, becoming more advanced; particular reference should be made to the following:
• NCEP18 / NCAR18 Reanalysis 1 (Kalnay et al., The NCEP/NCAR 40-year reanalysis project, Bull. Amer.
Meteor. Soc., 77, 437-470, 1996). Developed in partnership between NCEP and NCAR, it uses the pro
tempore configuration of the analysis/forecasting system to assimilate the data collected from 1948
to the present day; it presents a spatial resolution of 2.5° (c.a. 250 km) and a time step of six hours.
• NCEP18 / CFSR24 (Saha, S., et al. The NCEP climate forecast system reanalysis, Bull. Amer. Meteor. Soc.,
91, 1015-1057, 2010). The dataset was created using a high-resolution global model which simulates
the coupled dynamic of the atmosphere, ocean, land surface, sea and cryosphere; it covers the
period of time from 1979 to the present day, with a spatial resolution of c.a. 38 km and an hourly
time step.
• ERA25-Interim (Berrisford et al., 2011). This is a global atmospheric reanalysis based on the 2006
version of the IFS (Integrated Forecasting System of ECMWF17); the system includes a four-
dimensional variational analysis (4D-Var) with an analysis window of 12 hours; the spatial resolution
of the dataset is 80 km and covers the time window from 1979 to 2019 with a step of three hours.
• ERA255 (Copernicus Climate Change Service, 2017). The new dataset developed by ECMWF17 to
replace the ERA-Interim reanalysis; it is based on a 4D-Var data assimilation system and uses the
41r2 cycle of the IFS26 in operation at ECMWF in 2016; ERA5 benefits from a decade of development
in model physics, core dynamics and data assimilation relative to ERA-Interim; it also has a
significantly enhanced horizontal resolution (31 km compared to the 80 km of ERA-Interim) and an
hourly time step; the dataset covers the period of time from 1979 to the present day (Fig. 8).
172.6.2. Regional reanalysis
During the last few decades, the development of global reanalysis datasets has been accompanied by the
development of reanalysis projects on a regional scale. These respond to the growing need to obtain weather
and climate datasets for specific geographic areas and represent the applicative tool that has allowed the use
of reanalysis in various operational spheres, such as insurance, energy, water management and numerous
smart applications.
The main specific characteristics of these products are that:
• they have higher spatial-temporal resolutions than global products,
• they usually require fewer grid points, consequently reducing the computational resources needed
for processing, which can also be carried out by local authorities, companies and weather centres,
• they encourage more widespread use of meteorological data in many spheres,
• compared to global reanalysis, they allow the formulation of a historical background also for all
those phenomena with a limited spatial-temporal scale (e.g., storms) that global models simulate in a
parametrised manner or are unable to simulate at all.
In order to process a regional reanalysis, it is necessary to enter the contour conditions of the geographic
domain considered into the model. The equations that guide the simulation can only be solved if they have
access to the atmospheric conditions of the neighbouring grid cells; this requires the use, along the
boundaries of the domain, of the data contained in a global dataset or a regional one which includes the
area subject to processing within its territory. Obviously, this problem does not occur in global reanalyses as
their domain is represented by the entire globe.
Different regional reanalysis datasets have been developed at European level, including:
• UERRA27 Regional Reanalysis for Europe: this dataset was developed using the UERRA-HARMONIE
modelling system of the ECMWF17. The observations are assimilated using a 3D-VAR system, while
the contour data is supplied by the ERA2440/ERA-Interim global reanalysis dataset (Fig. 9). The spatial
resolution of the dataset is 11 km and the period covered runs from 1961 to 2019, with an hourly
time step. The geographic domain covers the whole European continent, part of North Africa and
Greenland.
• COSMO REA286: high-resolution reanalysis developed by the German weather service (DWD 29) based
on the COSMO model of which it also exploits the system used to assimilate observations, with
additional models for the analysis of snow coverage, sea surface temperatures and soil moisture. The
contour data is supplied by the ERA25-Interim global reanalysis dataset; it covers the period of time
from 1995 to 2019, with an hourly time step. The dataset was developed with the geographic domain
centred on the European continent and it has a spatial resolution of 6 km.
18Fig. 9 Synthetic diagram of data used for the assimilation of the UERRA-HARMONY system. Source: Copernicus
Climate Change Programme: User Learning Service Content
193. PSEUDO-REANALYSIS
The demand for historical weather and climate data is increasing significantly. This is a variable which, thanks
partly to digital technology, has acquired strategic importance in industrial policies and in the development
of new business models. As revealed in the previous chapters, the production of these datasets requires the
application of a precise scientific methodology known as reanalysis or regression analysis. It is definitely
possible to build historical and near real-time datasets also using different methods and procedures but
these products offer lower and sometimes poor quality.
Nevertheless, datasets produced in this way, referred to here as “pseudo-reanalysis”, are sometimes used in
more general applications. A brief description is given to provide a knowledge of their characteristics and
allow the assessment of possible fields of use, along with their limits, in that:
• they can be proposed as reanalysis datasets,
• the buyer may not be able to tell the difference,
• very low prices might lead people to prefer them.
•
Systematics of pseudo-reanalysis datasets
• In situ observation datasets
o In situ meteorological sensor data, as measured,
o Grids of interpolated in situ meteorological sensor data, without the modelling component.
• Datasets detached from in situ observation
o Data from Hindcast or Historical re-forecast,
o Data from the forecasting model output archive.
• Indirect and/or remote observation datasets
o Satellite data,
o Meteorological radar data.
3.1. In situ observation datasets
3.1.1. In situ meteorological sensor data, as measured,
In situ meteorological sensor data, more commonly known as weather station data, is definitely one of the
best-known types of data and, therefore, the most sought after. It consists of the value of a given parameter,
measured precisely at different time intervals (daily, hourly, etc.), and the resulting historical series. Due to
application in reanalysis as the only form of input, and therefore in the formation of robust datasets, data
from ground stations presents a number of weaknesses.
Applicability
• Historical series obtained from station data alone can only be applied in a type of analysis that is
limited to the area around the station itself, rapidly losing consistency as the area of interest
expands.
20Limitations
• Intrinsic shortcomings:
o limited, deficient, interrupted time series that cannot be reconstructed in any other way,
o malfunctions and measuring errors that cannot be checked with data from other sources,
o availability of few variables, usually temperature and precipitation,
o replacement and modification of sensors over time.
• Shortcomings in terms of representativeness:
o being point data, it is often inadequate to represent a meteorological phenomenon as a whole,
o representativeness quickly ceases to be precise the further away from the station we move and
the greater the orographic complexity, and with small scale (temporal) phenomena,
o discontinuous territorial distribution.
• Environmental shortcomings:
o alteration in the surrounding environment (constructions, agriculture, trees, etc.),
o site relocation,
o availability on land only.
3.1.2. Grids of interpolated in situ meteorological sensor data, without the modelling component
The formation of grids with the mere interpolation of data gathered by in situ sensors can be used to
overcome some of the fragilities that characterise the use of data alone.
Applicability
• Production of regular data grids, with which it is possible:
o to obtain complete coverage of the territory,
o to mitigate the lack of homogeneity in the distribution of measurement stations,
o to make up for the absence of data in certain areas,
• Production of continuous fields in time, with good historical depth,
• Low computational costs,
• Short processing times.
Limitations
• Availability of datasets limited to standard variables (temperature and precipitation) only; the dataset
often fails to include other parameters and rarely even includes the variables derived,
• Isotropic distribution of data; while using auxiliary co-variables to “guide” the interpolation of data
(e.g., DEM20 for temperature), spatial distribution takes place evenly in various directions, unlike the
physical processes that guide atmospheric motion,
• Need for a high density of stations, particularly for precipitation,
• Reduced representativeness in areas covered by few sensors,
• Coverage of land only,
• Time scale often limited to the day, in that the historical data available is often grouped together on
a daily basis,
21• Production of grids with a spatial resolution that is not particularly high (10-25 km),
• Geographic domain limited to national or even regional level, due to the restrictions or differences
imposed by neighbouring countries and, within Italy, by the different bodies that supply data at local
level.
3.2. Datasets detached from in situ observation
3.2.1. Hindcast or Historical re-forecast
In oceanography and meteorology, the term Hindcast or Historical re-forecast usually refers to the product
of a numerical atmospheric simulation model covering a particular historical period during which no
observation was assimilated. In other words, this is the re-performance of forecast model runs over a
particular period of the past. The element that makes this product different from reanalysis is the limited
nature of the observations, which are used only in the model initialisation phase; consequently, their guiding
role, i.e., their correction and guidance of the process, constantly aligning it to a to that corresponds to the
station measured, which is as real as possible.
Applicability
• Better knowledge of the model's climatology, of its behaviour, to provide a more accurate
interpretation of the forecasts developed in the operational phase,
• Availability of output data in regular grids that are both spatially and temporally complete,
• Distribution of information in the grid according to the physical processes that regulate atmospheric
motion, unlike datasets derived from the mere interpolation of station data.
Limitations
• Model drifts, meaning the limited adhesion to that actually observed. In the case of phenomena
characterised by small spatial-temporal scales (e.g. convective precipitation), the model can simulate
events that may be very different from those that actually occurred. Consistency with reality is poor
both for daily and long-term data, as no statistical corrections are made, using MOS 21 techniques for
example,
• Significant computational resources are required for analysis over broad time windows and for high
spatial resolutions.
3.2.2. Data from the forecasting model output archive
The archive of operational forecasting model output is a similar product to the Hindcast, simply archiving
forecast output products during their period of operation.
During that time window, however long it may be, the model setup is subject to changes; these are mainly
software upgrades to improve the forecasting performance. This is the difference between this product,
22which has undergone changes that may improve the output of the model, and the Hindcast product, in which
the model is re-run in a predetermined configuration.
Applicability
• The generation of the dataset does not require any computational resources in addition to those
used for the operational forecasting model; in short, the dataset completes itself, albeit over a period
of years.
Limitations
• Model drifts: as with Hindcast, the dataset presents a limited consistency with that actually observed,
• Lack of homogeneity: being the simple archiving of the forecasting output processed during the
operation of the model, its new setups, such as the spatial resolution of the computational grid, will
cause a lack of spatial and temporal homogeneity, which might be significant.
3.3. Indirect and/or remote observation datasets
3.3.1. Satellite data
Although satellites have been used for several decades, it is only recently that a considerable increase in the
number of sensors and orbits has increased their usability. The satellites used in meteorology fall into two
categories: polar and geostationary. Polar satellites orbit close to the poles and intersect the equator almost
perpendicularly; their revolution time is about 100 minutes. Geostationary satellites, on the other hand, follow
a circular orbit over the equator, with a revolution time of 24 hours, so they always “capture” the same
portion of the globe, moving together with it. Satellite observations use the different channels of the
electromagnetic spectrum, particularly the infra-red and visible channels, to detect certain meteorological
variables through indirect measurements.
Applicability
• Complete coverage, even independent of other weather data sources; this benefit is emphasised in
parts of the globe where monitoring is limited, such as poorer countries, remote areas, deserts and
oceans,
• Acquisition of meteorological variables such as cloud cover, temperature, precipitation and wind
speed,
• Acquisition of specific variables which would otherwise be hard to measure, such as cloud top
temperature, significant information in monitoring severe thunderstorms, or water vapour content,
• Immediate acquisition of large-scale data.
Limitations
• Temporal continuity of datasets linked to the frequency of passage of polar satellites; the problem is
solved to some extent by the increase in their number. Some applications, however, are limited by it,
• Significantly uncertain measurements, due to the fact that they are indirectly estimated (e.g., light
scattering for measuring wind speed); for some datasets, such as precipitation, the uncertainty is
23partially mitigated by correction/calibration by other sensors, such as weather radars or rain gauges;
this is only possible in areas where these sensors are present, and is also usually achieved with a
limited number of ground sensors,
• Partial geographical availability of certain measurements, such as that of wind, which is limited to the
oceans,
• Interference from cloud cover, precipitation, particular concentrations of water vapour; these are
factors which have a negative impact both on measurement uncertainty and the continuity of the
data; in extreme cases, these conditions can lead to loss of measurement,
• Medium-low spatial resolution, 10-25 km at most,
• Limited historical depth: the datasets compiled using the latest technologies go back a maximum of
five years. Those with a greater historical depth frequently present a lack of temporal homogeneity.
This is caused by the upgrading of instrumentation over the years and, consequently, the initial use
of obsolete technologies,
• Experimental nature; much of the technology used is still being tested and researched. This means
that there are operational limitations, or limited possibilities for supplying continuous and efficient
services.
3.3.2. Meteorological radar data
Meteorological radar is used for the real-time monitoring of precipitation systems within its range, which for
C-band radars is usually around 100-200 km. The operating principle is based on the interaction between the
electromagnetic radiation emitted by the instrument, characterised by a wavelength compatible with the
typical size of hydrometeors, and the precipitation systems in the atmosphere (rain, hail, snow). Based on the
intensity of the signal returned to the aerial and the time between the emission of radiation and its reception,
the instrument estimates the intensity and geographical position of precipitation phenomena with a good
degree of accuracy. The WMO4 considers it to be an unconventional instrument, as it is not used in all
countries. This does not, however, invalidate its usefulness, as it is fundamental in operational applications,
both to obtain an extremely clear and synthetic real-time picture of storms and to track their imminent
evolution (now casting). Radar makes a significant contribution also in terms of reanalysis of precipitation
fields.
Applicability
• The high spatial and temporal resolution that characterises radar data allows the adequate detection
of very localised and intense precipitation phenomena that often escape conventional rain gauge
networks. It is therefore capable of providing a fairly precise picture of the spatial variability of the
precipitation field which, in the case of convective phenomena, can be very strong and not easily
portrayed with other measurement systems,
• It is an important precipitation measurement source in areas without rain gauges.
Limitations
• Precipitation is estimated on the basis of an indirect measurement (scattering of the radiation
emitted by the aerial), so there can be a significant amount of uncertainty,
24• Certain factors, such as the presence of mountains/hills, signal disturbance generated by other
telecommunications systems and even the intensity of the phenomena themselves can negatively
influence the uncertainty, the spatial homogeneity of the measurement and the area covered. While
there are techniques that can mitigate some of these effects, in some cases they can significantly
impair the quality of the measurement, leading to large underestimates or overestimates. If the
precipitation systems are particularly intense, they can reduce the radar signal and cause an
underestimation of phenomena which are “in the shadow” of the sensor's field of view. Hail can lead
to an overestimate of the measurement of precipitation as it returns a more intense signal to the
radar aerial than other hydrometeors with the same water content; the exact opposite happens with
snow,
• Radar provides the measurement of the precipitation taken at a certain altitude, which may be
quantitatively different from the precipitation that falls on the ground,
• Radar networks are usually installed for the purposes of real-time monitoring and civil protection.
Consequently, the use of radar data for generating precipitation datasets has only been applied
relatively recently and has limited historical depth. Datasets with greater historical depths often suffer
from a lack of temporal homogeneity due to the technological upgrade of the sensors,
• Radar measurements are only available on land and over coastal sea areas,
• The high cost of purchasing and maintaining radar networks can hinder the spread of this
technology, which is still somewhat limited to more developed countries,
• The lack of homogeneity of the instrumentation used from one country to another, and sometimes
even within the same country, can make it difficult to produce homogeneous datasets.
25You can also read


