An outflow powers the optical rise of the nearby, fast-evolving tidal disruption event AT2019qiz
←
→
Page content transcription
If your browser does not render page correctly, please read the page content below
MNRAS 000, 1–22 (2020)                                           Preprint 15 September 2020              Compiled using MNRAS LATEX style file v3.0

                                               An outflow powers the optical rise of the nearby, fast-evolving tidal
                                               disruption event AT2019qiz

                                               M. Nicholl1,2? , T. Wevers3 , S. R. Oates1 , K. D. Alexander4 †, G. Leloudas5 , F. Onori6 ,
                                               A. Jerkstrand7,8 , S. Gomez9 , S. Campana10 , I. Arcavi11,12 , P. Charalampopoulos5 ,
                                               M. Gromadzki13 , N. Ihanec13 , P. G. Jonker14,15 , A. Lawrence2 , I. Mandel16,17,1 ,
                                               S. Schulze18 , P. Short2 , J. Burke19,20 , C. McCully19,20 , D. Hiramatsu19,20 ,
arXiv:2006.02454v2 [astro-ph.HE] 14 Sep 2020

                                               D. A. Howell19,20 , C. Pellegrino19,20 , H. Abbot21 , J. P. Anderson22 , E. Berger9 ,
                                               P. K. Blanchard4 , G. Cannizzaro14,15 , T.-W. Chen8 , M. Dennefeld23 , L. Galbany24 ,
                                               S. González-Gaitán25 , G. Hosseinzadeh9 , C. Inserra26 , I. Irani18 , P. Kuin27 ,
                                               T. Müller-Bravo28 , J. Pineda29 , N. P. Ross2 , R. Roy30 , S. J. Smartt31 , K. W. Smith31 ,
                                               B. Tucker21 , Ł. Wyrzykowski13 , D. R. Young31
                                               Affiliations at end of paper

                                                                                      ABSTRACT
                                                                                      At 66 Mpc, AT2019qiz is the closest optical tidal disruption event (TDE) to date, with a
                                                                                      luminosity intermediate between the bulk of the population and the faint-and-fast event
                                                                                      iPTF16fnl. Its proximity allowed a very early detection and triggering of multiwavelength
                                                                                      and spectroscopic follow-up well before maximum light. The velocity dispersion of the host
                                                                                      galaxy and fits to the TDE light curve indicate a black hole mass ≈ 106 M , disrupting a star of
                                                                                      ≈ 1 M . By analysing our comprehensive UV, optical and X-ray data, we show that the early
                                                                                      optical emission is dominated by an outflow, with a luminosity evolution L ∝ t 2 , consistent
                                                                                      with a photosphere expanding at constant velocity (& 2000 km s−1 ), and a line-forming region
                                                                                      producing initially blueshifted H and He II profiles with v = 3000 − 10000 km s−1 . The
                                                                                      fastest optical ejecta approach the velocity inferred from radio detections (modelled in a
                                                                                      forthcoming companion paper from K. D. Alexander et al.), thus the same outflow may be
                                                                                      responsible for both the fast optical rise and the radio emission – the first time this connection
                                                                                      has been observed in a TDE. The light curve rise begins 29 ± 2 days before maximum light,
                                                                                      peaking when the photosphere reaches the radius where optical photons can escape. The
                                                                                      photosphere then undergoes a sudden transition, first cooling at constant radius then contracting
                                                                                      at constant temperature. At the same time, the blueshifts disappear from the spectrum and
                                                                                      Bowen fluorescence lines (N III) become prominent, implying a source of far-UV photons,
                                                                                      while the X-ray light curve peaks at ≈ 1041 erg s−1 . Assuming that these X-rays are from prompt
                                                                                      accretion, the size and mass of the outflow are consistent with the reprocessing layer needed
                                                                                      to explain the large optical to X-ray ratio in this and other optical TDEs, possibly favouring
                                                                                      accretion-powered over collision-powered outflow models.
                                                                                      Key words: transients: tidal disruption events – galaxies: nuclei – black hole physics

                                               1   INTRODUCTION                                                              hole (SMBH), where Rt ≈ R∗ (M• /M∗ )1/3 for a black hole of mass
                                                                                                                             M• and a star of mass M∗ and radius R∗ (Hills 1975). This encounter
                                               An unfortunate star in the nucleus of a galaxy can find itself on an
                                                                                                                             induces a spread in the specific orbital binding energy across the star
                                               orbit that intersects the tidal radius of the central supermassive black
                                                                                                                             that is orders of magnitude greater than the mean binding energy
                                                                                                                             (Rees 1988), sufficient to tear the star apart in a ‘tidal disruption
                                                                                                                             event’ (TDE). The stellar debris, confined in the vertical direction by
                                               ? Contact e-mail: mnicholl@star.sr.bham.ac.uk                                 self-gravity (Kochanek 1994; Guillochon et al. 2014), is stretched
                                               † Einstein Fellow

                                               © 2020 The Authors
2 M. Nicholl et al
into a long, thin stream, roughly half of which remains bound to does not appear to be a common feature of TDEs, but other radio
the SMBH (Rees 1988). As the bound debris orbits the SMBH, TDEs have launched sub-relativistic outflows (van Velzen et al. 2016;
relativistic apsidal precession causes the stream to self-intersect and Alexander et al. 2016, 2017; Anderson et al. 2019).
dissipate energy (Shiokawa et al. 2015; Dai et al. 2015; Bonnerot & A number of radio-quiet TDEs have exhibited indirect evidence
Lu 2020). for slower outflows in the form of blueshifted optical/UV emission
This destruction can power a very luminous flare, up to or and absorption lines (Roth & Kasen 2018; Hung et al. 2019; Blan-
exceeding the Eddington luminosity, either when the intersecting chard et al. 2017), suggesting that outflows may be common. This
streams circularise and form an accretion disk (Rees 1988; Phinney is important, as the expanding material offers a promising means
1989), or even earlier if comparable radiation is produced directly to form the apparently ubiquitous reprocessing layer required by
from the stream collisions (Piran et al. 2015; Jiang et al. 2016b). the optical/X-ray ratios. Suggested models include an Eddington
Such flares are now regularly discovered, at a rate exceeding a few envelope (Loeb & Ulmer 1997), possibly inflated by radiatively
per year, by the various wide-field time-domain surveys (e.g. Gezari inefficient accretion or an optically thick disk wind (Metzger &
et al. 2012; Holoien et al. 2014; Arcavi et al. 2014; van Velzen et al. Stone 2016; Dai et al. 2018); or a collision-induced outflow (Lu &
2020). Bonnerot 2020).
Observed TDEs are bright in the UV, with characteristic tem- Understanding whether the optical reprocessing layer is con-
peratures ∼ 2 − 5 × 10⁴ K and luminosities ∼ 1044 erg s−1 . They are nected to the non-relativistic outflows seen in some radio TDEs
classified according to their spectra, generally exhibiting broad, low is therefore a crucial, and as yet under-explored, step towards a
equivalent width1 emission lines of hydrogen, neutral and ionised pan-chromatic picture of TDEs. Multi-colour photometry at early
helium, and Bowen fluorescence lines of doubly-ionised nitrogen and times can reveal whether (or how quickly) the optical photosphere
oxygen (e.g. Arcavi et al. 2014; Leloudas et al. 2019). This prompted grows with time. Early radio detections can determine the time at
van Velzen et al. (2020) to suggest three sub-classes labelled TDE-H, which material is launched, to check for consistency with the optical
TDE-He and TDE-Bowen, though some TDEs defy a consistent flare (Alexander et al. 2016). Spectroscopy and X-ray observations
classification by changing their apparent spectral type as they evolve can be used to search for signatures of accretion. In principle this
(Nicholl et al. 2019b). could allow us to distinguish whether outflows are launched by
TDE flares were initially predicted to be brightest in X-rays, accretion, or before accretion (i.e., in the collisions that ultimately
due to the high temperature of an accretion disk, and indeed this is enable disk formation).
the wavelength where the earliest TDE candidates were identified In this paper, we present a detailed study of the UV, optical
(Komossa 2002). However, the optically-discovered TDEs have and X-ray emission from AT2019qiz: the closest TDE discovered to
proven to be surprisingly diverse in their X-ray properties. Their date, and the first optical TDE at z < 0.02 that has been detected in
X-ray to optical ratios at maximum light range from & 103 to < 10−3 the radio. We place a particular focus on the spectroscopic evolution,
(Auchettl et al. 2017). Producing such luminous optical emission finding clear evidence of an outflow launched well before the light
without significant X-ray flux can be explained in one of two ways: curve maximum. By studying the evolution of the photosphere and
either X-ray faint TDEs are powered primarily by stream collisions line velocities, we infer a roughly homologous structure, with the
rather than accretion, or the accretion disk emission is reprocessed fastest optically-emitting material (the reprocessing layer) likely also
through an atmosphere (Strubbe & Quataert 2009; Guillochon et al. responsible for the radio emission (which is analysed in detail in a
2014; Roth et al. 2016). forthcoming companion paper; K. D. Alexander et al., in preparation).
Several lines of evidence have indicated that accretion disks This event suggests a closer connection between the optical and
do form promptly even in X-ray faint TDEs: Bowen fluorescence radio TDE outflows than has been appreciated to date, while a peak
lines that require excitation from far-UV photons (Blagorodnova in the X-ray light curve and the detection of Bowen lines indicates
et al. 2019; Leloudas et al. 2019); low-ionisation iron emission that accretion began promptly in this event and likely drives the
appearing shortly after maximum light (Wevers et al. 2019b); and outflow. The rapid rise and decline of the light curve suggests that
recently the direct detection of double-peaked Balmer lines that the properties of outflows may be key to understanding the fastest
match predicted disk profiles (Short et al. 2020; Hung et al. 2020). TDEs.
Thus a critical question is to understand the nature and origin of the We detail the discovery and classification of AT2019qiz in
implied reprocessing layer. Guillochon et al. (2014) showed that the section 2, and describe our observations and data reduction in
unbound debris stream cannot be the site of reprocessing, because section 3. We analyse the host galaxy, including evidence for a
its apparent cross-section is too low to intercept a significant fraction pre-existing AGN, in section 4, and study the photometric and
of the TDE flux. spectroscopic evolution of the TDE emission in sections 5 and 6.
Inhibiting progress is the messy geometry of the debris. Col- This is then brought together into a coherent picture, discussed in
liding streams, inflowing and outflowing gas, and a viewing-angle section 7, before we conclude in section 8. All data in this paper will
dependence on both the broad-band (Dai et al. 2018) and spectro- be made publicly available via WISeREP (Yaron & Gal-Yam 2012).
scopic (Nicholl et al. 2019b) properties all contribute to a messy
knot that must be untangled. One important clue comes from radio
observations: although only a small (but growing) sample of TDEs
have been detected in the radio, in such cases we can measure the 2 DISCOVERY AND BACKGROUND
properties (energy, velocity, and density) of an outflow directly (see AT2019qiz was discovered in real-time alerts from the Zwicky Tran-
recent review by Alexander et al. 2020). In some TDEs this emission sient Facility (ZTF; Bellm et al. 2019; Masci et al. 2019; Patterson
is from a relativistic jet (Zauderer et al. 2011; Bloom et al. 2011; et al. 2019), at coordinates RA=04:46:37.88, Dec= −10:13:34.90,
Burrows et al. 2011; Cenko et al. 2012; Mattila et al. 2018), which and was given the survey designation ZTF19abzrhgq. It is coin-
cident with the centre of the galaxy 2MASX J04463790-1013349
(a.k.a. WISEA J044637.88-101334.9). The transient was first identi-
1 Compared to other nuclear transients such as active galactic nuclei fied by the ALeRCE broker, who reported it to the Transient Name
MNRAS 000, 1–22 (2020)Answers to the qiz 3
PS1 1’x1’
Rest-frame days from maximum light
50 0 50 100 150
8 ZTF r-2 LCO r-2 UVOT U+1 26
ZTF g LCO g UVOT UVW1+2
10 ATLAS o-3 LCO i-4 UVOT UVM2+3 24
ATLAS c-1 UVOT UVW2+4
22
Absolute magnitude ( = 34.1)
12
Apparent magnitude (AB)
20
14
18
16
N 16
18 14
5 kpc
E 20 12
22 10
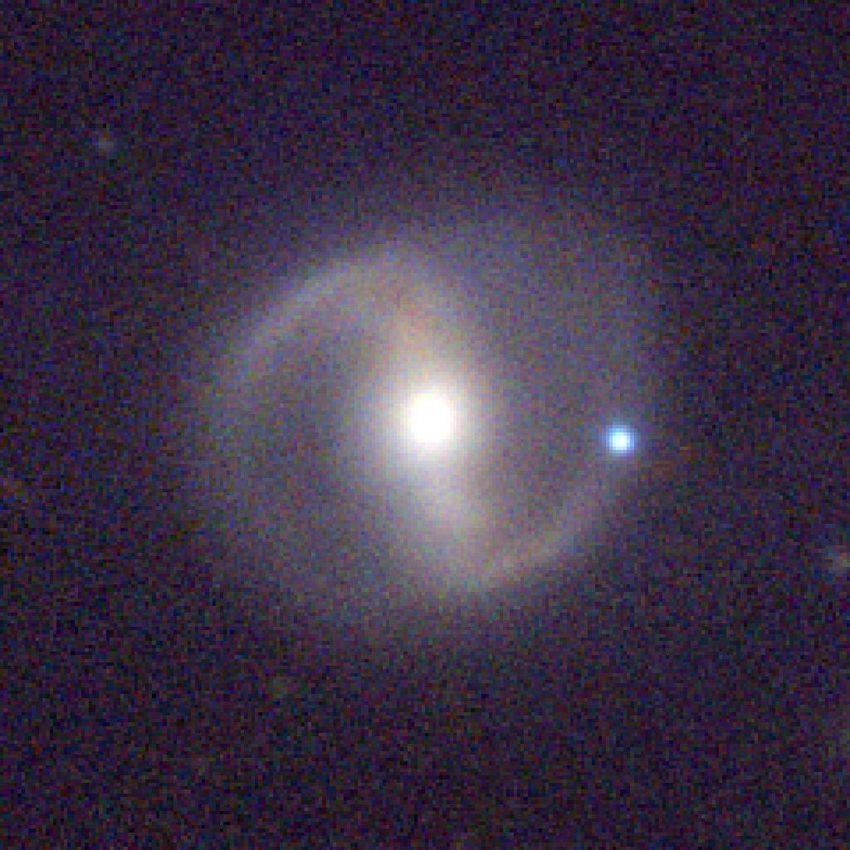
Figure 1. Pre-disruption g, i, z colour image of the host of AT2019qiz,
2MASX J04463790-1013349, obtained from the PanSTARRS image server. 8
Comparing to our highest S/N LCO image of the transient, we measure an 24
offset of 15 ± 46 pc from the centre of the host. 6
58750 58800 58850 58900
MJD
Server on 2019-09-19 UT (Forster 2019). It was also reported by
the AMPEL broker a few days later. In subsequent nights the same
transient was independently reported by the Asteroid Terrestrial im- Figure 2. Optical and UV light curves of AT2019qiz. The host contribu-
pact Last Alert System (ATLAS; Tonry et al. 2018) as ATLAS19vfr, tion has been removed using image differencing (ZTF, ATLAS, LCO) or
subtraction of fluxes estimated from the galaxy SED (UVOT).
by Gaia Science Alerts (Hodgkin et al. 2013) as Gaia19eks, and
by the Panoramic Survey Telescope And Rapid Response System
(PanSTARRS) Survey for Transients (PSST; Huber et al. 2015) as early and late photometric observations, and the first detection of the
PS19gdd. The earliest detection is from ATLAS on 2019-09-18 UT. source in X-rays. We also examine the host galaxy in detail. While
We have been running the Classification Survey for Nuclear we link the optical properties of the TDE to its behaviour in the radio,
Transients with Liverpool and Lasair (C-SNAILS; Nicholl et al. the full radio dataset and analysis will be presented in a companion
2019a) to search for TDEs in the public ZTF alert stream. AT2019qiz paper (K. D. Alexander et al., in preparation).
passed our selection criteria (based on brightness and proximity
to the centre of the host galaxy2 ) on 2019-09-25 UT, and we
triggered spectroscopy with the Liverpool Telescope. On the same
day, Siebert et al. (2019) publicly classified AT2019qiz as a TDE 3 OBSERVATIONS
using spectroscopy from Keck I. 3.1 Ground-based imaging
Their reported spectrum, and our own data obtained over the
following nights, showed broad He II and Balmer emission lines Well-sampled host-subtracted light curves of AT2019qiz were ob-
superposed on a very blue continuum, characteristic of UV-optical tained by the ZTF public survey, in the g and r bands, and ATLAS
TDEs. Follow-up observations from other groups showed that the in the c and o bands (effective wavelengths 5330 and 6790 Å). The
source was rising in the UV (Zhang et al. 2019), but was not initially ZTF light curves were accessed using the Lasair alert broker3 (Smith
detected in X-rays (Auchettl et al. 2019). Radio observations with the et al. 2019).
Australia Telescope Compact Array (ATCA) revealed rising radio We triggered additional imaging with a typical cadence of
emission, reaching 2.6 mJy at 21.2 GHz on 2019-12-02 (O’Brien four days in the g, r, i bands using the Las Cumbres Observatory
et al. 2019), placing AT2019qiz among the handful of TDEs detected (LCO) global network of 1-m telescopes (Brown et al. 2013). We
at radio wavelengths. retrieved the reduced (de-biased and flat-fielded) images from LCO
The spectroscopic redshift of AT2019qiz, as listed for the host and carried out point spread function (PSF) fitting photometry using
galaxy in the NASA Extragalactic Database (NED) and measured a custom wrapper for daophot. The zeropoint in each image was
from narrow absorption lines in the TDE spectrum, is z = 0.01513. calculated by comparing the instrumental magnitudes of field stars
This corresponds to a distance of 65.6 Mpc, assuming a flat cos- with their catalogued magnitudes from PanSTARRS data release 1
mology with H0 = 70 km s−1 Mpc−1 and ΩΛ = 0.7. This makes (Flewelling et al. 2016).
AT2019qiz the most nearby TDE discovered to date. AT2019qiz resides in a bright galaxy, 2MASX J04463790-
AT2019qiz was included in the sample of 17 TDEs from ZTF 1013349, with mr = 14.2 mag (Section 4). A three-colour (gri)
studied by van Velzen et al. (2020). Their work focused primarily image of the host, comprised of deep stacks from PanSTARRS, is
on the photometric evolution around peak, and correlations between shown in Figure 1. To isolate the transient flux, we aligned each
TDE and host galaxy properties. In this paper, we analyse a rich LCO image with the PanSTARRS image in the corresponding filter
dataset for AT2019qiz including densely sampled spectroscopy, very using the geomap and geotran tasks in pyraf, computing the
transformation from typically > 50 stars, before convolving the
2 The source could have been triggered 5 days earlier but for missing offset
information in the alert packet. 3 https://lasair.roe.ac.uk
MNRAS 000, 1–22 (2020)4 M. Nicholl et al
10−3
Γ=1.1+0.6−0.4
Counts s−1 keV−1
10−4
10−5
Figure 3. Stacked Swift XRT image (total exposure time 30 ks) centred at the 0.5 1 2 5
position of AT2019qiz, marked by a cyan cross. An X-ray source is detected Energy (keV)
at 5.6σ significance. The image has been blocked 4 × 4 and smoothed using
a Gaussian kernel for display. The colour bar gives the counts per pixel.
Figure 4. Time-averaged X-ray spectrum and best-fit absorbed power-law
model, used to derive the counts-to-flux conversion.
PanSTARRS reference image to match the PSF of the science image
and subtracting with hotpants (Becker 2015).
the detector known to suffer reduced sensitivity. A correction has
yet to be determined for these patches4 .
No host galaxy images in the UV are available for subtraction.
3.2 Astrometry
We estimated the host contribution using a spectral energy distribu-
Measuring the TDE position in an LCO r band image obtained on tion (SED) fit to archival data for this galaxy (details in section 4).
2019-10-10 (at the peak of the optical light curve), and the centroid The host magnitude and its error in each UVOT band was estimated
of the galaxy in the aligned PanSTARRS r band image, we measure using the mean and standard deviation of SED samples drawn from
an offset of 0.12 ± 0.37 pixels (or 0.047 00 ± 0.144) between the the posterior of this fit. We then scaled the predicted flux by a factor
transient and the host nucleus, where the uncertainty is dominated by 0.2, i.e. the fraction of the host light within a 5 00 aperture in the
the root-mean-square error in aligning the images. This corresponds PanSTARRS g-band image of the galaxy, before subtracting from
to a physical offset of 15 ± 46 pc at this distance; the transient is the transient photometry. We checked that this method provides a
therefore fully consistent with a nuclear origin. reliable correction for the host flux by re-extracting the UVOT light
An alternative astrometric constraint can be obtained using curve using a 30 00 aperture to fully capture both the transient and
the Gaia Science Alerts (GSA) detections (Hodgkin et al. 2013). host flux, and subtracting the model host magnitudes with no scaling.
Gaia19eks was discovered at a separation of 38 milli-arcseconds Comparing the 5 00 light curves to the 30 00 light curves, we
(mas) from the reported location of its host galaxy in Gaia data release find a good match in the U and UVW1 bands. In the bluer UV M2
2 (GDR2; Gaia Collaboration et al. 2018). The estimated astrometric and UVW2 bands, where the host SED and light profile is less
uncertainty of GSA is ∼100 mas (Fabricius et al. 2016), and the constrained, we find that scaling the host flux by a factor 0.1 before
coordinate systems of GSA and GDR2 are well aligned (Kostrzewa- subtraction yields better agreement, and we adopt this as our final
Rutkowska et al. 2018; Wevers et al. 2019b). This measurement light curve. The fractional uncertainty (≈ 20%) in the host flux
corresponds to an even tighter constraint on the offset of 12 ± 32 pc. was combined in quadrature with that of the transient flux when
calculating the photometric errors. We show in the appendix a
comparison between the UVOT light curves obtained using the 5 00
3.3 Swift UVOT data and 30 00 apertures. The complete, host-subtracted UV and optical
light curves from Swift, LCO, ZTF and ATLAS are shown in Figure
Target-of-opportunity observations spanning 39 epochs (PIs Yu and 2.
Nicholl) were obtained with the UV-Optical Telescope (UVOT) and
X-ray Telescope (XRT) on-board the Neil Gehrels Swift Observatory
(Swift). The UVOT light curves were measured using a 5 00 aper- 3.4 Swift XRT data
ture. This is approximately twice the UVOT point-spread function,
ensuring the measured magnitudes capture most of the transient We processed the XRT data using the online analysis tools provided
flux while minimising the host contribution (the coincidence loss by the UK Swift Science Data Centre (Evans et al. 2007, 2009).
correction for the UVOT data is also determined using a 5 00 aperture, We first combined all of the data into a single deep stack (total
ensuring a reliable calibration of these magnitudes). The count rates exposure time 30 ks), which we then downloaded for local analysis.
were obtained using the Swift uvotsource tools and converted to The stacked image, shown in Figure 3, clearly exhibits an X-ray
magnitudes using the UVOT photometric zero points (Breeveld source at the position of AT2019qiz. Using a 50 00 aperture (∼ 2.5
et al. 2011). The analysis pipeline used software HEADAS 6.24 times the instrumental half-energy width) centered at the coordinates
and UVOT calibration 20170922. We exclude the initial images in
the B, U, UVW1, and UVW2 filters (OBSID 00012012001) due to
trailing within the images. We also exclude 2 later UVW1 images 4 https://heasarc.gsfc.nasa.gov/docs/heasarc/caldb/swift/docs/
and a UVW2 image due to the source being located on patches of uvot/uvotcaldb_sss_01.pdf
MNRAS 000, 1–22 (2020)Answers to the qiz 5
of the transient, we measure an excess 46.9 ± 8.4 counts above the 5
background, giving a mean count rate of (1.6 ± 0.3) × 10−3 ct s−1 . 0.3-10 keV
FX (10-13 ergs-1 cm-2)
We then used the same tools to extract the mean X-ray spectrum, 4 0.3-2 keV
shown in Figure 4, and light curve. Given the low number of counts 3 2-10 keV
we fit the spectrum using Cash statistics, and fixed the Galactic
column density to 6.5 × 1020 cm−2 . The fit with a power law does 2
not need an intrinsic column (< 2.8 × 1021 cm−2 , 90% confidence
level). The photon index of the fit is Γ = 1.1+0.6 . A blackbody model 1
−0.4
can give a comparable fit, but the inferred temperature and radius 0 0 20 40 60 80
(kT = 0.9 keV, R = 6.0 × 107 cm) are not consistent with other
Rest-frame days from optical maximum
TDEs. Such a radius is also much smaller than the Schwarzschild
Hardness ratio (H-S)/(H+S)
radius of a SMBH, however an apparently small emitting surface
can also arise due to obscuration (Wevers et al. 2019a). The 0.3-10
1.0 19qiz 18fyk 19ehz
keV unabsorbed flux from the power-law fit is 9.9+3.7 × 10⁻¹⁴ erg 18hyz 15oi 14li
−3.4 0.5 19azh 19dsg
−2 −1
cm s . At the distance of AT2019qiz, this corresponds to an
X-ray luminosity LX = 5.1 × 1040 erg s−1 . 0.0
The X-ray light curve is shown in Figure 5. We specify a target
bin size of 10 counts above background, with a minimum of three 0.5
counts to form a bin. The 0.3-10 keV light curve peaks around 1.0
25 days after optical maximum. We calculate the evolution of the
0 20 40 60 80
hardness ratio as (H − S)/(H + S), where S is the count rate in Rest-frame days from UV/optical peak
the 0.3 − 2 keV band and H the count rate in the 2 − 10 keV band;
these ranges have been chosen to match Auchettl et al. (2017). The
pipeline necessarily returns coarser temporal bins for the hardness Figure 5. Top: XRT light curve (unabsorbed flux) in 0.3-10 keV, 0.3-2 keV
ratio, due to the lower counts when dividing into the two bands. We (soft) and 2-10 keV (hard) X-ray bands. The X-ray light curve peaks around
compare this ratio to other TDEs with well-sampled XRT detections. 25 days after optical maximum. Bottom: evolution of the hardness ratio,
AT2019qiz exhibits an unusually hard ratio at early times, with defined as (hard − soft counts)/(hard + soft counts). The X-rays transition
(H − S)/(H + S) = 0.2 ± 0.3, but as the X-rays fade they also soften, from hard to soft as the luminosity declines. This is in contrast to most X-ray
reaching (H − S)/(H + S) = −0.4 ± 0.3 by ≈ 50 days after peak. TDEs that exhibit at all times a soft spectrum (van Velzen et al. 2020; Gomez
This latter value is typical of the TDE sample studied by Auchettl et al. 2020; Holoien et al. 2016a,b).
et al. (2017), whereas a positive ratio has only been seen previously
in the jetted TDE J1644+57 (Zauderer et al. 2011).
setups, and variance-weighted extraction to a one-dimensional spec-
trum. We also retrieved the reduced classification spectrum obtained
by Siebert et al. (2019) using the 10-m Keck-I telescope with LRIS
3.5 Optical spectroscopic data (Oke et al. 1995), and made public via the Transient Name Server6 .
Spectra of AT2019qiz were obtained from the 3.6-m New Technol- All spectra are corrected for redshift and a foreground extinction of
ogy Telescope (NTT), using EFOSC2 with Grism#11, through the E(B − V) = 0.0939 using the dust maps of Schlafly & Finkbeiner
advanced Public ESO Spectroscopy Survey of Transient Objects (2011) and the extinction curve from Cardelli et al. (1989). All spec-
(ePESSTO+; Smartt et al. 2015); the LCO 2-m North and South tra are plotted in Figure 6. For host-subtracted spectra (section 4 and
telescopes with FLOYDS; the 2-m Liverpool Telescope (LT) with appendix), we apply these corrections after scaling and subtraction.
SPRAT (Piascik et al. 2014) in the blue-optimised setting, as part
of C-SNAILS (Nicholl et al. 2019a); the 6.5-m MMT telescope
with Binospec (Fabricant et al. 2019); the 6.5-m Magellan Clay 4 HOST GALAXY PROPERTIES
telescope with LDSS-3 and the VPH-ALL grism; the 4.2-m William
Herschel Telescope with ISIS (Jorden 1990) and the R600 blue/red 4.1 Morphology
gratings; and the 8-m ESO Very Large Telescope using X-Shooter The host of AT2019qiz is a face-on spiral galaxy. A large-scale bar
(Vernet et al. 2011) in on-slit nodding mode, through our TDE is visible in the PanSTARRS image (Figure 1). French et al. (2020b)
target-of-opportunity program. analysed Hubble Space Telescope (HST) images of four TDE hosts
Reduction and extraction of these data were performed using and identified bars in two. While central bars (on scales . 100 pc)
instrument-specific pipelines or (in the cases of the LDSS-3 and can increase the TDE rate by dynamically feeding stars towards the
ISIS data) standard routines in iraf. Reduced LCO and LT data nucleus (Merritt & Poon 2004), there is no evidence that large-scale
were downloaded from the respective data archives, while we ran bars increase the TDE rate (French et al. 2020b). Given the proximity
the pipelines (Smartt et al. 2015; Freudling et al. 2013) locally of AT2019qiz, this galaxy is an ideal candidate for HST or adaptive
for the EFOSC2 and X-Shooter data5 . Typical reduction steps are optics imaging to resolve the structure of the nucleus.
de-biasing, flat-fielding and wavelength-calibration using standard Recent studies have shown that TDE host galaxies typically have
lamps, cosmic-ray removal (van Dokkum et al. 2012), flux calibration a more central concentration of mass than the background galaxy
using spectra of standard stars obtained with the same instrument population (Law-Smith et al. 2017; Graur et al. 2018). The most
recent compilation (French et al. 2020a) shows that the Sérsic indices
5 The atmospheric dispersion corrector on X-Shooter failed on 2019-10-10,
so we were unable to reduce the data in the UVB arm for this epoch. 6 https://wis-tns.weizmann.ac.il
MNRAS 000, 1–22 (2020)6 M. Nicholl et al
NTT X-Shooter LCO
LDSS MMT WHT 104d
LT Keck (TNS) 105d
35d
-12d 41d 113d
-10d 115d
Normalized F + constant
48d
-9d 56d
-6d 117d
0d 60d
125d
1d 64d
5d 65d 125d
11d 68d 135d
12d 71d 140d
17d 77d
21d 141d
82d
22d 83d 152d
25d 157d
96d
29d
4000 6000 8000 4000 6000 8000 4000 6000 8000
Rest-frame wavelength (Å) Rest-frame wavelength (Å) Rest-frame wavelength (Å)
Figure 6. Complete series of spectra of AT2019qiz at phases from 12 days before until 157 days after the UV/optical peak. The phase of each spectrum is
labelled, while colours individuate the telescopes/instruments used for the observations. The continuum transitions from TDE- to host-dominated over time, but
broad TDE emission lines are visible throughout. A version of this figure with host light subtracted is given in the appendix.
of TDE hosts range from ≈ 1.5 − 6, consistent with the background mass (the M• − σ relation), this gives a SMBH mass log(M• /M ) =
distribution of quiescent galaxies but significantly higher than star- 5.75 ± 0.45 in the calibration of McConnell & Ma (2013), or
forming galaxies. We measure the Sérsic index for the host of log(M• /M ) = 6.52 ± 0.34 in the calibration of Kormendy & Ho
AT2019qiz by fitting the light distribution in the PanSTARRS r- (2013). The calibration of Gültekin et al. (2009) gives an intermediate
band image in a 200 × 400 pixel box, centered on the nucleus, using value log(M• /M ) = 6.18 ± 0.44. The reason for the large spread
galfit (Peng et al. 2002). The residuals are shown in Figure 7. We in these estimates is that these relations were calibrated based on
do not fit for the spiral structure. Following French et al. (2020b), we samples that comprised mostly black holes more massive than
investigate the effect of including an additional central point source 107 M . However, the estimates here are consistent, within the
(using the point-spread function derived from stars in the image errors, with an independent mass measurement based on the TDE
as in section 3.1). The residuals appear flatter when including the light curve (section 5).
point source, however the change in reduced χ2 is minor ( χ2 = 1.36
with the point source or 1.46 without). The best-fit Sérsic index is
5.2 (with the point source) or 6.3 (without). In either case, this is 4.3 Host SED model
consistent with the upper end of the observed distribution for TDE Archival photometry of this galaxy is available from the PanSTARRS
hosts. catalog in the g, r, i, z, y filters, as well as in data releases from the
2 Micron All Sky Survey (2MASS; Skrutskie et al. 2006) in the
J, H, K filters, and the Wide-field Infrared Survey Explorer (WISE;
4.2 Velocity dispersion and black hole mass
Wright et al. 2010) in the WISE bands W1 − 4. We retrieved the Kron
Following Wevers et al. (2017, 2019a), we fit the velocity dispersion magnitudes from PanSTARRS, the extended profile-fit magnitudes
of stellar absorption lines with the code ppxf (Cappellari 2017) to (‘m_ext’) from 2MASS, and the magnitudes in a 44 00 circular
estimate the mass of the central SMBH. We use a late-time spectrum aperture (chosen to fully capture the galaxy flux) from WISE.
obtained from X-shooter, resampled to a logarithmic spacing in We fit the resultant spectral energy distribution (SED) with
wavelength and with the continuum removed via polynomial fits. We stellar population synthesis models in Prospector (Leja et al. 2017)
find a dispersion σ = 69.7 ± 2.3 km s−1 . to derive key physical parameters of the galaxy. The free parameters in
Using relations between velocity dispersion and black hole our model are stellar mass, metallicity, the current star-formation rate
MNRAS 000, 1–22 (2020)Answers to the qiz 7
PS1 GALFIT residual GALFIT residual 12.5
(Sérsic) (Sérsic + point source) Photometry
SFR (M yr-1 )
13.0 Median model
100
13.5
10-1
AB magnitude
14.0 101 100 10-1
Lookback time (Gyr)
14.5
Figure 7. Left: PanSTARRS g-band image of the host galaxy. North is
up, and east is towards the left of the image. We fit a Sérsic function for 15.0
the overall surface brightness profile using galfit, but make no attempt
to model the spiral arms. The model also includes a point source for the
nearby star to the west, and optionally a central point source for the galactic
15.5
104 105
nucleus. Middle: Subtraction residuals without a central point source. Right:
Subtraction residuals when including a central point source. We find visibly
smoother residuals in this case. Rest-frame wavelength (Å)
and the widths of five equal-mass bins for the star-formation history, Figure 8. Archival photometry of the host galaxy, and SED fit using prospec-
and three parameters controlling the dust fraction and reprocessing tor. The best fit model, as well as the 1σ dispersion in model realisations,
are shown. The inset shows the derived star-formation history, which is
(see Leja et al. 2017 for details). Leja et al. (2017) identify important
approximately flat at 1 − 2 M yr−1 prior to a steep drop in the last ∼ 1 Gyr.
degeneracies between age–metallicity–dust, and the dust mass–dust
attenuation curve. Prospector is specifically designed to account
for such degeneracies in parameter estimation using Markov chain
Monte Carlo analysis to fully explore the posterior probability density. Line Flux (10−16 erg s−1 cm−2 )
van Velzen et al. (2020) also used Prospector to model this galaxy Hβ 7.9 ± 1.7
(but only the PanSTARRS data); the mass and metallicity we find [O III] λ5007 8.0 ± 3.1
using the full SED are consistent with their results, within the [O I] λ6300 < 3.0
uncertainties. A difference in our modelling is that we allow for a Hα 14.2 ± 3.8
non-parametric star-formation history to better understand the age [N II] λ6584 7.6 ± 1.9
of the system. [S II] λλ6717, 6731 6.3 ± 1.0
The best-fitting model is shown compared to the archival pho- log ratio
tometry in Figure 8. We find stellar mass log(M∗ /M ) = 10.26+0.12 −0.15
,
0.04 ± 0.25
a sub-solar metallicity log Z/Z = −0.84+0.28
[O III] / Hβ
−0.34
(but see section 4.4), [N II] / Hα −0.25 ± 0.14
and a low specific star-formation rate log sSFR = −11.21+0.23 −0.55
in [S II] / Hα −0.32 ± 0.16
the last 50 Myr, where the reported values and uncertainties are the [O I] / Hα . −0.7
median and 16th/84th percentiles of the marginalized posterior dis-
tributions. The model also prefers a modest internal dust extinction, Table 1. Host emission line fluxes and BPT line ratios (Baldwin et al. 1981),
AV = 0.16 ± 0.04 mag. The stellar mass reported by prospector averaged over the X-shooter spectra.
is the integral of the star-formation history, and so includes stars
and stellar remnants. From our model we measure a ‘living’ mass
fraction (i.e. stars still undergoing nuclear burning) of 0.58 ± 0.02. show narrow lines from the host galaxy. We measure the fluxes
In the same figure, we plot the median and 1σ uncertainty of diagnostic narrow lines using Gaussian fits. Specifically, we
on the star-formation history derived from the fit versus lookback measure Hα, Hβ, [O III] λ5007, [O I] λ6300, [N II] λ6584, and
time since the Big Bang. We find a roughly constant star-formation [S II] λλ6717, 6731. We report the mean of each of these ratios
rate of ≈ 2 M yr−1 , prior to a sharp drop in the last ≈ 1.5 Gyr. (averaged over the six X-shooter spectra) in Table 1. No significant
A recent decline in star-formation is a common feature of TDE time evolution is seen in the narrow line fluxes. To estimate the
host galaxies, as evidenced by the over-representation of quiescent metallicity, we use the N2 metallicity scale ([N II] λ6584/Hα),
Balmer-strong galaxies (and the subset of post-starburst galaxies) adopting the calibration from Pettini & Pagel (2004), to find an
among this population (Arcavi et al. 2014; French et al. 2016, 2020a). oxygen abundance 12 + log(O/H) = 8.76 ± 0.14. This corresponds
Spectroscopy of the host after the TDE has completely faded will to a metallicity Z/Z = 1.17, more in keeping with a typical massive
be required to confirm whether this galaxy is also a member of this galaxy. However, this [N II] λ6584/Hα ratio is outside the range used
class. to calibrate the Pettini & Pagel (2004) relation, so this metallicity
may not be reliable. Applying the calibration of Marino et al. (2013),
valid over a wider range, we find a slightly lower metallicity of
12 + log(O/H) = 8.63, consistent with solar metallicity.
4.4 Galaxy emission lines and evidence for an AGN
Ratios of these lines are used in the Baldwin-Phillips-Terlovich
The metallicity preferred by prospector would be very low for (BPT) diagram (Baldwin et al. 1981) to probe the ionization mecha-
a galaxy of & 1010 M , though van Velzen et al. (2020) find nism of the gas. The ratios we measure for the host of AT2019qiz
similarly low metallicities for all TDE hosts in their sample, including (Table 1) lie intermediate between the main sequence of star-forming
AT2019qiz, from their SED fits. Spectroscopic line ratios provide a galaxies and galaxies with ionization dominated by an active galactic
more reliable way to measure metallicity. The TDE spectra clearly nucleus (AGN). This could be evidence of a weak AGN, or another
MNRAS 000, 1–22 (2020)8 M. Nicholl et al
44 UVOIR X-ray 10jh
log10 Lbol (ergs-1 )
44.5 18zr
42 16fnl
44.0 11af
log10 Lbol (ergs-1 )
09ge
43.5
40 14li
43.0 14ae
vHe = 0 N III > He II
20 15oi
TBB (103K)
42.5 19ahk
17eqx
15 42.0 18hyz
18dyb
41.5 19qiz
6 50 0 50 100 150 200
RBB (1014cm)
Rest-frame days from maximum light
4
2 Figure 10. Comparison of the bolometric light curve to other TDEs from
the literature (van Velzen et al. 2019; Holoien et al. 2016b; Gezari et al.
25 0 25 50 75 100 125 2012; Chornock et al. 2014; Arcavi et al. 2014; Holoien et al. 2014, 2016a;
Rest-frame days from maximum light Blagorodnova et al. 2017; Nicholl et al. 2019b; Gomez et al. 2020; Leloudas
et al. 2019).
Figure 9. Top: Bolometric light curve of AT2019qiz derived from UV
and optical photometry. The X-ray light curve is also plotted, which is that there is some support for a weak AGN, but that the galaxy is
≈ 103 times fainter than the optical luminosity at peak but slower to fade. dominated by stellar light.
Middle: Temperature evolution. Bottom: Evolution of the blackbody radius.
The temperature and radius are only shown for epochs covered without
extrapolation by data in at least three photometric bands. Vertical lines
indicate epochs of transition in the TDE spectrum, when the net blueshift of
5 PHOTOMETRIC ANALYSIS
He II goes to zero and when N III becomes prominent (section 6). 5.1 Bolometric light curve
We construct the bolometric light curve of AT2019qiz by interpolat-
ing our photometry in each band to any epoch with data in the g, r
source of ionization such as supernova shocks or evolved stars (Kew- or o bands, using superbol (Nicholl 2018). We then integrate under
ley et al. 2001). Several other TDE hosts lie in a similar region of the spectral energy distribution inferred from the multi-colour data at
the BPT parameter space (Wevers et al. 2019a; French et al. 2020a), each epoch, and fit a blackbody function to estimate the temperature,
while a number show direct evidence of AGN ionisation (Prieto et al. radius, and missing energy outside of the observed wavelength range.
2016). We note the caveat that if the lines in our spectra are excited A blackbody is an excellent approximation of the UV and optical
by AGN activity, the calibrations used to estimate the metallicity emission from TDEs (e.g van Velzen et al. 2020). However, we
may not always be valid. note that the radius is computed under the assumption of spherical
To test the AGN scenario, we look at the mid-infrared colours. symmetry, which may not reflect the potentially complex geometry
Stern et al. (2012) identify a colour cut W1 − W2 > 0.8 Vega mag in TDEs. We include foreground extinction, but do not correct for
to select AGN from WISE data. For the host of AT2019qiz, we find the uncertain extinction within the host galaxy (formally, this makes
W1 − W2 ≈ 0 Vega mag. At most a few percent of AGN have such a our inferred luminosity and temperature curves lower limits). The
blue W1 −W2 colour (Assef et al. 2013). Wright et al. (2010) employ bolometric light curve, temperature and radius evolution are plotted
a two-dimensional cut using the W1 − W2 and W2 − W3. The host in Figure 9.
of AT2019qiz has W2 − W3 = 1.8 mag, consistent with other spiral From the light curve we derive a peak date of MJD 58764 ± 1
galaxies. Thus the emission detected by WISE is dominated by the (2019-10-08 UT)7 , a peak luminosity of L = 3.6 × 1043 erg s−1 , and
galaxy, not an AGN. integrated emitted energy of Erad = 1.0 × 1050 erg. Taking the black
The ratio of X-ray to [O III] luminosity can also be used as an hole mass derived in section 4, the peak luminosity corresponds to
AGN diagnostic. Converting the X-rays to the 2-20 keV band using ∼ 0.2LEdd , where LEdd is the Eddington luminosity. We also plot
our best-fit power-law, we measure a mean LX /L[O III] = 2.4 ± 0.2, the X-ray light curve to highlight the X-ray to optical ratio, which is
which is consistent with a typical AGN (Heckman et al. 2005). 10−2.8 before peak. Since the X-rays appear to rise after the optical
However, the X-ray luminosity is only 0.03% of the Eddington emission starts to fade, this ratio increases to ≈ 10−2.0 − 10−1.8
luminosity for a SMBH of 106 M . Moreover, the temporal variation between 20 − 50 days after bolometric peak, and reaches ≈ 10−1.4
in the luminosity and hardness of the X-rays during the flare suggests beyond 50 days.
a significant fraction of this emission comes from the TDE itself, We plot the bolometric light curve compared to other well-
rather than an existing AGN. In particular, the softening of the X-rays observed TDEs in Figure 10. The fast rise (and decline), and low
could indicate that as time increases, more of the emission is coming peak luminosity place it intermediate between the bulk of the
from the TDE flare, relative to an underlying AGN with a harder
spectrum. Taking into account the BPT diagram, WISE colours,
X-rays, and the morphology of the nucleus (section 4.1), we conclude 7 The UV peaks slightly earlier (MJD 58764) than the optical (MJD 56766).
MNRAS 000, 1–22 (2020)Answers to the qiz 9
6 9 W2+10 W1+7 g+2.5 r+0 i-3
v = (2200 ± 100) km s-1 M2+8.5 U+5 c+1 o-1.5
6
Lbol (1043 ergs-1)
12
Apparent magnitude + constant
RBB (1014 cm)
4
4 15
2 2 18
1.99 ± 0.01
L∝t 21
0 0
30 20 10 0 10
24
43.5 t-5/3
27
t-(2.51 ± 0.030)
log10 Lbol (ergs-1 )
43.0
AT2019qiz
58750 58800 58850 58900 58950
42.5 MJD (days)
42.0
Figure 12. Fits to the multicolour light curve using the TDE model in mosfit
41.5 (Guillochon et al. 2018; Mockler et al. 2019).
0 50 100 150
Rest-frame days from maximum light
exactly tracks this fallback rate (e.g. Guillochon & Ramirez-Ruiz
2013; Gafton & Rosswog 2019).
Figure 11. Power-law fits to the light curve. Top: The photospheric radius
(grey crosses) before maximum light grows linearly with a velocity v ≈
2200 km s−1 , while the luminosity (black circles) is best-fit as L ∝ t 2 . Bottom:
5.2 TDE model fit
The declining light curve is steeper than the canonical t −5/3 .
To derive physical parameters of the disruption, we fit our multiband
light curves using the Modular Open Source Fitter for Transients
TDE population and the original ‘faint and fast’ TDE, iPTF16fnl (mosfit; Guillochon et al. 2018) with the TDE model from Mockler
(Blagorodnova et al. 2017; Brown et al. 2018; Onori et al. 2019). et al. (2019). This model assumes a mass fallback rate derived from
The pre-maximum-light photospheric radius and temperature simulated disruptions of polytropic stars by a SMBH of 106 M
are unusually well constrained in AT2019qiz due to the early de- (Guillochon et al. 2014), and uses scaling relations and interpolations
tections and multi-colour photometry. The temperature is initially for a range of black hole masses, star masses, and impact parameters.
constant at ≈ 20, 000 K before the light curve peaks, and then sud- The free parameters of the model, as defined by Mockler et al. (2019),
denly declines to ≈ 15, 000 K over a period of ∼ 20 days. It stays are the masses of the black hole, M• , and star, M∗ ; the scaled impact
constant for the remainder of our observations, barring a possible parameter b; the efficiency of converting accreted mass to energy;
slight dip around day 100 (though at this phase the UV data are the normalisation and power-law index, Rph,0 and lph , connecting the
noisier due to the large fractional host contribution that has been radius to the instantaneous luminosity; the viscous delay time Tν (the
subtracted). time taken for matter to circularise and/or move through the accretion
The blackbody radius grows linearly up to maximum light, with disk) which acts approximately as a low pass filter on the light curve;
a best-fit velocity of 2200 km s−1 (Figure 11). Extrapolating back the time of first fallback, t0 ; the extinction, proportional to the
to radius R = 0 implies a time of disruption 30.6 days before peak. hydrogen column density nH in the host galaxy; and a white noise
The radius then remains constant during the cooling phase identified parameter, σ. The priors follow those used by Mockler et al. (2019),
in the temperature curve, before decreasing smoothly at constant and reflect the range of SMBH masses where optically-bright TDEs
temperature. are expected (e.g. van Velzen 2018), the range of impact parameters
We fit the rising light curve with a power-law of the form covering both full and partial disruptions, accretion efficiencies for
L = L0 ((t − t0 )/τ)α using the curve_fit function in scipy. We non-rotating to maximally-rotating black holes, and a broad range
fix the initial time t0 = 30.6 days, as inferred from the expanding of possible photospheres and viscous timescales (see Mockler et al.
photosphere (we find a near-identical fit to the light curve even if 2019 for details).
t0 is left free). The best fit has a rise timescale τ = 10.9 days and The fits are applied using a Markov Chain Monte Carlo (MCMC)
α = 1.99 ± 0.01. We plot this fit alongside the fit to the radius method implemented in emcee (Foreman-Mackey et al. 2013) using
in Figure 11. Holoien et al. (2019) modelled the rise of the TDE the formalism of Goodman & Weare (2010). We burn in the chain
AT2019ahk, detected very soon after disruption, and also found a for 10,000 steps, and then continue to run our simulation until the
power-law consistent with α ≈ 2. potential scale reduction factor (PSRF) is < 1.1, indicating that the
We fit the declining light curve with a power-law function of fit has converged. We plot 100 realisations of the Markov Chain in
the same form. As shown in the lower panel of Figure 11, we find a the space of our light curve data in Figure 12. The model provides
best-fit α = −2.54, which is steeper than the canonical L ∝ t −5/3 a good fit to the optical bands, but struggles slightly to resolve the
predicted by simple fallback arguments (Rees 1988). However this is sharp peak present in the UV bands.
not unusual among the diverse array of TDEs in the growing observed From this fit we derive the posterior probability distributions
sample, and more recent theoretical work does not find a universal of the parameters, listed in Table 2, with two-dimensional posteriors
power-law slope for the mass return rate, nor that the light curve plotted in the appendix. The inferred t0 is MJD 58737 ± 1, i.e. 27 ± 2
MNRAS 000, 1–22 (2020)10 M. Nicholl et al
Parameter Prior Posterior Units -9d
log (M• ) [5, 8] 5.89+0.05
−0.06
M 1d
M∗ [0.01, 100] 0.97 ± 0.04 M 11d
b [0, 2] 0.22+0.02
−0.03 21d
log( ) [−2.3, −0.4] −2.23+0.14
−0.05 35d
log (Rph,0 ) [−4, 4] 1.12 ± 0.06
lph [0, 4] 0.66 ± 0.03
65d
log (Tv ) [−3, 3] 0.74+0.05 days 96d
F + constant
−0.06
t0 [−50, 0] −7.04+0.52
−0.60
days 125d
log (nH,host ) [19, 23] 20.03+0.26
−0.48
cm−2
log σ [−4, 2] −0.72 ± 0.02
Table 2. Priors and marginalised posteriors for the mosfit TDE model. Priors
are flat within the stated ranges, except for M∗ , which uses a Kroupa initial
mass function. The quoted results are the median of each distribution, and
error bars are the 16th and 84th percentiles. These errors are purely statistical;
Mockler et al. (2019) provide estimates of the systematic uncertainty.
days before peak, consistent with the simpler power-law models.
This suggests that the first detection of AT2019qiz is about a week 4000 5000 6000 7000
after the beginning of the flare. The physical parameters point to Rest-frame wavelength (Å)
the disruption of a roughly solar mass main sequence star by a
black hole of mass 105.9 M . This is consistent with the lower AT2019qiz 35d
end of the SMBH mass range estimated from spectroscopy and iPTF16fnl 12d
the M• − σ relation. In this case, the peak luminosity corresponds
Scaled F - continuum
to 0.36LEdd (the Eddington luminosity). This is consistent with
the typical Eddington ratios measured for a sample of TDEs with
well-constrained SMBH masses (Wevers et al. 2019a).
The scaled impact parameter, b = 0.22 ± 0.02, corresponds
to a physical impact parameter β ≡ Rt /Rp = 0.86 ± 0.03, where AT2019qiz 95d
Rt is the tidal radius and Rp the orbital pericentre. For the inferred iPTF16fnl 33d
SMBH mass, Rt = 23RS , where RS is the Schwarzschild radius.
Using the remnant mass versus β curve from Ryu et al. (2020)
for a 1 M star, up to ∼ 25% of the star could have survived this
encounter. Interestingly, Ryu et al. (2020) predict a mass fallback rate
proportional to t −8/3 in this case (which they call a ‘severe partial 4500 5000 5500 6000 6500 7000 7500
disruption’), which is remarkably close to our best-fit power-law Rest-frame wavelength (Å)
decline, t −2.54 .
Figure 13. Top: Selected spectra from X-shooter, EFOSC2 and Binospec
after subtraction of the host galaxy model (following the method outlined in
6 SPECTROSCOPIC ANALYSIS the appendix). We have applied the subtraction procedure to all spectra, but
The early spectra are dominated by a steep blue continuum indicative here show only this subset (spanning the full range of observed phases) for
of the high photospheric temperature (15,000-20,000 K), superposed clarity. Bottom: Comparison of AT2019qiz to X-shooter spectra of iPTF16fnl
(from Onori et al. 2019), the only TDE with a faster light curve evolution than
with broad emission bumps. As the spectra evolve and the continuum
AT2019qiz. The continuum has been removed using polynomial fits. The
fades, the emission lines become more sharply peaked, while the spectra shortly after maximum light are quite similar for these two events,
host contribution becomes more prominent. In all the analysis that though the Balmer lines are much weaker at late times in iPTF16fnl.
follows, we first subtract the host galaxy light using the model SED
from prospector (section 4). The full set of host-subtracted spectra,
along with further details of the subtraction process, are shown in emission lines from both the TDE and the host galaxy. prospector
the appendix. In Figure 13, we plot a subset of high signal-to-noise allows to the user to turn nebular emission lines on and off; for
ratio, host-subtracted spectra spanning the evolution from before the bulk of our analysis we use the predictions from prospector
peak to more than 100 days after. to subtract nebular lines, but in Figure 14 we leave the nebular
emission in our data for completeness. Balmer emission lines are at
all times visible, with both a broad TDE component and a narrow
6.1 Line identification
host component. The other strong host lines are those used for the
To focus on the line evolution, we subtract the continuum using a 6th- BPT analysis in section 4.
order polynomial, with sigma-clipping to reject the line-dominated As well as hydrogen, we also identify broad emission lines of
regions during the fit. The host- and continuum-subtracted spectra He II λ4686, the Bowen fluorescence lines of N III λ4100 and λ4640
obtained with X-shooter are shown in Figure 14 (only this subset is and likely O III λ3670 (Bowen 1935; Blagorodnova et al. 2019;
shown for clarity of presentation). We identify and label the strong Leloudas et al. 2019), and possible weak emission of He I λ5876.
MNRAS 000, 1–22 (2020)Answers to the qiz 11
8
-9d
F (10-16 ergs-1 cm-2 Å-1)
O III H H H N III H H N III He II H 1d
6
35d
4 65d
96d
2 125d
140d
0
[O II] [O III]
3600 3800 4000 4200 4400 4600 4800 5000 5200
8
-9d
F (10-16 ergs-1 cm-2 Å-1)
[N II] He I H He I 1d
6
35d
4 65d
96d
2 125d
140d
0
[N II] [S II]
5400 5600 5800 6000 6200 6400 6600 6800 7000
Rest-frame wavelength (Å)
Figure 14. Host-subtracted X-shooter spectra after fitting and subtracting the continuum to highlight the emission lines. All strong lines from the TDE (solid
coloured lines) and nebular emission in the host galaxy (grey dotted lines) are labelled. Note that the higher-order Balmer lines (H , etc) and continuum
bluewards of ∼ 4000 Å may not be reliable, as we lack pre-disruption photometry to constrain the host galaxy model at these wavelengths.
The combination of hydrogen lines with the He II/Bowen blend at (6170-6270 Å, 7100-7150Å). The Hα profile is initially asymmetric
around 4600 Å is common in TDE spectra, and qualify AT2019qiz and shallow, with a blueshifted peak and a broad red shoulder.
as a TDE-Bowen in the recent classification scheme proposed by The red side may include some contribution from He I λ6678, but
van Velzen et al. (2020), or an N-rich TDE in the terminology of this is likely not a major contributor as we see only very weak
Leloudas et al. (2019). He I λ5876. We initially fit the profile as the sum of two Gaussians
In our light curve comparison, we found that AT2019qiz ap- whose normalisations and velocity widths vary independently, with
peared fainter and faster than nearly any other TDE except for one centroid fixed at zero velocity and the other free to vary. The
iPTF16fnl (see also section 7.2 for a more quantitative discussion). three velocities (two widths and one offset) are plotted in Figure 15.
We plot a spectroscopic comparison in the lower panel of Figure 13. We find that the zero-velocity component is at all times narrower
The spectrum of AT2019qiz at about a month after maximum shows than the offset component, and over time decreases in width as the
several similarities to iPTf16fnl at a slightly earlier phase of 12 days, line becomes sharply peaked. The asymptotic velocity full-width at
particularly in the blue wing of Hα, though AT2019qiz exhibits a half-maximum (FWHM) is ≈ 2000 km s−1 . The broader component
broader red wing. The ratio of Hα compared to He II is also quite is always redshifted, though this shift decreases as the red shoulder
consistent between these two events, modulo the slower evolution becomes less prominent. This component maintains a width of
in AT2019qiz. At later times, the Balmer lines become weaker in ∼ 15, 000 km s−1 , though the scatter in measuring this component is
iPTF16fnl, though Hα narrows and becomes more symmetric, as we quite large at later times when the shoulder is less prominent. We
see in AT2019qiz. In fact, the ratios and velocity profiles of these confirm that this feature is not a blend with He I, as the velocity
lines evolve substantially with time, as we saw in Figure 14. We will offset does not match the wavelength of that line (and varies over
now investigate this in detail in the following sections. time).
If the broadening of the redshifted component is due to rotation,
the implied radius of the emitting material is ≈ 200RS ≈ 5 − 10Rp .
6.2 The Hα profile
This is consistent with the size of TDE accretion disks in the
We look first at the Hα line. This region of the spectrum is plotted in simulations of Bonnerot & Lu (2020). Disk profiles in TDE emission
velocity coordinates in Figure 15. We have subtracted the continuum lines have been claimed in PT09djl (Arcavi et al. 2014; Liu et al.
locally using a linear fit to line free regions at either side of the line 2017) and AT2018hyz (Short et al. 2020; Hung et al. 2020). However
MNRAS 000, 1–22 (2020)12 M. Nicholl et al
v0 (103 kms-1)
Gauss+Gauss
20 Gauss+R18
-9d -9d
1d 1d
Normalized F + constant
Normalized F + constant
0
35d 35d 4
Gauss+Gauss
3 Gauss+R18
L0/Lred
65d 65d 2
1
96d 96d 0
vred, Gauss (103 kms-1)
125d 125d Width Redshift
20
140d 140d
10 He I 6678
H He I H He I
20 10 0 10 20 20 10 0 10 20 0
0 50 100 150
Velocity (103 kms-1 ) Velocity (103 kms-1 ) Rest-frame days from maximum light
Figure 15. Left: Double-Gaussian fits to the continuum-subtracted Hα line profile (only X-shooter spectra shown for clarity). One component is fixed around
zero velocity with a variable width, while the other can vary in both width and red/blue-shift. The summed profile is shown as a solid line, while the fixed-centre
and shifted profiles are shown as dotted lines. Middle: Same as left, but the offset component is now replaced with a 5000 km s−1 outflow profile from Roth &
Kasen (2018). Right: Velocity and flux measurements from fits. The component with a fixed centre at zero velocity exhibits a similar evolution in both the
double-Gaussian (left) and Gaussian+outflow (middle) models. In the former, this component is at all times narrower than the redshifted component (bottom
panels). The broad component is not consistent with He I λ6678 (at various times it is centered at either too high or too low velocity). The flux ratio of the
narrow component to the offset/outflow component increases over time from ∼ 0.5 to ∼ 1 for both models.
the difficulty in interpreting these line profiles is illustrated by the case from the data is lower than any of the available models, apart from
of AT2018zr (also called PS18kh), which had flat-topped Balmer in the earliest epochs where a model with v = 5000 km s−1 gives
lines argued by Holoien et al. (2018) to originate in an ellipical an acceptable match. We will return to the early-time line profile in
disk and by Hung et al. (2019) to instead come from an outflow. detail in section 6.5.
AT2019qiz does not show a classic flat-topped or ‘double-horned’ We fit the Hα profiles again, this time as a sum of a Gaus-
disk profile at early or late phases, though it is interesting to note that sian centred at zero velocity (as before) and the v = 5000 km s−1
around 20 days after maximum (e.g. Figure 13), the red shoulder outflow model from RK18. The zero-velocity component could
temporarily resembles a second peak, with the blue peak close to correspond to emission from pre-existing gas, since the RK18 profile
rest wavelength. should account for the TDE emission self-consistently. The only
To produce this profile with a disk model would require a highly free parameter for the outflow component is the normalisation of
elliptical disk, viewed close to edge on and with a near-vertical the RK18 spectrum. This gives a good fit at early (. 0 days) and
orientation of the pericenter with respect to the observer, as was late (& 50 days) times, but gives an inferior fit around 30 days
suggested to be the case for PT09djl by Liu et al. (2017). If we were compared to the double-Gaussian model. We note that the published
to interpret the day 20 Hα profile of AT2019qiz as a disk, it would model assumed a photospheric radius of 2.7 × 1014 cm, similar
be surprising to find the same highly specific geometry in two out to the blackbody radius of AT2019qiz well before and after peak,
of four TDEs with claimed disk signatures. On the other hand the whereas at peak the radius of AT2019qiz is a factor of & 2 larger,
transient appearance of a double-peaked profile at this phase after which may explain this discrepancy. As is shown in Figure 15, the
peak would be reminiscent of AT2018hyz. The transience of these velocity of the Gaussian core, and the ratio of luminosity between the
signatures could be due to either optical depth effects (Short et al. broad component and the zero-velocity component, are comparable
2020; Gomez et al. 2020) or contamination by an additional emission between the double-Gaussian and Gaussian+RK18 fits.
component (Hung et al. 2020). Detailed time-series modelling with In both models, when the narrow core of the line is revealed at
disk profiles will be needed to confirm if this scenario is compatible late time we measure v ≈ 2000 km s−1 . Rather than line emission
with AT2019qiz. from the TDE itself, an alternative interpretation of the line profile
Alternatively, this redshifted component could correspond to is a pre-existing broad line region (BLR) illuminated by the TDE
emission from the receding part of an outflow, and a Gaussian or (recalling that this galaxy shows evidence for hosting an AGN;
double-Gaussian profile may be an oversimplification. Roth & Kasen section 4). Interpreting the width of the narrow component as a
(2018) (hereafter, RK18) calculated line profiles including the effects Keplerian velocity would yield an orbital radius ≈ 5 × 1015 cm
of electron scattering above a hot photosphere in an outflowing gas. (≈ 104 Schwarzschild radii, RS ). We note that an outflow from the
Qualitatively, their models show properties similar to AT2019qiz: TDE can reach this distance and interact with a BLR within 100
a blueshifted peak (seen here only at early times) and a broad red days if the expansion velocity is & 6000 km s−1 .
shoulder. A decreasing optical depth or velocity in these models At least one previous TDE in a galaxy hosting an AGN has
leads to a narrow core. We compare the observed Hα profiles in shown evidence of lighting up an existing BLR (PS16dtm; Blanchard
Figure 15 to models from RK18, but we find that the implied velocity et al. 2017), and further candidates have been discovered (Kankare
MNRAS 000, 1–22 (2020)You can also read