Transcription factor RFX7 governs a tumor suppressor network in response to p53 and stress
←
→
Page content transcription
If your browser does not render page correctly, please read the page content below
Published online 1 July 2021                                                       Nucleic Acids Research, 2021, Vol. 49, No. 13 7437–7456
                                                                                                         https://doi.org/10.1093/nar/gkab575

Transcription factor RFX7 governs a tumor
suppressor network in response to p53 and stress
Luis Coronel 1 , Konstantin Riege1 , Katjana Schwab1 , Silke Förste1 , David Häckes1 ,
Lena Semerau1 , Stephan H. Bernhart2 , Reiner Siebert3 , Steve Hoffmann1,* and
Martin Fischer 1,*
1
 Computational Biology Group, Leibniz Institute on Aging – Fritz Lipmann Institute (FLI), Beutenbergstraße 11, 07745
Jena, Germany, 2 Transcriptome Bioinformatics Group, Department of Computer Science and Interdisciplinary Center

                                                                                                                                                                  Downloaded from https://academic.oup.com/nar/article/49/13/7437/6312752 by guest on 06 December 2021
for Bioinformatics, Leipzig University, Härtelstraße 16-18, 04107 Leipzig, Germany and 3 Institute of Human Genetics,
Ulm University and Ulm University Medical Center, Albert-Einstein-Allee 23, 89081 Ulm, Germany

Received March 16, 2021; Revised May 25, 2021; Editorial Decision June 15, 2021; Accepted June 21, 2021

ABSTRACT                                                                          INTRODUCTION
Despite its prominence, the mechanisms through                                    RFX7 belongs to a family of eight transcription factors
which the tumor suppressor p53 regulates most                                     that share a highly conserved DNA-binding domain (DBD)
genes remain unclear. Recently, the regulatory fac-                               through which they can bind to cis-regulatory X-box motifs
tor X 7 (RFX7) emerged as a suppressor of lymphoid                                (1–3). While RFX transcription factors were first uncovered
                                                                                  in mammals (4), they have been identified throughout meta-
neoplasms, but its regulation and target genes medi-
                                                                                  zoan life and beyond (1,5). RFX5 is the closest sibling of
ating tumor suppression remain unknown. Here, we
                                                                                  RFX7, and while the expression of most RFX genes is re-
identify a novel p53-RFX7 signaling axis. Integrative                             stricted to specific cell types, RFX1, RFX5, and RFX7 dis-
analysis of the RFX7 DNA binding landscape and the                                play ubiquitous expression (3,6). Whole-genome sequenc-
RFX7-regulated transcriptome in three distinct cell                               ing efforts led us and others to discover RFX7 mutations in
systems reveals that RFX7 directly controls multiple                              13–15% of Epstein-Barr Virus-negative Burkitt lymphoma
established tumor suppressors, including PDCD4,                                   patients (7,8). Additionally, genome-wide association stud-
PIK3IP1, MXD4, and PNRC1, across cell types and is                                ies linked RFX7 to chronic lymphocytic leukemia (9–11).
the missing link for their activation in response to p53                          RFX7 alterations have also been identified in diffuse large
and stress. RFX7 target gene expression correlates                                B cell lymphoma (12), acute myeloid leukemia (13), as well
with cell differentiation and better prognosis in nu-                             as in mouse models of lymphoma (12,14) and leukemia (15).
                                                                                  In addition to hematopoietic neoplasms, RFX7 has been as-
merous cancer types. Interestingly, we find that RFX7
                                                                                  sociated with body fat distribution (16), Alzheimer’s disease
sensitizes cells to Doxorubicin by promoting apop-                                (17), and autism spectrum disorder (18), suggesting that
tosis. Together, our work establishes RFX7’s role as                              RFX7 may function in various cell types and tissues. While
a ubiquitous regulator of cell growth and fate deter-                             human RFX7 is functionally uncharacterized, first insights
mination and a key node in the p53 transcriptional                                from animal models identified Rfx7 to play a role in anuran
program.                                                                          neural development (19) and maturation and metabolism in
                                                                                  murine lymphoid cells (20). Importantly, the regulation of
GRAPHICAL ABSTRACT                                                                RFX7 and its target genes mediating tumor suppression are
                                                                                  unknown.
                                                                                     In response to stress conditions, p53 transcriptionally
                                                                                  regulates a plethora of target genes to suppress tumori-
                                                                                  genesis (21,22). Thereby, p53 influences diverse cellular
                                                                                  processes, including apoptosis, cell cycle progression, and
                                                                                  metabolism. Using integrative omics approaches, we started
                                                                                  to disentangle the p53 gene regulatory network (GRN) into
                                                                                  subnetworks of genes controlled directly by p53 or indi-
                                                                                  rectly through downstream transcription factors (23,24).

* To
   whom correspondence should be addressed. Tel: +49 3641 656876; Fax: +49 3641 656255; Email: Martin.Fischer@leibniz-fli.de
Correspondence may also be addressed to Steve Hoffmann. Email: Steve.Hoffmann@leibniz-fli.de

C The Author(s) 2021. Published by Oxford University Press on behalf of Nucleic Acids Research.
This is an Open Access article distributed under the terms of the Creative Commons Attribution-NonCommercial License
(http://creativecommons.org/licenses/by-nc/4.0/), which permits non-commercial re-use, distribution, and reproduction in any medium, provided the original work
is properly cited. For commercial re-use, please contact journals.permissions@oup.com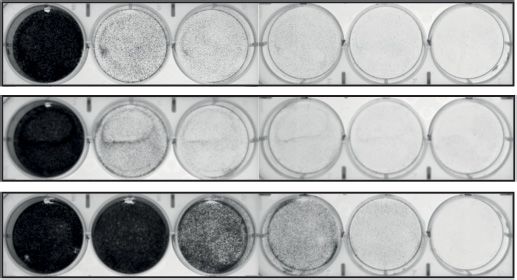
7438 Nucleic Acids Research, 2021, Vol. 49, No. 13
For example, p53 regulates the largest subset of genes in- Phosphatase treatment
directly through its direct target gene CDKN1A, encod-
Whole cell lysates were extracted from HCT116 cells treated
ing cyclin-dependent kinase inhibitor p21 and reactivat-
with Nutlin-3a or DMSO using RIPA buffer (Thermo
ing DREAM and RB:E2F trans-repressor complexes to
Fisher Scientific) without protease or phosphatase in-
down-regulate cell cycle genes (23–27). Intriguingly, indirect
hibitors. Lysates were exposed to PNGase F and Shrimp Al-
down-regulation of cell cycle genes by p53 is well conserved,
kaline Phosphatase (New England Biolabs) enzymes. Sam-
while direct p53 targets diverged substantially during evo-
ples were preincubated with 1× Glycoprotein denaturing
lution (28,29). Yet, complex cross-talks between signaling
buffer (New England Biolabs) for 10 min at 100◦ C. Next,
pathways impede the identification of indirect regulations.
1× GlycoBuffer, 1% NP-40 and 1× Cut Smart Buffer (New
Uncovering the molecular mechanisms through which p53
England Biolabs) were added to the lysate and incubated for
indirectly controls most p53-regulated genes, therefore, re-
1 h at 37◦ C. 10 g of whole cell lysates were incubated for
mains a longstanding challenge (22).
1 h at 37◦ C as control. 4× LDS buffer was added to all sam-
Our findings place the understudied transcription factor
Downloaded from https://academic.oup.com/nar/article/49/13/7437/6312752 by guest on 06 December 2021
ples to a final concentration of 1×. All samples were boiled
RFX7 immediately downstream of p53 and provide com-
at 100◦ C for 5 min. Finally, proteins were separated using a
pelling evidence for RFX7’s ubiquitous role in governing
precast 3–8% Criterion Tris-Acetate protein gel (Bio Rad)
growth regulatory pathways. We reveal that RFX7 orches-
and a Criterion Cell (Bio Rad) in Tris-acetate buffer.
trates multiple established tumor suppressor genes in re-
sponse to cellular stress. Thus, RFX7 emerges as a crucial
regulatory arm of the p53 tumor suppressor. In the context Chromatin immunoprecipitation, RNA extraction and re-
of cancer biology, the general importance of this new sig- verse transcription semi-quantitative real-time PCR (RT-
naling axis is exemplified by the better prognosis of patients qPCR)
with a medium to high expression of RFX7 targets across
the TCGA pan-cancer cohort, which indicates recurrent de- ChIP was performed with the SimpleChIP Kit (Cell Signal-
regulation of RFX7 signaling in cancer. ing Technology, Canvers, MA, USA) following the manu-
facturer instructions. 3 g of p53 (kind gift from Dr Bern-
hard Schlott (30)) or RFX7 (#A303-062A Bethyl Labora-
MATERIALS AND METHODS
tories, Montgomery, TX, USA) antibody were used per IP.
Cell culture, drug treatment and transfection Sonication was performed on a Bioruptor Plus (Diagen-
ode, Seraing, Belgium). ChIP-qPCR was performed with
U2OS and HCT116 cells (ATCC, Manassas, VA, USA)
a Quantstudio 5 (Thermo Fisher Scientific) using Power
were grown in high glucose Dulbecco’s modified Eagle’s
SYBR Green MasterMix (Thermo Fisher Scientific) follow-
media (DMEM) with pyruvate (Thermo Fisher Scien-
ing the manufacturer protocol.
tific, Darmstadt, Germany). RPE-1 hTERT cells (ATCC)
Total cellular RNA was extracted using the RNeasy Plus
were cultured in DMEM:F12 media (Thermo Fisher Sci-
Mini Kit (Qiagen, Hilden, Germany) following the manu-
entific). Culture media were supplemented with 10% fe-
facturer protocol. One-step reverse transcription and real-
tal bovine serum (FBS; Thermo Fisher Scientific) and
time PCR was performed with a Quantstudio 5 using Power
penicillin/streptomycin (Thermo Fisher Scientific). Cell
SYBR Green RNA-to-CT 1-Step Kit (Thermo Fisher Sci-
lines were tested at least twice a year for Mycoplasma con-
entific) following the manufacturer protocol. We identified
tamination using the LookOut Detection Kit (Sigma), and
ACTR10 as a suitable control gene that is not regulated
all tests were negative.
by p53 but expressed across 20 gene expression profiling
Cells were treated with DMSO (0.15%; Carl Roth, Karl-
datasets (23). Generally, two or three biological replicates
sruhe, Germany), Nutlin-3a (10 M; Sigma Aldrich, Darm-
with three technical replicates each were used. Given the na-
stadt, Germany), Actinomycin D (5 nM; Cayman Chemi-
ture of the technical setup, a few individual data points were
cals, Ann Arbor, MI, USA), or Doxorubicin (1 M or as
erroneous and, thus, excluded.
indicated; Cayman Chemicals) for 24 h. For knockdown
Primer sequences are listed in Supplementary Table S5.
experiments, cells were seeded in six-well plates or 6 cm
dishes and reverse transfected with 5 nM Silencer Select siR-
NAs (Thermo Fisher Scientific) using RNAiMAX (Thermo Western blot analysis
Fisher Scientific) and Opti-MEM (Thermo Fisher Scien-
tific) following the manufacturer protocol. Cells were lysed in RIPA buffer (Thermo Fisher Scien-
Images of cells were taken using an Evos M5000 micro- tific) containing protease and phosphatase inhibitor cock-
scope (Thermo Fisher Scientific) or a ChemiDoc MP doc- tail (Roche, Grenzach-Wyhlen, Germany or Thermo Fisher
umentation system (Bio-Rad, Feldkirchen, Germany). Scientific). Protein lysates were scraped against Eppendorf
rack for 20 times and centrifuged with 15 000 rpm for 15 min
at 4◦ C. The protein concentration of supernatant lysates
Cycloheximide chase assay
was determined using the Pierce 660 nm Protein Assay
U2OS were seeded in 5-cm dishes (200 000 cells per dish). Kit (Thermo Fisher Scientific) and a NanoDrop1000 Spec-
The following day, the cells were treated with DMSO or trophotometer (Thermo Fisher Scientific). Proteins were
Nutlin-3a for 24 h. Next, cells were recovered in media separated in a Mini-Protean TGX Stain-Free Precast 4–
containing 150 M cycloheximide (Cayman Chemicals) or 15% Gel (Bio-Rad) using Tris/Glycine/SDS running buffer
DMSO. Finally, proteins were extracted at 0, 0.5, 1, 2, 3, and (Bio-Rad). Proteins were transferred to a 0.2 m polyvinyli-
4 h time points and assessed by western blot analyses. dene difluoride (PVDF) transfer membrane either using aNucleic Acids Research, 2021, Vol. 49, No. 13 7439
Trans-Blot Turbo Mini Transfer Pack (Bio-Rad) in a Trans- 15. The top X-box motif recovered from the de novo anal-
Blot Turbo (Bio-Rad) or using a Mini Trans-Blot Cell (Bio- ysis of the 120 overlap peaks with relaxed log odds detec-
Rad) in a Mini-Protean Tetra Cell (Bio-Rad). Following an- tion threshold of 7 was used to discover X-boxes across
tibody incubation, membranes were developed using Clar- hg38 using HOMER’s ‘scanMotifGenomeWide’. Conser-
ity Max ECL (Bio-Rad) and a ChemiDoc MP imaging sys- vation plots displaying the average vertebrate PhastCons
tem (Bio-Rad). score (43) were generated using the Conservation Plot tool
Antibodies and their working concentrations are listed in in Cistrome (44). The Cis-regulatory Element Annotation
Supplementary Table S5. System (CEAS) tool in Cistrome (44) was used to identify
the enrichment of binding sites at genome features. Genes
Pre-processing of Illumina sequencing data associated with RFX7 peaks were identified using BETA-
minus in Cistrome (44) with a threshold of 5 kb from the
Quantification and quality check of libraries were per-
TSS. To identify whether RFX7 functions as an activator or
formed using the Agilent Bioanalyzer 2100 in combina-
repressor of gene transcription, we employed BETA anal-
Downloaded from https://academic.oup.com/nar/article/49/13/7437/6312752 by guest on 06 December 2021
tion with the DNA 7500 Kit. Libraries were pooled and se-
ysis (45) in Cistrome (44). CistromeDB toolkit (46) was
quenced on a NextSeq 500 (75 bp, single-end), HiSeq 2500
used to identify TFs that display ChIP-seq peak sets (top
(50 bp, single-end), and NovaSeq 6000 (S1 or SP, 100 cy-
10k peaks) that are significantly similar to the set of 120
cles). Sequence information was extracted in FastQ format
common RFX7 peaks. Bigwig tracks were generated us-
using Illumina’s bcl2FastQ v2.19.1.403 or v2.20.0.422.
ing deeptools ‘bamCoverage’ with options –binSize 1 and
We utilized Trimmomatic (31) v0.39 (5nt sliding window
–extendReads 150 (47).
approach, mean quality cutoff 22) for read quality trim-
Publicly available p53 ChIP-seq data from Nutlin-3a-
ming according to inspections made from FastQC (https:
treated U2OS (48) and HCT116 (49) cells was obtained
//www.bioinformatics.babraham.ac.uk/projects/fastqc/)
from CistromeDB (46). Ten publicly available RFX5 ChIP-
v0.11.9 reports. Illumina universal adapter as well as
seq datasets from A549, GM12878, HepG2, hESC, IMR90,
mono- and di-nucleotide content was clipped using Cu-
K562, MCF-7, HeLa, and SK-N-SH cells were obtained
tadapt v2.10 (32). Potential sequencing errors were detected
from CistromeDB and joined using BEDTools ‘multiinter’
and corrected using Rcorrector v1.0.3.1 (33). Ribosomal
followed by ‘merge’. RFX5 peaks supported by at least 5
RNA (rRNA) transcripts were artificially depleted by
out of the 10 datasets were kept for further analyses.
read alignment against rRNA databases through Sort-
MeRNA v2.1 (34). The preprocessed data was aligned to
the reference genome hg38, retrieved along with its gene RNA-seq and analysis
annotation from Ensembl v.92 (35), using the mapping
Cellular RNA was obtained as described above in biologi-
software segemehl (36,37) v0.3.4 with adjusted accuracy
cal triplicates or quadruplets. Quality check and quantifica-
(95%) and split-read option enabled (RNA-seq) or disabled
tion of total RNA were performed using the Agilent Bioan-
(ChIP-seq). Mappings were filtered by Samtools v1.10
alyzer 2100 in combination with the RNA 6000 Nano Kit
(38) for uniqueness and properly aligned mate pairs. We
(Agilent Technologies). Libraries were constructed from 1
removed duplicated reads with Picard MarkDuplicates
g of total RNA using Illumina’s TruSeq stranded mRNA
v2.23.4.
Library Preparation Kit or from 500 ng total RNA using
NEBNext Ultra II RNA–polyA+ (mRNA) Library Prepa-
ChIP-seq and analysis
ration Kit (New England Biolabs) following the manufac-
ChIP was performed as described above in biological du- turer’s description.
plicates for RFX7 ChIP and input DNA from Nutlin-3a Following pre-processing of the data (see above), read
and DMSO control treated U2OS, HCT116, and RPE-1 quantification was performed on exon level using feature-
cells. Libraries were constructed using the NEBNext Ul- Counts v1.6.5 (50), parametrized according to the strand
tra II DNA Library Preparation Kit (New England Bio- specificity inferred through RSeQC v3.0.0 (51). Differen-
labs, Frankfurt am Main, Germany) following the manu- tial gene expression and its statistical significance was iden-
facturer’s description. Following pre-processing of the se- tified using DESeq2 v1.20.0 (52). Given that all RNA-
quencing data (see above), biological replicates of each in- seq data was derived from PolyA-enriched samples, we
put and IP were pooled prior to peak calling with MACS2 only included Ensembl transcript types ‘protein coding’,
v2.2.7.1 (39) with q-value cutoff 0.05. MACS2 was exe- ‘antisense’, ‘lncRNA’, and ‘TEC’ in our analysis. Com-
cuted in both available modes utilizing either the learned mon thresholds for |log2 (fold-change)| ≥ 0.25 and adj. P-
or a customized shifting model parameterized according value < 0.01 were applied to detect significant differen-
to the assumed mean fragment length of 150 bp as ex- tial expression. Publicly available RNA-seq data from hu-
tension size. The resulting peak sets were merged by over- man p53-negative HL-60 promyelocytes differentiating into
lap with BEDTools v2.29.2 (40). Per interval, the strongest macrophages or neutrophils was obtained from GEO ac-
enrichment signal under the associated peak summits as cession number GSE79044 (53). Publicly available RNA-
well as the lowest P-value and q-value was kept. Peaks seq data from of human umbilical cord blood-derived un-
with an enrichment7440 Nucleic Acids Research, 2021, Vol. 49, No. 13
GSE96642 (55). RNA-seq data from human cells were pro- 0.8 and 1.6 M) or 5-FU (3.1, 6.2, 12.5, 25 and 50 M)
cessed as described above. Publicly available RNA-seq data for 24 h. All plates were then recovered in drug-free media
from conditional Rfx7 knock-out mice was obtained from and growth continued for another 7 days. After 7 days of re-
GEO accession number GSE113267 (20). The mouse RNA- covery, cells were stained with crystal violet containing glu-
seq data was processed as described above, but aligned to taraldehyde solution and briefly rinsed with plain water.
the mouse reference genome mm10. Given the naturally
larger variation in tissue samples, thresholds for |log2 (fold-
change)| ≥ 0.25 and adj. P-value ≤0.05 were applied to de- Annexin V assay
tect significant differential expression.
HCT116 cells were transfected with 5 nM of respective siR-
NAs using RNAiMAX. The next day, the transfected cells
p53 Expression Score were seeded six-well plates (50 000 cells per well) contain-
The p53 Expression Score has been published in a pre- ing 2 ml of culture media. After 24 h transfection, cells were
Downloaded from https://academic.oup.com/nar/article/49/13/7437/6312752 by guest on 06 December 2021
vious meta-analysis (23) and reflects a summary of p53- challenged with either DMSO or treated with different Dox-
dependent gene expression from 20 genome-wide p53- orubicin concentrations (0.05, 0.075, 0.1, 0.15 and 0.2 M)
dependent gene expression profiling datasets. In each for 24 h. All plates were then recovered in drug-free media
dataset a gene was identified either as significantly down- and growth continued for another 6 days. Cells were stained
regulated (score −1), significantly up-regulated (score +1), with Annexin V and PI using the Annexin V Apoptosis De-
or not significantly regulated (score 0) by p53. The p53 Ex- tection Kit I (BD Biosciences, San Jose, CA, USA) follow-
pression Score displays for each gene the sum of the scores ing the manufacturer instructions. Cell staining was quan-
from all 20 datasets in the meta-analysis. tified through flow cytometry on a BD FACSAria Fusion
(BD Biosciences) and flow cytometry data was analyzed us-
ing FACSDiva 9.0.1 (BD Biosciences).
Transcription factor binding and motif enrichment analysis
We used iRegulon (56) to identify transcription factors and
motifs that are enriched within 500 bp upstream of the TSS Survival analysis
or within 10 kb around the TSS of selected genes. Survival analyses for Cancer Genome Atlas (TCGA) cases
were based on the expression of a set of 19 direct RFX7
Cell viability data from the Cancer Dependency Map targets. Specifically, genes in this set were required to have
(DepMap) project been identified in all three cell line models (Figure 4D) and
The DepMap project pursued a systematic knockdown of to have a p53 Expression Score >5 to avoid the inclusion
genes in a large panel of cancer cell lines to identify genes of cell cycle genes and to filter for a reproducibly strong
that are essential for cancer cell viability (57). RFX7 data p53-RFX7 signaling response. This 19-gene-set comprises
was available for 343 cell lines in which RFX7 was depleted TP53INP1, PNRC1, MXD4, PIK3IP1, TOB1, PIK3R3,
by RNAi (depmap.org). The DEMETER2 score is a depen- SESN3, YPEL2, PLCXD2, SLC43A2, CCND1, IP6K2,
dency score that reflects the effect of a given knockdown TSPYL2, RFX5, PDCD4, CCNG2, ABAT, TSPYL1, and
on cell viability (58). Negative dependency scores reflect de- JUNB. We retrieved clinical data and FPKM normalized
creased cell viability upon loss of the target gene, while pos- gene expression values from TCGA using the R pack-
itive scores indicate increased cell viability. age TCGAbiolinks v2.18.0 (59). For the whole pan-cancer
set and for each of the 33 cancer types we calculated
single-sample expression scores for the 19-gene-set from
Cell proliferation and viability assay FPKM transformed quantification data using the official
U2OS and HCT116 were transfected with 5 nM of respec- GenePattern codebase v10.0.3 for single sample gene set
tive siRNAs using RNAiMAX. The next day, cells were enrichment analysis (ssGSEA; https://github.com/GSEA-
seeded in 96-well plates (9000 cells per well). After 24 h MSigDB/ssGSEA-gpmodule) (60). A single-sample expres-
of transfection, cells were treated with Doxorubicin, 5-FU, sion score measures the degree of coordinated up or down-
Nutlin-3a, or DMSO control for 24 h. Subsequently, the regulation of genes in the given set. Subsequently, we subdi-
cells recovered for 6 days in fresh drug-free media. WST- vided the expression scores into three equally sized catego-
1 reagent (Sigma Aldrich) was added for 2 h following rial groups (high, medium, low). Kaplan-Meier plots and
the manufacturer protocol before absorbance was mea- multivariate Cox regression analysis based on the expres-
sured at 440 nm on a M1000pro microplate reader (Tecan, sion groups were performed on clinical time to event and
Männedorf, Switzerland). event occurrence information using the R survival package
v3.2–3. The Cox proportional hazards (PH) model was used
to investigate the relation of patient survival and categorical
Clonogenic assay
expression levels. To control for confounding factors, gen-
HCT116 cells were transfected with 5 nM of respective siR- der and age were included into all models. In case of the
NAs using RNAiMAX. The next day, the transfected cells pan-cancer cohort, we further included cancer type into the
were seeded six-well plates (50 000 cells per well) contain- regression analysis. The rates of occurrence of events over
ing 2 ml of culture media. After 24 h transfection, cells were time were compared between the groups using the fitted
challenged with either DMSO or treated with different con- PH model. Additionally, the distribution of gender, age, and
centrations of Doxorubicin (0.05, 0.075, 0.1, 0.15, 0.2, 0.4, cancer type were visualized for each categorial group.Nucleic Acids Research, 2021, Vol. 49, No. 13 7441
Statistics were identified in all six RFX5 ChIP-seq tracks (Figure
1A). Notably, PDCD4, PIK3IP1, MXD4, and PNRC1 en-
ChIP and RT-qPCR data was analyzed using a two-sided
code established tumor suppressors, which have not yet
unpaired t-test. Cell viability data from WST-1 assays were
been established as p53-responsive genes (64–67). To this
analyzed using a Sidak-corrected two-way ANOVA test.
end, we employed the osteosarcoma cell line U2OS, which
Mean Z-scores were compared using a two-sided paired t-
possesses intact p53 and is frequently used to study p53
test. Violin plots display the median. Bar graphs display
and its signaling pathway (23). To specifically activate p53,
mean and standard deviation. *, **, ***, and n.s. indicate
we pharmacologically inhibited MDM2, the central gate-
P-values7442 Nucleic Acids Research, 2021, Vol. 49, No. 13
A B
C
Downloaded from https://academic.oup.com/nar/article/49/13/7437/6312752 by guest on 06 December 2021
D
E
F
G
Figure 1. The p53 target RFX7 mediates p53-dependent gene activation. (A) Our previous meta-analysis identified 1392 genes as frequently up-regulated
by p53 (p53 Expression Score ≥ 5). Out of these genes, 311 displayed frequent p53 binding within 2.5 kb of their TSS and represent high-probability direct
p53 targets (23). Transcription factors enriched for binding within 500 bp upstream from the TSS of the remaining 1081 genes were identified using publicly
available ChIP-seq data. ChIP-seq datasets with a normalized enrichment score (NES) > 2.5 are displayed. (B) The p53-dependent regulation of RFX
family encoding genes across 20 datasets from a meta-analysis (23). Genes were identified as significantly up-regulated (green; +1), down-regulated (red;
−1), or not significantly differentially regulated (white; 0). The p53 Expression Score represents the summary across all 20 datasets. (C) Genome browser
snapshot displaying publicly available p53 binding signals from Nutlin-3a-treated U2OS and HCT116 cells at the RFX7 gene locus. Red arrows indicate
two p53 binding signals in RFX7 intron1, one located 5 (RFX7 5 ) and one 3 (RFX7 3 ). (D) RT-qPCR data of selected direct RFX7 targets in U2OS cells.
Normalized to siControl#1 DMSO. ACTR10 served as negative control. TP53, RFX1, RFX5, and RFX7 are shown as knockdown controls. CDKN1A is a
positive control for p53 induction by Nutlin-3a. Mean and standard deviation is displayed. Statistical significance obtained through a two-sided unpaired
t-test, n = 9 replicates (three biological with three technical each). (E) Western blot analysis of RFX7, p53, PDCD4, PIK3IP1, and actin (loading control)
levels in U2OS cells transfected with siControl, siRFX7, or siTP53 and treated with Nutlin-3a or dimethyl sulfoxide (DMSO) solvent control. (F) RFX7
and (G) p53 ChIP-qPCR of selected RFX7 targets in Nutlin-3a and DMSO control-treated U2OS cells transfected with siControl (siCtrl) or siTP53.
GAPDH served as negative control. MDM2 served as positive control for p53 binding. Mean and standard deviation is displayed. Statistical significance
obtained through a two-sided unpaired t-test, n = 3 technical replicates.Nucleic Acids Research, 2021, Vol. 49, No. 13 7443
MXD4, PNRC1, and RFX5 was delayed. Only PNRC1 dis- Nutlin-3a and DMSO control with phosphatase. However,
played a minor but significant up-regulation following 6 h the differently migrating forms of RFX7 were unaffected by
Nutlin-3a treatment, while PDCD4, PIK3IP1, MXD4, and phosphatase treatment, while the phospho-signal at thre-
RFX5 started to display significant up-regulation after 12 h onine 172 of the AMPK␣ subunit vanished (Figure 2H).
treatment (Figure 2A). Immunoblot analyses indicate a These results indicate that the migration pattern of RFX7
rapid and accumulating induction of p53. Similarly, the is not affected by differential phosphorylation.
lower migrating form of RFX7 is detectable after 6 h treat- Given the diversity of the investigated cell lines, our data
ment time already, and gradually becomes the predomi- suggest that the novel p53-RFX7 signaling axis influences
nant form of RFX7 upon 12 and 24 h Nutlin-3a treatment. numerous cell types. Together, our findings establish RFX7
PIK3IP1 protein levels increased after 12 and 24 h treat- as an important means for p53 to expand its GRN to potent
ment, while PDCD4 protein displayed substantial increase tumor suppressor genes in numerous cell types.
only after 24h Nutlin-3a treatment (Figure 2B). The delayed
up-regulation of RFX7 targets underscores the indirect reg-
Downloaded from https://academic.oup.com/nar/article/49/13/7437/6312752 by guest on 06 December 2021
The RFX7 DNA binding landscape enriches proximal pro-
ulation by p53.
moter regions
Given the strong association of RFX7’s lower migrating
form with RFX7 activity, we performed a cycloheximide The identification of p53 as an upstream regulator of RFX7
chase assay to assess the effect of translation and protein enabled us to induce RFX7 levels and activity pharmaco-
turnover. The rapid turnover of p53 (69) served as a posi- logically. Although RFX7 emerged as a potent suppressor
tive control. In DMSO control-treated cells, the higher mi- of lymphoid cancers and putative cancer driver in Burkitt
grating form of RFX7 was predominant and its levels de- lymphoma (7,8,12,72), the mechanisms underlying its tu-
clined with a half-life of approximately 1.5 h. In cells pre- mor suppressor function remain elusive. Given that RFX7
treated with Nutlin-3a, the lower migrating form of RFX7 is a transcription factor, it seems natural that its tumor sup-
was predominant. Surprisingly, the lower migrating form pressor function is mediated through its target genes. To
vanished rapidly with a half-life of less than 1 h. However, identify RFX7 target genes genome-wide, we performed
it was not degraded but shifted back to the higher migrat- ChIP-seq in Nutlin-3a and DMSO control-treated U2OS,
ing form, which was stable for at least 4 h of translation HCT116 and RPE-1 cells (Figure 3A, Supplementary Ta-
inhibition by cycloheximide (Figure 2C). These results in- ble S1). Substantially more RFX7 binding sites were iden-
dicate that the lower migrating form of RFX7 is rapidly in- tified in Nutlin-3a compared to DMSO control-treated
duced by p53 and strongly associated with RFX7 activity cells (Supplementary Table S1), underlining the importance
(Figure 2A and B). Importantly, it appears not to be gen- of inducing RFX7 levels and activity to identify RFX7-
erated through translation, and is reversible in the absence dependent genome regulation. We focused further investi-
of translation (Figure 2C). Thus, it may stem from a tightly gations on sites occupied by RFX7 across all three cell types
regulated post-translational modification. upon Nutlin-3a treatment (Figure 3A). RFX7 binding sites
To test whether the p53-dependent function of RFX7 is are phylogenetically conserved (Figure 3B) and predomi-
cell type-specific or represents a more ubiquitous mecha- nantly located near transcriptional start sites (TSSs) (Figure
nism, we employed the colorectal cancer cell line HCT116 3C). De novo search for motifs underlying RFX7 binding
and the hTERT-immortalized non-cancerous retina pig- sites revealed an X-box that is commonly recognized by the
mented epithelium cell line RPE-1, both of which possess RFX family (2) and a CCAAT-box known to recruit NF-
wild-type p53. ChIP-qPCR analysis confirmed that p53 Y (73) (Figure 3D). Corroborating the ChIP-qPCR results
binds to two sites in RFX7 intron1 in U2OS, HCT116, (Figure 1F), Nutlin-3a treatment led to increased RFX7
and RPE-1 cells (Figure 2D), and the binding is specific as DNA occupancy genome-wide (Figure 3E). For example,
shown by its dependence on p53 availability (Figure 2E). the p53-RFX7-regulated genes PNRC1 and MXD4 (Figure
Notably, we identified high-confidence p53 responsive el- 1D and E) display RFX7 binding near their TSSs, which in-
ements (p53RE) that underlie the two p53 binding sites creased upon Nutlin-3a treatment (Figure 3F). Enrichment
(70), and data from the GeneHancer collection (71) indi- analysis identified RFX5 and its co-factor CIITA, FOS,
cate that both p53 binding sites in RFX7 intron1 overlap NF-Y, CREB1, EP300, and STAT3, among others, to share
with enhancer regions that are associated with RFX7 ex- a significant number of binding sites with RFX7 (Figure
pression (Supplementary Figure S1B). Similar to our results 3G), which indicates that RFX5 and RFX7 bind to simi-
from U2OS cells (Figure 1D and E), PDCD4, PIK3IP1, lar sites and that RFX7, similar to RFX5 (74), may cooper-
MXD4, and PNRC1 were induced upon Nutlin-3a treat- ate with the CCAAT-box binding NF-Y. Given that RFX5
ment in HCT116 and RPE-1 cells in a p53 and RFX7- but not RFX1 was identified to share binding sites with
dependent manner, while CDKN1A was not affected by RFX7 (Figure 3G), we compared the RFX7 X-box motif
RFX7 depletion (Figure 2F). Protein levels of PDCD4 and (Figure 3D) with known X-box motifs of the RFX family to
PIK3IP1 largely followed the p53-RFX7-dependent regula- identify potential differences. RFX7 shares the X-box motif
tion of their mRNAs (Figure 2G). with other RFX family members, but it shows a clear dis-
In HCT116 cells, the migration pattern of the higher and tinction. While RFX1-3 bind to a palindromic X-box com-
lower migrating RFX7 differed the most among all three prising two half-sites (2), RFX7 - similar to RFX5 - binds
cell lines tested. Given that the lower migrating form of to an X-box with only one half-site (Figure 3H). Although
RFX7 may result from post-translational modification, we the RFX family shares a conserved DBD, there are differ-
tested whether it is affected by phosphorylation. Therefore, ences in their motif recognition, which offers an explanation
we treated whole cell lysates from HCT116 cells treated with for sites that are exclusively bound by RFX7 and RFX5.7444 Nucleic Acids Research, 2021, Vol. 49, No. 13
A B
D
Downloaded from https://academic.oup.com/nar/article/49/13/7437/6312752 by guest on 06 December 2021
C E
F
G H
Figure 2. p53-activated RFX7 functions in numerous cell types. (A) RT-qPCR data of PDCD4, PIK3IP1, MXD4, PNRC1, and RFX5 in U2OS cells
treated with DMSO solvent control or Nutlin-3a (N3A) for 6, 12 or 24 h. Normalized to ACTR10 negative control and siControl DMSO sample. Mean
and standard deviation is displayed. Statistical significance obtained through a two-sided unpaired t-test, n = 6 replicates (two biological with three
technical each). RFX7 is shown as knockdown control. CDKN1A is a positive control for p53 induction by Nutlin-3a. (B) Immunoblot analysis of RFX7,
p53, PDCD4, PIK3IP1 and actin (loading control) levels in U2OS cells treated with DMSO solvent control or Nutlin-3a for 6, 12 or 24 h. (C) Immunoblot
analysis of RFX7, p53 and actin (loading control) levels in U2OS cells following a cycloheximide chase assay. U2OS cells were pre-treated 24 h with
Nutlin-3a or DMSO control (first treatment). Then, cells were treated with cycloheximide or DMSO control (second treatment). (D) ChIP-qPCR of p53
binding to GAPDH (negative control), MDM2 (positive control), and the 5 (RFX7 5 ) and 3 (RFX7 3 ) sites in RFX7 intron1 from U2OS, HCT116
and RPE-1 cells treated with Nutlin-3a or DMSO solvent control. Statistical significance obtained through a two-sided unpaired t-test, n = 3 technical
replicates. (E) ChIP-qPCR of p53 binding to GAPDH (negative control), MDM2 (positive control), and the 5 (RFX7 5 ) and 3 (RFX7 3 ) sites in RFX7
intron1 from HCT116 cells transfected with siControl or siTP53 and treated with Nutlin-3a or DMSO solvent control. Statistical significance obtained
through a two-sided unpaired t-test, n = 3 technical replicates. (F) RT-qPCR data of PDCD4, PIK3IP1, MXD4 and PNRC1 in HCT116 and RPE-1 cells.
Normalized to ACTR10 negative control and siControl DMSO sample. Mean and standard deviation is displayed. Statistical significance obtained through
a two-sided unpaired t-test, n = 6 replicates (two biological with three technical each). TP53 and RFX7 are shown as knockdown controls. CDKN1A is a
positive control for p53 induction by Nutlin-3a. (G) Western blot analysis of RFX7, p53, PDCD4, PIK3IP1 and actin (loading control) levels in HCT116
and RPE-1 cells transfected with siControl, siRFX7, or siTP53 and treated with Nutlin-3a or DMSO solvent control. (H) Immunoblot analysis of RFX7,
pThr172-AMPK␣ (positive control for phosphatase treatment), and actin (loading control) in lysates from HCT116 cells treated with Nutlin-3a or DMSO
control for 24 h. Whole cell lysates (input) were treated with phosphatase and incubated for 30 min at 37◦ C (phosphatase). Incubation of cell lysates for
30 min at 37◦ C without phosphatase served as control (37◦ C control).Nucleic Acids Research, 2021, Vol. 49, No. 13 7445
A B D
E
Downloaded from https://academic.oup.com/nar/article/49/13/7437/6312752 by guest on 06 December 2021
C
F
H
G
I
Figure 3. The DNA binding landscape of RFX7. (A) Number of RFX7 ChIP-seq peaks identified in Nutlin-3a-treated U2OS, HCT116 and RPE-1 cells.
(B) Average vertebrate PhastCons conservation score at the 120 common RFX7 binding sites. (C) CEAS Enrichment on annotation analysis (44) for the
120 common RFX7 peaks compared to the human genome hg38. (D) Top motifs identified by de novo motif analysis using HOMER under the 120 peaks
commonly identified in all three cell lines. (E) Mean RFX7 occupancy (ChIP-seq read counts) at the 120 common RFX7 binding sites. (F) Genome browser
images displaying RFX7 ChIP-seq signals and predicted X-boxes at the PNRC1 and MXD4 gene loci. (G) Transcription factor ChIP-seq peak sets from
CistromeDB that overlap significantly with the 120 common RFX7 binding sites. (H) Comparison of known X-box motifs from RFX family members
with the X-box we identified for RFX7. Known motifs were obtained from the HOMER motif database. (I) The overlap of the 120 common RFX7 binding
sites with 7877 RFX5 binding sites supported by at least 5 out of 10 ChIP-seq datasets.7446 Nucleic Acids Research, 2021, Vol. 49, No. 13
However, comparing the binding site repertoire of RFX5 S3) (20). Direct RFX7 target genes down-regulated upon
and RFX7 revealed a substantial difference as RFX7 occu- Nutlin-3a treatment comprise cell cycle genes, including
pies only a small subset of RFX5 binding sites (Figure 3I). DOLPP1, XRCC1, CDK4, CKAP2, FAM111A, and CKS2,
Together, these findings show that RFX7 differs markedly that become down-regulated through the trans-repressor
from all other members of the RFX transcription factor complex DREAM (23). These Nutlin-3a-repressed genes
family, including its phylogenetically closest sibling RFX5. display a more marked decrease in mRNA levels when
RFX7 is missing, suggesting that RFX7 partially counter-
RFX7 functions as a trans-activator to alter the transcrip- acts and limits their p53-dependent down-regulation. Given
tome that RPE-1 is no established cell line model in p53 research,
we provide data showing that depletion of p53 in RPE-
To complement the RFX7 DNA binding landscape,
1 abrogated the Nutlin-3a-induced regulation of all those
we identified the RFX7-regulated transcriptome through
genes (Figure 4D). This includes RFX7 itself for which a
RNA-seq analyses of U2OS, HCT116 and RPE-1 cells
p53-dependent induction could not be observed in RPE-1
Downloaded from https://academic.oup.com/nar/article/49/13/7437/6312752 by guest on 06 December 2021
treated with Nutlin-3a or DMSO control. While RT-qPCR
cells using RT-qPCR (Figure 2F). Direct RFX7 target genes
with its high technical variance showed significant up-
identified in at least two of the three cell lines comprise a set
regulation of RFX7 only in U2OS (Figure 1D) and HCT116
of 57 genes (Table 1). Gene ontology enrichment analysis in-
but not in RPE-1 cells (Figure 2F), RNA-seq data con-
dicated that RFX7 target genes could play a role in biolog-
firmed significant Nutlin-3a-induced up-regulation of both
ical processes such as regulation of the cell cycle, transcrip-
RFX5 and RFX7. At the same time, RFX1 was not in-
tion, lipid phosphorylation, DNA metabolic process, and
duced (Figure 4A). Notably, RNA-seq data did not indi-
spinal cord development (Supplementary Table S4). In ad-
cate alternative splicing or alternative transcription initia-
dition to regulating multiple tumor suppressors directly, our
tion upon Nutlin-3a treatment (Supplementary Figure S1B)
data reveal a large p53-dependent subnetwork co-directed
strongly suggesting that the lower migrating form of RFX7
by RFX7 (Supplementary Figure S2, Supplementary Table
is not associated with a specific transcript isoform. De-
S2), further highlighting the impact of the novel p53-RFX7
pletion of RFX7 caused up and down-regulation of sev-
signaling axis.
eral hundred genes (Figure 4B, Supplementary Table S2).
Integration of our meta-analysis data (23) showed that
While RFX7-dependent regulation was observed to be cell
most direct RFX7 targets become up-regulated by p53
line-specific at large, we identified multiple genes affected
in various cell types and in response to multiple stimuli
by RFX7 depletion across cell lines. Genes down-regulated
(Figure 5A). Consequently, we tested whether RFX7 af-
upon RFX7 knockdown enriched for RFX5 binding and
fected their regulation in response to cellular stress. To
NF-Y motifs. In contrast, up-regulated genes enriched for
this end, we employed Doxorubicin and Actinomycin D,
AP-1 (JUN/FOS) binding and motifs (Figure 4C). The
which are well-established to induce the p53 program (23).
fact that RFX7 occupies similar sites as RFX5 and NF-
Doxorubicin is a topoisomerase II inhibitor that causes
Y (Figure 3G) already indicates that RFX7 may predom-
DNA double-strand breaks while Actinomycin D inhibits
inantly trans-activate its target genes. Indeed, integration
rRNA transcription inducing ribosomal stress. PDCD4,
of ChIP-seq and transcriptome data corroborates RFX7’s
PIK3IP1, MXD4, and PNRC1 were up-regulated in re-
trans-activator function (Supplementary Figure S1B). In
sponse to Nutlin-3a, Actinomycin D, and Doxorubicin
turn, the set of genes directly activated by RFX7 might in-
treatment. The up-regulation was attenuated when p53 or
directly convey repressive effects on the highly cell-type spe-
RFX7 were depleted. The direct p53 target CDKN1A was
cific AP-1 signaling.
up-regulated p53-dependent and RFX7-independent (Fig-
ure 5B). These results identify RFX7 as a missing link to
The RFX7 target gene network comprises multiple tumor
up-regulate numerous tumor suppressor genes in response
suppressors and responds to stress
to stress.
We integrated the RFX7 DNA binding landscape and
the RFX7-regulated transcriptome to infer potential direct
High RFX7 target gene expression is associated with better
RFX7 target genes genome-wide. We identified 51, 87 and
prognosis in cancer patients and cell differentiation
73 potential direct RFX7 targets in U2OS, HCT116 and
RPE-1 cells, respectively, and these direct RFX7 targets in- We and others identified RFX7 as a putative cancer driver
clude PDCD4, PIK3IP1, MXD4, and PNRC1 (Figure 4D). in Burkitt Lymphoma (7,8), and mouse data confirmed its
Most strikingly, target genes up-regulated through the p53- tumor suppressor function in lymphoma development (12).
RFX7 axis comprise additional tumor suppressor genes, Here, we identified RFX7 to induce well-established tu-
such as ABAT (75), CCNG2 (76), IP6K2 (77), OTUD5 (78), mor suppressor genes in numerous cell types (Figure 4D).
REV3L (79), RPS6KA5 (also known as MSK1) (80), TOB1 To assess whether RFX7 may affect cell growth and tu-
(81), TSC22D1 (82), and TSPYL2 (83). Most direct RFX7 mor development also in cell types outside the lymphoid
targets were up-regulated in response to Nutlin-3a treat- lineage, we resorted to publicly available cell viability data
ment in siControl-transfected cells, and the up-regulation from the DepMap project (57). Intriguingly, RFX7 knock-
was impaired or abrogated when RFX7 was depleted (Fig- down increased the viability of the majority of 343 cell lines
ure 4D). Notably, 15, 19 and 16 (20–30%) of direct RFX7 tested, while the viability of lymphoma cell lines increased
target genes identified in U2OS, HCT116 and RPE-1 cell, the most (Figure 6A). Given that RFX7 appears to restrict
respectively, displayed conserved Rfx7-dependent expres- cell growth across a wide range of cell types, we sought to as-
sion in mouse spleen or bone marrow (Supplementary Table sess the potential role of RFX7 signaling in numerous can-Nucleic Acids Research, 2021, Vol. 49, No. 13 7447
A B C
Downloaded from https://academic.oup.com/nar/article/49/13/7437/6312752 by guest on 06 December 2021
D
Figure 4. The RFX7-regulated transcriptome. (A) TPM (Transcripts Per Kilobase Million) expression values of RFX1, RFX5 and RFX7 obtained from
RNA-seq analysis from U2OS, HCT116 and RPE-1 cells treated with Nutlin-3a or DMSO solvent control. Statistical significance data from DESeq2
analysis. (B) Number of genes significantly (FDR < 0.01) up (log2 FC ≥ 0.25; red venn diagrams) or down-regulated (log2 FC ≤ 0.25; green venn diagrams)
following siRFX7 treatment in DMSO (bottom venn diagrams) and Nutlin-3a-treated (upper venn diagrams) U2OS, HCT116 and RPE-1 cells. (C) Top
5 transcription factors and binding motifs enriched among genes significantly up or down-regulated following RFX7 depletion in at least two Nutlin-3a-
treated cell lines. (D) Heatmap of RNA-seq data for direct RFX7 target genes that bind RFX7 within 5 kb from their TSS according to ChIP-seq data
and are significantly (FDR < 0.01) down-regulated (log2 FC ≤ –0.25) following RFX7 depletion in Nutlin-3a treated U2OS, HCT116 and RPE-1 cells.
Significant (FDR < 0.01) p53-dependent regulation is indicated at the left. Asterisks (*) indicate conserved Rfx7-dependent expression in mouse spleen
or bone marrow (20) (Supplementary Table S3). Violin plots correspond to the heatmaps and display the mean Z-score of all these genes for the different
treatment conditions. The median is indicated by a black line. Statistical significance obtained using a two-sided paired t-test.7448 Nucleic Acids Research, 2021, Vol. 49, No. 13
Table 1. Direct RFX7 target genes. Set of 57 direct RFX7 target genes also with the differentiation of human pluripotent stem cells
identified as bound by RFX7 and down-regulated upon RFX7 knockdown into lung alveolar cells (Figure 6C). Together, these results
in at least two of the three cell lines (Figure 4D). Genes within the 19-gene- indicate a potentially widespread role of RFX7 in promot-
set used for survival analyses are marked bold
ing cell differentiation.
ABAT DIP2A KLF9 PTMS TOB2
ARL15 DOLPP1 MAF RAB40B TOP2B
ATRX DSE MXD4 RAP2A TP53INP1 RFX7 sensitizes cells to Doxorubicin and promotes apoptosis
CABIN1 EMC9 NRSN2-AS1 REV3L TSC22D1
CAT FAM111A OTUD5 RFX5 TSPYL1 Given the potentially widespread role of RFX7 in cancer
CCND1 FAM214A PDCD4 RMND5A TSPYL2 (Figures 6B and 7), we sought to identify potential benefits
CCNG2 HNRNPUL2 PI4K2A RPS6KA5 UBE2H that could be conferred by the loss of RFX7 irrespective of
CDK4 INTS3 PIK3IP1 SESN3 XRCC1 p53. The activation of RFX7 in response to cellular stress
CIC IP6K2 PIK3R3 SLC43A2 YPEL2
CKAP2 JUNB PLCXD2 SOX12
(Figure 5) prompted us to investigate the role of RFX7 in
the stress response. To this end, we challenged U2OS os-
Downloaded from https://academic.oup.com/nar/article/49/13/7437/6312752 by guest on 06 December 2021
CKS2 KDM4A PNRC1 SOX4
DDIT4 KDM6B PRKCZ TOB1 teosarcoma and HCT116 colorectal cancer cells with dif-
ferent concentrations of Doxorubicin. Intriguingly, WST-1
assays showed that RFX7 depletion significantly increased
the viability of U2OS and HCT116 cells challenged with
cer types. Therefore, we resorted to the cancer genome atlas low concentrations of Doxorubicin, with HCT116 showing
(TCGA) that comprises patient data from 33 cancer types the highest benefit (Figure 8A). Confirming previous results
(84), and we tested whether RFX7 target gene expression is (88,89), depletion of p53 did not increase the viability. We
associated with patient survival. To avoid confounding ef- further assessed the response in HCT116 cells, and, in addi-
fects from cell cycle genes, which are well-established to be tion to Doxorubicin, we employed the pyrimidine analog 5-
associated with worse prognosis across cancer types (85), we Fluorouracil (5-FU), to test whether RFX7 sensitizes cells
used a subset of 19 direct RFX7 target genes that are fre- to a broad range of p53-inducing stresses. Notably, 5-FU
quently up-regulated by p53. Strikingly, higher expression largely induces ribosomal stress to activate p53, a mecha-
of these direct RFX7 targets correlates significantly with nism similar to that of actinomycin D (90). Confirming pre-
better prognosis across the whole TCGA pan-cancer cohort vious results (88), depletion of p53 led to increased survival
(Figure 6B and Supplementary Figure S3). Survival analy- of HCT116 cells challenged with 5-FU. Depletion of RFX7,
ses using data from the 33 individual cancer types revealed however, did not lead to an increased viability (Figure 8B).
that in 11 out of the 33 individual cancer types higher ex- Similar to cells challenged with 5-FU, also cells challenged
pression of the RFX7 targets correlates significantly with with Nutlin-3a were de-sensitized by p53 depletion but not
better prognosis (Figure 7). These findings indicate that following depletion of RFX7 (Figure 8C). These findings in-
RFX7 signaling is frequently de-regulated in cancer. To- dicate that RFX7 is neither required for p53-mediated cell
gether, these data indicate a ubiquitous role of RFX7 in re- killing nor does it sensitize cells to ribosomal stress.
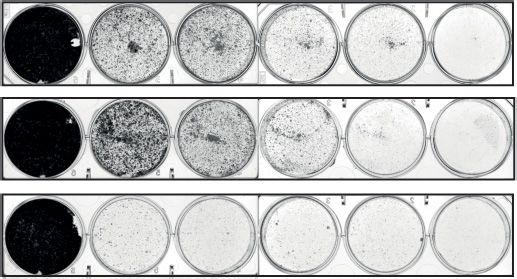
stricting cell growth and potential clinical implications of A clonogenic assay validated that p53 but not RFX7 sen-
this new signaling axis in numerous cancer types. sitized cells to 5-FU treatment (Figure 8D). Moreover, both
Cell differentiation represents an anti-proliferative mech- clonogenic and Annexin V assays corroborated that RFX7
anism that is typically circumvented by cancer (86). More sensitizes cells to low concentrations of Doxorubicin (Fig-
differentiated cancer cells are characterized as low grade ure 8E and F). Importantly, Annexin V assays revealed that
and are often associated with a favorable prognosis. No- the increased cell viability upon RFX7 depletion was asso-
tably, RFX7 orthologs have been shown to play a role in ciated with significantly reduced apoptosis (Figure 8G). The
the development of murine natural killer cells (20) and beneficial effect of RFX7 depletion was attenuated when
in the neural development of frogs (19). Given that sev- cells were treated with high concentrations of Doxorubicin.
eral direct RFX7 targets have been associated with cell Thus, RFX7 appears to sensitize cells to low concentrations
differentiation, such as the MYC antagonist MXD4 (also of Doxorubicin through promoting apoptosis, indicating a
known as MAD4) (87), we tested whether RFX7 could role of RFX7 in cell fate determination in response to spe-
play a more general role during differentiation. Therefore, cific types of stress induced by Doxorubicin.
we assessed the expression of RFX7 target genes when
human p53-negative HL-60 promyelocytes differentiated
DISCUSSION
into macrophages or neutrophils. Interestingly, RFX7 tar-
get gene expression correlated significantly positively with p53 is the best-known tumor suppressor, but it remains un-
macrophage and neutrophil differentiation (Figure 6C), in- clear how it regulates large parts of its GRN. Our findings
dicating a potential role for RFX7 in hematopoietic dif- place the understudied transcription factor RFX7 immedi-
ferentiation that is independent of p53. Further, RFX7 ately downstream of p53 in regulating multiple genes. RFX7
target gene expression correlated positively with the dif- emerged recently as an essential regulator of lymphoid cell
ferentiation of human umbilical cord blood-derived unre- maturation (20) and a putative cancer driver mutated in
stricted somatic stem cells into neuronal-like cells (Figure hematopoietic neoplasms (72). While these observations are
6C), which is in agreement with the reported role of RFX7 in agreement with the maximal expression of RFX7 in lym-
in the neural development of frogs (19) and its association phoid tissue (6,20), our results using human osteosarcoma,
with neurological diseases (17,18). Intriguingly, the expres- colorectal cancer, and non-cancerous retinal pigment ep-
sion of RFX7 target genes correlates significantly positively ithelial cells establish a ubiquitous role of RFX7 in regu-Nucleic Acids Research, 2021, Vol. 49, No. 13 7449
Downloaded from https://academic.oup.com/nar/article/49/13/7437/6312752 by guest on 06 December 2021
Figure 5. RFX7 up-regulates its target genes in response to stress. (A) The p53-dependent regulation of direct RFX7 target genes (Table 1) across 20 datasets
from a meta-analysis (23). Genes were identified as significantly up-regulated (green; +1), down-regulated (red; −1), or not significantly differentially
regulated (white; 0). The p53 Expression Score represents the summary across all 20 datasets. No meta-analysis data was available for NRSN2-AS1 and
HNRNPUL2. (B) RT-qPCR data from U2OS cells depleted for RFX7 or p53 and treated with DMSO control, Nutlin-3a (N3A), Actinomycin D (AD) and
Doxorubicin (Dox). RT-qPCR data normalized to ACTR10 and siControl DMSO levels. Mean and standard deviation is displayed. Statistical significance
of RT-qPCR data obtained through a two-sided unpaired t-test, n = 6 replicates (two biological with three technical each).7450 Nucleic Acids Research, 2021, Vol. 49, No. 13
A B
C
Downloaded from https://academic.oup.com/nar/article/49/13/7437/6312752 by guest on 06 December 2021
Figure 6. RFX7 limits cell viability, and RFX7 target gene expression correlates with good prognosis in cancer and cell differentiation. (A) Cell viability
data from depmap.org (57). DEMETER2 dependency scores (58) are based on RNAi mediated knockdown of RFX7 in 343 cell lines. Top panel displays
data for all 343 cell lines and bottom panel displays groups of cell lines that show DEMETER2 scores significantly different to all other cell lines. Groups
are based on tissue origin. Negative dependency scores reflect decreased cell viability upon loss of the target gene, while positive scores indicate increased
cell viability. (B) Kaplan–Meier plot of patients from the TCGA pan-cancer cohort. Patients were grouped into low, medium, and high based on the rank
expression of 19 direct RFX7 target genes that display a p53 Expression Score > 5 (23). Statistical significance obtained through the Cox proportional
hazards (PH) model (Cox likelihood ratio test variable). To correct for major confounding factors, cancer type, gender and age were included into the
multivariate regression analysis. Statistical significance of the rates of occurrence of events over time between the groups was obtained using the fitted
Cox PH model (Cox likelihood ratio test groups). Complementary data displayed in Supplementary Figure S3. (C) Gene set enrichment analysis (GSEA)
of 57 direct RFX7 target genes in human p53-negative HL-60 promyelocytes differentiated into macrophages or neutrophils (upper panels) (53), human
umbilical cord blood-derived unrestricted somatic stem cells (USSC) differentiated into neuronal-like cells (54) and human pluripotent stem cells (PSC)
differentiated into lung alveolar cells (bottom panels) (55).
lating known tumor suppressors and in serving as a cru- in RFX7 so far have been identified only in Burkitt lym-
cial regulatory arm of the p53 tumor suppressor. We estab- phoma (7,8,72), the altered expression of direct RFX7 tar-
lish p53 as the first regulator of the novel tumor suppres- get genes across numerous cancer types (Figures 6B and 7)
sor RFX7 and exploit this regulatory connection to chart indicates that RFX7 signaling is recurrently de-regulated in
RFX7’s target gene network in three distinct cell systems. cancer. Notably, recent studies that identified RFX7 as fre-
Most importantly, the RFX7 network comprises multiple quently mutated in Burkitt lymphoma used whole-genome-
established tumor suppressors offering an explanation for sequencing (7,8), while earlier studies using whole-exome-
RFX7’s tumor suppressor role. For example, similar to the sequencing did not detect frequent RFX7 mutations (91).
lymphoma-promoting loss of Rfx7 in a mouse model (12), While speculative at this point, it cannot be ruled out that
mice carrying a knockout of the RFX7 targets PDCD4 and systematic biases of earlier whole-exome-sequencing ap-
REV3L displayed spontaneous lymphomagenesis (64,79). proaches, e.g. because of insufficient enrichment and cov-
Similar to the transcription factor p53, RFX7 appears to erage (92), have led to an underestimation of RFX7 muta-
orchestrate its tumor suppressive function through multiple tions also in other cancers. High expression of RFX7 tar-
target genes. get genes during differentiation (Figure 6C) and RFX7’s
The general importance of RFX7 signaling in cancer apoptosis-promoting function in response to stress (Figure
biology is exemplified by the better prognosis of patients 8) indicate a widespread role of RFX7 in cell fate determi-
with medium to high expression of RFX7 targets across the nation and may at least in part account for the better prog-
pan-cancer cohort (Figure 6B). While frequent mutations nosis observed in cancer patients with higher RFX7 tar-Nucleic Acids Research, 2021, Vol. 49, No. 13 7451
Downloaded from https://academic.oup.com/nar/article/49/13/7437/6312752 by guest on 06 December 2021
Figure 7. RFX7 target gene expression correlates significantly positive with good prognosis in 11 cancer types. Kaplan-Meier plots of patients from TCGA
cohorts. Patients were grouped into low, medium, and high based on the rank expression of 19 direct RFX7 target genes that display a p53 Expression
Score > 5 (23). 11 out of 33 cancer types are displayed that show a significantly (Cox likelihood ratio test variableYou can also read