CFA Institute Research Challenge - Hosted by
←
→
Page content transcription
If your browser does not render page correctly, please read the page content below
CFA Institute Research Challenge

                                                          Hosted by
                                               CFA Society Greece
                                               University of Piraeus

The CFA Institute Research Challenge is a global competition that tests the equity research and valuation,
investment report writing, and presentation skills of university students. The following report was prepared in
compliance with the Official Rules of the CFA Research Challenge, is submitted by a team of university students
as part of this annual educational initiative and should not be considered a professional report.

Disclosures:
Ownership and material conflicts of interest:
The authors, or a member of their household, of this report do not hold a financial interest in the securities of this company.
The authors, or a member of their household, of this report do not know of the existence of any conflicts of interest that might
bias the content or publication of this report.
Receipt of compensation:
Compensation of the authors of this report is not based on investment banking revenue.
Position as an officer or director:
The authors, or a member of their household, do not serve as an officer, director or advisory board member of the subject
company.
Market making:
The authors do not act as a market maker in the subject company’s securities.
Disclaimer:
The information set forth herein has been obtained or derived from sources generally available to the public and believed by
the authors to be reliable, but the author do not make any representation or warranty, express or implied, as to its accuracy
or completeness. The information is not intended to be used as the basis of any investment decisions by any person or entity.
This information does not constitute investment advice, nor is it an offer or a solicitation of an offer to buy or sell any security.
This report should not be considered to be a recommendation by any individual affiliated with CFA Society Greece, CFA
Institute or the CFA Institute Research Challenge with regard to this company’s stock.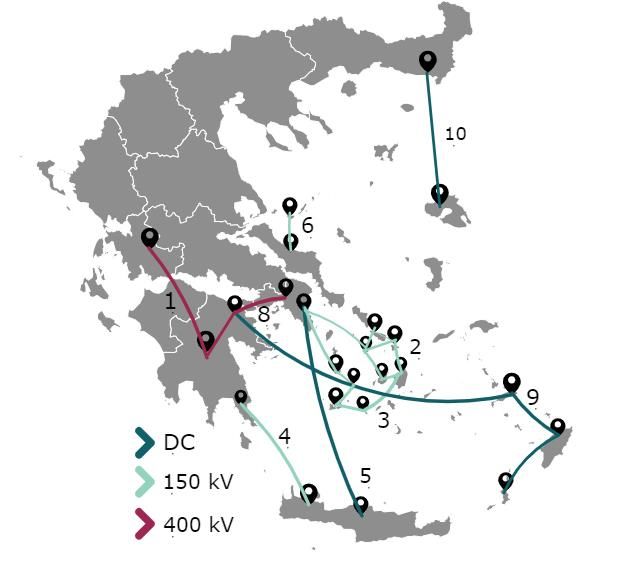
University of Piraeus                                                   ADMIE Holding SA
                                           This report is published for educational purposes only by                Athens Stock Exchange (ASE)
                                           students competing in the CFA Institute Research Challenge.

                                            TICKER: ADMIE: GA                                                                DATE: 1/2/2020
                                            SECTOR: Utilities – TSO                                      Recommendation: BUY (upside 36.26%)
                                            CURRENT PRICE: € 2.48 (as of 24/1/2020)                                       Target Price: € 3.38
Figure 1 : Snapshot
                                                               ADMIE Holding historical and estimated Closing Price
Market Snapshot                                  2,100,000                                                                                     4
Ticker                             ADMIE:GA      1,800,000                                                                                     3.5
Shares Outstanding                   232 MM                                                                                                    3
Market Cap(€ in 000s)                557 MM
                                                 1,500,000
                                                                                                                                               2.5
52 Week Low (€)                          1.46    1,200,000
                                                                                                                                               2
52 Week High(€)                         2.55      900,000
Free Float(%)                          49.00                                                                                                   1.5
                                                  600,000                                                                                      1
Average Daily Volume(52week)        208 MM
Source: Bloomberg, Team Analysis                  300,000                                                                                      0.5
                                                           -                                                                                   0

Figure 2 : Methodologies
                     Price per
Methodologies                   Weighting                                      Volume         SMAVG (10)           Last Price
                     Share
RAB                  €     3.25      40%
DDM                  €     3.42      40%        INVESTMENT CASE
DCF                  €     3.15       10%       ADMIE Holding owns a 51% stake in the Independent Power Transmission Operator (IPTO SA),
Multiples            €     3.97       10%       the Transmission System Operator (TSO) of Hellenic Electricity. Therefore, IPTO’s financials are
                                                directly reflected on ADMIE Holding’s value. We issue a BUY recommendation on ADMIE Holding
Average              €     3.38
                                                SA with a target price of € 3.38/sh., presenting a 36.26% upside potential on the closing price of
Source: Team Analysis
                                                € 2.48/sh. on January 24th. Our valuation is based primarily on 40% RAB Method and 40% on
                                                Dividend Discount Model. It also weighs in 10% Discounted Free Cash Flows to the Firm and 10%
                                                Multiples Valuation using P/E & EV/EBITDA ratios. Our proposition relies on the following key
                                                pillars: 1) High dividends’ yield 2) Resilient profitability driven by asset expansion 3) Low risk
                                                exposure.

Figure 3 : Assets / DPS Grth                    KEY DRIVERS
                                                Fueled by the heavy Investment Plan of 2019-2028, IPTO’s tangible assets are anticipated to
                                                grow 3.1x times in value by 2028.Therefore, due to RAE’s remuneration methodology (more
                                                information on § IPTO’s Revenue), we expect revenues to grow at a steep rate of 9.75% (CAGR
                                                ‘19e – ‘28f, Figure 4). We forecasted that this will translate into an avg. 34.56% Net Profit Margin.
                                                The improvement in profitability will be passed to ADMIEH’s shareholders through increased
                                                DPS within the following decade (10.2% CAGR ‘19e – ‘28f). Consequently, this income effect will
                                                yield an average of c 6.63%, (Figure 4) in the 10-year period, bettering 2019’s 4.11%.
                                                FINANCIALS
                                                The company is expected to use leverage as part of its funding mix to support future CapEx
                                                (avg D/(D+E) 54.74%, Figure 4), being however, strictly below the regulator’s cap of 70%.
                                                Furthermore, we believe IPTO, as a value creator, will be able to service the necessary loans, as
                                                shown by the expected avg 135 bp RoIC-WACC spread. Lastly, the company’s expected liquidity
                                                (avg 1.70 current ratio) further supports leverage in the short term (Appendix 10 – Fin. Ratios).
                                                RISKS
                                                The most significant risks threatening IPTO are its negative FCF’s (Appendix 15 – DCF Model)
                                                during the ’19-‘28 Investment Plan –sided by dividend payouts-, its dependency on RAE
                                                (Appendix 27 – Market Operators) and its low score Governance Assessment by international
   Figure 4 : Key Figures                       outlets (Appendix 36 – IPTO Governance Assessment).
    Key Ratios                           2019e      2020f 2021f 2022f 2023f 2024f 2025f 2026f 2027f 2028f                                 CAGR
    % Grth Assets                        22.6%      25.6% 12.2%    11.8% 3.6% 12.9% 11.8% 9.8%   9.7% 1.5%                                  11.9%
    % Grth Revenues                       5.3%      22.2%   4.1% -11.8% 17.8% 30.9% 10.2% 10.6% 6.0%  7.5%                                  9.8%
    % Grth EPS                            8.0%      42.4% -20.5% -24.7% 37.7% 61.0%  1.4% 10.9% 4.4%  8.1%                                 10.0%
    DPS in €                               0.10       0.15   0.12   0.09  0.12  0.19 0.20   0.22 0.23 0.24                                 10.0%
                                                                                                                                         Average
    Dividend Yield*                       4.1%  5.9%            4.7%     3.5% 4.8%   7.8%  7.9%  8.7%  9.1% 9.8%                            6.6%
    P/E*                                  12.16 8.54            10.75    14.28 10.37 6.44  6.35   5.73 5.49  5.08                            8.52
    EBITDA Margin                        70.9% 74.2%           75.1%    73.6% 73.5% 82.8% 84.4% 85.9% 86.6% 87.5%                          79.4%
    RoE                                   8.6% 11.3%            8.7%     6.4% 8.4% 12.3% 11.8% 12.2% 11.9% 12.1%                           10.4%
    Net Debt/EBITDA                        1.30  3.52            4.65     5.63  4.78 4.04  4.20   4.16 4.34  4.06                            4.07
    D/(D+E)                              43.0% 51.6%           54.7%    56.5% 55.3% 55.9% 57.4% 57.8% 58.4% 56.8%                          54.7%
    *Assumes price remaining stable
    Source: IPTO's Financial Statements, Bloomberg, Team Analysis

                                                                                                                                               1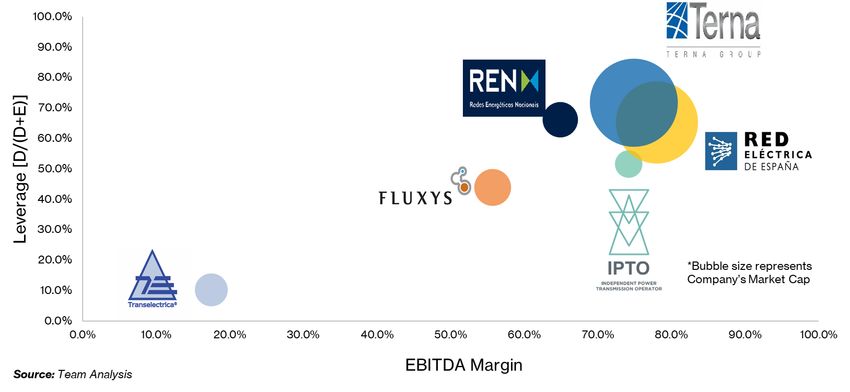
BUSINESS DESCRIPTION
Figure 5 : ADMIEH’s Structure
ADMIE Holding SA (ADMIEH or Company hereafter) was established in 2017 as a Quasi-Public
Company owning a sole asset in its portfolio, its 51% stake on IPTO. The Greek State controls
51% of Company’s stocks, while the rest trade on the Athens Stock Exchange (Figure 5). ADMIE
Holding S.A. acts on behalf of its shareholders’ interests by supervising IPTO and ensuring the
proper execution of IPTO’s responsibilities. IPTO is one of the European Transmission System
Operators of Electricity (ENTSO-E) and as such its responsibilities include, but are not limited
to, the following: Granting access to the System to all relevant parties, managing electricity flows
in the System, providing data to System users and clearing of generation-demand imbalances.
PARTIAL OWNERSHIP AND SUPERVISION
Once a part of Public Power Company (PPC), IPTO is now an independent organization jointly
governed by ADMIE Holding S.A (Figure 6), the strategic investor State Grid Corporation of
China (24%) and the Greek State (25% but indirectly totals 51%). Since ADMIE Holding’s
performance is 100% dependent on IPTO’s activities, our analysis focuses primarily on IPTO’s
Figure 6 : IPTO’s Structure position and potential in its relevant sector. Ultimately, IPTO’s fundamentals and development in
the upcoming years will be reflected on ADMIE Holding’s financial results.
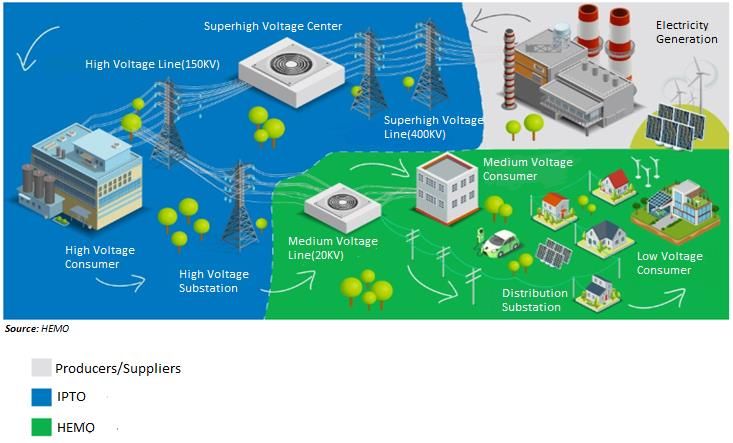
GREEK ELECTRICITY GRID AND OPERATORS
The procedure of electricity transmission to the final consumer provides enlightening
information about IPTO’s position and correlation with the electricity market. First, the power
plants generate electricity via fossil fuels, Renewable Energy Sources (RES) and others.
Through the Daily Energy Planning, IPTO and the Hellenic Electricity Market Operator (HEMO)
are cooperating to balance Supply and Demand in the intraday electricity stream. Afterwards,
IPTO is transforming the current initially to 400kV and, through the High Voltage Centers (HVC),
once again to 150kV, reaching high voltage consumers, high voltage substations as well as
medium voltage centers and consumers. Finally, it is the Distribution Network Operator’s
responsibility (HEDNO) to allocate electricity to low voltage consumers. (Appendix 18 – Market
Operators).
Figure 7 : AR Calculation
IPTO’S REVENUE: A REMUNERATION FOR THE COMPANY’s INVESTMENTS
Allowed Revenue '20 Calculation In € Since IPTO is a semi-public TSO, its revenue generation does not derive from the product of
(+)Operating Expenses(OpEx) 78,461,000 price and quantity sold. Instead, it is a form of compensation for IPTO’s Regulated Asset Base,
(+)Deppreciation(Dep) 76,370,000 Expenses and Investments (further analysis in Financial Analysis and Valuation segments). In the
Regulated Asset Base(RAB) 1,941,335,000 beginning of the 4-year regulatory period (present: ’18-’21) the Regulatory Authority for Energy
WACC 6.50% calculates IPTO’s Allowed Revenue (Figure 7) by estimating each year’s components -which
(+)Return on RAB: R= RAB* Wacc 126,187,000 remain unchanged for the duration of the 4year period-. AR represents a soft cap for IPTO’s
System Rent. The floor of IPTO’s revenues, the Required Revenue - which is distributed to the
(=)Allowed Revenue 281,018,000 consumers proportionally - is calculated on a yearly basis by adjusting AR for previous years’
Source: Team Analysis discrepancies. Adding income from interconnection rights (to producers from neighboring
countries that wish to connect with the Greek System) to RR forms the Transmission System
Figure 8 : RAB ➔ Total Revenues Revenue which, after the inclusion of total sales, constitutes the company’s Total Revenue
(Figure 8). By applying this methodology -used in a similar manner with TSOs around the globe-
IPTO accomplishes both to serve the public interest by not overcharging for its service and to
maintain financial viability and growth prospects for its shareholders.
WACC*RAB
2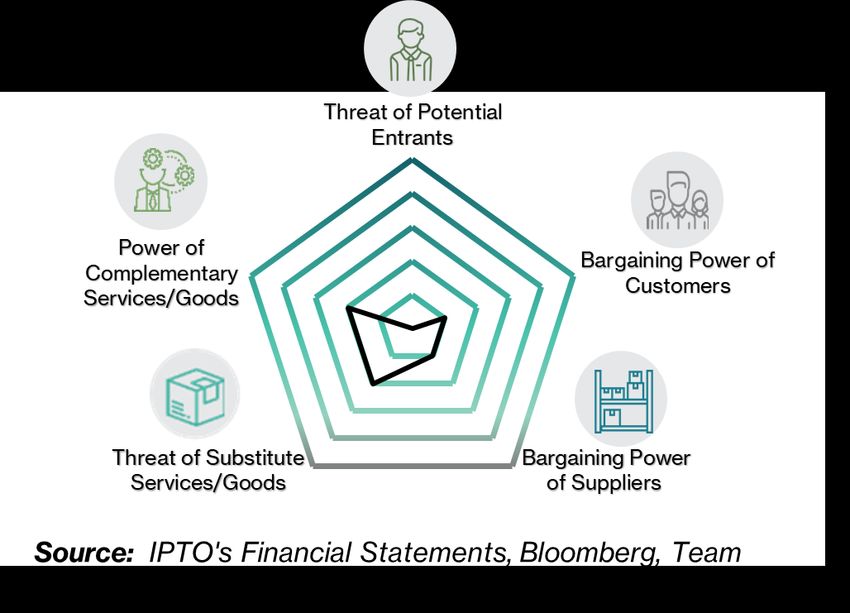
IPTO’S TWO SUSBIDIARIES: ARIADNE INTERCONNECTION & GRID TELECOM
Figure 9 : IPTO’s Two Subsidiaries IPTO established two subsidiaries in the recent years (Figure 9), creating pathways for synergies
                                                      and diversification (Appendix 23 – SWOT Analysis). The first one, Ariadne Interconnection, was
                                                      established in September 2018 and is a Special Purpose Vehicle tasked with the interconnection
                                                      of Crete with Attica. It was created for two main reasons, for allowing third parties to participate
                                                      by directly injecting capital and for compartmentalizing the income stream, as IPTO agreed to
                                                      incorporate this project to its RAB solely after its electrification in exchange for a premium in
                                                      WACC (1.0-2.5%). The second, Grid Telecom, a 100% subsidiary company of IPTO, was
                                                      established in January 2019. Through Grid, IPTO is aiming to provide telecommunication
                                                      services to (inter)national providers, by taking advantage of its extended cable infrastructure as
                                                      well as its prospect reach in remote areas, such as Crete and Dodecanese (A deal with WIND
                                                      Hellas for optical fiber pairs leasing in mainland Greece was recently singed). These services
                                                      can provide IPTO a substantial source of diversifiable revenue (Figure 10), which will be
                                                      unregulated by RAE unlike System Rent, thus making higher profit margins plausible
                                                      (Telecommunication equipment- 5year EPS CAGR:17.2% Source: NYU Stern). However, Grid’s
                                                      opportunities and risks are not currently pertinent to our valuation due its pre-alpha state.
Figure 10 : Grid Telecom
Prospects
Project               Opportunity
Telecommunication    The Regional Security Coordinator (entity tasked with assisting in the task of maintaining operational security
Interface with Balkanacross borders) will be built in Thessaloniki. With the upcoming telecommunication interface of IPTO with the
TSOs                 Balkan TSOs, Grid Telecom is given a unique opportunity to expand its network out of borders.
Telecommunication    With each island's electricity interface Grid may simultaneously provide superfast broadband services to
Interface of mainlandthese regions. Additionally, Grid can use IPTO's High Voltage Pylons for antenna installations used by mobile
Greece with islands  telecommunication companies.
                     The Ultra-Fast Broadband project will be a public-private partnership aiming to expand broadband services
Ultra-Fast Broadband
                     in regions excluded by the Rural Broadband and Superfast Broadband projects. It is yet another market in
project
                     which Grid can exploit IPTO’s expertise and infrastructure to provide telecommunication services.

Figure 11 : Energy Demand in
MWh transferred through NETS                          INDUSTRY OVERVIEW AND COMPETITIVE POSITIONING
                                                      Adding to the necessity of electricity transportation for modern societies, the Greek State aims
                                                      to alter the country’s energy mixture in order to meet EU’s environmental goals for 2030 and
                                                      beyond, making IPTO’s operation and expansion more relevant than ever. Coupled with the rising
                                                      demand for energy to be moved through the System (1.54% YoY in base scenario, Figure 11) and
                                                      the Greek islands’ connection projects, IPTO’s position both in time and in the market is deemed
                                                      crucial.
                                                      EU POLICY & THE GREEK NATIONAL PLAN FOR ENERGY AND CLIMATE (NPEC)
                                                      Since Greece has complied with EU’s policy regarding energy and environmental matters, the
                                                      country’s energy landscape is undergoing a variety of changes, in order to achieve the national
                                                      goals for 2030 that include: greater participation of RES in domestic energy consumption,
                                                      liberalization of energy markets and increased competitiveness, greenhouse gas emissions
                                                      reduction (55% less than 2005, Figure 12) to name a few. These goals are reflected to the
Figure 12 : NPEC Goals                                Hellenic Republic’s recent commitments -through NPEC’s publication- to de-carbonize PPC and
                               Greece's  European
NPEC Goal description
                              commitment  Target      the electricity mixture in general (fully until 2028), the foundation of Energy Exchange, IPTO’s
                                                      system expansion and more. As described the National Plan for Energy and Climate (NPEC),
Greenhouse Gas
emissions reduction(in            55%                 more than 43.8bn euros will be invested in energy infrastructure, most notably 11bn in energy
contrast to 2005)
                                                      efficiency projects, 9 bn in RES and 5.5bn in transmission grid development (Figure 14).
Renewable Energy
Sources participation
                                  35%         32%
                                                      DOMESTIC ELECTRICITY MARKET: CONVERGENCE WITH SEE
in final energy
consumption                                           Greece’s energy sector expects the abolishment of the Mandatory Pool in favor of the Target
Energy efficiency
                                  38%        32.50%   model by mid-2020. Under the Mandatory Pool’s regime, all participants in the electricity market
improvement to 2030
De-carbonization of             Full until            receive (or pay) the System Marginal Price, leaving miniscule margin for competition. However,
electricity production
Obviation of Greek
                                 2028
                                Full until
                                                      this will change with the operation of the Energy Exchange and the introduction of the “Target
Islands Isolation                2029                 Model” (Figure 13). The Energy Exchange, operating under RAE’s supervision, aims at
Source: NPEC 201 9
                                                      restructuring the wholesale electricity market through: The conjunction of the Greek market with
Figure 13 : Target Model                              the rest European Markets, reinforcement of competition, energy security and diversification of
Target Model Goals                                    the energy consumption mixture. The first step towards achieving aforementioned goals is the
Lower prices for consumers                            “Target Model”, which will introduce four new energy markets: 1) Forward market 2) Intraday
Development of competition in wholesale and           Market 3) Day-Ahead Market 4) Balancing Market (Appendices 29&30 – Electricity Grid &
retail                                                Market Framework after Target Model). The first three will be HEMO’s responsibility, while the
Efficient utilization of interconnections             fourth will be IPTO’s. Under these circumstances Greece’s market will be unified with the rest of
Risk heding by market participants                    Europe (with similar efforts from the rest South Eastern European -SEE- countries), coupling
Easier fulfillment of legal obligations
Security of suplly both on physical and
economic terms
Source : RAE, EU Commission
                                                                                                                                                    3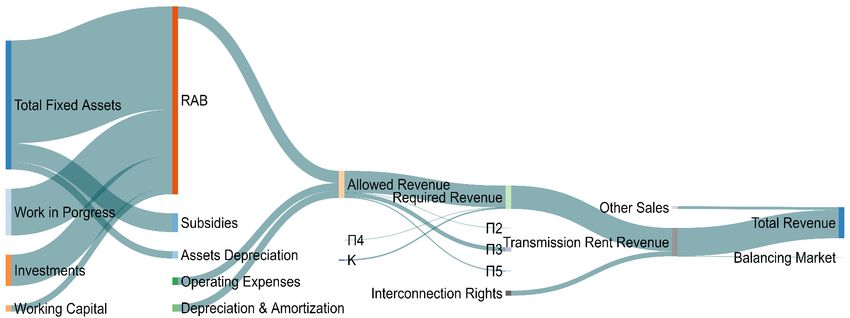
Figure 14 : NPEC Subsidies                          electricity prices across the EU, reducing the price for Greek consumers and increasing energy
NPEC's Subsidies per Project/Sector        in €     security.
RES for electricity production            9 bn      ELECTRICITY’S CALIBER EXPECTED TO RISE IN THE FOLLOWING YEARS
Electricity System Infrastructure         5.5 bn
                                                    The current incumbent administration aims to drastically change the Country’s energy mixture
New thermal units and energy storage      1.3 bn
                                                    and expand the transportation & distribution networks (Appendix 21 – PEST Analysis).These
Electricity Distribution-Digitalization   3.5 bn
Natural Gas Transmission                  2.2 bn    changes are driven by electricity’s growing importance in the following years, as the
Natural Gas Distribution                  2 bn      electrification of heating, cooling and transportation (electric cars amount around 24-30% in
Research and Development                  0.8 bn    NPEC’s scenarios) will offset the inevitable reduction of fossil fuels usage. Additionally, the
Energy Efficiency                         11 bn     Renewable Energy Sources are all “translated” in electricity production and the need for RES’s
Refineries                                1.5 bn    increased participation in the Energy Mixture (Figure 15) will have substantial impact in IPTO’s
Climate Change-Forests and Floods         2 bn      development, as further grid expansion is deemed necessary. IPTO is constantly researching
Cyclical Economy                          5 bn      Greece’s power needs and incorporates projects to cover them in its Investment Plan, which
Total                                     43.8 bn
                                                    evolves on a yearly basis. Combining new technologies with its expertise and entering new
Source: NPEC 2019
                                                    markets (Appendix 23 – SWOT Analysis) is a key factor that will drive IPTO’s growth even after
Figure 15 : Greece’s Electricity                    Greece has been fully interconnected.
Generation Mix                                      COMPETITIVE POSITIONING
                                                    The main operating activity of IPTO is shielded from competition (Appendix 22 – Porter’s 5
                                                    Forces Analysis), but also restricted from high profit margins in favor of the public interest. Due
                                                    to its unique position, service and remuneration methodology, IPTO has low correlation with the
                                                    energy market and the economy in general. Additionally, energy demand affects its revenues
                                                    only indirectly, through the need for upgrades in grid capacity (take into account in IPTO’s
                                                    Investment Plan). However, as both markets encounter a supposedly reforming decade, IPTO’s
                                                    strategic positioning coupled with rapid growth (metric needed) will boost the company’s
                                                    financial performance even higher (Appendix 11 – DuPont Analysis). More specifically, excess
                                                    returns will derive primarily through risen demand in 3 key areas: interconnection rights, network
                                                    participation requests and infrastructure to conform with higher needs for alternative energy
                                                    sources.
Figure 16 : Capex & Subsidies Mix
                                                    INVESTMENT SUMMARY

                                                    By our analysis an implied fair value of € 3.38/sh., was extracted, representing a 36.26% upside
                                                    from ADMIEH’s closing price of € 2.48/sh. on January 24th. Each methodology (40% RAB, 40%
                                                    DDM, 10% DCF & 10% Multiples) encapsulated, through the Net Adjusted Value, the expected
                                                    growth of ADMIE Holding’s affiliation. This proposition can be appropriately reflected on the
                                                    following analysis of IPTO’s growth drivers and key financials.
                                                    ADMIEH’s SINGLE ASSET: A VALUE COMPANY WITH GROWTH PROSPECT
                                                    The new decade can be summarized by IPTO fulfilling a long-standing project: connecting the
                                                    vast majority of Greek islands with Greek mainland’s electricity transmission system. This task
                                                    is expected to be actualized through a heavy Investment Plan (c € 5.1 bn/10y), providing ADMIE
Figure 17 : Capitalization of                       Holding and its shareholders the opportunity to capitalize on the investment-rewarding income
Revenue Growth                                      approach of IPTO (revenues +9.75% CAGR ’19 – ’28, Figure 17), while preserving its social
                                                    objective. In contrast to the risks that companies face during large Capex periods, IPTO’s
                                                    monopoly and regulatory frame compose a goodwill that translates into robust capital gains (c
                                                    10% DPS CAGR ‘19e - ‘28e) for the foreseeable future. The aforementioned combination of asset
                                                    expansion and low risk exposure along, with the expected dividends of this period, constitute
                                                    the three main catalysts that support our proposition’s premium and are better detailed below.
                                                    ISLANDS’ INTERCONNECTION & SYSTEM UPGRADE ERUPT ASSETS VALUE
                                                    Greece’s geomorphology impeded most islands’ interconnection to the mainland’s energy
                                                    transmission system, driving up energy generation cost, as these islands relied on oil to produce
                                                    electricity (Wholesale Electricity Price GR: 65.5€/MWh vs EU: 43.3€/MWh in 2019). The cost
                                                    spread between the islands and the mainland was and still is distributed uniformly through Public
                                                    Service Obligations (PSOs can reach c € 800 m), driving up each household’s electricity bill. At
                                                    the end of this decade the system will be covering land’s larger part and there will be no further
                                                    use for this price calibration. IPTO can and is expected to be rewarded for eliminating past
Figure 18 : Porter’s Analysis                       charges without putting any extra burden to the citizens, whose electricity bill, if anything, will
                                                    change downwards. Tangible assets are expected to reach 3.1x-current by 2028 (11.96% CAGR)
                                                    driving up profitability (avg NPM 34.56% ‘19e – ‘28f) on account of the process detailed in the 4th
                                                    § of Business Description.
                                                    REGULATORY FRAMEWORK AND MANAGEMENT MITIGATE RISKS
                                                    IPTO’s independence from market forces, coupled with management’s decisions on operating
                                                    costs and cash management, can entice risk averse investors. ADMIEH’s solidity has already
                                                    been established by the regulatory framework, which sets protective barriers around IPTO
                                                    (Appendix 22 – Porter’s 5 Forces Analysis), secures revenue streams (Figure 37) and sets a

                                                                                                                                                 4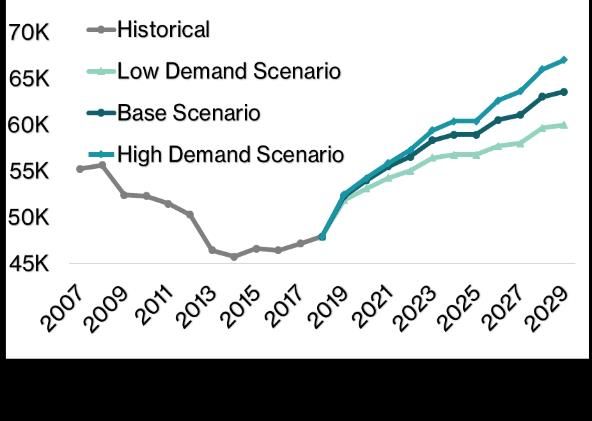
Figure 19 : Dividends Realized vs Paid
                                         prudent leverage policy (more on § Capital Structure). At the same time, management took
                                         action towards lowering costs while also increasing liquidity. The Voluntary Exit Scheme (VES)
                                         provides IPTO with solidity and room for improving efficiency (more on § Operating Expenses).
                                         Additionally, through IPTO’s active cash management, even its most liquid asset yields above-
                                         average returns. IPTO’s liquidity is further enhanced by the de facto stability of working capital,
                                         excluding cash, as its receivables are directly related with its payables, often totaling at zero.
                                         The latter changed after IPTO’s independence, a trend that can be observed in its Beneish M-
                                         Score (Appendix 26). Hence, IPTO’s definite low risk exposure (Appendix 24 – Risk Matrix)
                                         safeguards against the vulnerability its Investment Plan implies, shielding its expected growth.
                                         SHAREHOLDERS’ RIGHT TO THE LION’S SHARE OF CUMMULATIVE RETURNS
                                         IPTO offers the stability and credibility of a partially State-owned Large Cap with a stable
                                         dividend policy (at least 50%, bound by law over 35%), which remunerates shareholders by
                                         seizing upon its amassed profits (EPS CAGR c 10% ‘19e – ‘28f). A reasonable accounting lag
Figure 20 : Revenues Appreciation
                                         exists as the Company collects IPTO’s dividend during the fiscal year that follows the earnings’
                                         period, and Holding’s shareholders follow suit. In order to offset this delay of transferring
                                         dividends through 2 companies, the Company offers the maximum allowed interim dividend
                                         (Figure 19). This maximum permissible amount changed after January 1 st, 2019 from 50% of
                                         temporary results to 50% of previous fiscal years’ net realized gains. This loosened regulatory
                                         frame amplifies management’s agility to distribute gains earlier than before.

                                         FINANCIAL ANALYSIS

                                         REVENUE GROWTH REFLECTS RAPID INVESTMENT RETURNS’ INTEGRATION
                                         Required revenues’ collection from consumers allows IPTO’s investments to yield returns faster
                                         than an average tangible asset does (Figure 20) This leads to a rather comprehensible rising
                                         trend in revenues with 2022f being the only exception as the new regulatory period is expected
                                         to be based on a lower WACC base. IPTO is able to capitalize on its confident operating margins
Figure 21 : RoIC vs WACC Spread          (avg 49.33% ‘19e – ‘28f Appendix 10 – Financial Ratios) and favorable interest and tax conditions
                                         and reach a paramount retained earnings CAGR of 12.86% in the next decade.
                                         PROFITABILITY ANALYSIS: STRONG MARGINS OFFSET NEGATIVE CASH FLOWS
                                         IPTO faces a heavy CapEx period ahead that results in negative Free Cash Flows throughout
                                         the next decade (avg ’19e - ‘28f FCFF: € -197,084.08 m, min € -389,830.94 m, Appendix 15 –
                                         DCF Model) posing company’s sustainability in question. Supported by the regulated revenues
                                         and stable operating costs (-1.65% CAGR ‘19e – ‘28f), IPTO’s EBITDA Margin soaring from
                                         70.92% to 87.50% (confidently over peer’s median 64.89% & avg 58.19%, Appendix 16 –
                                         Multiples Approach), counterbalances the previous conclusion. While short-term leverage trend
                                         (D/E forecasted increase: ‘19e 0.75 to ‘28f 1.31, Appendix 10 – Financial Ratios) contemplates
                                         the need for cash, IPTO’s Net Income Margin avg 34.56% and the avg 1.34% spread between
                                         RoIC and WACC (Figure 21), further substantiate the estimated reverse in FCFFs’ trend and in
                                         IPTO’s cash and value generation.
                                         OPERATING EXPENSES: SALARIES & VOLUNTARY EXIT SCHEME
Figure 22 : OpEx & Salaries’ Trend IPTO’s employees were proposed recently a voluntary exit in an effort to reduce operating costs
                                         while also driving down the average age of employees (junior hiring programs also took place).
                                         IPTO’s personnel costs make up for the majority of IPTO’s operating expenses (Figure 22) and
                                         the latest the programs have been signed for is the end of 2019. This usually depicts a slight
                                         spark in costs in the beginning of a decade, followed by a normalization of the trend afterwards.
                                         However, IPTO incorporated the expected lump sum cost of the exit program in the financial
                                         statements of 2018. Therefore, we anticipate the net effect in operating costs of the two
                                         programs to be a y-o-y decrease of 16.12% between 2018 and 2019 and a CAGR of -1.65% for
                                         the 19-28 period. The sharp increase of 2023 can be explained by the large contracting costs
                                         that accompany this period’s hefty investments.
                                         WORKING CAPITAL: AS STABLE AS IPTO’s COMPLIMENTARY SERVICE NATURE
                                         IPTO offers a market balancing service of allocating several kinds of funds among energy
Figure 23 : Leverage                     market’s participants (e.g.: PSOs, environmental penalties, etc.). These amounts are directly
                                         affected by the aggregate demand and supply and therefore were forecasted using energy’s
                                         demand expected growth (from ‘18a € 933,470,000 to ‘28f € 1,083,330,000, Appendix 3 –
                                         IPTO’s Income Statement). While IPTO neither benefits nor loses any money, this service directly
                                         affects company’s receivables and payables. As the competition rises and the energy market is
                                         further segregated this, already negligible, exposure to participants’ credibility appears to be
                                         further minimized (avg Working Capital change ‘19e – ‘28f: € 10,964,500, 2.3% of avg Cash
                                         Equivalents, Appendix 7 – IPTO’s Cash Flow Statement). HEnEx (see “Domestic Electricity
                                         Market”) will contribute in that direction as well as it will provide liquidity and allow producers to
                                         be better prepared using future contracts and other hedging mechanisms.

                                                                                                                                         5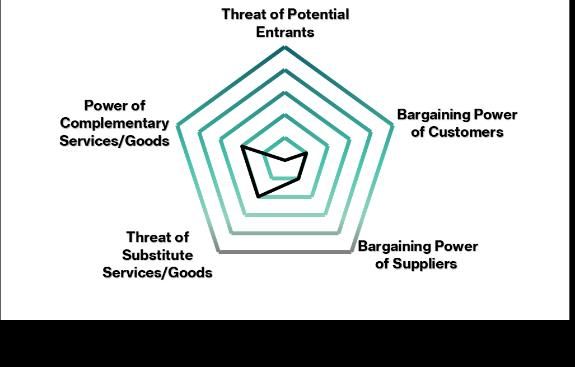
Figure 24 : WACC 2020                CASH GENERATION
                                      IPTO currently possesses a sustainable cash amount that also includes € 200 m, Ariadne’s initial
 WACC Calc        2020f               capital. Taking into consideration working capital’s (excluding cash) inertia as receivables are
 Risk Free           -0.25%           correlated to the payables, IPTO is expected to use part of its liquidity pillar to finance partly its
 MRP                  5.72%           CapEx, keeping although a rather steady treasury (avg 1.00 & 1.70 cash and quick ratio
                                      respectively during ’19e-‘28f). In addition to IPTO’s confident liquidity ratios, its cash is actively
 beta Asset           0.3119          managed by the Bank of Greece offering a lucrative 3.15% rate.
 D/E               106.66%            CAPITAL STRUCTURE: CURRENTLY AND FORESEEABLY UNDERLEVERAGED
 beta Equity         0.5648           RAE’s regulation includes a 0.7x-cap to IPTO’s leverage (i.e.: D/(D+E)). While any constraint
 CRP                  4.07%           potentially affects management decisions, our analysis shows how this prudent measure is not
                                      anticipated to affect IPTO’s capital structure any time soon. This is supported by 3 axes, resilient
 CAPM                 7.05%           retained earnings (12.86% CAGR ‘19e - ‘28f), revenues that counterbalance CapEx by default
 Cost of Debt          3.18%          and adequate liquidity. Consequently, the expected ratio’s maximum of 58.39% (avg 54.52%
 Tax Rate           24.00%            throughout the next decade) falls well below not only the threshold of 70% (Figure 23), but also
                                      that of IPTO’s peers (avg 65.68% ‘10a - ‘19e, source: Bloomberg).
 D/(D+E)              51.61%
 WACC                 4.66%           VALUATION
  Source: Team Analysis               WACC: A DISCOUNTING AND A REMUNARATING FACTOR AT THE SAME TIME
                                      Two of the most important numbers in every valuation, usually uncorrelated, interact in IPTO’s
                                      case as an estimation for WACC is used to remunerate the TSO through its Revenues in the
                                      beginning of each regulatory period. Using a higher CRP can lead, for example, to a higher DCF’s
                                      price as the revenues’ force offsets WACC’s discounting force. Revenues’ WACC differs from
                                      market’s typical discounting WACC in three key areas. Firstly, this WACC’s beta equity
                                      disregards each country’s tax rate. Secondly, it is expressed in real terms, as inflation shouldn’t
                                      burden customers. Lastly and most noteworthy, IPTO will be compensated with a premium
Figure 25 : Rf vs CRP vs MRP          between 1% and 2.5% for 12 years after the project’s electrification due to accomplishing to
                                      carry through a Project of Major Importance, as Crete – Attica’s interconnection is characterized.
                                      At the time, the premium hasn’t been decided and this task falls within RAE’s jurisdiction. We
                                      speculated that 1.75%, the middle ground, is a fair assumption to make at this point.
                                      RISK FREE RATE: HOMO ECONOMICUS AWAIT ESCAPE FROM NEGATIVE RATES
                                      If one uses current government bonds for long-term risk-free rate, one assumes a flat curve
                                      below zero and probably one is getting ready for the largest leveraged-asset bubble in economic
                                      history. In contrast to that view, we assumed that fiscal policy will eventually pick up and result
                                      in a mean reversion close to the post-’09-crisis average. Therefore, the risk free in our model
                                      starts from the current YTM of Germany’s 10Y bond, EU’s lowest, and gradually reaches 1.075%,
                                      last decade’s average (Figure 25). In addition, the country’s idiosyncratic risk is not circumvented
                                      as it is reflected in the CRP.
                                      COUNTRY RISK PREMIUM: BONDS’ YIELDS DO NOT STRICTLY REPRESENT RISK
                                      As thoroughly explained above, one should not assume that 1.4%, current Greek 10Y YTM,
                                      properly reflects Greece’s creditworthiness, especially while Greece remains more than 2 levels
                                      below investment grade area. In our analysis an adjusted for volatility default spread of 3.34%
                                      to 1.48% (Figure 27) was used based on Prof. A. Damodaran’s analysis. This spread quantifies
Figure 26 : Rm Components             Greece’s credit rating, which was assumed that Moody’s will upgrade once in 2020, as it
Market Return Estimates               currently lacks one grade behind S&P and Fitch. Additional upgrades are expected, namely once
ASE Average RoE              7.09%    in 2021 as the Greek government aims to make significant principal repayments, using primary
                                      budget surpluses and favorable market borrowing conditions and once again every 2 years.
ASE Avg Div Payout Ratio    51.07%
Sustainable Growth          48.93%    MARKET RISK PREMIUM: CONSECUTIVE REGIME CHANGES IN THIS CENTURY
                                      The Greek Stock Market experienced extensive turbulent periods, thus the past returns seem
Expected Dividend Growth     3.47%
                                      statistically insignificant for projecting future returns. On the contrary, the forward-looking
Expected '20 Dividend Yield    2%     Gordon’s dividend growth approach, which adds expected dividend yield to the expected
Expected Market Return       5.47%    dividend growth rate counts less on the past and thus seems more appropriate. Subtracting from
Source: Bloomberg                     the sum of the expected dividend yield and the sustainable growth of ASE Index’s components
                                      (i.e.: ROE*Retention Ratio), the risk free rate, a relatively stable expected Greek Market Risk
Figure 27 : MRP & CRP                 Premium of 5.38% on average (Figure 26, 27), is believed to fairly reflect future market risk.
 MRP Estimates                2020f 2021f 2022f 2023f 2024f 2025f 2026f 2027f                           2028f
 Risk Free Rate               -0.25% -0.08% 0.08% 0.25% 0.41% 0.58% 0.74% 0.91%                         1.08%
 Market Return                 5.47% 5.47% 5.47% 5.47% 5.47% 5.47% 5.47% 5.47%                          5.47%
 MRP                          5.72% 5.55% 5.39% 5.22% 5.06% 4.89% 4.73% 4.56%                           4.39%

 CRP Estimates                2020f 2021f 2022f 2023f 2024f 2025f 2026f 2027f 2028f
 Tax rate                      20%   20%   20%   20%   20%   20%   20%   20%   20%
 Greece's Credit Rating        Ba3   Ba2   Ba1   Baa3  Baa3 Baa2  Baa2   Baa1  Baa1
 Default spread               3.34% 2.79% 2.32% 2.04% 2.04% 1.77% 1.77% 1.48% 1.48%
 Relative Equity Volatility    1.22  1.22  1.22  1.22  1.22  1.22  1.22   1.22  1.22
 CRP Greece                   4.07% 3.40% 2.83% 2.49% 2.49% 2.15% 2.15% 1.81% 1.81%
 Source: NYU Stern                                                                                                                    6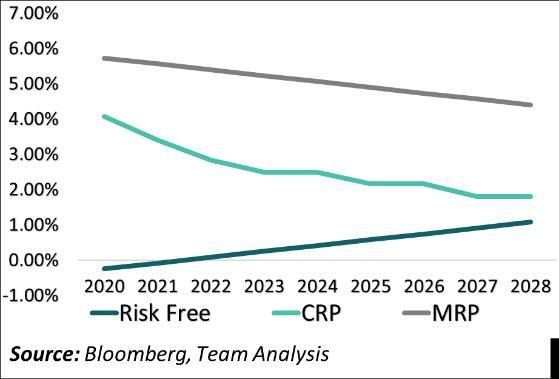
BETA (EQUITY)
Figure 28 : GR Bond 10Y                                    Since IPTO is not a public company, constructing its beta is slightly more complicated. Firstly,
                                                           the adjusted beta, which is more longstanding, can be obtained by plotting a regression of each
                                                           one of IPTO’s most comparable peers and its according benchmark index. Then the implied
                                                           unlevered beta of IPTO is derived using the historical trend of each peer’s D/E ratio and the
                                                           corporate tax rate of the respective country. Lastly, the beta equity is constructed by combining
                                                           the estimated leverage, the unlevered beta and the Greek corporate tax rate. Both the derived
                                                           betas are considered indicative, being aligned with industry’s averages. These 4 detailed
                                                           variables were then applied to the CAPM formula to calculate IPTO’s CoE.
                                                           COST OF DEBT: CREDIT LINE ACCOMMODATES HEAVY CAPEX FINANCING
                                                           IPTO historically held a very competitive positioning in terms of third parties financing. Currently,
                                                           apart from being a partial-SOE, IPTO maintains ties with China, a country with heavy outflows
                                                           on global FDIs (4th largest net outflows in 2018 source: World Bank). Taking past ways and costs
                                                           of borrowing into consideration, we concluded that IPTO should and can repay its most
                                                           expensive old loans -the Company stated similar intentions- and then enter in a credit line
                                                           agreement with either the Greek systemic banks or the Chinese ones or a synergy of these. This
                                                           way of funding gives IPTO the flexibility to draw only the amount that cannot produce organically.
Figure 29 : Loan Servicing                                 An adequate interest rate can be a spread over the country’s borrowing cost. According to Prof.
                                                           A. Damodaran, a corporation with an Interest Coverage Ratio similar to IPTO’s should add 1%
                                                           spread to the 10Y government bond’s YTM, resulting in a 2.4% rate for new loans. Weighting
                                                           each loan with its respective rate, IPTO’s CoD appears to follow a downward trend from 3.27%
                                                           to 2.32% (2019 to 2028).
                                                           NAV METHOD CONVERTS IPTO’S FAIR VALUE TO ADMIEH’S STOCK PRICE
                                                           The common ground among the 4 different valuation methods for IPTO is the Net Adjusted Value
                                                           that allowed ADMIE Holding’s price to be derived. As ADMIE Holding claims 51% of IPTO’s Net
                                                           Income it is reasonable for one to deduce that 51% of IPTO’s fair Equity Value represents ADMIE
                                                           Holding’s fair Enterprise Value and therefore Market Value as there is no Debt.
                                                           RAB METHOD: APPROPRIATE, COHERENT, ACCURATE BUT SOMEWHAT MYOPIC
                                                           IPTO’s Regulated Asset Base is a significant component of its Allowed Revenue methodology
                                                           and constitutes s a TSO’s most important value metric. It represents the fair value of the
                                                           company’s Net Fixed Assets, upon which the return(R) is calculated (Appendix 28 – Fixed Assets
Figure 30 : Regulated Asset Base                           Analysis). For each regulation period, the RAB is estimated as described in figure#. Certain
IPTO's RAB Calculation                2020e in '000s €     Projects of Major Importance, such as ARIADNE Interconnection aren’t included within the
(+)Net Tangible Fixed Assetst-1             1,355,481.00   Regulated Asset Base until the Investment is finalized, and as a result they do not yield return
(+)WIPt-1                                     663,074.13   while they are treated as Work in Progress (WIP). The RAB Method is a variation of Net Adjusted
(+)Investmentst-1                            605,600.00
                                                           Value valuation method, excluding IPTO’s trade receivables and payables since they are untied
(=)A: Fixed Assetst(Pre-depreciation)       2,624,155.13
B: Deppreciationt                             64,584.98    to its revenue generating activities -they include Public Service Obligation accounts-. We used
C: Working Capitalt                            73,262.11   2020’s expectations in order to arrive at a forward looking EV, weighting the method’s valuation
D: Subsidiest                                 195,838.51   stability favorably, while considering its static nature -which lacks IPTO’s future discounted
(=)A-B+C-D: Asset Valuet                  2,468,993.40     value, a value that matters when a corporation pupates.
RABt=(AVt+RABt-1)/2                      2,202,459.43
Source: RAE, Team Analysis            DIVIDEND DISCOUNT MODEL (DDM): STABLE DIVIDEND POLICY AND PROFITS
                                      IPTO’s stability results in steady capital flows and sustainable growth as expected RoE is
                                      sufficient to compensate for CoE (avg RoE – CoE spread 3.8% ‘19e-28f, Appendices 10,15),
                                      making IPTO a value creator in the mid to long-term. We applied a multi-period DDM for the
                                      decade ahead and the Terminal Value using Gordon’s formula to estimate IPTO’s perpetual
Figure 31 : Multiples                 value. Terminal growth rate was estimated using European Utilities Companies’ Sustainable
                                      Growth Ratio of 1.28% (RoE 10.75%, Retention Ratio 11.95% source: NYU Stern). IPTO’s CoE
                        EV/
Company          P/E          Price was calculated via CAPM (Appendix 15). This method was weighted 40% as we believe it both
                       EBITDA
                                      reflects the future value of IPTO, and it is based on steady flows, the ones that matter for the
Transelectrica  12.36x  3.05x € 22.50
                                      shareholder the most, that are calculated via a rather predictable Net Income.
Redes Energeticas
                             15.79x    9.46x    € 2.81
Nacionais SA                                               MULTIPLES APPROACH: LARGE DISCOUNT IN EV/EBITDA & P/E RATIOS
IPTO SA                      17.09x     7.39x   € 2.48     TSOs across Europe in general predate IPTO and are usually better established. Accounting for
Fluxys Belgium NV            35.92x    12.86x   € 28.50    Greek economy’s remaining problems and ASE’s small average volume of transactions, IPTO’s
Red Electrica SA              15.11x    9.14x   € 18.33
                                                           large discount based on multiples valuation can be translated. At the same time part of IPTO’s
Terna S.p.A.                 15.37x    11.47x    € 5.81
                                                           opportunities could have been overlooked and consequently we added a light-weighted price
Source: Team Analysis                                      derived by the upside EV/EBITDA & P/E ratios of IPTO’s most comparable peers imply.

                                                                                                                                                          7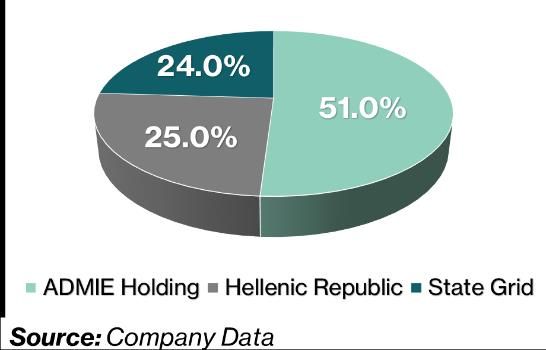
Figure 32 : Capex & FCF Term        DISCOUNTED CASH FLOW (DCF): HYPERSENSITIVE TO THE CAPEX PLAN
Structure                           The picture that IPTO’s Free Cash Flows to the Firm (FCFFs) shape is rather straightforward.
                                    The next decade’s development plan dictates almost every flow to be below zero, while almost
                                    the whole value stems from perpetuity. The terminal value was calculated using two methods,
                                    the one described above and the exit multiples method using the median EV/EBITDA ratio of
                                    IPTO’s peers. The price of this model, while it offers useful information, is highly sensitive to the
                                    last FCFF, which is subject to change and due to this Achilles’ heel, its weight is 10%, the lowest
                                    of the rest. The WACC that was used is detailed below and compared to IPTO’s RoIC it further
                                    corroborates the corporation’s value creator characterization.

                                    INVESTMENT RISKS

                                    VALUATION RISKS
                                    SENSITIVITY ANALYSIS ON DCF’s & DDM’s MAIN VARIABLES: WACC, CoE & g
                                    With a 40% weighting, the RAB method plays an essential role in the determination of the final
                                    target price of ADMIEH. However due to the methodology’s stativity, it would be idle to test the
                                    model’s assumptions. Therefore, we decided to perform analyses on the most sensitive
                                    components of the proposed price.
Figure 33 : DCF Sensitivity                                       Figure 34 : DDM Sensitivity
      WACC
g            3.76% 4.06% 4.36% 4.66% 4.96% 5.26% 5.56% g CAPM 5.55% 6.05% 6.55% 7.05% 7.55% 8.05% 8.55%
    0.89%      2.68   2.67 2.66  2.65  2.64  2.63  2.62 0.68%   4.27  3.83  3.46   3.16 2.90  2.67  2.48
    1.02%      2.84  2.83   2.81 2.80  2.79  2.78   2.77 0.88%  4.43  3.95  3.56  3.24  2.96   2.73 2.52
     1.15%      3.01 2.99  2.98  2.97  2.96  2.95  2.93 1.08%   4.60  4.09  3.67  3.33  3.04  2.79  2.58
    1.28%       3.19  3.18  3.16  3.15  3.14  3.13   3.11 1.28% 4.80  4.24  3.79  3.42   3.11 2.85  2.63
     1.41%     3.39  3.38  3.37  3.35  3.34  3.33  3.32 1.48%    5.01 4.40  3.92   3.52 3.20  2.92  2.69
    1.54%      3.62   3.61 3.59  3.58   3.57 3.55  3.54 1.68%    5.25 4.58  4.06  3.63  3.29  2.99   2.75
    1.67%      3.87  3.86  3.85  3.83  3.82  3.80  3.79 1.88%    5.52 4.78   4.21  3.76 3.38  3.07   2.81
Source: Team Analysis                                             Source: Team Analysis
                                    RISKS TO THE TARGET PRICE
Figure 35 : Scenario Analysis       Aiming to test both DFCFF and DDM methodologies’ key variables, we conducted a sensitivity
                                    analysis on WACC, Terminal Growth and Cost of Equity. The outcome was an 85.71% and
                                    87.76% chance respectively of sustaining our initial BUY recommendation. This optimistic yet
                                    potentially deceiving result made us want to stress the models in a less myopic fashion.
                                    MONTE CARLO SIMULATION
                                    Understanding the two methodologies’ sensitivity to our assumptions, we performed a Monte
                                    Carlo simulation (Appendix 18 – Monte Carlo Simulation) to stress out the most crucial ones. We
                                    captured DCF’s and DDM’s effects in a hypothetical price with respective weightings 20% and
                                    80%, a proxy for their actual 10%, 40% weightings in the final price. First, we used Cost of Equity
                                    and Terminal Growth to incorporate the models’ complexity on a standalone basis. However,
                                    with respect to the regulator’s methodology, we included Ariadne WACC premium and the
                                    CAPEX outflow to test IPTO’s revenue stream. The proxy price surpassed a 10% upside
                                    potential in 87.35% of the simulations, resulting in a BUY recommendation and 1.05% of the
                                    iterations resulted in a SELL status. After the exercise, we deducted that the Investment Plan’s
                                    CAPEX distribution is the most sensitive variable due to the expense’s pivotal role in the
                                    determination of both the FCFs and the TV. This makes IPTO’s profitability more important, since
                                    the increasing forecasted trend provides IPTO with a hedge against the need for leveraging. To
                                    secure robustness in our analyses, we used three scenarios of scaling adversity for the same
Figure 36 : Approved WACC vs
                                    variables in the final target price (Figure 35). According to the results an average 50%
Submitted                           unfavorable change from our base scenario must take place, should the recommendation
                                    change to a SELL. A rather improbable scenario due to the variables’ low correlation.
                                    INVESTMENT RISKS: DIRECT RISKS AND THOSE THAT STEM FROM IPTO
                                    ADMIE HOLDING RISK #1 | INCREASE OF IPTO’S SHARE CAPITAL - EQUITY RISK
                                    Possible Increase of IPTO’s Share Capital will force the Company to participate with at least 51%
                                    of the increase in order to hold majority rights. Either funded through loan or retained earnings,
                                    the impact on dividends would be present sooner or later. Additionally, in case ADMIE Holding
                                    decided not to participate, equity dilution would be imminent. Nevertheless, an Increase in Share
                                    Capital is not currently required or planned by IPTO.
                                    ADMIE HOLDING RISK #2 | REVENUE STABILITY - BUSINESS RISK
                                    The only significant cash inflow of ADMIE Holding is the dividends from IPTO. In fact, ADMIE
                                    Holding’s purpose is simply to facilitate the Greek’s state control over IPTO with less than 51%
                                    ownership. Since it isn’t a typical holding company-managing a large portfolio of companies-,

                                                                                                                                   8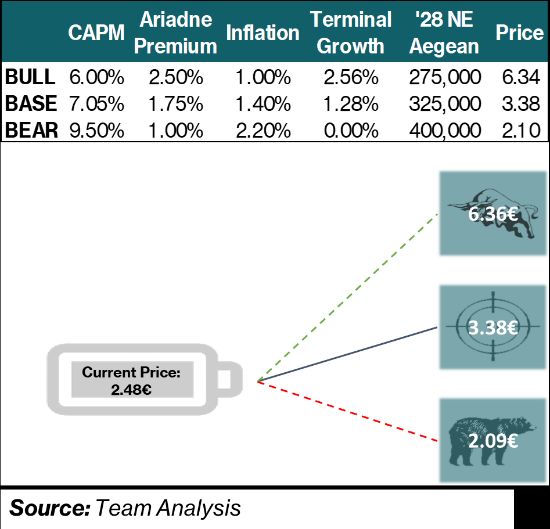
Figure 37 : Risks &                      ADMIE Holding is dependent on IPTO’s performance and RAE’s decisions. As such, possible
Mitigation Factors                       restrictions or incapability of collecting the dividend from IPTO will have a great impact on its
      RISKS
                      MITIGATING         ability to cover its expenses and on the dividend payouts to the shareholders. The probability
                       FACTORS
                                         and impact of this negative sums up the risks mentioned below stemming from the business unit
          ADMIE Holding
                     The company
                                         of IPTO.
                     does not plan
                     an ISC for the
                                         IPTO RISK #1 | HEAVY REGULATION FROM RAE - REGULATORY RISK
                       near future       IPTO’s operation is subject to a rigorous and complex legislative and regulatory framework,
                           The           governed by RAE’s decisions and in need of its approval. As such, IPTO’s profitability can greatly
Increase of IPTO's     Investment
  Share Capital        Plan can be       vary depending on the parameters of AR and RR calculation set by RAE’s leadership. Historically
                       adequately        IPTO’s results diverge significantly from RAE’s forecasted and approved ones (Figure 36),
                         funded
                      through own
                                         rebounding to a shroud of uncertainty around IPTO’s self-management capabilities and the
                       capital and       validity of any financial analysis. Another problem deriving from the regulatory framework is its
                          loans          inflexibility to respond to unpredictable situations, as in need for major decision a legislative act
   Cash Flow         IPTO is bound
Stability and lack      by law to        approved by RAE would be necessary. As stated in the company’s statements, IPTO faces
of diversification    distribute at      difficulties in recruiting or retaining experienced executives, with potential adverse effects on its
       IPTO                              ability to develop and implement its strategy.
                         Proper
Heavy Regulation
   from RAE
                        financial        IPTO RISK #2 | DELAY IN THE 10YEAR DEVELOPMENT PLAN - STRATEGIC RISK
                        planning
                          IPTO's
                                         Since one of IPTO’s revenue drivers is its Investment Plan, one of the most impactful risks is that
                     projects are in     of a possible delay of its execution (Appendix 23 - SWOT Analysis). Examples include delays in
                            fact         competitive auctions and contracts’ conclusion, lack of proper legislation, construction
     10Year           accelerating
 Investment Plan         Energy          companies not delivering on due date, local citizens’ protests etc. It must be noted that in case
      Delay          investments in      of a serious delay, RAE is eligible to impose immediate project execution. Alternatively, it could
                       Greece are
                       picking up
                                         direct an increase of IPTO’s share capital accepting third party financing or relocating
                          steam          jurisdiction through a public auction. In any case, there is a potential loss of value due to the
                       Assets are        investment horizon’s lengthening.
                       distributed
                         across          IPTO RISK #3 | UNINSURED ASSETS - OPERATIONAL RISK
                        Greece's
                        territory
                                         IPTO’s Assets are currently not insured, and even though in the following years IPTO’s RAB will
                                         triple in size, there are no evidence to this attitude changing. IPTO states as reasoning the fact
                        In need of
Uninsured Assets
                      repairs IPTO       that these assets are scattered across Greece and thus the potential damage to one area is
                          will be        minimal. Even though the former fact might hold some truth, it does not negate the adverse
                     reimbursed for
                     the cost due to
                                         effect of a natural disaster on RAB’s Value and consequently on IPTO’s financials, as costly
                       its revenue       repairs would be needed, effectively lowering the FCFFs.
                      methodology
                                         IPTO RISK #4 | POLITICAL INSTABILITY & BORROWING COSTS - COUNTRY RISK
                           Greece's
                         satisfactory    IPTO’s activities are executed within Greek territory, and thus there is exposure to Greece’s
Political Instability
                           Financial     country risk. Even though the political climate has stabilized, and Greece’s solvency has
                        Performance
  & Borrowing
                           Business-     improved in the eyes of Credit Rating agencies (Appendix 21 - PEST Analysis), discarding
       Costs
                            friendly     political risk for a company heavily intertwined the Greek State like IPTO would be unwise.
                            political
                                         Governmental decisions directly affect IPTO’s financial results, either through RAE’s decisions,
                        environment
                       IPTO has high     implementation of new legislation, increased country risk premium -thus higher borrowing costs-
                      priority in case   , taxation changes etc. Additionally, the strained relationship between Greece and Turkey might
                       of a supplier's
                             default
                                         pose a threat in IPTO’s attempts for interconnections with foreign countries. Nevertheless, the
   Certainty of
                            With the     majority of country risk is countered by IPTO’s semi-public nature and Greece’s improving
Revenue Streams
                        exception of     financial performance
                            PPC, the
                      market shares      IPTO RISK #5 | CERTAINTY OF REVENUE STREAMS - FINANCIAL RISK
                            of other
                        suppliers are
                                         IPTO’s revenue is mainly collected from Electricity Suppliers. The impact of an insolvent supplier
                      relatively small   on IPTO’s cash flows depends on its market share. Currently PPC possesses by far the largest
                             IPTO is     market share, but the probability of PPC not servicing its liabilities towards IPTO is deemed minor
                            reguraly
                         adjusting its   -due to PPC’s semi-public nature as well as its necessity for Greece’s electricity markets-. As
                       provisions for    such, the stability of operating cash flows is almost guaranteed. Nevertheless, this could change
                          litigations
 Environmental&          Most of the
                                         in the following years, as the electricity market becomes more competitive, and other suppliers
   Contracting           projects are    are increasing their market share, segmenting IPTO’s revenue stream and exposing it to more
    Litigations          underwater      credit risk from each supplier.
                              cables
                        removing the     IPTO RISK #6 | ENVIRONMENTAL & CONTRACTING LITIGATIONS - LEGAL RISK
                       probability of
                      environmental      IPTO has a lot of pending court cases right now, mostly for litigations with construction
                          litigations    companies that require constant assessment of potential damage and proper accounting
                      Stable/downw
                                         treatment. With IPTO’s expansion, similar cases, as well as some regarding environmental
                        ard trend for
                              those      threats might be filed in the medium/long run. It must be noted that IPTO is keeping track of
                           materials'    these litigations very closely and adjusts its relevant provisions on a regular basis.
                              prices
Market Prices and     Even if Capex      IPTO RISK #7 | MARKET PRICES AND CONSTRUCTION COSTS - MARKET RISK
  Construction         is ultimately     IPTO’s Investment Plan is based necessarily on certain estimations regarding its capital
     Costs            higher, IPTO
                         will still be
                                         expenditures. Since the scope of this report extends through a decade it is of importance to
                     reimbursed for      highlight the probability of higher constructions cost, mainly due to potential rise of the raw
                     the cost due to
                        its revenue
                      methodology
                                                                                                                                        9
Figure 38 : ADMIEH BoD materials needed for cable manufacturing. Additionally, since IPTO is remunerated for its CAPEX
Position Name and Asset Base the cost will be accounted for in each year’s Total Revenue, minimizing the loss
Chairman & CEO Iason Rousopoulos if any.
Vice Chairman Ioannis Kampouris
Member Konstantinos Karakatsanis CORPORATE GOVERNANCE
Member Evangelos Darousos
Member Alexandros Nikolouzos ADMIE HOLDING’s GOVERNANCE
Source: Company Data ADMIE Holding’s Board of Director consists of 5 members two of which are independent. A
corporate governance assessment was conducted for ADMIE Holding based on CFA’s
Figure 39 : ADMIEH Corp. Gov
Corporate Governance Manual, supplemented with the team’s evaluation (Figure 38, 39). The
Score company’s governance policy is equipped with solid principles, operating with transparency on
Category Average Score the function of the Audit Committee and respect to Shareholder Rights. However, a possible
Executive Committee 1.82
conflict of interest might arise because only the 40% of the BoD is independent and the role of
Audit Committee 3
the CEO & Chairman is not separated. The lack of Compensation Committee could be pointed
Protection of
3 out as a major drawback of company’s governance policy, however it can be justified due to of
Shareholders' Rights
Total Average Score the small number of its staff (Appendix 31 – ADMIEH’s Governance Assessment).
2.61
(out of 3) IPTO’s GOVERNANCE
Source: Team Analysis, CFA Corp. Gov. Manual
IPTO’s BoD consists of 9 members, 4 of whom are independent (44.4%), and maintains 14
distinct departments. The company complies with accepted governance, social and
Figure 40 : IPTO Corp. Gov. Score environmental policies. The team’s corporate governance analysis, assisted by Reuters &
Score Refinitiv, indicated that improved compensation and remuneration policies, combined with an
Categories (out of Weight Calculation empowered CSR strategy could upgrade the administration structure. IPTO’s governance was
10) scored B- compared to its peer’s B+ grade (Figure 41). It must be noted that information about
Audit and Risk ESG metrics of IPTO and most of its peers is inadequately reported on the database. As a result,
Oversight 10 25% 25% these grades do not entirely reflect the company’s governance strategy, and an additional
Board
governance assessment was conducted using the ISS (Institutional Shareholder Services)
Structure 8 35% 28%
Rating Methodology (Figure 40). By utilizing this procedure - focused more on the company’s
Shareholder
Rights 8 25% 20%
board structure and its affiliations with the shareholder and management-, a 7.75/10 grade was
Compensation attributed. with the compensation & remuneration policy highlighted as the most crucial pillar the
and 5 company should amend (Appendix 32 – IPTO Corporate Governance Assessment).
Remuneration 15% 7.5%
IPTO’s ENVIRONMENTAL ASSESSMENT
Total Score 7.75 100% 77.5%
Regarding IPTO’s environmental sustainability there is definitely room for improvement as the
Source: Team Analysis, ISS Rating
C+ grade is considered rather low compared to its peers’ average B (Figure 41). Despite the
Figure 41 : IPTO ESG Score company’s good scores on Environmental Innovation & Emissions Reduction, this low grade
Pillar originates mostly from poor performance on the Renewable Sources pillar as IPTO has not fully
Categories Pillars Grade
Score converted its energy means yet. Nevertheless, this rate is expected to increase in the following
Resources Use years as it is certain that RES will rapidly replace other energy sources and IPTO will inevitably
Environmental Emissions 0.44 C+ conform. (Appendix 33 – IPTO’s Environmental Assessment).
Innovation
Workforce IPTO’s SOCIAL ASSESSMENT
Human Rights On a social level, the company provides high labor standards and ensures a healthy and safe
Social Community 0.66 B workplace for its employees. IPTO’s overall social grade is B, confidently higher than its peer
Product group’s C. Social consciousness is also validated by the company’s operating activity and nature;
Responsibility
its main goal is to fulfil social needs regarding electricity interconnections with the minimum cost
Management
Shareholder
impact transmitted to the consumers. Although the company might not yet run programs solely
Governance 0.55 B- towards social awareness, as previously mentioned social sensibility is purely predicted in the
Rights
CSR Strategy company’s role. The social analysis was supported by Reuters & Refinitiv database (Appendix
ESG Total Grade 0.55 B- 34 - IPTO’s Social Assessment). Overall, the combined result of IPTO’s ESG assessment is B-,
Source: Team Analysis, Reuters, Refinitiv reflecting its adequate governance policies and the social aspect of its business.
10Appendix 1: Abbreviations
ABBREVIATION FULL TERM
AR Allowed Revenue
ASE Athens Stock Exchange
BoC Bank of China
BoG Bank of Greece
CAGR Compounded Annual Growth Rate
CapEx Capital Expenditures
CAPM Capital Asset Pricing Model
CoD Cost of Debt
CoE Cost of Equity
CRP Country Risk Premium
CSR Corporate Social Responsibility
D/E Debt-to-Equity Ratio
DDM Dividend Discount Model
DFCFF Discounted Free Cash Flows to the Firm
DPS Dividends Per Share
EBITDA Earnings Before Interest Tax Depreciation and Amortization
ENTSO-E Eruopean Transmission System Operators of Electricity
EPS Earnings Per Share
EV Enterprise Value
FCFF Free Cash Flows to the Firm
FDI Foreign Direct Investment
GDP Gross Domestic Product
HEMO Hellenic Electricity Market Operator
HEnEx Hellenic Energy Exchange
HVC High Voltage Centers
ICBC Industrial and Commercial Bank of China
IPTO Independend Power Transmission Operator
ISS Institutional Shareholder Services
MRP Market Risk Premium
NPEC National Plan for Electricity and Climate
P/B Price-to-Book Ratio
P/E Price-to-Earnings Ratio
PPC Public Power Corporation
PSO Public Service Obligations
RAB Regulated Asset Base
RAE Regulatory Authority for Energy
RES Renewable Energy Sources
ROE Return on Equity
ROIC Return on Invested Capital
RR Required Revenue
S&P Standard & Poor's Global Ratings
SOE State Owned Enterprise
TSO Transmission System Operator
TV Terminal Value
VES Voluntarily Exit Scheme
WACC Weighted Average Cost of Capital
WIP Work in Progress
YTM Yield to Maturity
11You can also read