BULLETIN MONTHLY ECONOMIC - March 2019

Page created by Tommy Becker
 
CONTINUE READING
BULLETIN MONTHLY ECONOMIC - March 2019
MONTHLY ECONOMIC
BULLETIN    March 2019

        Krungsri Research
BULLETIN MONTHLY ECONOMIC - March 2019
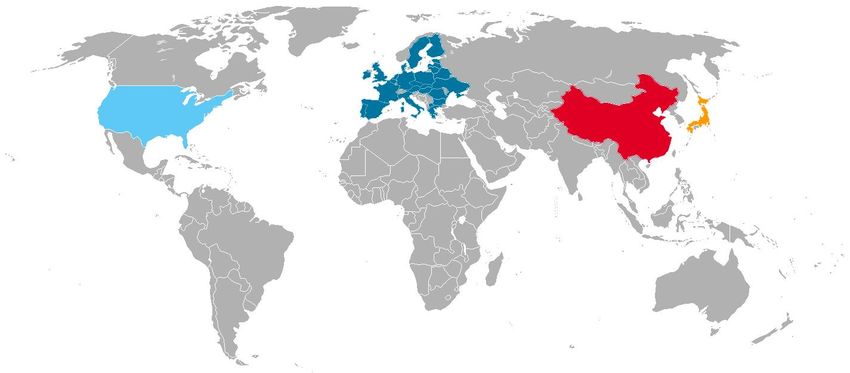
Global: Taking a load off

                                                                         China
                                                                           There are still external headwinds, but domestic activity
                                                                            has started to stabilize.
                                                                           Government cuts growth target, reiterates targeted and
                                                                            prudent policy to avoid a substantial slowdown.
                                                                           Broad policy rate cut is unlikely as transmission of
                                                                            recent targeted easing is becoming more effective.

                                          Europe
                                            Decent rebound in January-February
US                                           data suggests growth slippage is not
     Marked rebound in consumption with                                                  Japan
                                            one-sided.
                                                                                           Consumption continued to lose
     buoyant outlook as favourable          ECB’s dovish surprise: offering new
     spending conditions outstrip mixed                                                     momentum, but should recover in
                                             TLTROs, pushing out date-contingent
     job data.                                                                              coming months.
                                             rate guidance, slashing growth forecast.
                                                                                           Slim chance of more massive easing as
    Housing sector is recovering, with     Brexit timeline: UK Parliament backs 3-
     recent rebound in sales and                                                            current financial conditions are very
                                             month Brexit delay, but Theresa May
     homebuilder sentiment, mortgage                                                        accommodative.
                                             still hoping for “third time lucky”.
     rates likely peaked.

                                                                                                                   Krungsri Research   2
BULLETIN MONTHLY ECONOMIC - March 2019
Global growth is stabilizing driven by solid rebound in
non-manufacturing sector activity
            Non-manufacturing PMI rebounded sharply to just 1.1ppt                                                                       Jump in non-manufacturing PMI led to uptick in
            lower than the cyclical high in Sep’18                                                                                       composite PMI, suggesting GDP growth has stabilised
                                                       US ISM PMI                                                                                                         Eurozone Markit PMI
   62                               Manufacturing                                 Non-Manufacturing                             62                              Manufacturing                                 Non-Manufacturing
   60                                                                                                                           60
   58                                                                                                                           58
   56                                                                                                                           56
   54                                                                                                                           54
   52                                                                                                                           52
   50                                                                                                                           50
   48                                                                                                                           48
         Jan-16

                           Jul-16

                                              Jan-17

                                                                Jul-17

                                                                                   Jan-18

                                                                                                     Jul-18

                                                                                                                       Jan-19

                                                                                                                                     Jan-16

                                                                                                                                                       Jul-16

                                                                                                                                                                          Jan-17

                                                                                                                                                                                            Jul-17

                                                                                                                                                                                                               Jan-18

                                                                                                                                                                                                                                 Jul-18

                                                                                                                                                                                                                                                   Jan-19
                  Apr-16

                                     Oct-16

                                                       Apr-17

                                                                         Oct-17

                                                                                            Apr-18

                                                                                                              Oct-18

                                                                                                                                              Apr-16

                                                                                                                                                                 Oct-16

                                                                                                                                                                                   Apr-17

                                                                                                                                                                                                     Oct-17

                                                                                                                                                                                                                        Apr-18

                                                                                                                                                                                                                                          Oct-18
            Manufacturing PMI dropped to a 3-year low, but services                                                                      Manufacturing PMI saw the first contraction since Aug’16
            sector continued to lead non-manufacturing data higher                                                                       but Non-manufacturing PMI hit a 4-month high
                                               China Official PMI                                                                                                          Japan Markit PMI
   56                               Manufacturing                                 Non-Manufacturing                             56                              Manufacturing                                 Non-Manufacturing

   54                                                                                                                           54

   52                                                                                                                           52

   50                                                                                                                           50

   48                                                                                                                           48
         Jan-16

                           Jul-16

                                              Jan-17

                                                                Jul-17

                                                                                   Jan-18

                                                                                                     Jul-18

                                                                                                                       Jan-19

                                                                                                                                     Jan-16

                                                                                                                                                       Jul-16

                                                                                                                                                                          Jan-17

                                                                                                                                                                                            Jul-17

                                                                                                                                                                                                               Jan-18

                                                                                                                                                                                                                                 Jul-18

                                                                                                                                                                                                                                                   Jan-19
                  Apr-16

                                     Oct-16

                                                       Apr-17

                                                                         Oct-17

                                                                                            Apr-18

                                                                                                              Oct-18

                                                                                                                                              Apr-16

                                                                                                                                                                 Oct-16

                                                                                                                                                                                   Apr-17

                                                                                                                                                                                                     Oct-17

                                                                                                                                                                                                                        Apr-18

                                                                                                                                                                                                                                          Oct-18
Source: Institute for Supply Management (ISM), National Bureau of Statistics (NBS), Markit, Bloomberg, Krungsri Research                                                  Note: PMI data above 50 = expansion, below 50 = contraction

                                                                                                                                                                                                                                    Krungsri Research       3
US: Marked rebound in consumption, buoyant outlook as
favourable spending conditions outstrip mixed job data
Non-farm payrolls decelerated to +20k in February vs 180k consensus estimate, largely blamed on winter weather and payback from unusually strong
gains in prior months. Still, the +12k upward revision to December-January data pushed the 12-month moving average “underlying pace” above 200k.
In the household survey, unemployment fell by 300k, pushing unemployment rate back down to 3.8% from 4.0%. The broader U6 measure of
underemployment declined to 7.3% from 8.1%, reaching its lowest since 2000. Consumption growth has rebounded markedly as retail sales in control
group rose 2.7% YoY in January (vs +0.9% in December). Looking ahead, with stronger wage growth, improving household survey employment data,
and consumer confidence picking up, the immediate outlook for consumer spending remains strong.
 ’000 sa             Change in Non-farm Payrolls                             % YoY               Average hourly earnings
 400                                                                         3.5
                            Latest         12-month ma
                                                                             3.0
 300
                                                                             2.5
 200                                                                 209
                                                                             2.0
 100                                                                                                                                                       1.5
                                                                                                                                                      20
    0                                                                                                                                                      1.0
                 Jul-12

                                   Jul-13

                                                      Jul-14

                                                                        Jul-15

                                                                                           Jul-16

                                                                                                               Jul-17

                                                                                                                                   Jul-18

                                                                                                                                                                          Jul-12

                                                                                                                                                                                            Jul-13

                                                                                                                                                                                                               Jul-14

                                                                                                                                                                                                                                 Jul-15

                                                                                                                                                                                                                                                   Jul-16

                                                                                                                                                                                                                                                                     Jul-17

                                                                                                                                                                                                                                                                                       Jul-18
        Jan-12

                          Jan-13

                                            Jan-14

                                                               Jan-15

                                                                                 Jan-16

                                                                                                     Jan-17

                                                                                                                         Jan-18

                                                                                                                                             Jan-19

                                                                                                                                                                 Jan-12

                                                                                                                                                                                   Jan-13

                                                                                                                                                                                                     Jan-14

                                                                                                                                                                                                                        Jan-15

                                                                                                                                                                                                                                          Jan-16

                                                                                                                                                                                                                                                            Jan-17

                                                                                                                                                                                                                                                                              Jan-18

                                                                                                                                                                                                                                                                                                Jan-19
   %                                                 Unemployment rate                                                                                %    Index                        Consumer confidence vs Retail sales                                                                         % YoY
  9.0                                                                                                                                                 16   150                                                                                                                                         6.0
                                                                                 U3 unemployment (LHS)
  8.0                                                                                                                                                 14
                                                                                 U6 underemployment                                                        125
  7.0                                                                                                                                                 12                                                                                                                                                 4.0
  6.0                                                                                                                                                 10   100
  5.0                                                                                                                                                 8                                                                                                                                                  2.0
                                                                                                                                                            75
  4.0                                                                                                                                                 6                                                       Conference Board Consumer Confidence
                                                                                                                                                                                                              Retail sales control group* (RHS)
  3.0                                                                                                                                                 4     50                                                                                                                                           0.0
        Jan-12
                 Jul-12
                          Jan-13
                                   Jul-13
                                            Jan-14
                                                      Jul-14
                                                               Jan-15
                                                                        Jul-15
                                                                                 Jan-16
                                                                                          Jul-16
                                                                                                    Jan-17
                                                                                                              Jul-17
                                                                                                                        Jan-18
                                                                                                                                  Jul-18
                                                                                                                                            Jan-19

                                                                                                                                                                 Jan-12
                                                                                                                                                                          Jul-12
                                                                                                                                                                                   Jan-13
                                                                                                                                                                                            Jul-13
                                                                                                                                                                                                     Jan-14
                                                                                                                                                                                                               Jul-14
                                                                                                                                                                                                                        Jan-15
                                                                                                                                                                                                                                 Jul-15
                                                                                                                                                                                                                                          Jan-16
                                                                                                                                                                                                                                                   Jul-16
                                                                                                                                                                                                                                                            Jan-17
                                                                                                                                                                                                                                                                     Jul-17
                                                                                                                                                                                                                                                                              Jan-18
                                                                                                                                                                                                                                                                                       Jul-18
                                                                                                                                                                                                                                                                                                Jan-19
                                                                                                                                                            * Retail sales control group (excluding automobiles, gasoline, building materials and food services)
Source: Bureau of Labor Statistics (BLS), Census Bureau, Conference Board, Krungsri Research                                                                represents the total industry sales that are used to prepare the estimates of PCE for most goods.

                                                                                                                                                                                                                                                                          Krungsri Research               4
Housing sector is recovering after recent rebound in sales
and homebuilder sentiment, mortgage rates likely peaked
We had earlier anticipated the housing sector indicators would continue to trend down this year. But, we now expect housing activity to pick up this
year for three reasons. First, existing and new home sales have rebounded markedly in recent months. Second, leading indicators – housing starts and
building permits – and home builders' sentiment have improved recently. Third, headwind from higher interest rates should diminish gradually as
mortgage rates have likely peaked. All in, residential investment, which had dragged 2018 GDP, could contribute to growth this year.

Index                                                        Home Sales                                                                             Million       %                                      30-Year Fixed Mortgage Rate
115                                                                                                                                                    800        5.5
            * The most reliable leading
            indicator for existing home sales
110                                                                                                                                                         700   5.0
105                                                                                                                                                         600   4.5
100                                                                                                                                                         500   4.0
  95                                                                                  Pending Home Sales *                                                  400   3.5
                                                                                      New Home Sales (RHS)
  90                                                                                                                                                        300   3.0
       Jan-12
                Jul-12
                         Jan-13
                                  Jul-13
                                           Jan-14
                                                    Jul-14
                                                             Jan-15
                                                                       Jul-15
                                                                                 Jan-16
                                                                                           Jul-16
                                                                                                     Jan-17
                                                                                                                Jul-17
                                                                                                                           Jan-18
                                                                                                                                      Jul-18
                                                                                                                                                 Jan-19

                                                                                                                                                                                   Jul-12

                                                                                                                                                                                                      Jul-13

                                                                                                                                                                                                                          Jul-14

                                                                                                                                                                                                                                            Jul-15

                                                                                                                                                                                                                                                                 Jul-16

                                                                                                                                                                                                                                                                                      Jul-17

                                                                                                                                                                                                                                                                                                        Jul-18
                                                                                                                                                                         Jan-12

                                                                                                                                                                                             Jan-13

                                                                                                                                                                                                               Jan-14

                                                                                                                                                                                                                                   Jan-15

                                                                                                                                                                                                                                                       Jan-16

                                                                                                                                                                                                                                                                          Jan-17

                                                                                                                                                                                                                                                                                               Jan-18

                                                                                                                                                                                                                                                                                                                 Jan-19
Million                  Leading indicators for Housing Market                                                                                            Index   ppt                                          Residential Investment                                                             % QoQ saar
1.6                                                                                                                                                          80   1.0                                                                                                                                            30
 1.4                                                                                                                                                        70
                                                                                                                                                                  0.5                                                                                                                                            15
 1.2                                                                                                                                                        60
 1.0                                                                                                                                                        50    0.0                                                                                                                                            0
 0.8                                                                             Housing Starts                                                             40
                                                                                 Building Permits                                                                 -0.5                                                                                                                                           -15
 0.6                                                                                                                                                        30
                                                                                 NAHB Home Builders (RHS)                                                                                                                CTG (LHS)                              Growth
 0.4                                                                                                                                                        20    -1.0                                                                                                                                           -30
                Jul-12

                                  Jul-13

                                                    Jul-14

                                                                        Jul-15

                                                                                            Jul-16

                                                                                                                  Jul-17

                                                                                                                                        Jul-18
       Jan-12

                         Jan-13

                                           Jan-14

                                                              Jan-15

                                                                                  Jan-16

                                                                                                       Jan-17

                                                                                                                             Jan-18

                                                                                                                                                   Jan-19

                                                                                                                                                                            1Q10

                                                                                                                                                                                            1Q11

                                                                                                                                                                                                        1Q12

                                                                                                                                                                                                                        1Q13

                                                                                                                                                                                                                                    1Q14

                                                                                                                                                                                                                                                     1Q15

                                                                                                                                                                                                                                                                  1Q16

                                                                                                                                                                                                                                                                                   1Q17

                                                                                                                                                                                                                                                                                               1Q18
Source: National Association of Realtors (NAR), Census Bureau, Mortgage Bankers Association (MBA), National Association of Home Builders (NAHB), Bureau of Economic Analysis (BEA), Krungsri Research

                                                                                                                                                                                                                                                                                    Krungsri Research                 5
Europe: Decent rebound in January-February data
suggests growth slippage is not one-sided
A sharp rebound in January retail sales (+2.2% YoY from +0.3% in December) provides some reassurance that consumer spending isn’t falling off a
cliff. Looking ahead, we expect household consumption to expand at a moderate pace. Consumer confidence had surged in February led by broad-
based improvement and is consistent with retail sales growth of over 1.5%. Country-level data show industrial production (IP) had rebounded by 1.7%
YoY in France (after falling 2.5% in December) and by 1.8% in Spain (following a 4.2% drop), while Italy booked a smaller drop (-0.8% from -5.5%).
Germany was the only exception as IP tumbled 3.3% YoY (from -2.7%), dragged by a 19% drop in auto production. However, an improvement in
February data (-1.5%) suggests supply problems in the auto industry have waned.
 % YoY                Euro area consumption data                     DI         DI                   EC Consumer Confidence
 5.0                                                                  0          5
                Retail sales (LHS)        EC Consumer Confidence                             Germany           France           Italy         Spain
 4.0                                                                  -3         0
                                                                                -5
 3.0                                                                  -6
                                                                              -10
 2.0                                                                  -9
                                                                              -15
 1.0                                                                  -12     -20
  0.0                                                                                                                -15   -25
                    Jul-14

                                        Jul-15

                                                             Jul-16

                                                                               Jul-17

                                                                                                 Jul-18

                                                                                                                                          Jul-14

                                                                                                                                                            Jul-15

                                                                                                                                                                                 Jul-16

                                                                                                                                                                                                      Jul-17

                                                                                                                                                                                                                            Jul-18
          Jan-14

                              Jan-15

                                                   Jan-16

                                                                      Jan-17

                                                                                        Jan-18

                                                                                                          Jan-19

                                                                                                                                 Jan-14

                                                                                                                                                   Jan-15

                                                                                                                                                                       Jan-16

                                                                                                                                                                                            Jan-17

                                                                                                                                                                                                                 Jan-18

                                                                                                                                                                                                                                       Jan-19
 % YoY                                           Germany Production                                                % YoY   % YoY                                Industrial Production
 10                                                                                                                  40    12
                        Industrial Production (LHS)                            VDA Car Production
                                                                                                                            8
   5                                                                                                                 20
                                                                                                                            4
   0                                                                                                                 0      0
                                                                                                                            -4
  -5                                                                                                                 -20
                                                                                                                            -8
                                                                                                                                               France                Italy                 Spain
 -10                                                                                                                 -40   -12
        Jan-14

                   Jul-14

                             Jan-15

                                       Jul-15

                                                  Jan-16

                                                            Jul-16

                                                                      Jan-17

                                                                               Jul-17

                                                                                        Jan-18

                                                                                                 Jul-18

                                                                                                          Jan-19

                                                                                                                                 Jan-14

                                                                                                                                          Jul-14

                                                                                                                                                   Jan-15

                                                                                                                                                            Jul-15

                                                                                                                                                                        Jan-16

                                                                                                                                                                                  Jul-16

                                                                                                                                                                                             Jan-17

                                                                                                                                                                                                       Jul-17

                                                                                                                                                                                                                   Jan-18

                                                                                                                                                                                                                              Jul-18

                                                                                                                                                                                                                                         Jan-19
Source: Eurostat, European Commission (EC), Association Of The German Automotive Industry, Bloomberg, Krungsri Research

                                                                                                                                                                                                                Krungsri Research               6
ECB’s dovish surprise: offering new TLTROs, pushing out
date-contingent rate guidance, slashing growth forecast
  %                     ECB staff projections for Euro area                                           Key notes from ECB Meeting on March 7
 2.0
                               Sep'18                   Dec'18                  Mar'19                   The Governing Council announced dovish policy measures and
 1.8                                                                                                      guidance that exceeded market expectations.
 1.6                                                                                                     (i) Introduced a third round of TLTROs. The ECB will conduct a
 1.4                                                                                                      series of quarterly operations from September 2019 to March
                                                                                                          2021 (total of 7 operations), with 2-year maturities at a rate
 1.2                                                                                                      indexed to the MRO (currently at 0%). The new TLTROs will
 1.0                                                                                                      include an incentive to encourage bank lending, to be capped at
                                                                                                          30% of eligible loans.
 0.8
                                                                                                          (ii) Pushed back forward guidance for policy rate to end-2019.
          2018

                 2019

                        2020

                                2021

                                        2018

                                                 2019

                                                          2020

                                                                 2021

                                                                         2018

                                                                                 2019

                                                                                        2020

                                                                                               2021
                                                                                                      

                                                                                                          President Draghi indicated “several” members had proposed an
                 Real GDP                      HICP inflation                   Core HICP                 extension until March 2020. The ECB is retaining the state-
                                                                                 inflation
                                                                                                          contingent element for rate guidance “and in any case for as long
            Eurozone Financial                          Index           EUR NEER                          as necessary”.
Index
                Conditions                                                                               (iii) Slashed growth projections to 1.1% for 2019 (from 1.7%)
 1.0                                                110
 0.8                                                108                                                   and 1.6% in 2020 (from 1.7%). The ECB retained its decision that
 0.6                                                106                                                   risks to its forecasts are tilted to the downside, citing geopolitical
 0.4                                                104                                                   uncertainty, protectionism, and vulnerabilities in EMs. Draghi
 0.2                                                102                                                   continued to note that all ECB members assessed the probability
 0.0
                                                    100                                                   of a recession was “very low”.
-0.2
-0.4                                                 98
                                                                                                         The dovish surprises suggest there is slim chance of additional
-0.6                                                 96
                                                     94                                                   policy changes in the near-term given that Eurozone financial
-0.8
-1.0                                                 92                                                   conditions have eased substantially and the euro has weakened,
-1.2                                                 90                                                   suggesting more favorable economic conditions. However, we
                                                                                                          expect the ECB to further change its date-contingent guidance
       Jan-14
        Jul-14
       Jan-15
        Jul-15
       Jan-16
        Jul-16
       Jan-17
        Jul-17
       Jan-18
        Jul-18
       Jan-19

                                                                 Jan-14
                                                                  Jul-14
                                                                 Jan-15
                                                                  Jul-15
                                                                 Jan-16
                                                                  Jul-16
                                                                 Jan-17
                                                                  Jul-17
                                                                 Jan-18
                                                                  Jul-18
                                                                 Jan-19

                                                                                                          given that markets are not pricing-in the first rate hike until 2021.
Source: European Central Bank (ECB), Bloomberg, Krungsri Research

                                                                                                                                                             Krungsri Research   7
Brexit timeline: UK Parliament backs 3-month Brexit delay,
but Theresa May still hoping for “third time lucky”
      Date                      Event                                                                    Perspectives
  12 March               Second Meaningful             House of Commons voted 391-242 to reject Theresa May's revised Brexit deal. The 149-vote margin was less
                          Vote on Brexit deal           than the record 230-vote margin in the First Meaningful Vote on January 15.
  13 March               Vote on no deal               Parliament voted 312-308 to reject no-deal Brexit at any time and under any circumstances.

  14 March               Vote on delaying              Parliament voted 412-202 to delay the Brexit deadline by three months to June 30. The motion adds that the 3-
                          Brexit                        month delay would be “for the purpose of passing the necessary EU exit legislation”.
  19 March               Third Meaningful              If Parliament finally passes the Brexit deal, it must also be approved by the EU Parliament in a plenary vote.
                          Vote on Brexit deal           However, if Parliament does not support the Brexit deal, the delay will be much longer and require the UK to
                                                        take part in EU Parliament elections in May. A longer Brexit delay would raise the possibility of a softer Brexit
                                                        and a second referendum to reverse the Brexit decision which many Brexiters would see as a betrayal.
  21-22 March            EU summit                     The issue is what kind of Article 50 extension to grant to the UK. This involves deciding how long a delay should
                                                        be, whether it should be one-off, and what the conditions should be. A shorter extension could lead to a
                                                        subsequent extension request. A longer extension would allow time for a more extensive review of the UK’s
                                                        “red lines”, which EU leaders prefer to avoid.
  29 March               Scheduled Brexit day Now it is likely to slip past with the UK remaining in the EU. To avert significant market volatility, prudent
                                               precautionary measures have been implemented: (i) BOE has launched lending facility for UK lenders to access
                                               euro funding, starting Mar 13; (ii) a 12-month window for European derivatives traders to continue using UK-
                                               based clearing houses, effective from actual Brexit day.
  23-26 May              EU Parliament                 EC President Jean-Claude Juncker said any delay beyond May 23 would require the UK to take part in the EU
                          elections                     Parliament elections. However, many EU officials disagree with Juncker’s cut-off date. Instead, they see the key
                                                        moment as July 2 (the first sitting of new EU Parliament).
  Before                 EU ratification               Given that both sides – the UK and the EU – share an incentive to avoid a “no deal scenario”, the EU is likely to
  30 June                                               accept the UK’s extension request.
  30 June                Brexit day                    A June 30 exit date is far from certain. Some EU leaders have talked of much longer delays, as has PM May, if
                                                        Britain wants to fundamentally reconsider what kind of Brexit deal it wants.

Source: BBC, Financial Times, The Economist, Bloomberg, Krungsri Research

                                                                                                                                                        Krungsri Research   8
China: External headwinds intact, but domestic activity
has started to stabilize
  sa                                         Manufacturing PMI                                                                                   China’s export growth by destination (% YoY)
  56                      Headline                         New Orders                                Export Orders                                            Nov'18          Dec'18       Jan-Feb'19
  54                                                                                                                                                                                                         12.1
                                                                                                                                                      9.8
                                                                                                                                                                  6.0            5.1 4.3
  52                                                                                                                                  3.9
                                                                                                                                                                          1.5                    1.4             3.3
                                                                                                                                                                                           0.9
  50
                                                                                                                                                                       -0.3                       -1.8
  48                                                                                                                                                   -3.5                                           -5.0          -3.3
                                                                                                                                        -4.6 -4.6
  46
                                                                                                                                                          -14.6
  44
                                                                                                                                        Total           US          EU             ASEAN           Latin       Africa
        Jan-16

                           Jul-16

                                              Jan-17

                                                                Jul-17

                                                                                   Jan-18

                                                                                                       Jul-18

                                                                                                                         Jan-19
                 Apr-16

                                    Oct-16

                                                       Apr-17

                                                                         Oct-17

                                                                                            Apr-18

                                                                                                                Oct-18
                                                                                                                                  ( ) share in 2018   (19.3%)     (16.5%)         (12.9%)        America       (4.2%)
                                                                                                                                                                                                  (6.0%)

  sa                                   Non-Manufacturing PMI                                                                      Krungsri Research’s view
  66                                                                                                                                 External headwinds are intact. Blown by the Lunar New Year distortion,
                                             Construction                         Services                                            February exports dropped after surging in January, and led exports to
  64                                                                                                                                  drop 4.6% YoY in the first two months, matching the drop in December.
  62                                                                                                                                  The impact of higher tariff is more pronounced as shipments to the US
  60                                                                                                                                  have tumbled, and by smaller magnitudes to other markets. Looking
                                                                                                                                      forward, continued weakness in the Export Orders sub-indices in the
  58
                                                                                                                                      Manufacturing PMI suggests export growth will remain weak despite
  56                                                                                                                                  optimism over US-China trade negotiation.
  54                                                                                                                                 On the other hand, domestic economic activity appears poised to
  52                                                                                                                                  stabilize. Services PMI growth is accelerating. Construction PMI is
  50                                                                                                                                  expanding, albeit at a slower pace. New Orders sub-indices in the
                                                                                                                                      Manufacturing PMI rebounded recently. A furry of government
                           Jul-16

                                                                Jul-17

                                                                                                       Jul-18
        Jan-16

                                             Jan-17

                                                                                   Jan-18

                                                                                                                         Jan-19
                 Apr-16

                                    Oct-16

                                                       Apr-17

                                                                         Oct-17

                                                                                            Apr-18

                                                                                                                Oct-18

                                                                                                                                      stimulus policies are likely to materialize soon, which could reinforce
                                                                                                                                      the recovery momentum in 2H19.
Note: PMI data above 50 = expansion, below 50 = contraction
Source: National Bureau of Statistics (NBS), Reuters, Capital Economics, CEIC, Financial Times, Bloomberg Krungsri Research

                                                                                                                                                                                                        Krungsri Research   9
Government cuts growth target, reiterates “targeted and
prudent” policy to avoid a substantial slowdown
                                           2018               2018                        2019
              Indicator                                                                                                                 Company tax and social security premium will
                                          Actual             Target                      Target
                                                                                                                                        be reduced by about CNY2trn or 2.2% of GDP,
                                                                                                                                        up from CNY1.3trn last year. This includes 3%
           GDP growth                                                                                                                   cut in manufacturing VAT and 1% cut for
                                           6.6%               6.5%                             6.0-6.5%
            (% YoY)                                                                                                                     construction and transport sectors worth up to
                                                                                                                                        CNY600bn or 0.6% of GDP.
           Fiscal deficit                                     2.6%                                   2.8%
                                           4.1%
            (% of GDP)
                                                                                                                                        Further targeted easing to support private and
                                                                                                                                        small firms lending, and reduce their funding
   Special local government                                                                                                             cost including targeted RRR cut.
          bond quota                       1.79,              1.35,                                 2.15,
                                            2%                1.5%                                  2.2%
     (trn CNY, % of GDP)
                                                                                                                                        Debt-swap program will continue to ease local
                                                          Reasonable                                                                    government burden with market-based
             TSF, M2                      273%,                                              Keep ratio
                                                            growth,                                                                     approach.
            (% of GDP)                    203%                                                  stable
                                                           No target

   Krungsri Research’s view
       The government has revised down 2019 growth target to 6-6.5% from 6.5%, citing external headwinds (e.g. slowing global
        growth, ongoing trade policy uncertainty) and slowing domestic demand.
       Monetary policy remains “prudent”, implying the government will ease monetary policy in a way that will keep leverage ratio
        and M2 money supply stable. Targeted measures, i.e. targeted RRR cuts and targeted medium-term lending facility (TMLF),
        should continue or possibly extended, particularly to support small and micro businesses.
       Fiscal policy will be “more proactive”. More measures have been announced, including infrastructure spending and various tax
        cuts. The widening on-budget deficit target (+0.2% of GDP) and augmented off-budget deficit (+0.7% of GDP) driven by special
        local government bond quota would strengthen the fiscal impulse and will be sizable enough to avoid a substantial slowdown.

Note: CPI and unemployment target is set as same as the last year, 3% and 5.5% respectively. They are the ceiling target meaning that official no need to react if the number is below the target.
Source: National People's Congress (NPC), NBS, Bloomberg, Reuters, Capital Economics, CEIC, Krungsri Research

                                                                                                                                                                                      Krungsri Research   10
Broad policy rate cuts unlikely as transmission of recent
targeted easing is becoming more effective
With economic data weakening, people are talking about the possibility of broad policy rate cuts. We think this is unlikely for three reasons. First, the
effectiveness of recent targeted policies is more pronounced. Lower interbank rates have started to kick in, and lending rates are dropping. Loans to
non-financial institutions are growing at a cyclical-high pace. Total Social Financing (TSF) has increased recently led by bank loans and the financial
market instead of shadow-banking industry. Second, to avoid financial market volatility, the PBOC is likely to stick with its “targeted and prudent”
guidance. Third, there is more room now than before, for the government to loosen fiscal policy in tandem. For example, the government can opt to
relax some regulations in the housing sector as house prices are stabilizing.

                                                       Interest rate (%)                                                                                   12-month rolling sum of Total Social Financing (TSF)
                                             SHIBOR-Lending rate spread (RHS)                                                            80                      Loan                                                                                 Shadow banking
 8                                                                                                                                   4                           Corporate Bond                                                                       Non Financial Enterprise Equity
                                                                                                                                         60                      Other                                                                                Total
                                   Policy rate                                    Effective lending rate                             3
 6                                                                                                                                       40
                                                                                                         SHIBOR                      2   20
 4                                                                                                                                        0
                                                                                                                                     1
                                                                                                                                         -20
 2                                                                                                                                   0   -40
         1Q12
                   3Q12
                            1Q13
                                     3Q13
                                             1Q14
                                                    3Q14
                                                            1Q15
                                                                    3Q15
                                                                             1Q16
                                                                                       3Q16
                                                                                                  1Q17
                                                                                                           3Q17
                                                                                                                    1Q18
                                                                                                                            3Q18

                                                                                                                                               1Q12
                                                                                                                                                         3Q12
                                                                                                                                                                    1Q13
                                                                                                                                                                               3Q13
                                                                                                                                                                                             1Q14
                                                                                                                                                                                                        3Q14
                                                                                                                                                                                                                  1Q15
                                                                                                                                                                                                                           3Q15
                                                                                                                                                                                                                                     1Q16
                                                                                                                                                                                                                                                3Q16
                                                                                                                                                                                                                                                           1Q17
                                                                                                                                                                                                                                                                     3Q17
                                                                                                                                                                                                                                                                                   1Q18
                                                                                                                                                                                                                                                                                             3Q18
                                                                                                                                                                                                                                                                                                      Jan-19
                                     12-month rolling sum of loan (% YoY)                                                                                                                       House price (% YoY)
                            Non Financial Enterprise and Govt Agency                                                Household             40
  80                                                                                                                                                                                             1-tier                             2-tier                               3-tier
  60                                                                                                                                      30
  40                                                                                                                                      20
  20
                                                                                                                                          10
     0
 -20                                                                                                                                       0
 -40                                                                                                                                     -10
            1Q12
                     3Q12
                              1Q13
                                      3Q13
                                             1Q14
                                                    3Q14
                                                           1Q15
                                                                   3Q15
                                                                           1Q16
                                                                                    3Q16
                                                                                           1Q17
                                                                                                    3Q17
                                                                                                             1Q18
                                                                                                                     3Q18
                                                                                                                            Jan-19

                                                                                                                                                                                                         Jul-14
                                                                                                                                                                           Apr-13
                                                                                                                                                                                    Sep-13
                                                                                                                                                                                               Feb-14

                                                                                                                                                                                                                           May-15
                                                                                                                                                                                                                                    Oct-15
                                                                                                                                                                                                                                             Mar-16
                                                                                                                                                                                                                                                       Aug-16

                                                                                                                                                                                                                                                                                             Apr-18
                                                                                                                                                                                                                                                                                                      Sep-18
                                                                                                                                               Jan-12
                                                                                                                                                        Jun-12
                                                                                                                                                                 Nov-12

                                                                                                                                                                                                                  Dec-14

                                                                                                                                                                                                                                                                Jan-17
                                                                                                                                                                                                                                                                          Jun-17
                                                                                                                                                                                                                                                                                    Nov-17
Source: People's Bank of China (PBOC), NBS, Bloomberg, Krungsri Research

                                                                                                                                                                                                                                                                         Krungsri Research                     11
Japan: Consumption continues to lose momentum, but is
set to recover in coming months
Weak growth of two consumption indices confirmed consumption continued to lose momentum this year. First, retail sales growth had edged down.
Second, department store sales have tumbled after China enacted a new e-commerce law in January. The new law requires persons buying goods
for sale online in China to register with the government and pay taxes. As a result, while Chinese tourist arrivals had risen by 19.3%, duty-free sales
of cosmetics and jewelry products at department stores had fallen 7.7% YoY. This could change the structure of inbound tourist spending. Looking
ahead, consumption could improve moderately given better household and business sentiment due to stronger demand ahead of the annual
Golden Week celebration.
                                        Consumption index (% YoY)                                                                                                                                                               Tourist arrivals (% YoY)
                                     Department store sales                                              Retail sales                                                                                                           Total                                     Chinese tourist
  4                                                                                                                                                                       40
  2                                                                                                                                                                       30
  0                                                                                                                                                                       20
 -2
                                                                                                                                                                          10
 -4
 -6                                                                             Declining tourist arrivals led by worse weather                                               0
                                                                                dragged department store sales in 2H18
 -8                                                                                                                                                                      -10

                                                                                                                                                                                     Jan-18

                                                                                                                                                                                                              Mar-18

                                                                                                                                                                                                                                                                     Jul-18

                                                                                                                                                                                                                                                                                       Aug-18

                                                                                                                                                                                                                                                                                                                                Nov-18
                  Feb-18

                                      Apr-18

                                                                                                Sep-18

                                                                                                                                                                                                 Feb-18

                                                                                                                                                                                                                                         May-18

                                                                                                                                                                                                                                                                                                                                             Dec-18

                                                                                                                                                                                                                                                                                                                                                          Jan-19
                                                                                                                                                                                                                                                       Jun-18

                                                                                                                                                                                                                                                                                                     Sep-18

                                                                                                                                                                                                                                                                                                                   Oct-18
                            Mar-18

                                                                                   Aug-18

                                                                                                                                Nov-18

                                                                                                                                                                                                                           Apr-18
                                                May-18

                                                                       Jul-18

                                                                                                              Oct-18
        Jan-18

                                                           Jun-18

                                                                                                                                                  Dec-18

                     Components of domestic store sales (% YoY)                                                                                                 Jan-19                                      Economic watcher diffusion index
  10                                                                                                                                                                                                                                Business                                                    Household
                                                                     Related to duty free store sales                                                                    54
   5
                                                                                                                                                           Cosmetic      52
   0                                                                                                                                                       &jewelry      50
  -5                                                                                                                                                            Food
                                                                                                                                                                Household48
 -10                                                                                                                                                            Clothing 46

 -15                                                                                                                                                                     44

                                                                                                                                                                                                                                    May-18
                                                                                                                                                                                  Jan-18

                                                                                                                                                                                                          Mar-18

                                                                                                                                                                                                                                                  Jun-18
                                                                                                                                                                                                                                                                Jul-18
                                                                                                                                                                                                                                                                              Aug-18

                                                                                                                                                                                                                                                                                                                       Nov-18

                                                                                                                                                                                                                                                                                                                                                 Jan-19
                                                                                                                                                                                              Feb-18

                                                                                                                                                                                                                                                                                            Sep-18
                                                                                                                                                                                                                                                                                                          Oct-18

                                                                                                                                                                                                                                                                                                                                    Dec-18

                                                                                                                                                                                                                                                                                                                                                             Feb-19
                                                                                                                                                                                                                       Apr-18
                                                                    Jul-18

                                                                                                         Oct-18
         Jan-18

                   Feb-18

                            Mar-18

                                     Apr-18

                                               May-18

                                                         Jun-18

                                                                                Aug-18

                                                                                                                                         Dec-18
                                                                                            Sep-18

                                                                                                                                                       Jan-19
                                                                                                                       Nov-18

Source: Cabinet office, Japan Department Stores Association, Nikkei Asian Review , Krungsri Research

                                                                                                                                                                                                                                                                                                                                Krungsri Research                     12
Slim chance of more massive easing as current financial
conditions are very accommodative
                                     Financial Gap Index*                                                               (19 Feb) BOJ would have to consider additional stimulus if the
  1.5                                                                                                                   exchange rate affected Japan’s inflation and economy.
                   Financial institutions                         Financial market
                                                                                                                        (22 Feb) BOJ will adopt policy that is most appropriate in light
                   Real estate                                    Residential investment                                of economic and financial developments, and has the least
                   Credit                                         Total                               Haruhiko Kuroda   side-effects. Tax hike in October is unlikely to have a big
  1.0
                                                                                                          Dovish        negative impact. Global economy is expanding “fairly steadily”.
                                                                                   Easing
                                                                                                                        (26 Feb) The central bank must ramp up monetary stimulus to
  0.5                                                                                                                   achieve its inflation target as maintaining the current policy for
                                                                                                                        too long could cause excessive swings in the economy.
                                                                                                      Goushi Kataoka
                                                                                                       Super Dovish
  0.0                                                                                                                   (28 Feb) Many board members, including myself, believe the
                                                                                                                        momentum (to achieve the price goal) is sustainable. As such,
                                                                                                                        there is absolutely no need to ease further. The demerits of
                                                                                                                        further easing could exceed the costs, so we need to be careful
 -0.5                                                                                                                   of debating such an action.
                                                                                                      Hitoshi Suzuki
                                                                                   Tightening            Neutral
                                                                                                                        (6 Mar) If the economy deteriorates to the extent that
 -1.0                                                                                                                   achieving the long-term inflation target becomes difficult, it is
        1Q00
        1Q01
        1Q02
        1Q03
        1Q04
        1Q05
        1Q06
        1Q07
        1Q08
        1Q09
        1Q10
        1Q11
        1Q12
        1Q13
        1Q14
        1Q15
        1Q16
        1Q17
        1Q18
                                                                                                                        necessary to strengthen monetary easing without delay. the
                                                                                                                        conduct of monetary policy should be data-dependent, not
                                                                                                      Yutaka Harada     calendar-based.
  * Comparing to its potential trend by using HP-filter and using PCA for weighted-aggregate
                                                                                                         Dovish
  Krungsri Research’s view
   Weakening economic data and lingering external uncertainties have prompted the BOJ to take a more dovish stance. However, we see slim chance of

     more massive easing for two reasons. First, there are rising concerns lower interest rates would hurt bank profits and the low degree of bond market
     function. Second, financial conditions are very accommodative currently. Our financial gap index – the difference between various variables and their
     long-tern trends – suggests current financial accommodation policies are close to that employed during overheating periods in 2006-2007 and 2009-
     2010. Although they are not broad-based like during those periods, this time, financial institution conditions are expansionary and the real estate sector
     is heating up. However, Governor Kuroda and some board members continue to keep options open, saying the BOJ will add accommodative policies if
     economic momentum is not on track to achieve the set goals. Thus, unless economic data deteriorate after the October tax hike, there would be very
     little stimulus measures. The measures could include: (i) accelerating government bond purchases while keeping to purchasing targets (BOJ's bond
     purchases have dropped to JPY40trn, well below its JPY80trn annual guidance); and (ii) allowing 10-year government bond yields to deviate more
     narrowly, compared to +/- 0.2ppt from 0%, currently.
Source: Bank of Japan (BOJ), Cabinet office, Statistical Bureau, CEIC, Bloomberg, Krungsri Research

                                                                                                                                                                    Krungsri Research        13
Thailand: Converging towards potential
GDP growth recover close to potential in 4Q18
   Thailand’s GDP growth accelerated to 4.1% in 2018 (vs revised-up 4% growth for 2017) after growth recovered to 3.7% YoY in
    4Q18 (close to 3.8% potential) from 3.2% in 3Q18. This was in line with median consensus estimate (3.6%) but fell short of our
    expectation (4.0%). Sequential growth bounced back to positive (+0.82% QoQ sa vs -0.32% in 3Q18). Output gap remained
    positive for the fourth consecutive quarter.
   Despite decelerating auto sales (from +19.8% YoY to +8.5%), private consumption growth rose to +5.3% from +5.2% YoY, the
    strongest since 1Q13. Food consumption was robust: Food & Non-alcoholic Beverage (+2.4% YoY from +1.3%), Alcoholic Beverage
    & Tobacco (+4.5% YoY from -11.6%). Gross fixed investment growth accelerated to +4.2% YoY from +3.9%, reflecting stronger
    growth of private investment (+5.5% YoY, strongest since 4Q14). However, public spending was disappointing: investment growth
    was flat YoY while government consumption continued to ease. Net exports exerted a smaller drag on GDP: -3.4ppt (unadjusted)
    vs -8.4ppt previously, with both goods and services contributing to the improvement.
We now see 2019 GDP growth at 3.8% (instead of 4.1%)
   After two years of above-trend growth, we expect the Thai economy to moderate and converge towards its long-term potential of
    3.8% this year, 0.3ppt slower than the previous projection. The slower growth forecast reflects: (i) considerably weaker
    momentum in 2H18 when sequential growth averaged only +0.25% QoQ sa, way below +1.59% in 1H18; and (ii) more visible
    impact of a global slowdown.
We pushed back rate hike expectation to 2Q19 (instead of March)
   Given that 4Q18 GDP data was not encouraging and exports started the year on a down note, which over-shadowed sturdy
    growth in domestic demand indicators, a March rate hike is becoming less likely in line with the Bank of Thailand’s data-
    dependent approach. Given the BOT’s strong intention to “create policy space” and recently-hawkish policy stance (i.e. upbeat on
    growth outlook, more vigilant of financial stability risks, little concern about low inflation and strong baht), we remain convinced
    the MPC will deliver another 25bps rate hike in 1H19. If that does not happen, it is likely to maintain policy rate and end the
    current hike cycle early. Beyond 1H19, it is not appropriate to raise rates because: (i) there is higher possibility central banks in
    emerging economies would start to lower rates after the recent surprise rate cut by the Reserve Bank of India; and (ii) global
    fundamentals are expected to be weaker in 2020.

                                                                                                                         Krungsri Research   14
We trimmed 2019 GDP growth forecast by 0.3ppt to 3.8%,
now see a rate hike in 2Q19
                                                                                                                                                                       2019F
                   Krungsri Research Forecast                                                                     2017               2018
                                                                                                                                                        Previous                  Latest
     GDP growth                                                                         YoY (%)                    4.0                 4.1                   4.1                     3.8
     Pri va te Cons umpti on Expendi ture                                               YoY (%)                    3.0                 4.6                   4.3                     4.1
     Government Cons umpti on Expendi ture                                              YoY (%)                    0.1                 1.8                   2.6                     2.2
     Pri va te Inves tment                                                              YoY (%)                    2.9                 3.9                   4.8                     4.6
     Publ i c Inves tment                                                               YoY (%)                    -1.2                3.3                   8.0                     5.5
     Nomi na l Exports i n USD (f.o.b.) *                                               YoY (%)                    9.8                 7.7                   4.5                     3.5
     Nomi na l Imports i n USD (f.o.b.)                                                 YoY (%)                   13.2                14.3                   6.5                     6.0
     Current Account Ba l a nce                                                         USD, bn                   50.2                37.7                  32.1                    30.7
     Touri s t Arri va l s                                                          Mn, pers ons                  35.6                38.3                  41.3                    41.1
     Hea dl i ne Infl a ti on                                                           YoY (%)                    0.7                 1.1                   1.1                     1.1
     Core Infl a ti on                                                                  YoY (%)                    0.6                 0.7                   0.9                     0.9
     Excha nge ra te (end of peri od)                                                  THB/USD                   32.66               32.42                 31.50                   31.00
     Pol i cy Interes t ra te (end of peri od)                                              (%)                   1.50                1.75                  2.00                    2.00
     Duba i crude pri ce - peri od a vera ge                                           USD/bbl                    53.1                69.3                  66.5                    66.5
   * Our Customs-based export growth forecast for 2019 is 3.7%

Source: Office of the National Economic and Social Development Council (NESDC), Bank of Thailand (BOT), Ministry of Commerce (MOC), Ministry of Tourism and Sports (MOTS), Krungsri Research

                                                                                                                                                                             Krungsri Research   15
Key revision
                  Theme                                                             Narratives
     Lowered 2019 GDP growth     After two years of above-trend growth, we expect the Thai economy to moderate and converge towards its
      to 3.8% from 4.1%           long-term potential of 3.8% this year, 0.3ppt slower than the previous projection. The slower growth forecast
                                  reflects: (i) considerably weaker momentum in 2H18 when sequential growth averaged only +0.25% QoQ sa,
                                  way below +1.59% in 1H18; and (ii) more visible impact of a global slowdown.
     Revised down export         This reflects more visible impact of the slowing global economy and trade. We are cautiously optimistic of the
      growth forecast to 3.5%     outlook for exports premised on the following: (i) substantial progress in US-China trade talks having reduced
      from 4.5%                   risk of trade tensions escalating; (ii) Thai exports usually expand more than global trade (relatively high
                                  elasticity); and (iii) manufacturers’ plans to relocate some production bases from China to Thailand due to
                                  trade war concerns.
     Trimmed foreign tourist     We are becoming concerned about escalating tension between India and Pakistan, which has prompted several
      arrivals by 0.2m to 41.1m   airlines to reroute or suspend services. The disruption could affect inbound visitors from India and Europe – the
                                  two markets combined account for 21.8% of total foreign arrivals in 2018. However, we continue to assume
                                  this is simply a temporary, idiosyncratic factor. And the decision to waive fees for Visa-on-Arrival (VOA) up to
                                  April offer some reassurance and there was limited impact from the air pollution crisis in Bangkok, reflected by
                                  the surge in January arrivals.
     Broad-based downgrade of    The slower export growth projection will filter down to private sector spending – the outlook for investment
      domestic demand             and employment in export-oriented industries is dimmer. Public spending growth saw larger downgrades to
                                  reflect slow progress in five EEC infrastructure investment projects and delays in disbursements of investment
                                  budgets by state enterprises (especially from State Railway of Thailand).
     Pushed back rate hike       Given that 4Q18 GDP data was not encouraging and exports started the year on a down note, and over-
      expectation to 2Q19         shadowed sturdy growth in domestic demand indicators, a March rate hike is becoming less likely in line with
      (instead of March)          the Bank of Thailand’s data-dependent approach. Given the BOT’s strong intention to “create policy space” and
                                  recently-hawkish policy stance (i.e. upbeat on growth outlook, more vigilant of financial stability risks, little
                                  concern about low inflation and strong baht), we remain convinced the MPC will deliver another 25bps rate
                                  hike in 1H19. If that does not happen, it is likely to maintain policy rate and end the current hike cycle early.
                                  Beyond 1H19, it is not appropriate to raise rates, because: (i) there is higher possibility other central banks in
                                  emerging economies would start to lower rates after the recent surprise rate cut by the Reserve Bank of India;
                                  and (ii) global fundamentals are expected to be weaker in 2020.
Source: Krungsri Research

                                                                                                                                 Krungsri Research   16
2018 GDP grew 4.1% after 4Q18 growth nears potential
    %                          Thailand’s GDP growth                                THB, bn                               Real GDP (sa)                            THB, bn
  6.0                                                                              2,700                                                                              500
                                    YoY           QoQ sa                                                       Output gap (RHS)
  5.0                                                                              2,600                                                                              400
                                                                                                               Real GDP
               Average growth since 2010 = 3.8%                           3.7
  4.0                                                                              2,500                       Potential GDP                                          300
  3.0                                                                              2,400                                                                              200
                                                                       3.2
  2.0                                                                              2,300                                                                              100
                                                                          0.8
  1.0                                                                              2,200                                                                              0
  0.0                                                                              2,100                                                                              -100
 -1.0                                                                  -0.3        2,000                                                                              -200
           1Q13
           2Q13
           3Q13
           4Q13
           1Q14
           2Q14
           3Q14
           4Q14
           1Q15
           2Q15
           3Q15
           4Q15
           1Q16
           2Q16
           3Q16
           4Q16
           1Q17
           2Q17
           3Q17
           4Q17
           1Q18
           2Q18
           3Q18
           4Q18

                                                                                              1Q10

                                                                                                     1Q11

                                                                                                            1Q12

                                                                                                                   1Q13

                                                                                                                            1Q14

                                                                                                                                   1Q15

                                                                                                                                          1Q16

                                                                                                                                                 1Q17

                                                                                                                                                            1Q18
  Krungsri Research’s view
       Thailand’s GDP growth accelerated to 4.1% in 2018 (vs revised-up 4% growth for 2017) after growth recovered to 3.7% YoY in 4Q18 (close to 3.8%
        potential) from 3.2% in 3Q18. This was in line with median consensus estimate (3.6%) but fell short of our expectation (4.0%). Sequential growth
        bounced back to positive (+0.82% QoQ sa vs -0.32% in 3Q18). Output gap remained positive for the fourth consecutive quarter.
       Despite the sharp slowdown in auto sales (from +19.8% YoY to +8.5%), private consumption growth rose to +5.3% from +5.2% YoY, the strongest since
        1Q13. Food consumption was robust: Food & Non-alcoholic Beverage (+2.4% YoY from +1.3%), Alcoholic Beverage & Tobacco (+4.5% YoY from -11.6%).
        Gross fixed investment growth accelerated to +4.2% YoY from +3.9%, reflecting stronger growth of private investment (+5.5% YoY, strongest since
        4Q14). However, public spending was disappointing: investment growth was flat YoY while government consumption continued to ease. Net exports
        exerted a smaller drag on GDP: -3.4ppt (unadjusted) vs -8.4ppt previously, with both goods and services contributing to the improvement.
       Sectors which outperformed were Wholesale & Retail Trade, Hotels & Restaurants, and Transport & Communication. Manufacturing sector was also
        impressive despite still-weak exports as growth exceeded post-crisis average of +2.9% YoY. Growth of agricultural output was sluggish. The Financial
        Services sector weakened further as growth dropped to the slowest since 1Q11. The NESDC said this reflected slower earnings of specialized financial
        institutions. But, we think it was largely due to structural headwinds offsetting cyclical improvements led by recovering GDP growth. Hence, the financial
        sector now finds itself facing a new normal – average annual growth had tumbled from over 8% in 2010-2017 to around 3% in 2018.

Source: NESDC, Krungsri Research

                                                                                                                                                        Krungsri Research    17
Strong domestic demand offset export headwinds; non-
financial services sectors were strong
        High growth                                        GDP growth by expenditure (% YoY)
        Modest/Moderate growth                                                                                                                            16.1
                                                                         2Q18         3Q18       4Q18                                              12.8
        Contraction
                                                                                        9.5                  10.3                     9.9                        10.1
                                                                                                                                7.9
             5.2 5.3                                       5.5     4.9                                                                      4.5
      4.1                                      3.1   3.8                  4.2
                             2.3   1.9 1.4
                                                                                                       0.8

                                                                                -0.1            -0.5                   -0.2
                                                                                                                  -2.2
        Private               Government          Private              Public                Exports of        Exports of          Imports of        Imports of
      Consumption             Consumption       Investment          Investment                 Goods            Services             Goods            Services

                                                                 Supply-side GDP data (% YoY)
     10.0
                                                                                                                            2Q18      3Q18        4Q18
                                                                                        8.8
                                                                   7.3    7.3   7.5
                                                                                                             6.5          6.1
                                                                                                       5.3          5.3
                                                     4.5                                                                        4.6                       4.2
                                                                                                4.1                                                              3.6
                             3.2         3.3               3.4                                                                        3.1          3.2
             2.7
                    1.4            1.6         1.9                                                                                          1.8

       Agriculture           Manufacturing     Construction         Wholesale &            Hotel &            Transport &          Financial         Real estate
                                                                    Retail trade         Restaurants         Communication      Intermediation

Source: NESDC, Krungsri Research

                                                                                                                                                   Krungsri Research    18
Private spending remained resilient in January; output of
domestic demand-oriented industries continued to rise
Private consumption growth picked up to +3.3% YoY in January (vs +2.6% YoY in December). Spending on durable goods and services recovered
strongly, while purchases of semi-durable and non-durable goods were stable. Private investment growth rose to +2.1% YoY, reversing from -0.5% in
December, led by broad-based rebound in sub-component indices. The Manufacturing Production Index was subdued at +0.2% YoY, but domestic
demand-oriented industries remained robust: Automotive (+8.9% YoY), Electrical Appliances (+7.6%), Food & Beverages (+1.5%).

 % YoY                              Private spending indicators                                                                     Private spending indicators                       2018                                 2019
                                                                                                                                             (% YoY) *                   J    F M A M J J               A   S      O N D     J
  8.0                     Consumption                          Investment                                                       Private consumption
  6.0                                                                                                                            Non-durables
                                                                                                                                 Semi-durables
  4.0                                                                                                                            Durables
  2.0                                                                                                                            Services
                                                                                                                                 Non-residents expenditure
  0.0                                                                                                                           Private investment
                                                                                                                                 Construction area permitted
 -2.0
                                                                                                                                 Construction material sales
 -4.0                                                                                                                            Imports of capital goods
        Jan-16

                           Jul-16

                                             Jan-17

                                                               Jul-17

                                                                                  Jan-18

                                                                                                    Jul-18

                                                                                                                       Jan-19
                 Apr-16

                                    Oct-16

                                                      Apr-17

                                                                        Oct-17

                                                                                           Apr-18

                                                                                                             Oct-18
                                                                                                                                 Machinery sales
                                                                                                                                 Newly registered vehicles
                                                                                                                                * Green > 0%, Red < 0% / Darker green (red) indicates stronger (weaker) momentum

 % sa                     Manufacturing production indicators                                                         % YoY      Manufacturing Production Weight                         2018                              2019
                                                                                                                                           (% YoY) *             J               F M A M J J A S O N D                       J
  72                Capacity utilization (LHS)                                   Industrial production                  8.0
                                                                                                                                All industry              100.0%
  70                                                                                                                    6.0     Food & Beverages          19.9%
  68                                                                                                                            Automotive                13.9%
                                                                                                                        4.0     Petroleum                  9.6%
  66                                                                                                                            Chemicals                  9.2%
                                                                                                                        2.0
  64                                                                                                                            Rubbers & Plastics         8.9%
                                                                                                                        0.0     Cement & Construction      5.5%
  62
                                                                                                                                IC & Semiconductors        5.5%
  60                                                                                                                    -2.0    Electrical Appliances      3.8%
         Jan-17

        Dec-17
         Jan-18
        Feb-17
        Mar-17
        May-17
          Jul-17

        Feb-18
        Mar-18
        May-18
          Jul-18

        Dec-18
         Jan-19
        Jun-17
        Aug-17
        Sep-17
        Nov-17

        Jun-18
        Aug-18
        Sep-18
        Nov-18
        Apr-17

        Oct-17

        Apr-18

        Oct-18

                                                                                                                                Textiles & Apparels        3.5%
                                                                                                                                HDD                        3.4%
                                                                                                                                * Green > 0%, Red < 0% / Darker green (red) indicates stronger (weaker) momentum

Source: BOT, Office of Industrial Economics (OIE), Krungsri Research

                                                                                                                                                                                                            Krungsri Research     19
Income conditions continue to improve; prospects remain
robust buoyed by election spending
Farm income grew 4.8% YoY in January (vs +7.6% previously), taking the 12-month moving average to an 11-month high. More agricultural products
saw price increases, especially rice. Non-farm wage growth jumped to +2.4% YoY from +0.8% previously, with growth becoming increasingly broad-
based. In the near-term, given favourable household income conditions, we expect higher domestic spending leading to and after the election, e.g.
election expenditure and a temporary boost from part-time employment created by the election.

 % YoY                               Farm income (12mma)                                                      Farm income growth         Weight                  2018                                  2019
                                                                                                               (% YoY, 12mma)*                       J   F M A M J J               A    S      O N D     J
  15
                                                                                                             Rubber                        16.27%
                                                                                                             White rice                     9.97%
   10                                                                                                        Mango                          7.66%
                                                                                                             Swine                          7.27%
    5                                                                                                        Hommali                        7.03%
                                                                                                             Sugarcane                      7.03%
                                                                                                             Fowl                           6.57%
    0
                                                                                                             Glutinous rice                 6.41%
                                                                                                             Cassava                        5.40%
   -5                                                                                                        Shrimp                         3.97%
        Mar-17

          Jul-17

        Mar-18

          Jul-18
         Jan-17
        Feb-17

        May-17
        Jun-17

        Aug-17
        Sep-17

        Nov-17
        Dec-17
         Jan-18
        Feb-18

        May-18
        Jun-18

        Aug-18
        Sep-18

        Nov-18
        Dec-18
         Jan-19
        Feb-19
        Apr-17

        Oct-17

        Apr-18

        Oct-18
                                                                                                             Oil palm                       3.68%
                                                                                                             Maize                          3.02%
                                                                                                            * Green > 0%, Red < 0% / Darker green (red) indicates stronger (weaker) momentum

 % YoY                             Nonfarm wage (12mma)                                                          Average monthly wage                Share               2018          2019
 2.0                                                                                                                (% YoY, 12mma)*                            J F M A M J J A S O N D   J
                                                                                                            Wholesale & retail trade                 16.70%
  1.5                                                                                                       Manufacturing                            16.51%
                                                                                                            Accommodation & food service              7.55%
  1.0
                                                                                                            Construction                              5.55%
  0.5                                                                                                       Transportation & storage                  3.32%
                                                                                                            Financial & insurance                     1.39%
  0.0                                                                                                       Information & communication               0.56%
                                                                                                            Real estate                               0.51%
 -0.5                                                                                                       Electricity, gas, steam                   0.31%
        Mar-17

          Jul-17

          Jul-18
         Jan-17
        Feb-17

        Feb-19
        May-17
        Jun-17

        Aug-17
        Sep-17

        Sep-18
        Nov-17
        Dec-17
         Jan-18
        Feb-18
        Mar-18

        May-18
        Jun-18

        Aug-18

        Nov-18
        Dec-18
         Jan-19
        Apr-17

        Oct-17

        Apr-18

        Oct-18

                                                                                                            Water supply                              0.23%
                                                                                                            Mining & quarrying                        0.18%
                                                                                                            * Green > 0%, Red < 0% / Darker green (red) indicates stronger (weaker) momentum
Source: BOT, Office of Agricultural Economics (OAE), National Statistical Office (NSO), Krungsri Research

                                                                                                                                                                                        Krungsri Research     20
Drought concerns are excessive: possibly weak El Nino
 this year, dam water levels currently above 2016 levels
 Compared to the 2016 drought, this year’s situation is not worrying. First, the National Oceanic and Atmospheric Administration (NOAA) sees weak El
 Nino occurring this year (vs strong El Nino in 2016). Second, water levels in most major dams are currently higher than in 2016. Water levels in
 Sirindhorn might be at worrying levels, but crops in the northeast region are drought-tolerant plants. In the central region, water levels in some major
 dams are below 2016 levels, but the royal irrigation department can release water from dams in the North region (currently abundant).

                                   El Niño (Drought):                                                                           Water levels in major dams
                                Oceanic Nino Index (ONI)                                                                          (% of total capacity)
          Degree of severity of El Niño or La Niña
                                                                                                                                North                                      North East
            3.0
                                                                                                                               2016        2019                             2016        2019
            2.5                                                                                                                       62
                                                                                                                       57                                                                        58
                                                                                                                                45                      48                                            49
            2.0                                                                                                   34                               35                              39
                                                                                                                                                              26 28           30

            1.5

            1.0                                                                                                  Bhumibol        Sirikit          Kwae Noi    Ubonrat        Lampao            Sirindhorn
                                                                                                                 (13,462)       (9,510)            (939)      (2,431)        (1,980)             (1,966)
El Niño 0.5
                                                                                                                             Central & East                               West & South
Neutral 0.0                                                                                                                    2016        2019                             2016        2019
                                                                                                                                      46                           87
La Niña -0.5                                                                                                      39 36
                                                                                                                                                              70                   72            78 77
                                                                                                                                29                                            52
                                                                                                                                                   25 22
           -1.0

           -1.5
                                                                                                                  Pasak       Klong Si Yad        Kra Siew   Srinakarin      Wachira-          Ratchaprapa
           -2.0                                                                                                  Chonlasit       (420)             (299)      (17,745)       longkorn            (5,639)
                  2009 2010 2011 2012 2013 2014 2015 2016 2017 2018 2019                                           (960)                                                      (8,860)

                                                                                                          Note: I) The numbers in parentheses represent full-capacity water storage (million cubic
              Note: Index > +0.5, meaning the rain is less than normal level (El Niño);                               metre) for each dam.
                    Index < -0.5, meaning the rain is more than normal level (La Niña)                          II) Data as of March 4, 2019, compared with the same date in 2016.
Source: National Oceanic and Atmospheric Administration (NOAA), Royal Irrigation Department, Krungsri Research

                                                                                                                                                                               Krungsri Research           21
Progress in EEC projects: new city plan effective August will
increase land use in industrial and city areas
                    Draft of new city plan for EEC (Total 8 million rai)
             Zone (land use)                Former (Rai)                  New (Rai)     Change
                      City                     916,183                    1,364,451      +4.8%          Chonburi: Modern City Of The East
                   Industry                    263,561                    406,492        +4.3%
                                                                                                        Rayong: Biz City
                 Agriculture                  5,619,633                   5,211,154      -7.2%
               Conservation                    838,245                                                  Chachoengsao: Thai Way Of Life

                                                 New Cities                                                        Industrial Zone
                           Areas                                          Key Targets                       Zone                 Potential areas

           U-Tapao Airport (10-60 km                   • New city                                EECd                        Lam Cha Bung
           around)                                     • Aviation center
                                                       • EEC gateway                             EECi                        Wangjan Rayong, Sri
                                                                                                                             Racha
           Map Ta Put industrial estate                Upstream petrochemical
                                                                                                 EECa                        U-Tapao--Aviation city of
           Pattaya                                     World tourist destination
                                                                                                                             Eastern Region
           Sri Racha                                   • Transit-Oriented Development (TOD)      EECh                        Chachoensao—high
                                                       • Digital economy                                                     speed train network
           Chonburi town                               Trade & services center                                               Chonburi
                                                                                                 Industrial province
           Chachoengsao town                           New city of prime residences
                                                                                                 Industrial cluster estate   Southern Rayong
           Rayong town                                 Residential zone for business workers
                                                                                                                             (Ban-bung, Pluak Daeng,
           Wangjan Rayong                              Innovation center                                                     Ban-khai)

Source: Department of Public Works and Town Planning, Krungsri Research

                                                                                                                                              Krungsri Research   22
Thai exports start the year on a down note; we trim 2019
export growth forecast to 3.7% from 4.5%
       High growth                                                       Exports by major product (% YoY)
       Modest/Moderate growth                                                                                                                                                       27.4
                                                                                   Nov-18           Dec-18         Jan-19                                                                  19.9
       Contraction
                                                                                                                                                                9.8
                                                        5.2                                                                  4.0 3.7           4.7 4.3                4.1
                                                                                          2.8          0.3

  -0.9-1.7                         -2.0     -1.0 -3.3                                                         -1.7 -1.3                                  -0.8                -3.2
             -5.7           -9.3                                            -8.6   -5.6         -9.6                                   -5.8                                                       -7.3
                    -11.3                                       -9.5-13.5

      Total            Agricultural          Processed           Electronics       Automobile            Electrical            Plastic           Rubber         Construction           Chemical
     exports            products                foods              HDD, IC           & parts            appliances            products          products         materials             products
                         (9.7%)                (8.4%)              (15.5%)           (14.5%)              (9.9%)               (5.4%)            (4.3%)           (3.7%)                (3.1%)

                                                                       Exports by major destination (% YoY)
                                                                                                                                                     Nov-18            Dec-18           Jan-19
                                                                                                                                17.6
  11.9
                 8.3                                                                                            8.0
                                                        4.3     2.7 0.9
          0.6                                                                                                                                  0.6

                            -2.0 -5.0                                                                  -4.3                             -4.2
                                      -4.8                                                                            -7.4                                                              -5.9 -4.5
                                                                               -8.9 -7.3                                                                              -8.3      -9.8
                                                                                            -16.7                                                    -17.4 -16.0

         US                         EU15                      Japan                 China                     ASEAN5                CLMV                 Middle East                   Africa
       (11.1%)                     (9.0%)                     (9.9%)               (12.0%)                    (15.5%)              (11.6%)                 (3.4%)                      (3.0%)

Note: ( ) share in 2018
Source: Ministry of Commerce (MOC), Krungsri Research

                                                                                                                                                                               Krungsri Research         23
Imports of raw material recovered strongly, suggesting
better prospects for industrial production
      High growth
                                                        Imports by major products (% YoY)
      Modest/Moderate growth     75.3                                                                                          Nov-18      Dec-18     Jan-19
      Contraction

   14.7                   14.0          12.3                                                                                  9.5
                                               4.8        8.7                                 8.7                8.5                                8.8              4.8
                                                                     2.8       2.4                                                         4.0               3.6

                                                                                                        -1.9                        -3.1
             -8.2
        Total imports             Fuel lubricants           Capital goods*                     Raw materials**                Consumer goods              Vehicles
                                     (16.9%)                   (24.2%)                            (35.6%)                         (11.1%)                  (5.9%)

Note: ( ) share in 2018                                * Capital goods excl. aircraft, ship   ** Raw materials exclude gold

  Krungsri Research’s view
      Merchandise exports fell 5.7% YoY in January (vs -1.7% in December), the third contraction in as many months. Shipments were subdued across
       markets and products. It was dragged by (i) slowing global trade; (ii) smaller shipment of electronic products to several countries that are part of China’s
       supply chains, such as Hong Kong and Taiwan; (iii) further contraction in shipments of several products to China as its economy slows down and due to
       US-China trade dispute. However, Thai exports to the US expanded in line with demand to replace imports from China.
      Imports jumped 14% YoY in January (vs -8.2% in December), largely explained by volatile items – arms and military weapons for drills. Stripping out
       these items, imports grew only 3.7% YoY. The continued rise in imports of core capital goods (excluding aircraft and ships), consumer goods and vehicles
       reflected resilient domestic demand. Imports of vehicles & parts accelerated in line with strong domestic car sales. Imports of raw material (excluding
       gold) recovered strongly, suggesting better prospects for industrial production. Slower growth of fuel and lubricant imports reflect a gradually larger
       base and the recent drop in crude prices, rather than slowing domestic activity. Meanwhile, January trade balance registered a deficit of USD4.03bn,
       reversing from USD1.06bn surplus in December.
      We revised down 2019 export growth forecast to 3.7% from 4.5%, to reflect more visible impact of the slowing global economy and trade. Substantial
       progress in the US-China trade talks has reduced risk of trade tensions escalating. We are cautiously optimistic of the outlook for exports premised on
       the following: (i) Thai exports usually expand more than global trade; and (ii) manufacturers’ plans to relocate some production bases from China to
       Thailand due to trade war concerns.
Source: MOC, Krungsri Research

                                                                                                                                                          Krungsri Research   24
Foreign tourist arrivals continue to recover, suggesting
limited impact of air pollution crisis in Bangkok
                                       Foreign tourist arrivals                                                                      Krungsri Research’s view
4.5                                        Million (LHS)                         % YoY (RHS)                                   30
                                                                                                             3.72                       Foreign tourist arrivals rose 4.9% YoY to 3.72m in January,
4.0                                                                                                                            25        underpinned by fee-waiver for Visa-on-Arrival (VOA) for tourists
3.5                                                                                                                            20        from several countries. There was a surge in arrivals from those
3.0                                                                                                                                      countries, including Taiwan (+31% YoY), India (+24.9%) and China
                                                                                                                               15
2.5                                                                                                          4.9                         (+10.3%). Meanwhile, receipts from foreign tourists rose 2.4%
                                                                                                                               10
2.0                                                                                                                                      YoY to THB195bn in January.
                                                                                                                               5
1.5                                                                                                                                     Overall, the tourism sector is displaying more positive signs.
1.0                                                                                                                            0
                                                                                                                                         However, we will monitor the sector to determine if recovery will
0.5                                                                                                                            -5        be sustainable after the VOA measure expires at end-April. For
0.0                                                                                                                            -10       full year 2019, we expect foreign tourist arrivals to increase by
       Jan-16

                         Jul-16

                                             Jan-17

                                                               Jul-17

                                                                                  Jan-18

                                                                                                    Jul-18

                                                                                                                      Jan-19
                Apr-16

                                  Oct-16

                                                      Apr-17

                                                                        Oct-17

                                                                                           Apr-18

                                                                                                             Oct-18
                                                                                                                                         8%, close to the 7.5% growth registered in 2018.

      High growth
      Modest/Moderate growth                                                                        Foreign tourist arrivals (% YoY)
      Contraction
                                                                                                                                                                    Nov-18           Dec-18           Jan-19
                            31.8
                                    22.5                                                                                             19.9 20.2 24.9
                  10.3                                                                 8.7 11.5 9.3                                                                 12.3
                                                                                                                  5.8 3.1                                                  6.0 6.5
          2.8                                   4.3        2.6 2.3                                                        1.2                         1.8 4.0 1.2                    2.2

                                                                          -2.6                                                                                                             -4.8 -1.5 -5.5 -8.2
  -14.6                                                                                                                                                                                                          -13.7

       China                      ASEAN5                       Europe*               North Asia**                      CLMV               India         Russia           US           Australia       Middle East
      (27.5%)                     (16.3%)                      (13.8%)                 (13.5%)                        (10.5%)            (4.2%)         (3.8%)         (2.9%)          (2.1%)           (1.9%)

Note: ( ) share in 2018                           * Europe excludes Russia ** North Asia excludes China
Source: MOTS, Krungsri Research

                                                                                                                                                                                                  Krungsri Research      25
Election: Whoever wins, stimulating the economy will be
the top policy agenda
Latest polls suggest no party will win a majority, making it complicated to form a coalition government
   In the March 24 election, Pheu Thai party is expected to obtain the largest number of seats in the lower house. However, no
    single party is expected to win a majority. Third parties such as the Democrat Party, Future Forward or Bhumjaithai are important
    in forming a ruling coalition.

Major political parties are campaigning on promises to boost welfare spending
   Short-term policies: Improving the economic well-being of the people is a key policy promised by all major political parties.
    Pledges to provide more cash for children, low-income earners, farmers, and the elderly are likely to boost consumer spending, at
    least in the near-term. Historical data suggest domestic spending tend to strengthen during and after election periods.
   Long-term policies: Most political parties are focusing on restructuring the economy and infrastructure development. Welfare and
    economic policies of major political parties look similar to those of the current government, supporting policy continuity. For
    major infrastructure projects in EEC, contracts are expected to be awarded by 2Q19. There has been satisfactory progress
    recently, with the EEC new city plan scheduled to take effect in August.

Resuming democratic governance will unlock foreign investments and international negotiations
   Since the 2014 coup in Thailand, the European Union (EU) has delayed signing cooperation agreements with Thailand.
    Meanwhile, Vietnam has negotiated with several countries and reached major trade agreements, and their FDI and exports have
    outpaced Thailand’s.
   However, Thailand turning back into a democratic state will unlock more trade talks with western countries (such as FTA with the
    EU and CPTPP) and open room for more investment and inflows from other countries and mutual funds which are prohibited from
    conducting business and transactions with countries under military rule.

                                                                                                                      Krungsri Research   26
Latest polls suggest no party will win a majority, making it
difficult to form a coalition government
Latest polls show a large number of respondents are still undecided. For Prime Minister candidates, Prayut and Sudarat are neck and neck in the polls.
Most polls show Pheu Thai party will obtain the largest number of seats in the lower house. However, no single party is likely to win a majority. Third
parties such as the Democrat Party, Future Forward or Bhumjaithai are important in forming a ruling coalition.

                                  Favorite Party                                                                         Favorite PM

         Phue Thai                                  Palang Pracharath
         Democrat                                   Future Forward
         Bhumjaithai                                Others                                       Prayut        Sudarat        Abhisit    Undecided        Others

                Bangkok Poll            13     12 8 61                    62                         17        12   7                   46                     18

                  Rangsit Poll          17          22         18     7 8           28                    26             25              23               26

                     Nida Poll                 36              23      15      8 1 17                     26             24         11        12          27
                                                                                                0%                                                              100%
            Financial Time
          (Survey in urban)
                                          24          9   14    11             42

     E-san Center for
  Business and Economic                          45             7 4    21       6    17
         Research
                                   0%          20%        40%       60%        80%       100%

Source: Local Press, Financial Time, Krungsri Research

                                                                                                                                                   Krungsri Research   27
Short-term policies: Improving household income is top
policy agenda for all major political parities
                                                                                                        Short-term policies
                      Political party
                                                                           Same key policies                     Difference in focus and details
                 PALANG                                              Improving household         • Expand eligibility criteria for state welfare cards (for low-
                 PRACHARATH                                          income is an urgent policy    income earners)
                 “7:7:7 Pracharath                                   for all major parties, such • Provide basic needs and assistance for seniors, disabled,
                 welfare, society and economy”                       as…                           women, laborers, farmers, teachers, SME, students
                                                                     • Increase living allowance • 3-year debt moratorium for village fund debtors
                 DEMOCRAT                                              for low-income earners • Farmer revenue-guarantee scheme
                 “Cutting poverty,                                   • Increase child support    • Cash for low-income earners, children, elderly,
                 fostering people,                                     allowance                 • Funds for education, social enterprises, and start-ups
                 building nation”                                                                • Free education
                                                                     • Increase living allowance
                 PHEU THAI                                             for the elderly           • “Fattening people's wallets"
                 “trimming expenses,                                                             • Improve incomes of farmers, SMEs, young entrepreneurs,
                 increasing incomes, expanding                       • Increase budget for         and workers
                 opportunities”                                        universal health coverage • 3-year debt moratorium

                 FUTURE FORWARD                                                                    • State welfare covering all ages (for mother, children,
                 “Elevated and Equal                                                                 youth, and the elderly)
                 Thailand”                                                                         • Free education
                                                                                                   • Legalize underground lottery operations
                 BHUMJAITHAI                                                                       • Tackling bread-and-butter issues
                 “Empower people,                                                                  • Proposing marijuana as a new cash crop
                 reduce state power”                                                               • Legalize ride-hailing mobile applications (Grab)

Source: Political Parties’ website, Bangkok Post, Local Press, Krungsri Research

                                                                                                                                                   Krungsri Research   28
Pledges of larger cash allowances are likely to boost
consumer spending, at least in the near-term
                                                                 • Cash for children (6-8 years): THB100,000-181,000 per head
                                                                 • Total government budget: THB70-127bn per year

                                                                            Monthly allowance (THB) for…                        To improve
                                                                                                                                 universal
                                                          Children                 Low-income earners        Elderly            healthcare
                                                      (from THB600)                 (from THB200-300)    (from THB600)            scheme
        PALANG                                                                                                                        
        PRACHARATH                                           2,000                        1,000              1,000              (Not specified)

        DEMOCRAT
                                                                                                                                      
                                                             1,000                         800               1,000              (Not specified)

        PHEU THAI
                                                                                                                                   
                                                      (Not specified)                (Not specified)     (Not specified)        (Not specified)

        FUTURE
        FORWARD                                              1,200                  2,000 (for Youths)       1,800              4,000 per head

Source: Political Parties’ website, The Standard, Local Press, Krungsri Research

                                                                                                                                          Krungsri Research   29
Domestic spending tend to strengthen during and after
election periods
t-1 = 100          Private Consumption Expenditure (sa)          t-1 = 100   t-1 = 100   Government Consumption Expenditure (sa) t-1 = 100
106                                                                    106   108                                                                     108
                       2001                                                                     2001
                       2005                                                  106                2005                                                 106
104                                                                    104                      2007
                       2007
                                                                             104                2011                                                 104
                       2011
102                                                                    102   102                                                                     102

100                                                                    100   100                                                                     100
                                                                             98                                                                      98
 98                                                                    98
                                              Floods
                                                                             96                                                                      96
 96                                                                    96    94                                                                      94
         -1 quarter      Election   +1 quarter +2 quarter +3 quarter               -1 quarter     Election   +1 quarter +2 quarter +3 quarter

t-1 = 100                Private Fixed Investment (sa)           t-1 = 100   t-1 = 100            Public Fixed Investment (sa)              t-1 = 100
115                                                                    115   110                                                                     110
                       2001
                       2005                                                  105                                                                     105
110                                                                    110
                       2007
                       2011                                                  100                                                                     100
105                                                                    105
                                                                             95                                                                      95
                                                                                                  2001
100                                                                    100                        2005
                                                                             90                                                                      90
                                                                                                  2007
 95                                           Floods                   95    85                   2011
                                                                                                                                                     85

 90                                                                    90    80                                                                      80
         -1 quarter      Election   +1 quarter +2 quarter +3 quarter               -1 quarter     Election   +1 quarter +2 quarter +3 quarter
Source: NESDC, Krungsri Research

                                                                                                                                 Krungsri Research   30
Long-term policies: Most parties focus on economic
restructuring and infrastructure development
                                                                                        Medium- to long-term policies
                Political party
                                                               Same key policies                           Difference in focuses and details
                PALANG                                   Restructuring and reforms   Continuity of existing policies under current government
                                                                                     • Support SMEs, Smart farmers, StartUp, Communities, Green innovation
                PRACHARATH                               such as…                    • Infrastructure development for future, EEC scheme, high-tech investment hub
                “7:7:7 Pracharath                                                    • Education4.0, new cities (Isan4.0, Lanna4.0 zone), white cities (healthcare),
                                                         • Infrastructure               Bangkok5.0 (5G technology), decentralization
                Welfare, Society and
                                                         • Competitiveness           • Reduce hurdle, expand business opportunities
                Economy”
                DEMOCRAT                                 • Digital economy           Tax reform to tackle trade monopoly
                                                                                     • More progressive tax system, education reform, narrowing income inequality
                “Cutting Poverty,                        • Human development         • Communal land right deeds and land bank
                Fostering People,                                                    • Mega-transport projects with regional links, expand EEC projects, trade talks
                                                         • Healthcare                • Amend outdated legislation and decentralize power
                Building Nation”
                PHEU THAI                                                            Expand role of people and private companies
                                                                                     • Reduce government role, support young entrepreneurs & start-ups
                “Trimming                                                            • More balanced wealth distribution, deregulation to enhance competitiveness
                Expenses, Increasing                                                 • Review restrictions for some infrastructure projects, such as digital businesses to be
                Incomes, Expanding                                                      located anywhere (not only EEC), medical hub to be near Bangkok, enhance
                                                                                        Suvarnabhumi Airport, high-speed train project
                Opportunities”                                                       • Thailand to create own product brands, engage in more trade talks

                FUTURE                                                               End economic monopoly and reform the military
                                                                                     • Reduce government role, improve economic efficiency via 3 mechanisms: (i)
                FORWARD                                                                 decentralization of power (to provinces), (ii) improve basic infrastructure, (iii)
                “Elevated and                                                           develop agricultural tourism and targeted industries in each province
                Equal Thailand”                                                      • Reform programs: state welfare, tax reform (reduce BOI privileges, increase
                                                                                        property and land tax, increase deduction on personal income tax, education
                                                                                        reform)

                BHUMJAITHAI                                                          Eliminate hurdles, increase disposable income
                                                                                     • Buriram Model (develop tourism industry to generate income for locals)
                “Empower                                                             • Profit-sharing scheme for farmers and other industries
                people, reduce                                                       • Work-from-home schemes, digital home schools
                state power”                                                         • Local doctors for community healthcare

Source: Political Parties’ website, Bangkok Post, Local Press, Krungsri Research

                                                                                                                                                                Krungsri Research   31
Most welfare and economic policies are similar with
current government’s, reinforcing policy continuity
                                     Major existing polices of current government and political parties’ views on policy continuity

                                         WELFARE, AID MEASURES,                          CREATING PRACHARATH                        STRENGTHEN THAI ECONOMY’S
                                             DEBT-EASING                             SOCIETY (Public-private collaboration)              COMPETITIVENESS
                                            -> Welfare smartcards                            -> Restructure Agriculture                 -> Economic development zones
                                     -> Basic needs for individual groups                     -> Business development                       -> Infrastructure projects

   PALANG                          ✓ Continue with more cash in                       ✓ Alternative crops, innovation,              ✓ EEC and expand to Southern,
   PRACHARATH                        smartcards, more training                          cost reduction                                Northeastern, Lanna zones
                                   ✓ Elderly, disabled, women, laborers,              ✓ Develop community business &                ✓ Continue infrastructure projects
                                     farmers, teachers, SME, students                   tourism with facilities

   DEMOCRAT                        ✓ Smartcards with other assistance                 ✓ Guaranteed minimum for farmers’             ✓ Continue EEC project
                                                                                        crops, land bank
                                   ✓ Aids for farmers, labors, child, elderly         ✓ Develop community business &                ✓ Expand to southern region, revise
                                                                                        tourism with facilities                       high-speed rail project

   PHEU THAI                         Will not cancel immediately if                    Empower farmers to determine               ✓ Agree but will review EEC project
                                      there is no better option                          crop prices
                                     Welfare for all and 3-year debt                   Build a strong Thai brand, support         ✓ Expand areas in infrastructure
                                      moratorium                                         young entrepreneurs                          projects

   FUTURE                            Disagree with smartcard                           Increase land tax, cut deduction            Revise EEC project with plan to
   FORWARD                           Welfare for all people, including                  on personal income tax (RMF)                 reduce BOI tax incentives
                                      youths, and aid for all provinces                 Continue the regulatory guillotine          Revise infrastructure projects to
                                                                                                                                      public transport nationwide

   BHUMJAITHAI                      ✓ Smartcards with other assistance                  Work and study 4 days a week               ✓ Continue EEC project
                                    ✓ Propose marijuana as a new cash                   Buriram Model, profit-sharing              ✓ Expand areas in infrastructure
                                      crop                                               scheme                                       projects

Source: Political Parties’ website, Local Press, Krungsri Research
                                                                                ✓ Agree to continue existing policy    Not specified     Disagree with existing policy

                                                                                                                                                          Krungsri Research   32
You can also read