Health Check 2021 - Grand Valley State ...
←
→
Page content transcription
If your browser does not render page correctly, please read the page content below
KENT COUNTY         OTTAWA COUNTY         MUSKEGON COUNTY   ALLEGAN COUNTY

       Health Check
        ANALYZING TRENDS IN WEST MICHIGAN

                                                       2021

Made possible by grants from
Blue Cross Blue Shield of Michigan,
Blue Care Network, and Priority Health.
gvsu.edu/vphealth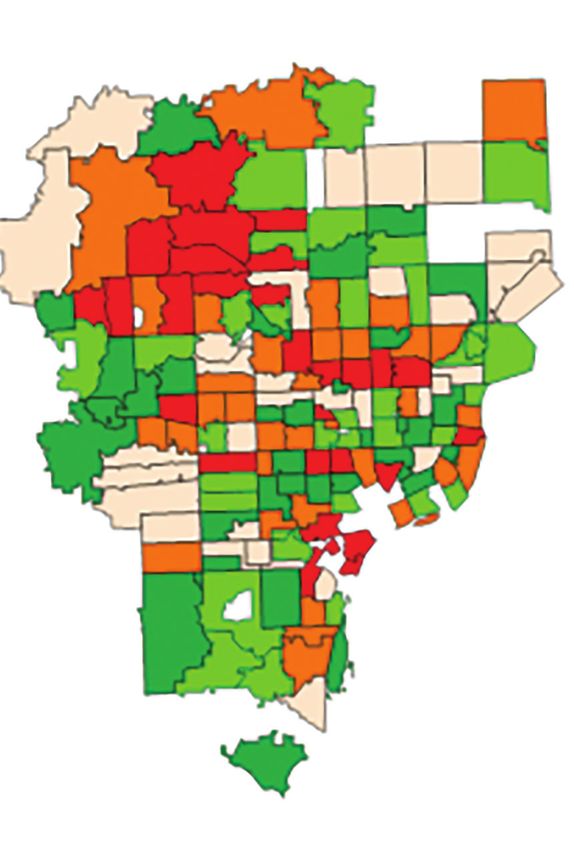
January 8, 2021

                                                                                     Dear Colleagues,

                                                                                     We are pleased to present Health Check 2021: Analyzing Trends in West Michigan. This report represents the collaborative efforts
                                                                                     of Grand Valley State University’s Office of the Vice Provost for Health, Seidman College of Business, Blue Cross Blue Shield of
                                                                                     Michigan, Blue Care Network, and Priority Health.
                          Health Check:
                                                                                     This is the 12th year of Health Check and its analysis of data relevant to health and health care in Kent, Ottawa, Muskegon, and
             Analyzing Trends in West Michigan 2021                                  Allegan (KOMA) counties. The ongoing and consistent examination of this health-related data over time continues to serve as an
   Erkmen Aslim, Ph.D., Daniel Montanera, Ph.D., and Gerry Simons, Ph.D.             important tool to inform the decision-making processes and policies of government, health care systems, education, and business,
                                                                                     especially now as we move through and beyond the COVID-19 pandemic.
           Seidman College of Business, Grand Valley State University
                                                                                     While the data in this publication is focused on primarily prepandemic data, authors have also made observations of some initial
                                                                                     impacts of COVID-19 on job growth and consumer spending related to health care. You will find more detail about these COVID
Please consult gvsu.edu/vphealth for the most current version of this publication.   influences in the report.

                                                                                     Health Check is rich in data detail and comparative analyses that can serve as a major resource for planning during the upcoming
                                                                                     year. This year’s report includes these highlights:

                                                                                     • Demographically, the proportion of the population over 65 is continuing to rise in the KOMA and comparative regions.
                                                                                     • Drug usage and overdose deaths continue to be a major problem despite the decrease in legal opioid prescriptions.
                                                                                     • Actual and comparative (with benchmarking communities) rise in emergency department visits, expenses per hospital
                                                                                       admission, and Medicare expenditures per capita have been documented in the Grand Rapids region.
                                                                                     • The percentage of individuals receiving routine health checkups has increased.

                                                                                     Economic analysis is provided through benchmarking with other peer communities. The report also utilizes average cost data
                                                                                     provided by our insurance provider partners to look more closely at the expenditures for several conditions including asthma,
                                                                                     coronary artery disease (CAD), depression, diabetes, hyperlipidemia, and low back pain and to compare KOMA to the Detroit area.

                                                                                     As we move forward in a stressed and uncertain environment due to COVID-19, we will continue to study and bring forward data
                                                                                     that will help our communities address major issues in health care. We are pleased to play a role in contributing to relevant
                                                                                     decision-making in our local and state partner organizations to ensure safe, high quality, and cost-effective health care planning
                                                                                     for our community.

                                                                                     Respectfully,

                                                                                     Jean Nagelkerk, Ph.D., FNP, FNAP
                                                                                     Vice Provost for Health
                                                                                     Grand Valley State University

                                                                                            Cook-DeVos Center for Health Sciences • 301 Michigan Street, N.E. • Grand Rapids, MI 49503-3314 • (616) 331-5500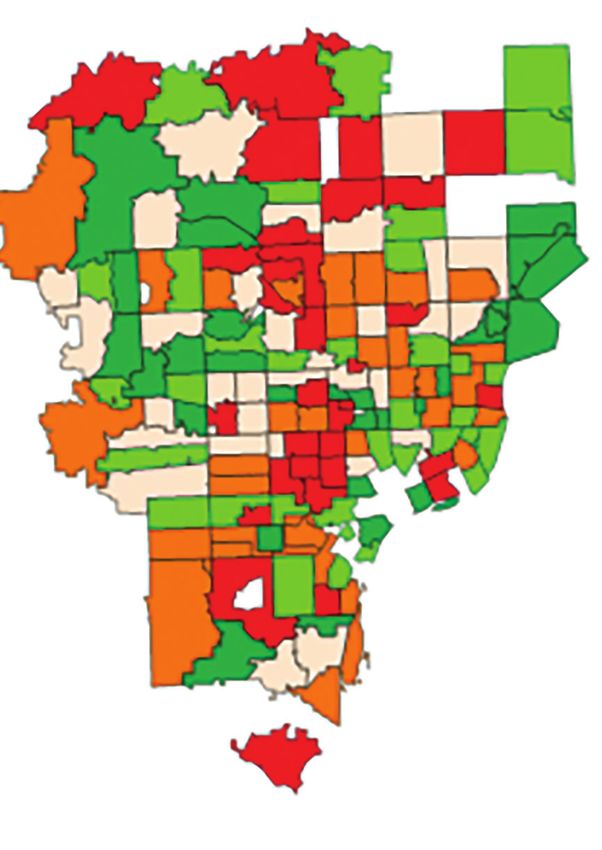
Acknowledgments
We are grateful to Jean Nagelkerk, vice provost for health, for her support and funding from Grand Valley State University. We also thank
Violet H. Barkauskas, Ph.D., M.P.H., emeritus faculty, School of Nursing, University of Michigan, for diligently proofreading several drafts of
the report and Diane Dykstra, special projects coordinator, for her support and coordination of this project. We thank Rachael Passarelli, who
helped us with the enrollment and graduation data for Grand Valley State University. and Sebastian Linde, Ph.D., Division of General Internal
Medicine, Medical College of Wisconsin, for his help and valuable input.

The publication authors especially thank Priority Health, Blue Cross Blue Shield of Michigan, and Blue Care Network for providing us the
average cost data. In particular, the following persons were invaluable for providing timely feedback and suggestions: Elizabeth McCormick,
advisor, Priority Health; Todd Osbeck, principal, Advanced Analytics, Priority Health; Heath Taylor, data engineer, Priority Health; Prapti
Singh, business intelligence analyst, Priority Health; Grisma Sinya, GVSU analytics intern at Priority Health; Ines Vigil, M.D., M.P.H., M.B.A.,
vice president, Advanced Analytics, Priority Health; Jian Yu, chief actuary officer and senior vice president, Advanced Analytics, Priority
Health; David O. Brown, director, Provider Relations West Michigan, Blue Cross Blue Shield of Michigan and Blue Care Network; Peter
Albert, manager, HCV Analytics and Insights, Blue Cross Blue Shield of Michigan and Blue Care Network; Deborah Simms, senior health care
analyst, HCV Analytics and Insights, Blue Cross Blue Shield of Michigan and Blue Care Network; and Shlynn Rhodes, administrative manager,
Blue Cross Blue Shield of Michigan.

We are deeply indebted to Carrie Thrall, marketing communications coordinator; Nancy Crittenden, marketing communications manager; and
the staff of Institutional Marketing at Grand Valley State University for their diligence, hard work, and effective response to tight deadlines.

All the data used in this project are based on primary and secondary sources. We acknowledge our data sources in each section by listing
source information; these sources are not duplicated or specifically cited in text discussions to preserve readability.

We are particularly indebted to the following organizations for use of their data:
American Hospital Association
Behavioral Risk Factor Surveillance System (BRFSS), based on CDC protocol and the Michigan BRFSS
Bureau of Labor Statistics
Center for Disease Control
Institute of Medicine of the Academies
Michigan Department of Community Health
Michigan Department of Health and Human Services
Michigan Health and Hospital Association
Michigan Labor Market Information (milmi.org as part of michigan.gov)
U.S. Census Bureau
U.S. Department of Health and Human Services (ARF file 2011-2012)
United States Patent and Trademark Office
World Intellectual Property Organization (WIPO)                                                                                                                                                         Table of Contents
Enrollment and graduation data were collected via direct contact with, or from, websites owned by these colleges and universities:                 Executive Summary............................................................................................................................2
Albion College
                                                                                                                                                   Knowledge Foundations .....................................................................................................................5
Aquinas College
Calvin University                                                                                                                                        Education and Job Growth ..........................................................................................................6
Central Michigan University
Cornerstone University                                                                                                                                   Medical Patents ........................................................................................................................24
Davenport University
Ferris State University                                                                                                                            Health Care Trends ..........................................................................................................................29
Grand Rapids Community College
Grand Valley State University                                                                                                                            Demographic Changes ..............................................................................................................30
Hope College
Kellogg Community College                                                                                                                                Health Care Overview ................................................................................................................34
Kuyper College
                                                                                                                                                         Health Care Spending During COVID-19....................................................................................46
Lansing Community College
Michigan State University
                                                                                                                                                   Economic Analysis ...........................................................................................................................49
Montcalm Community College
Muskegon Community College                                                                                                                               Benchmarking Communities .....................................................................................................50
Southwestern Michigan College
West Shore Community College                                                                                                                             Major Medical Conditions: Expenditure and Utilization Analysis .................................................58
Western Michigan University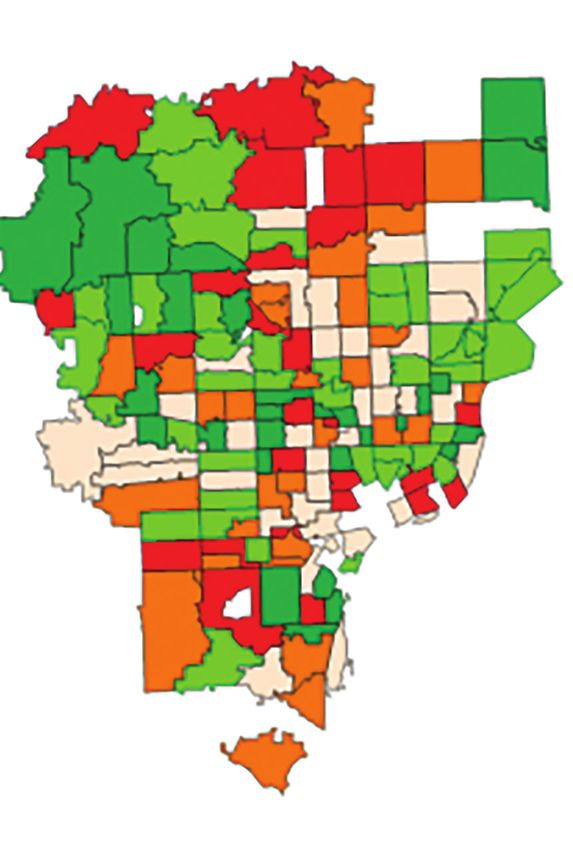
Executive Summary When examining suicide rates in the Detroit and KOMA regions, we see an increase from 1999 onward. In contrast, the rate of self-reported
mental health issues has held fairly constant from 2011 to 2018. Additionally, risk factors related to alcohol consumption, smoking, and obesity
have all remained stable. We find a lower rate of e-cigarette usage, however, when compared to cigarettes, with 2 percent of respondents
reporting smoking e-cigarettes every day, 3.9 percent reporting smoking some days, and 19.6 percent reporting being former e-cigarette smokers
Knowledge Foundations in 2018. This year, in addition to smoking measures, we also examined physician referrals to cessation resources. We find that 63.1 percent of
smokers were referred to cessation resources in Wayne county in 2018, whereas this number was 58.8 percent in Kent county.
Education and Job Growth
This year’s job growth numbers look very different than previous years due to the global outbreak of novel coronavirus (COVID-19). In the We continue to monitor access to health care with respect to individual health insurance status and utilization of routine and preventative care.
aftermath of the COVID-19 pandemic, there was a sharp decline in job growth by about 2 percent in April 2020 when compared to the 2005 Despite a slight increase in the percent of uninsured within the KOMA region from 2016 to 2017, we find that the percentage of individuals
baseline. In the following two months, however, the U.S. job growth showed positive signs of recovery, with 3.8 percent growth in June 2020. A lacking health insurance decreased from 12.3 percent in 2011 to 6.6 percent in 2018. Similarly, the share of individuals reporting they could not
similar trend was also observed in Michigan. However, the job losses due to the pandemic were much more pronounced in Michigan, where the access health care due to cost in the KOMA region rose slightly from 2016 to 2017, although measures are still lower than 2011 rates. We also
sharp negative dip in April 2020 corresponded to a 22-percent drop in job growth from the 2005 benchmark. The upshot is that the growth gap report positive trends in the number of individuals reporting having had routine checkups, from 67 percent of the KOMA population in 2011 up to
between Michigan and the entire U.S. continued to widen from a gap of 13.2 percentage points in January 2020 to 20.7 percentage points in 79 percent in 2018.
April of 2020.
Health Care Spending During COVID-19
Although we currently do not have enough information about how jobs in the health care industry were affected by the pandemic, we present We use data from Opportunity Insights to track consumer spending at a daily frequency during COVID-19. This data tracks aggregate credit card
data on job growth in 2019. Despite the substantial impact of the recession on job loss in Michigan and the slow recovery in positive job growth, and debit card spending collected by Affinity Solutions Inc. Our focus is specifically on consumer spending on health care and social assistance.
we continue to see large gains in Grand Rapids health care industry jobs. Specifically, based on data from the Bureau of Labor Statistics (BLS), Health care and social assistance spending includes, among others, expenditures on physician’s office visits; medical, diagnostic, and treatment
we expect to see the highest number of annual job openings for registered nurses, nursing assistants and aides, medical assistants, and home services; and family services. We find a 60-percent decline in health care and social spending in Michigan followed by the implementation
health and personal care aides at both the city and state levels. Different from Grand Rapids, the State of Michigan is also likely to have more of social distancing and mitigation policies such as public school closures, nonessential business closures, as well as the stay-at-home order.
job openings for dental assistants. Additionally, we compared earning gains and losses for Grand Rapids to the State of Michigan and the U.S. However, we observe a positive sign of recovery in consumer spending right after the stimulus payment on April 15.
as a whole. Since 2005, real wages for diagnostic medical sonographers, dietitians and nutritionists, EMTs and paramedics, medical assistants,
registered nurses, respiratory therapists, speech-language pathologists, and surgical technologists increased nationally, but have declined in both
Michigan and Grand Rapids. Between 2018 and 2019, we further observed real annual earnings gains above 7 percent for only optometrists in Economic Analysis
both Grand Rapids and Michigan.
Benchmarking Communities
Medical Patents Compared to a group of peer communities, we find that hospital admission rates in the Grand Rapids region are relatively low (89.24 admissions
There has been an increase in medical patent activity in West Michigan since the 1990s, along with a growing number of new innovators. Patents per 1,000 residents in Grand Rapids vs. an average of 121.82 in the peer communities). Outpatient visits to hospitals are high, however, and
with inventors residing in Kent County have increased from an annual average of 12.6 from 1990 to 1999, to 16.3 from 2000 to 2009, and to have grown significantly over the past decade. We suspect that the primary reason for the growth in outpatient visits to hospitals is related to
18.9 patents from 2010 to 2019. However, behind these averages is a concerning recent development: a significant decrease in the number provider-based billing arrangements, which represent a shift in the categorization of the care setting rather than an actual increase in the number
of medical patents since 2014, mirroring a decline seen nationally and statewide. In addition, medical patenting in the region is coming from a of visits. Emergency department (ED) visits in Grand Rapids numbered 461 per 1,000 residents in 2018, compared to a national average of 438
relatively small number of companies. Because patented medical innovations have a great potential for creating wealth and economic growth in visits per 1,000 individuals. Similarly, total hospital expenses per admission averaged $32,180 in Grand Rapids in 2018 compared to a national
West Michigan, continued R&D support is vital. average of $28,790. Unlike the previous 11 years in the study, we find Medicare expenditures in Grand Rapids rose above the national average
($10,550 per capita in Grand Rapids vs. $10,448 per capita nationally) and are also above expenditures for Medicare beneficiaries in the
Detroit region ($10,212 per capita) and in the set of peer communities ($10,064 per capita). These findings on ED visits, hospital expenses per
Health Care Trends admission, and Medicare spending show the potential for higher levels of health spending in the region moving forward.
Demographic Changes Major Medical Conditions: Expenditure and Utilization Analysis
In this year’s report, we continue to monitor trends in population demographics in West Michigan and the Detroit region (Oakland, Macomb, We used member data provided by Blue Care Network, Blue Cross Blue Shield of Michigan, and Priority Health to examine average annual
and Wayne counties) and compare changes in these trends to national averages. We continue to note a shift in population density from East expenditures and health care use for those diagnosed with at least one of the following six chronic conditions: asthma, coronary artery disease
Michigan to West Michigan, with the Detroit region demonstrating -0.08 percent growth rate in 2019, compared to 0.53 percent growth in (CAD), depression, diabetes, hyperlipidemia, and low back pain. Understanding that, from year to year, small coding changes may affect the
the Kent, Ottawa, Muskegon, and Allegan (KOMA) counties. While the 2019 growth rate in West Michigan is below the 1.25 percent growth composition of the diagnosis categories, we find that changes in expenditures between 2018 and 2019 across all conditions were mixed in KOMA
rate noted in 2013, population growth still surpasses the 2019 national average of 0.48 percent. We also continue to track the increase in counties. The largest dollar increase is for diabetes ($1,000 or 17.6 percent) and largest dollar decrease is for asthma (-$726 or -6.7 percent).
population age, with the proportion of the population over the age of 65 continuing to increase across both the KOMA and Detroit regions. In
2019, the 65 and older population made up 15.22 percent of the KOMA region population and 16.66 percent of the Detroit region population. While average annual expenditures for each of the seven studied diagnoses have historically been higher in the Detroit region than in West
Michigan, the opposite is true for CAD, hyperlipidemia, and healthy members in 2019. We find that average annual inpatient admissions,
Health Care Overview visits to emergency departments, and the average number of prescription fills tend to be greater in the Detroit region than in KOMA for the
In this year’s report, we continue to examine opioid use, drug overdose deaths, suicide deaths, self-reported mental health, as well as health risk chronic conditions studied. It is also true, however, that the percentage gaps in all three utilization categories narrowed between 2018 and
behaviors and access to health care. For the Detroit region, we see an increase in opioid prescriptions from 2006 until 2012, which peaked at 2019, with few exceptions.
103 prescriptions per 100,000 individuals. There was an annual decrease year-after-year from 2012 onward, suggesting a 38-percent decline
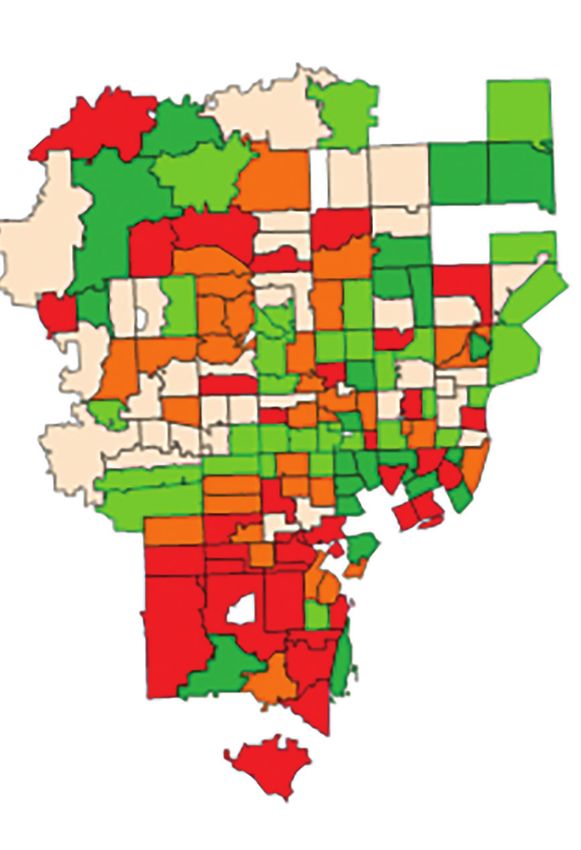
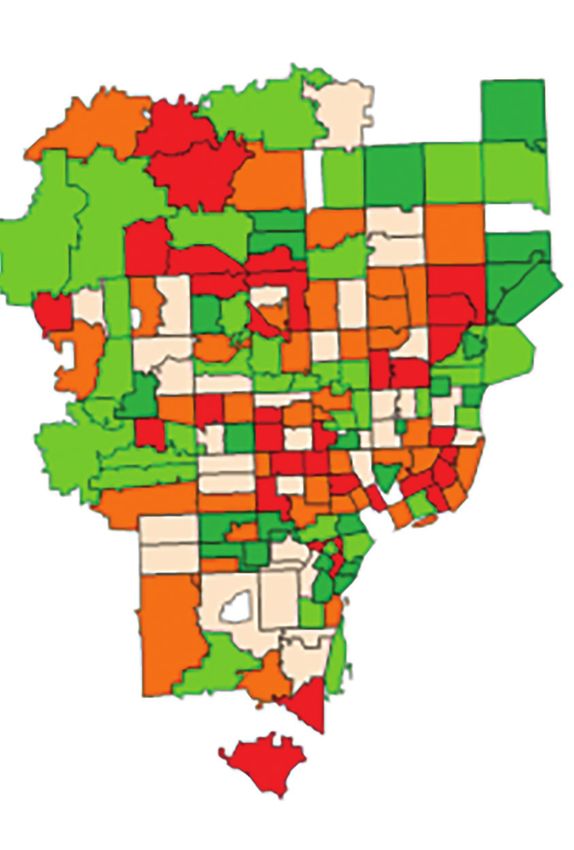
in prescriptions in 2018 relative to the 2012 baseline. However, the Detroit area has experienced an ongoing increase in the rate of overdose While the Detroit region has lagged KOMA in the adoption and utilization of telehealth, it has since caught up and now telehealth utilization is
deaths despite the drop in legal prescriptions of opioids. On a positive note, we observe a reversal in Detroit’s trend of overdose deaths in 2018, roughly the same on both sides of the state. We continue to map variations in health expenditures and utilization for select conditions at the
plummeting from 18 deaths per 100,000 in 2017 to about 15 deaths per 100,000 in 2018. While the KOMA region had a lower prescription ZIP code level. In general, there remains a greater reliance on inpatient care and prescription fills in the Detroit region than in West Michigan.
rate than the Detroit region in 2018, the number of overdose deaths in the KOMA region has increased drastically from about 4 to 15 deaths While overall use of telehealth remains low over the entire state relative to other services examined, it is clear that ZIP codes in the eastern
(per 100,000 individuals) since 1999, although in recent years it has not continued to rise at the same rate as the Detroit region. Overall, our part of the state have caught up to the western side in the adoption and utilization of telehealth services.
findings suggest that drug usage and drug overdose deaths continue to be a major public health concern in Michigan, despite the decrease in
the number of legal opioid prescriptions.
2 Grand Valley State University Health Check: Analyzing Trends in West Michigan — Executive Summary 3
Knowledge
Foundations
Education and Job Growth
                                                                                                                                                                                                Figure 2: Job Growth for Select Major Occupational Groups, 2005–2019

                                                                                                                                                                                                                                         U.S.        Michigan         Grand Rapids
We begin the discussion of trends in job growth by tracking changes                  of 2020 by an unprecedented outbreak of the novel coronavirus
in total employment for the U.S. and for the State of Michigan relative              (COVID-19) in Wuhan, China, that spread rapidly around the world                      Architecture and Engineering
to January 2005. Figure 1 plots growth in nonfarm payroll jobs from                  causing a global pandemic. The pandemic response policies such as
January 2005 through May 2020. After the 2008 recession, the focus                   business closures combined with a large negative health shock hit a
was on the dramatic decline of jobs for both Michigan and the U.S.                   record toll on the job growth rate. In April 2020, job growth declined           Business and Financial Operations
At the height of the recession, jobs had fallen by more than                         from a 14 percent annual rate in 2019 to about -2 percent in the U.S.,
2 percent nationally and by nearly 13 percent in Michigan from                       while surpassing that in Michigan. Specifically, Michigan and the
their 2005 levels. Both the State of Michigan and the U.S. began                     U.S. experienced, respectively, a decline in nonfarm payroll jobs by                  Computer and Mathematical
adding jobs in early 2010. By April 2014, job growth in the U.S.                     about 23 percent and 2 percent. Moreover, the discrepancy between
had recovered to its prerecession level (i.e. about 4.2 percent in                   the U.S. job growth and that of Michigan has begun to further
December 2007) and has continued to increase. However, Michigan                      increase from a gap of 11 percentage points in January 2018 to a gap                   Construction and Extraction
did not recover to prerecession job levels until January 2018, meaning               of 21 percentage points in April 2020. We observed positive signs of
the state has experienced only a small net gain in payroll jobs for                  recovery in May 2020, albeit a gap of 19 percentage points existed
more than a decade. The positive economic outlook in Michigan and                    between the U.S. and Michigan job growth.                                          Education, Training, and Library
the U.S. for the past two years has been disrupted in the first quarter

                                                                                                                                                                          Food Preparation and Serving
                                       Figure 1: Nonfarm Payroll Jobs Percent Change, January 2005 – May 2020

                                                                                                                                                                          Health Care Practictioners and
                                                                              U.S.          Michigan                                                                              Technical Occupations
                     15
                                                                                                                                                                                    Health Care Support
                     10

                      5                                                                                                                                            Installation, Maintenance, and Repair

                      0
    Percent Change

                                                                                                                                                                              Management Occupations
                      -5

                     -10                                                                                                                                                      Personal Care and Service

                     -15
                                                                                                                                                                                Production Occupations

                     -20
                                                                                                                                                                                      Sales and Related
                     -25
                           Jan. 2005        Mar. 2007      Nov. 2009         Jan. 2012                 July 2014      Sep. 2016          Jan. 2019 May 2020
                                                                                                                                                                    Transportation and Material Moving
Source: Bureau of Labor Statistics, www.bls.gov

                                                                                                                                                                                                           -30   -20   -10   0.0   10           20   30         40    50       60    70       80      90     100
Figure 2 provides a more detailed analysis of employment changes by                  Grand Rapids has continued to see substantial employment                                                                                                        Percent Change
examining job growth or job losses at the industry level from 2005 to                growth over the past decade in occupations categorized by health
2019. We plot data for the Grand Rapids metropolitan statistical area                care practitioners and technical occupations. Local growth in these
                                                                                                                                                                 Source: Bureau of Labor Statistics, www.bls.gov
(MSA), the State of Michigan, and the entire United States. The Grand                occupations has surpassed growth rates for the state and for the
Rapids region has experienced significant job growth (more than                      nation as a whole. In fact, employment for health care practitioners
50 percent) over this period in nine occupational categories: architecture           and technical occupations in Grand Rapids grew at nearly four times
and engineering (99 percent), health care support (89 percent), health               the state and triple the national rates since 2005. Employment sectors
care practitioners and technical occupations (87 percent), transportation            in the U.S. that suffered the largest job losses over this period include
and material moving (77 percent), business and financial operations                  construction and extraction and production occupations.
(71 percent), management occupations (68 percent), production
operations (67 percent), personal care and service (61 percent), and
computer and mathematical occupations (51 percent).
6        Grand Valley State University                                                                                                                                                                                                  Health Check: Analyzing Trends in West Michigan — Knowledge Foundations    7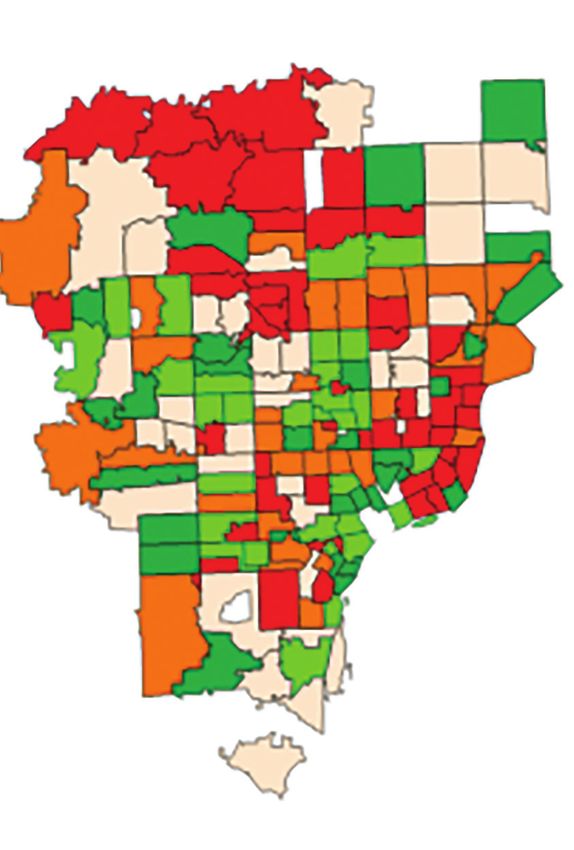
We observe a further decline in job growth for construction and          Table 6 presents employment projections for Michigan and the              Looking at more recent changes between 2018 and 2019 in Grand              Reference
extraction by about 16 percent in Michigan. Moreover, there is           Grand Rapids metro area generated by matching data on historic and        Rapids, we further note one occupation with more than 7 percent              Bransberger, P., & Michelau, M. (2016). Knocking at the College
an increasing negative growth rate within education, training, and       projected employment levels from the Bureau of Labor Statistics to        growth in real annual earnings: optometrists. The growth for                      Door - Projections of high school graduates, Dec 2016
library occupations across the state as a whole, where we observe        estimates of employment growth rates from the Michigan Department         optometrists is considerably higher in Grand Rapids than in both                  edition. Retrieved September 4, 2020 from static1.
close to a 13-percent drop since 2005. These trends may be related       of Technology, Management, and Budget. The left-hand columns in           Michigan and the U.S. at large. In the short-term, we also observe a              squarespace.com/static/57f269e19de4bb8a69b470ae/t/
to a decrease in the school-aged population, which has shown a           Table 6 display occupation-specific employment in 2019, the               substantial decline in earnings for EMTs and paramedics, as well as               58d2eb93bf629a4a3878ef3e/1490217882794/
steady decline (beyond a 13-percent drop since 2002) in Michigan,        corresponding annualized average growth rates, and projected              physician assistants.                                                             Knocking2016FINALFORWEB-revised021717.pdf.
as reported in data from the Michigan Department of Education,           employment in 2028. In the next two columns, we convert the growth
National Center for Education Statistics. Related to the decrease        rates into annual job growth numbers. Replacement rate figures in         We emphasize that any estimates presented within this section are
in the school-aged population, reports of a smaller number of high       the next two columns indicate the share of current employment that is     subject to change based on changes in the economy or changes
school graduates in Michigan may impact the number of individuals        expected to turn over through retirements or other forms of employment    in the regulatory environment in which health care providers and
seeking university-level education to continue to supply a labor force   transitions. Projected employment has two components: job growth          health systems operate. Furthermore, a decrease in the number of
for these in-demand occupations (Bransberger & Michelau, 2016).          (i.e. new positions) and replacement (i.e. existing positions that have   high school graduates, along with a notable decrease in the number
                                                                         been vacated). We combine these two components to estimate the            of education jobs in the last few years, suggests that the pool of
Given these trends in employment, we next examined whether               average annual job openings in both Michigan and in the Grand Rapids      individuals entering university programs may decrease in future
universities in the central and western parts of the state are           metro area in the last two columns of Table 6. Occupations for which      years. As such, policy and community efforts will be vital to retain the
producing students equipped with the skills required to meet the         we expect to see the highest number of annual job openings include        current skilled health care workforce, as well as encourage talented
health care sector’s continued growing labor demand. To analyze          dental assistants (130 in Grand Rapids and 1,052 for the state), home     individuals to pursue degrees leading to employment within the
this issue, we proceeded in four steps:                                  health and personal care aides (1,057 in Grand Rapids and 10,132 for      health care sector.
                                                                         the state), medical assistants (354 in Grand Rapids and 3,043 for the
    1. We observed job growth for selected health care occupations      state), licensed practical or licensed vocational nurses (152 in Grand
        since 2005.                                                      Rapids and 1,064 for the state), and nursing aides and assistants
                                                                         (1,034 in Grand Rapids and 5,883 for the state).
    2. We undertook an inventory of health services education
        programs in colleges and universities in the western and
                                                                         Finally, Table 7 presents inflation-adjusted growth in annual earnings
        central parts of the state.
                                                                         for health professions in Grand Rapids, Michigan, and the United
    3. We made specific predictions for employment demand in the        States. Once again, data for wage estimates came from the Bureau
        Grand Rapids area for several selected health professions.       of Labor Statistics, and we compared changes in these estimates
    4. We measured changes in earnings over the past decade for         for the long term (from 2005 to 2019) and the shorter term (2018
        these professions.                                               to 2019). We specifically focused on fields in which real earnings
                                                                         have increased or decreased by more than 7 percent over the 2005
                                                                         to 2019 period. In Grand Rapids, the occupations with the largest
Table 1 provides historic employment levels and growth for a
                                                                         decline in real earnings include diagnostic medical sonographers,
variety of health care occupations identified in the Bureau of Labor
                                                                         emergency medical technicians (EMTs) and paramedics,
Statistics (BLS) data for the Grand Rapids metro area and the State
                                                                         occupational therapists, respiratory therapists, speech-language
of Michigan. We report growth figures both since 2005 and since
                                                                         pathologists, and surgical technologists.
2018 to illustrate long-term as well as recent changes. In general,
Grand Rapids has experienced greater job growth in the health care
                                                                         Dental hygienists, diagnostic medical sonographers, dietitians and
sector compared to the state as a whole. Growth has been especially
                                                                         nutritionists, EMTs and paramedics, and surgical technologists all
robust in the areas of diagnostic medical sonographers, dietitians
                                                                         experienced real earnings losses beyond 7 percent for the State of
and nutritionists, registered nurses (RNs), occupational and physical
                                                                         Michigan. Occupations experiencing the largest real earnings gains
therapists, occupational and physical therapy assistants, physician
                                                                         in the Grand Rapids region from 2005 to 2019 include family and
assistants, pediatricians, surgeons, recreational therapists, and
                                                                         general practitioners, occupational therapy assistants, optometrists,
surgical technicians. Only a few occupations experienced job losses
                                                                         and physician assistants. Family and general practitioners,
in Grand Rapids since 2005; those include medical transcriptionists,
                                                                         occupational therapists, and physician assistants all saw wage growth
nuclear medicine technologists, nursing aides and assistants, and
                                                                         in excess of 7 percent for the state as a whole.
family and general practitioners. Grand Rapids also experienced
a significant decline in optometrists from 2018 to 2019. The State
                                                                         When we compared earnings changes in Grand Rapids to those
of Michigan saw significant job growth among diagnostic medical
                                                                         in Michigan or the entire U.S., we found several similarities but
sonographers, medical assistants, pharmacy technicians, physician
                                                                         also several interesting differences. For example, since 2005,
assistants, and pediatricians and job losses among audiologists,
                                                                         real wages for diagnostic medical sonographers, dietitians and
dentists, medical transcriptionists, nuclear medicine technologists,
                                                                         nutritionists, EMTs and paramedics, medical assistants, respiratory
and licensed practical or licensed vocational nurses (LPNs or LVNs).
                                                                         therapists, registered nurses, speech-language pathologists and
                                                                         surgical technologists increased nationally, but have declined in both
Tables 2 through 5 provide data on enrollment and graduation
                                                                         Michigan and Grand Rapids.
in health-related fields from several central and West Michigan
universities. These data are from a number of different programs
and, although likely incomplete, represent our best attempt at
collecting information on local educational trends.

8   Grand Valley State University                                                                                                                                                                                         Health Check: Analyzing Trends in West Michigan — Knowledge Foundations   9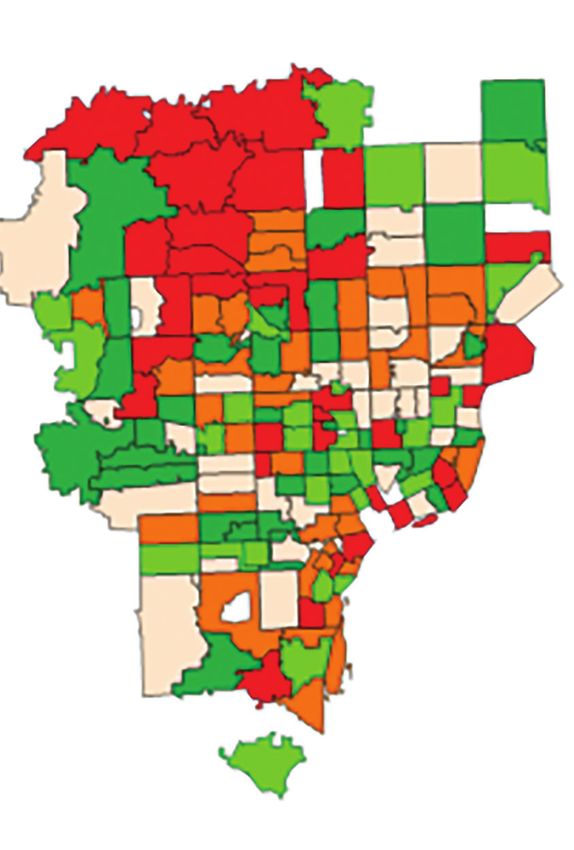
Table 1: Health Care Job Growth for Selected Occupations, 2005-2019
Grand Rapids Michigan
Employment Employment Employment Employment
Employment Employment Employment Employment Employment Employment
Growth (%) Growth (%) Growth (%) Growth (%)
(2005) (2018) (2019) (2005) (2018) (2019)
Occupation Since 2005 Since 2018 Since 2005 Since 2018
Anesthesiologists NA NA NA NA NA NA NA 990 NA NA
Audiologists NA 30 40 NA 33.3 690 450 450 -34.8 0.0
Cardiovascular Technologists/Technicians NA 400 400 NA 0.0 1,940 2,510 2,340 20.6 -6.8
Dental Assistants 860 1,060 1,000 16.3 -5.7 9,650 9,960 9,610 -0.4 -3.5
Dental Hygienists 690 1,010 1,070 55.1 5.9 7,850 9,510 9,140 16.4 -3.9
Dentists, General 350 420 380 8.6 -9.5 4,570 3,810 3,720 -18.6 -2.4
Diagnostic Medical Sonographers 130 330 360 176.9 9.1 1,510 2,670 2,660 76.2 -0.4
Dietitians and Nutritionists 140 260 280 100.0 7.7 1,410 2,010 2,040 44.7 1.5
EMT and Paramedics 450 520 NA NA NA 6,670 7,100 7,160 7.3 0.8
Home Health and Personal Care Aides NA NA 6,060 NA NA NA NA 68,860 NA NA
Medical Assistants 1,540 2,440 2,500 62.3 2.5 14,490 23,680 24,580 69.6 3.8
Medical Records/Health Info Technicians 510 630 870 70.6 38.1 4,820 6,050 8,380 73.9 38.5
Medical Transcriptionists 290 90 90 -69.0 0.0 3,080 1,810 1,450 -52.9 -19.9
Nuclear Medicine Technologists 110 70 70 -36.4 0.0 960 630 610 -36.5 -3.2
Nurse Practitioners NA 350 530 NA 51.4 NA 4,490 4,840 NA 7.8
Nurses, RN 6,310 12,550 12,820 103.2 2.2 81,370 96,680 96,900 19.1 0.2
Nurses, LPN or LVN 1,870 2,030 1,780 -4.8 -12.3 17,850 14,840 14,140 -20.8 -4.7
Nursing Aides and Assistants 4,950 7,280 7,970 61.0 9.5 48,960 49,760 51,270 4.7 3.0
Occupational Therapists 230 580 570 147.8 -1.7 3,510 4,580 4,620 31.6 0.9
Occupational Therapy Assistants 50 260 250 400.0 -3.8 890 1,140 1,230 38.2 7.9
Opticians, Dispensing 320 400 340 6.3 -15.0 3,550 3,580 3,590 1.1 0.3
Optometrists 80 260 130 62.5 -50.0 1,290 1,590 1,370 6.2 -13.8
Pharmacists 560 930 850 51.8 -8.6 8,110 9,140 8,650 6.7 -5.4
Pharmacy Technicians 700 1,370 1,260 80.0 -8.0 8,560 15,580 15,040 75.7 -3.5
Physical Therapists 330 980 980 197.0 0.0 5,170 7,970 8,060 55.9 1.1
Physical Therapist Assistants 100 560 520 420.0 -7.1 2,550 3,800 3,540 38.8 -6.8
Physician Assistants 180 610 680 277.8 11.5 2,320 4,490 4,840 108.6 7.8
Physicians, Family and General Practitioners 270 NA 180 -33.3 NA 3,030 3,320 3,270 7.9 -1.5
Physicians, Obstetricians and Gynecologists NA 130 120 NA -7.7 750 730 930 24.0 27.4
Physicians, Pediatricians 30 150 130 333.3 -13.3 370 930 1,150 210.8 23.7
Physicians, Psychiatrists NA 80 70 NA -12.5 400 630 700 75.0 11.1
Physicians, Surgeons 100 210 NA NA NA 1,640 1,320 1,670 1.8 26.5
Physicians and Surgeons, All Other 380 1,260 1,070 181.6 -15.1 10,220 16,480 15,810 54.7 -4.1
Radiologic Technologists and Technicians 380 820 850 123.7 3.7 6,020 6,710 6,750 12.1 0.6
Recreational Therapists 60 110 140 133.3 27.3 700 710 780 11.4 9.9
Respiratory Therapists 240 650 730 204.2 12.3 3,390 4,580 4,520 33.3 -1.3
Speech-language Pathologists 390 620 610 56.4 -1.6 3,340 3,950 4,300 28.7 8.9
Surgical Technologists 220 730 720 227.3 -1.4 2,610 4,240 4,240 62.5 0.0
Source: Bureau of Labor Statistics, www.bls.gov
10 Grand Valley State University Health Check: Analyzing Trends in West Michigan — Knowledge Foundations 11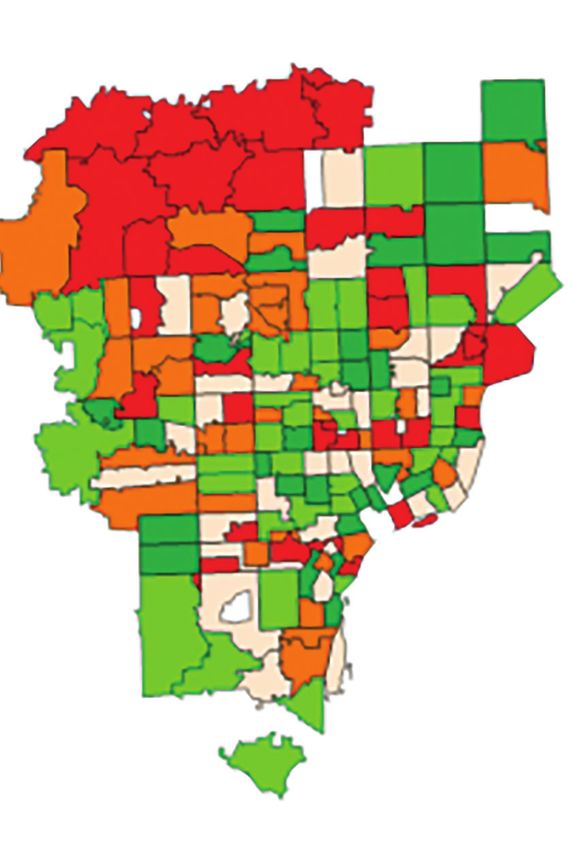
Table 2: College and University Programs — Associate’s Degree/Certificate
Grand Rapids Kellogg Lansing Montcalm Muskegon Southwestern West Shore
Color Key: Students Enrolled Over Last Three Years Davenport Ferris State TOTAL TOTAL
Community Community Community Community Community Michigan Community
Graduates Over Last Three Years University University ENROLLMENT GRADUATES
College College College College College University College
Allied Health Sciences 1,629 85 1,629 85
Biology 1,396 42 1,396 42
Chemistry 181 18 181 18
Dental Assistant/Assisting 90 46 90 46
Dental Hygiene/Hygienist 191 118 185 94 149 54 136 66 661 332
Diagnostic Medical Sonography 99 52 82 79 181 131
Dietary and Food Service Management 1 6 1 6
Electrocardiogram (ECG) Technician 4 0 4 0
Emergency Medical Services 72 16 72 16
Emergency Medical Technician 1 64 80 18 1 82 81
Fire Science 180 45 6 6 186 51
Gerontology 0* 140 11 0 11 140
Health Information Technology 283 130 105 79 59 22 447 231
Kinesiology 658 43 658 43
Magnetic Resonance Imaging (MRI) 2 12 0 12 0
Medical Assistant 3 313 179 21 22 78 26 100 5 512 232
Medical Billing 15 9 15 9
Medical Laboratory Technology 3 8 3 8
Medical Office Administration 109 26 109 26
Nursing Assistant (CNA) 7 0 36 3 43 3
Nursing 4 88 73 667 434 1,023 821 1,089 1,389 669 144 794 432 437 154 163 160 4,930 3,607
Occupational Therapy Assistant 154 58 154 58
Phlebotomy 9 0 9 0
Physical Therapist Assistant 139 68 139 68
Psychology 103 17 103 17
Radiography 5 195 117 140 60 80 55 137 116 552 348
Respiratory Care 92 61 224 59 316 120
Surgical Technology 66 63 66 63
Note: Tables do not include programs with no information readily available and programs with a value of 0 for both enrollment and graduates.
1
Combined Emergency Medical Technician (SWMU) & EMT-Basic and EMT-Paramedic (KCC)
2
The MRI program is part of the MiRIS Consortium; KCC is allotted five seats.
3
Includes Medical Administrative Assistance (KCC), Medical Assistant (Davenport & Montcalm), Medical Assistant Office and Clinical (SWMU)
4
Includes Practical Nursing (Davenport), Practical Nurse (GRCC), Nursing (LMC), Nursing LPN (Muskegon CC) and Nursing-Practical (KCC)
Nursing (RN, Practical Nursing LPN, Paramedic to RN, LPN to RN) (SWMU)
5
Includes Radiologic Technology (GRCC)
*Data as reported by the respective college or university
12 Grand Valley State University Health Check: Analyzing Trends in West Michigan — Knowledge Foundations 13
Table 3: College and University Programs — Bachelor’s Degree (Continued Next Spread)
Central Grand Michigan Western
Color Key: Students Enrolled Over Last Three Years Albion Aquinas Calvin Cornerstone Davenport Ferris State Hope Kuyper TOTAL TOTAL
Michigan Valley State State Michigan
Graduates Over Last Three Years College College University University University University College College ENROLLMENT GRADUATES
University University University University
Allied Health Sciences 436 184 2,750 778 3,186 962
Animal Science/Pre-Vet 1,708 370 1,708 370
Athletic Training 12 16 43 27 250 65 335 60 31 16 276 67 67 39 1,014 290
Biochemistry 87 23 427 106 183 60 10 5 369 60 213 30 1,289 284
Biochemistry and Molecular Biology 114 33 890 175 1,004 208
Biochemistry and Molecular Biology/Biotechnology 97 30 326 66 423 96
Biology 326 110 173 85 608 125 447 690 66 4 130 297 1,537 320 441 125 38 5 600 112 4,366 1,873
Biomedical Laboratory Science 934 200 934 200
Biomedical Sciences 3,595 720 1,863 308 5,458 1,028
Biopsychology 6 5 6 5
Biosystems Engineering 664 141 664 141
Cardiac Rehabilitation 33 0 33 0
Cell and Molecular Biology 286 53 286 53
Chemistry 42 15 23 5 146 28 87 32 298 52 728 184 176 23 1,500 339
Clinical Laboratory Sciences 53 55 53 55
Communication Disorders 574 233 574 233
Community Health 4 0 4 0
Dental Hygiene 108 44 108 44
Diagnostic Medical Sonography 555 65 555 65
Dietetics 321 117 505 170 65 76 891 363
Environmental Biology/Microbiology 62 8 62 8
Environmental Biology/Plant Biology 2 1 81 17 83 18
Exercise Science 221 71 70 33 1,821 603 63 83 3,160 782 407 131 4 0 922 240 6,668 1,943
Genomics and Molecular Genetics 657 159 657 159
Health Administration 411 170 411 170
Health Care Systems Administration 358 199 358 199
Health Communication 284 94 284 94
Health Fitness in Preventive and Rehabilitative Programs 0* 185 0 185
Health Information Management 346 66 158 65 504 131
Health Services Administration 456 137 456 137
Human Biology 4,973 1,159 4,973 1,159
Kinesiology 483 108 3,534 1,013 4,017 1,121
Medical Case Management 493 0* 493 0
Medical Laboratory Sciences 107 58 307 63 414 121
Microbiology 501 146 501 146
Molecular Diagnostics 36 22 36 22
Neuroscience 14 0 584 160 2,255 497 2,853 657
Nuclear Medicine Technology 108 73 108 73
Nursing 1 557 0* 894 189 1,902 499 1,254 661 1,327 619 544 130 1,411 612 951 397 8,840 3,107
Nutritional Sciences 600 163 600 163
Occupational Therapy 287 136 287 136
Physics 19 9 77 11 46 9 112 21 49 11 766 146 125 17 1,194 224
Physiology 1,058 231 1,058 231
Public Health 84 19 84 19
Psychology 284 87 218 72 569 144 210 112 395 105 2,918 798 883 219 3,872 1,010 823 429 10,172 2,976
Radiation Therapy 310 54 310 54
Radiologic and Imaging Sciences 11 11 11 11
Social Work 277 86 638 169 137 42 547 203 1,181 316 260 85 158 23 602 182 351 235 4,151 1,341
Sociology 87 29 53 19 107 43 148 172 25 11 253 86 278 63 273 119 238 98 1,462 640
Speech Pathology and Audiology 383 96 213 89 596 185
Therapeutic Recreation 138 31 434 116 572 147
Note: Tables do not include programs with a value of 0 for both enrollment and graduates.
1
Nursing program for Aquinas College is a partnership with Detroit Mercy and students graduate from Detroit Mercy with a B.S.N.
*Data as reported by the respective college or university
14 Grand Valley State University Health Check: Analyzing Trends in West Michigan — Knowledge Foundations 15Table 4: College and University Programs — Master’s Degree
Color Key: Students Enrolled Over Last Three Years Calvin Central Michigan Davenport Ferris State Grand Valley Michigan State Western Michigan TOTAL TOTAL
Graduates Over Last Three Years University University University University State University University University ENROLLMENT GRADUATES
Animal Science 42 14 42 14
Biochemistry and Molecular Biology 0* 1 0 1
Biology/Biological Sciences 60 128 124 29 108 45 292 202
Biomedical Laboratory Science/Operations 56 16 56 16
Biomedical Sciences 61 18 61 18
Biostatistics 106 44 33 21 139 65
Cell and Molecular Biology 112 35 112 35
Chemical Engineering 15 15 30 14 45 29
Chemistry 49 21 25 9 74 30
Communication Disorders 9 121 186 95 195 216
Comparative Medicine and Integrative Biology 43 10 43 10
Counseling Psychology 387 100 387 100
Dietetics 30 110 30 110
Epidemiology 28 18 28 18
Exercise Physiology 53 28 53 28
Health Administration 50 360 201 69 251 429
Health and Risk Communication 36 19 36 19
Integrative Pharmacology 18 5 18 5
Kinesiology 142 88 142 88
Medical and Bioinformatics 118 33 59 24 177 57
Neuroscience 13 20 1 2 14 22
Nursing 111 20 303 71 17 15 359 184 61 14 851 304
Occupational Therapy 250 77 418 164 532 280 1,200 521
Physician Assistant 231 99 419 137 231 108 881 344
Pharmacology and Toxicology 430 128 430 128
Physics 26 26 9 44 9 12 44 82
Physiology 16 5 16 5
Psychology 50 51 275 156 325 207
Public Health 282 128 289 208 571 336
Speech Language Pathology 102 92 239 121 243 90 176 88 760 391
Social Work 229 99 915 439 1,051 426 2,195 964
Sociology 1 8 26 9 27 17
Vision Rehabilitation Therapy 72 52 72 52
Note: Tables do not include programs with a value of 0 for both enrollment and graduates.
*Data as reported by the respective college or university
16 Grand Valley State University Health Check: Analyzing Trends in West Michigan — Knowledge Foundations 17Table 5: College and University Programs — Doctoral Degree
Color Key: Students Enrolled Over Last Three Years Central Michigan Ferris State Grand Valley Michigan State Western Michigan TOTAL TOTAL
Graduates Over Last Three Years University University State University University University ENROLLMENT GRADUATES
Animal Science 58 13 58 13
Audiology 148 37 70 15 218 52
Biochemistry and Molecular Biology 130 23 130 23
Biochemistry and Molecular Biology-Environmental Toxicology 4 3 4 3
Biological Sciences 82 8 82 8
Biosystems Engineering 51 16 51 16
Cell and Molecular Biology 66 21 66 21
Cell and Molecular Biology - Environmental Toxicology 3 1 3 1
Chemical Engineering 122 24 122 24
Chemistry 610 105 67 15 677 120
Communicative Sciences and Disorders 35 1 35 1
Comparative Medicine and Integrative Biology 111 22 111 22
Counseling Psychology 147 22 147 22
Epidemiology 74 11 74 11
Genetics 47 20 47 20
Genetics – Environmental Toxicology 0* 1 0 1
Health Administration 0* 47 0 47
Human Nutrition 29 11 29 11
Kinesiology 141 22 141 22
Medicine 1,217 257 6,037 564 7,254 821
Neuroscience 49 10 53 14 102 24
Nursing 286 99 258 14 544 113
Optometry 443 106 443 106
Pathobiology 3 2 3 2
Pharmacology and Toxicology 71 4 71 4
Pharmacy 1,674 422 1,674 422
Physics 504 53 67 6 571 59
Physiology 50 10 50 10
Psychology 251 39 277 55 528 94
Physical Therapy 535 175 532 175 1,067 350
Rehabilitation Counseling 48 11 48 11
Social Work 53 9 53 9
Sociology 83 21 86 9 169 30
Note: Tables do not include programs with a value of 0 for both enrollment and graduates.
*Data as reported by the respective college or university
18 Grand Valley State University Health Check: Analyzing Trends in West Michigan — Knowledge Foundations 19Table 6: Need for Selected Professions in Michigan
Michigan Grand Rapids Michigan Grand Rapids
Michigan Grand Rapids Michigan Grand Rapids Michigan Grand Rapids Average Annual Average Annual
Projected Projected Annual Annual
Employment Employment Annual Annual Annual Annual Job Openings in Job Openings in
Employment Employment Replacement Replacement
(2019)1 (2019)1 Growth Rate2 Growth Rate2 Job Growth Job Growth Michigan1 Grand Rapids1
Selected Professions (2028) (2028) Rate Rate
Dental Assistants 9,610 1,000 -0.002 0.013 9,427 1,122 -20 14 0.112 0.116 1,052 130
Dental Hygienists 9,140 1,070 -0.003 0.013 8,922 1,200 -24 14 0.067 0.064 585 83
Diagnostic Medical Sonographers 2,660 360 0.008 0.018 2,851 422 21 7 0.058 0.065 177 30
Dietitians and Nutritionists 2,040 280 0.002 0.012 2,081 311 5 3 0.062 0.062 131 21
EMT and Paramedics 7,160 NA -0.003 0.013 6,948 NA -24 NA 0.066 0.061 446 NA
Home Health and Personal Care Aides 68,860 6,060 0.021 0.034 82,724 8,218 1,540 240 0.125 0.135 10,132 1,057
Medical Assistants 24,580 2,500 0.008 0.021 26,520 3,023 216 58 0.115 0.118 3,043 354
Nurse Practitioners 4,840 530 0.015 0.028 5,537 681 77 17 0.059 0.056 362 46
Nurses, LPN or LVN 14,140 1,780 -0.001 0.011 14,040 1,971 -11 21 0.076 0.073 1,064 152
Nurses, RN 96,900 12,820 0.009 0.014 105,426 14,515 947 188 0.056 0.054 6,381 881
Nursing Aides and Assistants 51,270 7,970 0.002 0.011 52,055 8,823 87 95 0.113 0.118 5,883 1,034
Occupational Therapists 4,620 570 0.008 0.020 4,948 680 36 12 0.058 0.054 306 43
Occupational Therapy Assistants 1,230 250 0.016 0.023 1,413 306 20 6 0.114 0.147 161 43
Optometrists 1,370 130 0.001 0.013 1,385 146 2 2 0.030 0.038 43 7
Physical Therapists 8,060 980 0.009 0.022 8,738 1,193 75 24 0.044 0.044 429 67
Physician Assistants 4,840 680 0.017 0.030 5,618 884 86 23 0.064 0.065 395 67
Physicians, Family and General Practitioners 3,270 180 -0.001 0.011 3,229 198 -5 2 0.031 0.025 96 6
Respiratory Therapists 4,520 730 0.012 0.023 5,045 894 58 18 0.057 0.049 318 54
Speech-language Pathologists 4,300 610 0.017 0.012 4,993 677 77 7 0.059 0.053 329 40
Surgical Technologists 4,240 720 -0.002 0.011 4,178 792 -7 8 0.078 0.082 325 67
Note: Job growth rate and annual change are based on rounded data.
Sources:
1
Bureau of Labor Statistics, www.bls.gov
2
Michigan Bureau of Labor Market Information and Strategic Initiatives, www.milmi.org
Michigan Annual Replacement Rate = (Replacement/Employment 2018)
Grand Rapids Annual Replacement Rate = (Replacement/Employment 2016)
NA = Not Available
20 Grand Valley State University Health Check: Analyzing Trends in West Michigan — Knowledge Foundations 21Table 7: Average Annual Earnings for Select Health Care Professions
Selected Professions Percent Change in Real Annual Earnings Percent Change in Real Annual Earnings
2005 Mean Annual Earnings* 2018 Mean Annual Earnings* 2019 Mean Annual Earnings
Since 2005 Since 2018
Color Key:
Above Seven Percent Grand Grand Grand Grand Grand
Michigan U.S. Michigan U.S. Michigan U.S. Michigan U.S. Michigan U.S.
Below Negative Seven Percent (-7%) Rapids Rapids Rapids Rapids Rapids
Dental Assistants $42,348 $40,567 $39,232 $43,494 $37,813 $40,491 $44,600 $39,340 $41,170 5.32 -3.03 4.94 2.54 4.04 1.68
Dental Hygienists $67,102 $72,482 $79,354 $66,870 $65,292 $76,868 $63,180 $65,610 $77,230 -5.84 -9.48 -2.68 -5.52 0.49 0.47
Diagnostic Medical Sonographers $66,055 $68,005 $72,561 $61,097 $62,238 $75,198 $60,960 $62,990 $75,780 -7.71 -7.37 4.44 -0.22 1.21 0.77
Dietitians and Nutritionists $60,426 $61,355 $60,151 $58,572 $58,033 $62,319 $56,380 $56,070 $62,330 -6.70 -8.61 3.62 -3.74 -3.38 0.02
EMT and Paramedics $39,625 $36,549 $37,229 $37,131 $34,331 $38,444 $31,570 $33,760 $38,830 -20.33 -7.63 4.30 -14.98 -1.66 1.00
Home Health and Personal Care Aides $27,097 $25,108 $25,422 $27,387 $25,219 $25,789 $26,150 $25,660 $26,440 -3.50 2.20 4.01 -4.52 1.75 2.52
Medical Assistants $35,632 $34,585 $34,245 $34,942 $33,130 $35,166 $34,510 $33,760 $35,720 -3.15 -2.39 4.31 -1.24 1.90 1.58
Nurse Practitioners NA NA NA $100,916 $108,817 $112,024 $102,790 $108,660 $111,840 NA NA NA 1.86 -0.14 -0.16
Nurses, LPN or LVN $48,016 $49,351 $47,401 $44,309 $49,929 $47,903 $46,780 $50,300 $48,500 -2.57 1.92 2.32 5.58 0.74 1.25
Nurses, RN $68,345 $74,864 $74,459 $67,125 $72,622 $76,878 $68,220 $73,200 $77,460 -0.18 -2.22 4.03 1.63 0.80 0.76
Nursing Aides and Assistants $29,715 $30,972 $29,061 $29,281 $30,676 $30,116 $29,470 $31,220 $30,720 -0.83 0.80 5.71 0.65 1.77 2.01
Occupational Therapists $84,447 $72,299 $77,365 $72,175 $79,352 $86,897 $72,080 $78,010 $86,210 -14.64 7.90 11.43 -0.13 -1.69 -0.79
Occupational Therapy Assistants $44,167 $51,655 $52,100 $48,707 $53,360 $61,505 $51,290 $53,040 $61,880 16.13 2.68 18.77 5.30 -0.60 0.61
Optometrists $111,636 $126,166 $125,014 $124,720 $114,477 $122,154 $152,230 $125,550 $122,980 36.36 -0.49 -1.63 22.06 9.67 0.68
Physical Therapists $82,653 $86,554 $85,546 $87,192 $92,812 $90,490 $86,830 $90,500 $90,170 5.05 4.56 5.40 -0.41 -2.49 -0.35
Physician Assistants $98,113 $93,977 $93,034 $116,330 $112,238 $110,395 $107,710 $110,510 $112,410 9.78 17.59 20.83 -7.41 -1.54 1.83
Physicians, Family and General Practitioners $207,327 $182,678 $183,751 $231,907 $210,863 $215,617 $236,790 $207,330 $213,270 14.21 13.50 16.06 2.11 -1.68 -1.09
Respiratory Therapists $73,019 $60,282 $60,570 $57,514 $58,074 $63,632 $58,360 $58,870 $63,950 -20.08 -2.34 5.58 1.47 1.37 0.50
Speech-language Pathologists $106,295 $84,604 $75,925 $73,732 $79,637 $82,162 $74,340 $80,870 $82,000 -30.06 -4.41 8.00 0.82 1.55 -0.20
Surgical Technologists $46,772 $48,003 $47,021 $41,712 $44,064 $49,929 $42,140 $44,590 $50,110 -9.90 -7.11 6.57 1.03 1.19 0.36
Source: www.bls.gov/oes/tables.htm
*2005 and 2018 Mean Annual Wages are inflated to 2019 dollars.
NA = Not Available
22 Grand Valley State University Health Check: Analyzing Trends in West Michigan — Knowledge Foundations 23Medical Patents
Although the average, annual number of patents has increased over To determine if this recent change in medical patenting is specific
time as mentioned previously, Figure 1 clearly shows that there has to Kent County, we compared Figure 1 with Figure 2, which shows
been a significant decrease in patenting since 2014, with the annual the parallel data for the State of Michigan as a whole. The two
number of new patents with inventors living in Kent County falling figures have similar patterns, with generally upward trends followed
by 82.1 percent from 2014 through 2019, and the annual number by stark declines since 2014. Furthermore, rather than a regional
A patent is the property right granted to an inventor or assignee example, the inventor lives in Kent County, but the company that of new patents with assignees located in Kent County falling by aberration, the decline in medical patenting appears to be a national
for a new or improved product, process, or piece of equipment. owns the patent is in China, or the inventor lives in Germany, 86.4 percent over the same period. phenomenon, as can be seen in Table 1, which displays the
Patents are used as indicators of economic growth because of the but the assignee is a company in West Michigan. To evaluate percentage change in the annual number of new medical patents for
investment that went into creating the innovations, as well as the the economic significance of innovative activities, considering Kent County, Michigan, and the entire U.S., from 2014 through 2019.
investment opportunities that result from the innovations. inventors and assignees separately is useful.
There are drawbacks, however, to relying on patent data to Figure 1 shows the number of new medical patents granted by Figure 2: Medical Patenting in Michigan, 1990–2019
measure innovative activity. Some inventors and assignees choose the USPTO to inventors residing in Kent County and, separately,
not to register patents for their innovations because doing so patents with assignees in Kent County from the year 1990 through
will require them to divulge details to competitors. In addition, 2019. For those with inventors living in Kent County, the average
not all patents have a substantial impact on economic progress. annual number of patents increased from 12.6 in the years 1990 Inventor in Michigan Assignee in Michigan
On the whole, though, patents are seen as reflecting significant through 1999 to 16.3 in the years 2000 through 2009, with an 600
contributions to society and the economy in general. The use of additional increase to an average of 18.9 in the years 2010 through
patents is particularly relevant in the medical field due to the large 2019. For those with assignees in Kent County, the average annual
amount of spending for medical research and development (R&D). number of patents increased from 6.2 in the years 1990 through
500
1999 to 10.3 in the years 2000 through 2009 and to 10.9 patents
The database of the U.S. Patent and Trademark Office (USPTO) in the years 2010 through 2019. This growth in medical patents
indicates the name and location of both a patent’s inventor owned by entities in Kent County or invented by innovators in Kent
and its assignee (owner). In some cases, the inventor owns the County is an indicator of economic progress, as new discoveries and 400
Number of Newly Issued Patents
patent. But in corporate settings, the business itself is usually improvements can result in technological advancements. Over time,
the assignee while an individual researcher is the inventor. This such innovations could encourage greater investment and lead to
differentiation can then result in location differences, where, for additional job opportunities in the regional economy. 300
Figure 1: Medical Patenting in Kent County, 1990–2019
200
Inventor in Kent County Assignee in Kent County
100
45
40 0
1990 1991 1992 1993 19941995 1996 1997 1998 1999 2000 2001 2002 2003 2004 2005 2006 2007 2008 2009 2010 2011 2012 2013 2014 2015 2016 2017 2018 2019
35
Source: U
nited States Patent and Trademark Office, www.uspto.gov
30
Number of Newly Issued Patents
25
Table 1: Percentage Change in Newly Issued Medical Patents by Location of Inventor and Assignee, 2014–2019
20
Location of Inventor Location of Assignee
15
Kent County Michigan U.S. Kent County Michigan U.S.
10 Percent Change 2014-2019 -82.1 -95.8 -94.9 -86.4 -95.5 -95.5
Source: U
nited States Patent and Trademark Office, www.uspto.gov
5
0
1990 1991 1992 1993 19941995 1996 1997 1998 1999 2000 2001 2002 2003 2004 2005 2006 2007 2008 2009 2010 2011 2012 2013 2014 2015 2016 2017 2018 2019
Source: U
nited States Patent and Trademark Office, www.uspto.gov
24 Grand Valley State University Health Check: Medical Patents — Knowledge Foundations 25Comparing the national, state, and local patent data is revealing. countries in order to receive property rights elsewhere. One way What could cause the relatively modest volume of medical There has also been a shift in global patenting, which could explain
In 2014, 2.3 percent of all of the new medical patents with a U.S. to do this is through the World Intellectual Property Organization patenting in West Michigan in recent years? The patenting process some of the decline in medical patents in the U.S. WIPO (2019)
inventor had an inventor from Michigan. The overall number of new (WIPO). Filing an international patent application with the WIPO involves time delays between application and approval. Increases reports that the number of patent applications in the U.S. fell by
medical patents fell in the following years for both the state and the allows an inventor to then pursue patent rights in up to 193 in processing time could possibly explain the recent declines in 1.6 percent from 2017 through 2018, while the number of patent
nation as a whole, and this percentage dropped too. In 2019, countries simultaneously. approved medical patents. Data on patent wait times (“pendency”) applications in many other locations grew: by 11.6 percent in
1.9 percent of new medical patents with a U.S. inventor had an is not available for medical patents specifically, but is available for China, 7.5 percent in India, 4.7 percent at the European Patent
inventor from Michigan. However, out of the new Michigan medical The number of nonduplicate medical patent applications filed by USPTO patent applications as a whole. Office, and 5.2 percent worldwide.
patents, 7.2 percent had an inventor from Kent County in 2014, West Michigan companies at the WIPO and at the USPTO from
while in 2019 this percentage increased more than four-fold to 2015 through 2019 is shown in Figure 3. Since the year 2015, Figure 4 shows the average wait times for the first action made by Recent court cases are probably the most substantial reason for
30.4 percent. Thus, although the quantity of medical patenting has there have been 109 medical patent filings from 12 West Michigan the USPTO on patent applications and for the entire “start to finish” the decline in medical patenting. In 2012, the U.S. Supreme Court
decreased in recent years, the relative output of inventors in Kent companies. However, the majority of these filings come from only time, from fiscal years 2000 through 2019. Rather than increasing struck down medical diagnostics patents in Mayo Collaborative
County has grown. three companies, which together are responsible for approximately in recent years, the average wait time has been decreasing since Services v. Prometheus Laboratories, Inc., and in 2013, it struck
63 percent of the total number of filings. Although the most prolific 2010 through 2011, though it is possible that this pattern does not down patents on gene sequences in Association for Molecular
A patent obtained through the USPTO only gives property right companies consistently apply for medical patents over time, the hold for medical patents. Pathology v. Myriad Genetics. These rulings have likely pushed
protection in the U.S. While this protection is sufficient for some same is not true for all of the others, as 25 percent of the listed companies to keep certain medical discoveries secret rather than
inventors and assignees, others choose to apply for patents in other companies did not apply for any medical patents in 2019. One possible explanation for the recent decrease in medical patents pursue patents for them.
rests on a change in the patenting process itself and the resulting
incentive structure. The Leahy-Smith America Invents Act (AIA) of Other explanations not examined here might also contribute to the
Figure 3: Medical Patent Applications in West Michigan, KOMA Region* 2011 switched U.S. patenting from a “first-to-invent” to a “first-to- patenting changes illustrated previously. Whatever the causes, the
file” system for patent applications filed on or after March 16, 2013. recent decreases in patenting are concerning, as patented medical
The act also made changes to patenting fees and the definition of innovation has the potential to become a significant driver of
“prior art” for patent reviews. Although the AIA was intended to economic growth in West Michigan.
encourage patenting, some have argued that aspects of the law
Access Business Group International, LLC (Amway Corp.) might be particularly disadvantageous to small businesses and References
independent inventors. WIPO (2019). World Intellectual Property Indicators 2019.
BFKW, LLC Geneva: World Intellectual Property Organization.
Aspen Surgical Products, Inc.
Figure 4: USPTO Patent Wait Times*, 2000–2019
Garrison Dental Solutions
2015
Shoulder Innovations, LLC
Average First Action Pendency (months) Average Total Pendency (months)
Spectrum Health Innovations, LLC 2016
40
Ranir, LLC 2017
35
Tetra Discovery Partners, LLC
2018
30
Van Andel Research Institute
L. Perrigo Company 2019 25
Mar-Med Co.
Months
20
Swytch Design, LLC
15
0 5 10 15 20 25 30 35 40 45
10
*Kent, Ottawa, Muskegon, and Allegan counties
Sources: U
nited States Patent and Trademark Office and World Intellectual Property Organization, www.uspto.gov and www.wipo.int
5
0
2000 2001 2002 2003 2004 2005 2006 2007 2008 2009 2010 2011 2012 2013 2014 2015 2016 2017 2018 2019
*By fiscal year. First action pendency is the estimated time in months from filing to the date a first action is filed by the USPTO, as well as any time
awaiting a reply from an applicant to submit all parts of their application. Total pendency is the estimated time in months from filing to issue or
abandonment of the patent application.
Source: U nited States Patent and Trademark Office, www.uspto.gov
26 Grand Valley State University Health Check: Medical Patents — Knowledge Foundations 27You can also read