Healthy Climate, Healthy New Brunswickers - A proposal for New Brunswick that cuts pollution and protects health - Conservation ...
←
→
Page content transcription
If your browser does not render page correctly, please read the page content below

Healthy Climate, Healthy New Brunswickers
  A proposal for New Brunswick that cuts pollution and protects health

                                                Dr. Louise Comeau
                                                Daniel Nunes
Dr. Louise Comeau

Louise directs the Conservation Council of New Brunswick’s climate change and energy program. She also is a research
associate at the University of New Brunswick. Dr. Comeau conducts quantitative and qualitative research in the fields
of environmental education and communications, environmental ethics, pro-environmental behaviors (citizenship and
lifestyle), and the sociology of climate change, energy diversification, and energy literacy. She has almost 30 years’
experience in analyzing and developing climate change policy, communications, and solutions-related programming.
Louise lives in Keswick Ridge with her partner Tom where they homestead and engage with students through site visits
and teaching and research at the University of New Brunswick.

The Conservation Council of New Brunswick

Established in 1969, the Conservation Council of New Brunswick has remained the province’s leading public advocate for
environmental protection. A member of the UN’s Global 500 Roll of Honour, we work to find practical solutions to help
families and citizens, educators, governments and businesses protect the air we breathe, the water we drink, the precious
marine ecosystem and the land, including the forest, that support us.

       www.conservationcouncil.com

       Published by:
       Conservation Council of New Brunswick
       180 St. John Street
       Fredericton NB E3B 4A9
       T: (506)458-8747

       Follow us:
            @cc_nb         /conservationcouncil

Comeau, L., & Nunes, D. (2019). Healthy Climate, Healthy New Brunswickers: A proposal for New Brunswick that
cuts pollution and protects health. Retrieved from Fredericton, New Brunswick: www.conservationcouncil.ca            June 2019   Also available in French.
CONTENTS

                                              CONTENTS
                                              Executive summary                                                     3
                                              Introduction                                                          4
                                              1. Climate change                                                     5
                                              2. Climate change and health                                          8
                                              3. Climate change and health: The New Brunswick story                12
                                               Temperature                                                         14
                                               Frost-free days                                                     18
                                               Precipitation                                                       20
                                               Mental health effects                                               23
                                               Multiple challenges, multiple opportunities                         24
                                              4. Community health profiles                                         25
                                              5. Health co-benefits of climate action                              30
                                              6. Conclusions and recommendations                                   33
                                              Appendix 1: Indicators of climate change for health and well-being   38
                                              References                                                           42

1 Healthy Climate, Healthy New Brunswickers
CONTENTS

                                      FIGURES AND TABLES
                                      Table 1. Climate-related health impacts and causal pathways of relevance in Canada               10

                                      Table 2. Health equity: Populations most at risk from the health effects of a changing climate   11

                                      Table 3. Projected mean annual temperature (°C) annual, spring, winter                           14

                                      Table 4. Projected increase in the number of 30°C+ days 2021 to 2050                             15

                                      Table 5. New Brunswick Heat Alert Response System (HARS)                                         16

                                      Table 6. Projected average frost-free days 2021 – 2050                                           18

                                      Table 7. Projected increase in precipitation 2021 – 2050                                         20

                                      Table 8. Living in low-income households (%)                                                     26

                                      Table 9. Seniors living alone                                                                    27

                                      Table 10. Quality of life                                                                        28

                                      Table 11. Health co-benefits of climate action                                                   32

                                      Figure 1. The Earth’s atmosphere is like a bathtub holding too much water that can’t escape       7

                                      Figure 2. Distribution of blacklegged tick risk areas in New Brunswick in 2017                   18

2 Healthy Climate, Healthy New Brunswickers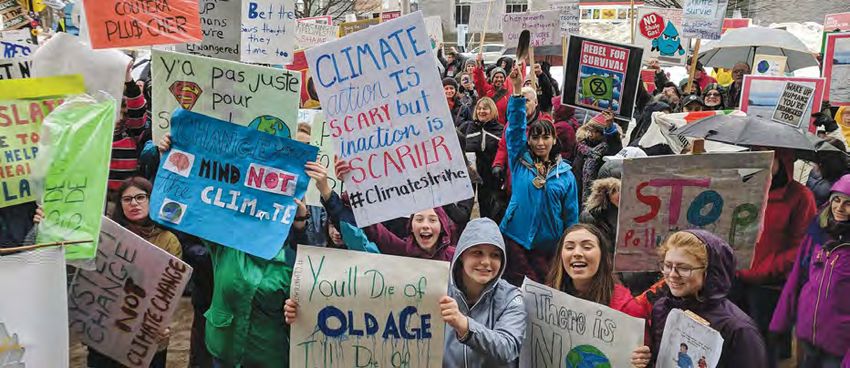
EXECUTIVE SUMMARY

      Executive summary
      This report summarizes existing research in a       lung cancer, and preterm births, according to      can undermine health promotion strategies. It
      unique way to tell a story about how climate        the Canadian Association of Physicians for the     is important that climate change mitigation,
      change can affect physical and mental health        Environment. A clean electricity system can        adaptation and emergency preparedness
      in New Brunswick. Making the link between           improve indoor air quality, and help reduce        planning consider social and physical and
      climate change and health is important              energy poverty because energy bills can be         mental health if we are to take advantage of the
      because most people do not realize that             lower in an energy-efficient home.                 co-benefits associated with climate protection.
      climate change affects the environmental
                                                          A more active lifestyle can reduce reliance on     New Brunswick needs to move quickly
      and social determinants of health and can
                                                          gasoline-powered vehicles and co-benefits can      to address climate change risks and cut
      undermine provincial strategies to improve
                                                          be improved mental health and well-being. We       greenhouse gas pollution in line with science-
      well-being. Damage from extreme weather
                                                          can increase food security by growing more         based targets to protect our health.
      events (e.g., flooding and ice storms) is already
                                                          food locally, reducing imports, all the while
      disrupting our lives, and harming our physical
                                                          cutting carbon pollution from the trucks and       We ask stakeholders interested
      and mental health.
                                                          planes used to move food products. We can
                                                                                                             in protecting New Brunswickers’
      Slowing climate change requires drastic cuts        change forestry and agriculture to increase
                                                                                                             health to encourage the provincial
      in greenhouse gas emissions (also called            conservation so plants, trees and soil absorb
      carbon pollution), mostly from phasing out          more carbon through photosynthesis. More           government to make physical and
      coal and oil to make electricity and gasoline for   green space in our communities can keep us         mental health protection and promotion
      transportation. A clean electricity system – one    cool on hot days, creates places for us to walk    a driving force behind climate change
      that relies mostly on renewable sources such        and play and improves our mental health and        mitigation and adaptation planning and
      as hydro, solar, wind, and sustainable biofuels     well-being.                                        implementation.
      – will power zero-emitting transportation,
                                                          New Brunswick Health Council community             Accelerating investments in clean electricity
      homes, buildings, and industrial processes. At
                                                          profiles show New Brunswick communities            and transportation, active transportation and
      the same time, a clean energy system also cuts
                                                          face physical and mental health challenges.        community greening can all reduce greenhouse
      air quality pollution. The co-benefits of less
                                                          Canadian Climate Atlas data suggest how            gas emissions while advancing provincial
      air pollution are lower risk of cardiovascular
                                                          climate change-induced changes can add to          objectives for well-being.
      disease, chronic and acute respiratory illnesses,
                                                          existing health challenges communities face, and

3 Healthy Climate, Healthy New Brunswickers
INTRODUCTION

     How are you feeling today? If you experienced        health effects of extreme events made worse          New Brunswickers health from a changing
     spring flooding in 2018 and 2019, you might not      by climate change. Hospital and community            climate.
     feel as good as you do when spring gardening. If     health-care workers, in turn, must accommodate
                                                          these climate change-influenced cases, whether       The good news is that solving climate
     instead of gardening, you had to deal with mould,
                                                          from flooding due to extreme rainfall and            change in an integrated and coordinated
     the loss of cherished possessions, or had to make
                                                          snowmelt, winter ice storms, increased cases of      way has many co-benefits that can make
     decisions about whether to repair your home or
                                                          Lyme disease, or respiratory illnesses. Hospital     us healthier. A clean electricity and
     move, you may feel anxious. Coping with extreme
                                                          administrators also must ensure their facilities     transportation system cuts greenhouse
     events like spring and winter flooding, ice and
                                                          operate during extreme events. Climate change        gases, as well as air quality pollution, which
     windstorms, and the power outages that go with
                                                          has the potential to undermine provincial            affects asthma and heart and lung health.
     these events, affects our physical and mental
                                                          wellness and aging, as well as strategies aimed at   Community design can increase active
     health. Acute, or extreme, events are becoming
                                                          protecting drinking water.                           living, reduce reliance on personal vehicles,
     more intense because of human-caused climate
                                                                                                               and add urban forest and gardening spaces.
     change. Rising temperatures fueling these
                                                          The goals of this report are first, to increase      More active lifestyles and healthier diets
     extreme events are also associated with chronic
                                                          awareness in New Brunswick of the links between      lower carbon pollution and help improve
     concerns like increasing exposure to ticks causing
                                                          a changing climate and our physical and mental       mental health and well-being. We can
     Lyme disease or ragweed worsening allergic
                                                          health and, second, to build stakeholder and         respond to the climate change emergency
     reactions.
                                                          government support for action to slow climate        while protecting and improving health. But
     Making the link between climate change               change and protect health. The Conservation          getting there will take work.
     and physical and mental health is important          Council of New Brunswick (CCNB) will pursue
                                                          these goals by (1) sharing this report with          The structure of this report is as follows.
     because most people do not realize that climate
                                                          our supporters, provincial stakeholders and          We first introduce climate change and its
     change affects the environmental and social
                                                          government representatives; (2) hosting a            potential health effects. We then summarize
     determinants of health and can undermine
                                                          workshop in Fredericton in June 2019; and            Canadian Climate Atlas temperature
     provincial strategies to improve well-being. A
                                                          (3) doing presentations and webinars based           and precipitation projections for 16 New
     senior woman, for example, living alone on a
                                                          on its contents. CCNB will update this report        Brunswick communities. We then review
     low income, with one or more chronic health
                                                          and our recommendations to stakeholders              New Brunswick community health profiles
     issues, and who has few social contacts is
                                                          and governments as we receive feedback and           for these same communities. We close with
     especially vulnerable to the mental and physical
                                                          learn more about opportunities to protect            conclusions and recommendations.

4 Healthy Climate, Healthy New Brunswickers
CHAPTER 1
                                                         CLIMATE CHANGE

                                        The overwhelming consensus of the world’s leading climate scientists is that human activities
                                        are raising the heat of the Earth’s surface and that there is only a one-in-a-million chance
                                        that the signal would appear in the absence of human activity. This is because greenhouse
                                        gases that humans generate primarily from burning coal, oil, natural gas and gasoline have
                                        a special talent: they form a blanket around the Earth that traps heat. As the Earth gets
                                        hotter, we go from cozy to overheating. Unfortunately, when the thicker greenhouse gas
                                        blanket makes the Earth too hot, we cannot take it off.

5 Healthy Climate, Healthy New Brunswickers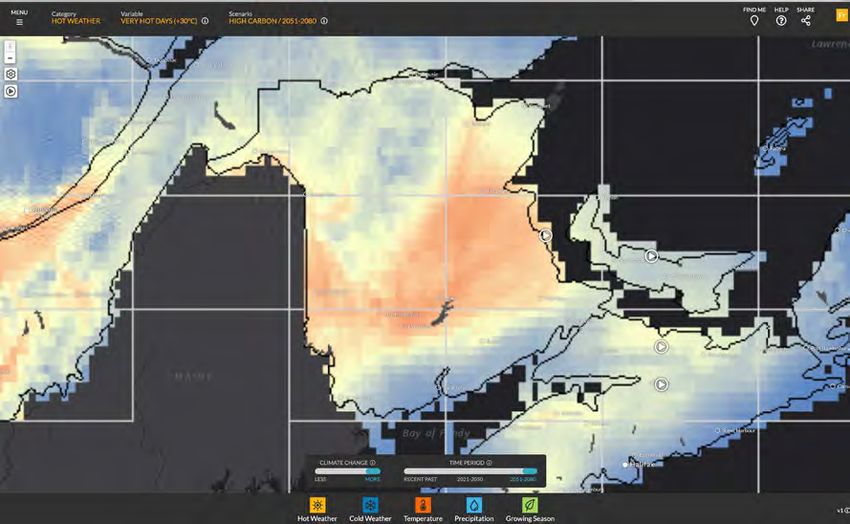
CLIMATE CHANGE

     The Government of New Brunswick reports           rain over a 24-hour period) in Fredericton and
     that temperatures in our province have            Moncton than any other decade on record.
     increased by 1.5°C relative to historical norms   Climate models project that New Brunswick
     and seasonal temperatures have increased in       will experience less frequent, but more intense,
     all parts of the province. Most of this warming   precipitation events, increasing the annual total
     has occurred since the late 1970s. The                      precipitation throughout the province.
     level of warming in our province
                                                                         The increase in annual                        We have about

                                                                                                                   10 years
     is similar to the average for
                                                                           precipitation can take the
     the rest of Canada (1.7
                                                                              form of more snow,
     degrees Celsius between
     1948 and 2016) and it is
                                                                                increasing snow depth             to get climate change
                                                                                 and adding to spring
     a rate twice that of the
                                                                                 freshet worries and
                                                                                                                      under control.
     global average.
                                                                                  flood risk. It can take
                                                                                                            A recent special report by the
     Warmer air holds more                                                       the form of more
                                                                                                            Intergovernmental Panel on Climate Change
     moisture, meaning                                                           winter rain-ice events
                                                                                                            (IPCC) says that if the world is to keep global
     there can be more rain                                                    causing winter flooding
                                                                                                            average temperature increases to 1.5 degrees
     or snow when there is                                                   and ice jams and ice-on-
                                                                                                            Celsius above pre-industrial levels that globally
     precipitation. All that heat is                                      snow cover making walking
                                                                                                            human-caused carbon dioxide emissions must
     already increasing precipitation                                  dangerous, especially for seniors.
                                                                                                            be cut by at least 45 per cent below 2010
     because 71 per cent of the Earth is
                                                          New Brunswick experienced record-breaking         levels by 2030 and we need to be at net-zero
     ocean. Scientists calculate that for every one
                                                       floods in 2018 and 2019, partly caused by an         emissions by 2050. At this level of average
     degree Celsius increase in temperature, the
                                                       above average snowpack and rain partly due to a      global warming, Canada can expect to warm by
     atmosphere can hold seven per cent more
                                                       changing climate, but also by other factors such     at least twice that rate on average and more
     water. That extra water increases the volume
                                                       as land-use, and housing development in flood        in the North. To slow warming to manageable
     of precipitation by one to two per cent per
                                                       plains. It is getting hotter, wetter, extreme, and   levels, the IPCC says that we have about 10 years
     degree of warming.
                                                       less safe because greenhouse gas levels are not      to get climate change under control if we are
     From 2000 to 2010, there were more extreme        where they need to be and we are not changing        to have a chance to minimize its worst effects.
     rainfall events (50 millimetres or more of        the way we do things.                                Why is this so?

6 Healthy Climate, Healthy New Brunswickers
CLIMATE CHANGE

                                                         Figure 1.
      Each year, natural processes absorb about
      half the greenhouse gases humans emit; the         The Earth’s atmosphere
                                                         is like a bathtub holding                             greenhouse gas emissions
      other half stays in the air, adding to the total
                                                         too much water that
      already there. Because greenhouse gases stay
                                                         can’t escape
      in the air for hundreds to thousands of years
      even if total emissions drop slightly, the total
      concentration in the air keeps growing. The
      only way to stop the total concentration of
      greenhouse gases in the air from growing is
                                                                                                   greenhouse gases in atmosphere
      to shrink global emissions to less than half of
      today’s levels, and then get to zero to bring
      the Earth’s energy system back into balance.
                                                                                                                   net removal
      Think of a bathtub with the taps fully turned
      on and water nearly overflowing. If you only        If we want to stop the bathtub from overflowing, we have to turn the taps off and pull the plug to lower the water
                                                          level. We can think of the total amount of water a tub can hold before overflowing as a water budget. The same idea
      turn the taps slightly to slow the water flow,
                                                          applies to the atmosphere. There is a total amount of greenhouse gases that the atmosphere can manage and keep
      the tub will still overflow. To stop the bathtub
                                                          temperatures safe. The global carbon budget is being used rapidly meaning we have to cut the emissions going into
      from overflowing, you have to turn the taps         the air (turning off the taps) and we have to pull the plug to suck up more carbon (increase sinks).
      off, and to get the water level down, you
      will need to pull the plug. If you think of the
      atmosphere like a bathtub, we have to lower        The bathtub is like a household budget but                     New Brunswick needs a climate action plan
      greenhouse gas pollution enough to slow or         for the atmosphere. We call it a global carbon                 with science-based emissions reduction targets,
      stop the flow (turning the taps off) and we        budget. Canada’s total contribution may look                   and actions that keep citizens safe and healthy.
      have to increase the capacity of the Earth to      small, but when every tonne counts, we have an                 Keeping New Brunswickers healthy requires
      absorb carbon, particularly through increasing     ethical duty to think about every tonne we emit,               that we understand how climate change
      green cover with forests and perennial plants      whether it is fair, and whether it is essential. The           affects health and how solutions protect
      (pulling the plug).                                next decade will decide our fate.                              health.

7 Healthy Climate, Healthy New Brunswickers
CHAPTER 2
                                                          CLIMATE CHANGE
                                                          AND HEALTH

                                          Canadians are vulnerable to higher temperatures threatening the health of very young
                                          children and older people, as well as those with health problems. Ice and windstorms are
                                          knocking out power risking our safety in winter and our food supply in summer. Forest
                                          fires are worsening air quality and floods, sea level rise and storm surges are damaging our
                                          homes and displacing families, interrupting our lives and economy.

8 Healthy Climate, Healthy New Brunswickers
CLIMATE CHANGE AND HEALTH
Climate change and health
Table 1 (page 10) summarizes some important Table 2 reproduced from the 2019 CAPE report, events in Australia. She confirms what other
health effects across Canada from a changing shows why climate change is also a social justice researchers find, that women are more likely
climate as reported recently by the Canadian issue. Inequities intersect and compound with to want to leave property during a fire (or
Association of Physicians for the Environment a changing climate. We need to consider health flood), while men want to stay and defend, and
(CAPE). Rising temperatures, extreme inequity factors such as income and social that violence against women increases after
weather events and changes in precipitation status, food security, employment and working disasters.
increase the odds of experiencing smog, forest conditions, housing and homelessness, children
Women and men also differ in post-event
fires, droughts and dust storms, heat waves, and at-risk persons, Indigenous people, health
experiences. Alston finds that after wildfires
heavy rainfall and flooding, and exposure to status and access to health services, social
in Australia, women kept busy serving
contaminated water, pollen and disease-carrying support networks, and coping capacity and
community needs (like feeding people), while
bugs such as ticks. skills. Why is this the case?
men struggled to find roles given services
The climatic changes summarized in Table 1 If you are a senior or single mother living on low provided by emergency services, factors
affect health outcomes, including cardiovascular income, in an under-insulated home with no air that can affect mental health and recovery.
disease, respiratory conditions, allergic conditioning, you are more at risk from extreme Other researchers find that in response to
reactions (especially ragweed), heat stroke and heat and extreme weather events. You might flooding women worry about household losses,
exhaustion, cancer, traumatic injuries, vector- not have a vehicle to leave home, or you may while men worry about infrastructure losses.
borne illnesses, food and water-borne illnesses, have fewer social contacts to reach out to if the These gendered psychosocial differences in
malnutrition, and mental health. Vulnerable power goes out. vulnerabilities, responses and concerns need
populations – seniors, the very young, the to factor into climate-change-adaptation
Research has shown that women are more
isolated, people living on low income – are most programs and emergency response.
vulnerable in extreme events, but also that
at risk.
women experience risk differently. Margaret
Alston studied gendered responses to extreme
9 Healthy Climate, Healthy New BrunswickersCLIMATE CHANGE AND HEALTH
Table 1. Climate-related health impacts and causal pathways of relevance in Canada
Health Outcome Hazard/Exposure Environmental Effect Climate Change Driver
Formation of air pollutants Rising temperatures
Cardiovascular disease Air pollutants Forest fires Extreme weather events
Droughts and dust storms Changes in precipitation
Rising temperatures
Extreme heat Frequency and duration of heat waves
Extreme weather events
Formation of air pollutants Rising temperatures
Respiratory conditions Air pollutants Forest fires Extreme weather events
Droughts and dust storms Changes in precipitation
Rising temperatures
Extreme heat Heat waves – hot days & warm nights
Extreme weather events
Pollen & spores Longer growing season Rising temperatures
Allergic reactions
Mould Heavy rainfall & flooding Extreme weather events
Rising temperatures
Extreme heat Frequency and duration of heat waves
Heat stroke/exhaustion Extreme weather events
Air pollutants Formation of air pollutants Rising temperatures
Cancer Ozone layer depletion Temperature-related changes
UV radiation
Longer summer season Rising temperatures
Physical trauma, dangerous travel,
Floods, forest fires, tornadoes, hurricanes, storm surges, winter Extreme weather events
Traumatic injuries drowning, violence
Rising temperatures
Expanding habitat conducive to disease vectors
Vector-borne diseases Infected mosquitoes, ticks and rodents Extreme weather events
Conditions for vector propagation
Changes in precipitation
Contaminated food/flood waters Extreme weather events
Food-borne pathogens/toxins
Food-borne illness Conditions for bacterial growth Rising temperatures
Contaminated water sources Extreme weather events
Water-borne pathogens/toxins
Water-borne illness Conditions for bacterial growth Changes in precipitation
Food insecurity Drought, crop loss, biodiversity loss Rising temperatures
Malnutrition Water shortages Floods Extreme weather events
Rising temperatures
Population displacement Floods, forest fires, hurricanes/tornadoes, droughts, heat waves
Mental health stress & Extreme weather events
Multiple stressors Prolonged and repeated climate-related events
anxiety Sea level rise
Climate-induced stress Catastrophic events
Changes in precipitation
Social disruptions Floods, forest fires, hurricanes/tornadoes, droughts, heat waves Rising temperatures
Socio-economic impacts Loss of incomes and culture Prolonged climate-related events Extreme weather events
Quality of life Catastrophic events
Source: Perrota, K. (2019). Climate Change Toolkit for Health Professionals, p. 2. Retrieved from: https://cape.ca/campaigns/climate-health-policy/climate-change-toolkit-for-health-professionals/
10 Healthy Climate, Healthy New BrunswickersCLIMATE CHANGE AND HEALTH
TA B L E 2 Health equity: Populations most at risk from the health effects of a changing climate
Health inequity Examples of climate-related inequity multipliers
Risk from extreme heat, air pollution, UV exposure and extreme weather events
Income and social status Limited financial resources/ability to take adequate protective action (e.g., seek shade, access cool spaces, afford air
conditioning, make needed repairs to housing, and avoid sources of air pollution, such as high-traffic corridors
Risk of food insecurity due to extreme weather events such as droughts, heavy rainfall and flooding that damage or destroy
Food security
food crops, leading to increased cost of healthy foods
Employment and working Exposure to extreme heat, air pollution, UB radiation and extreme weather events for outdoor workers (e.g., agriculture,
conditions forestry, landscaping/snow management, utility workers, construction, fire fighters and other first responders)
Risk from extreme heat and extreme cold for people who are homeless or living in housing with inadequate heating or cooling
Housing and homelessness Risk of damage from flooding and storms if living in home in need of major repair or living in flood-prone areas
Risk of poor indoor and outdoor air quality if living close to sources of air pollution
Sensitivity to extreme heat, air pollution
Children and persons Risk from extreme weather events due to lower mobility and higher reliance on care-givers
Risk from mental health following disasters and extreme weather events
Existing inequities (e.g., access to traditional cultural practices, access to safe water, access to health care)
Indigenous people Risk food insecurity due to general warming and lower availability/access to traditional food sources
Risk from extreme heat, air pollution, infectious diseases and extreme weather events for persons who are
Health status immunocompromised or living with chronic diseases or disabilities
Risk for northern, remote and low-income communities that currently experience inequities in terms of access to health care
Access to health services Risk from extreme weather events as health, community and social supports may be disrupted by evacuations, population
displacement and damage to critical infrastructure (e.g., hospitals, water, wastewater and transportation systems)
Persons who are marginalized or socially isolated are more vulnerable to extreme heat and extreme weather events
Social support networks
Risk from extreme weather events, extreme heat and climate variability and change
Personal behaviours & While the general population is vulnerable to climate-related stress and distress, risks are amplified for persons with existing
coping skills mental health conditions
Source: Perrota, K. (2019). Climate Change Toolkit for Health Professionals, p. 17. Retrieved from: https://cape.ca/campaigns/climate-health-policy/climate-change-toolkit-for-health-
professionals/
11 Healthy Climate, Healthy New BrunswickersCHAPTER 3
CLIMATE CHANGE & HEALTH:
THE NEW BRUNSWICK STORY
New Brunswick clearly is not immune to the health risks associated with a changing
climate. Damage from extreme weather events (e.g., flooding and ice storms) is already
disrupting our lives, harming our physical and mental health as demonstrated so clearly
in the 2018 and 2019 St. John River floods.
12 Healthy Climate, Healthy New BrunswickersCLIMATE CHANGE AND HEALTH: THE NEW BRUNSWICK STORY
Climate change and health:
The New Brunswick story
To get a clearer picture of these risks, we use
information from the Prairie Climate Centre
where Canadian researchers use average outputs
from 24 different global climate models (obtained
from the Pacific Climate Impacts Consortium) to
assess future climate based on expectations for
global emissions and atmospheric concentrations
of greenhouse gases. The Prairie Climate Centre
has used these modeling outputs, and advanced
statistical techniques, to create high-resolution
(daily, 10 x 10-km grid point usually including the
airport) versions of the data for all of Canada.
This downscaled data, available through the
Canadian Climate Atlas, can apply to the community
area similar to the boundaries used in the New
Brunswick Health Canada profiles we discuss later
in this report.
Canadian Climate Atlas map of New Brunswick, 2051-2080 projections.
The Atlas shows 2021 to 2050 (immediate-to-
medium term) projections for average temperature, cut global greenhouse gas pollution beyond Bathurst, Caraquet, Miramichi, Moncton,
hot days, growing season, and precipitation current levels. A low-emission scenario Sackville, Sussex, Oromocto, Fredericton,
for Canadian communities, including 16 New assumes action to cut global greenhouse gas Minto, Woodstock, Grand Falls, St. Stephen,
Brunswick communities. The models generate emissions are much stronger than today. and Saint John areas. Tables 3 to 5 summarize
projections based on assumptions for global the results for per cent increase in average
The Conservation Council averages results
high-and low-growth greenhouse gas emissions annual and spring and winter temperature,
for the 2021 to 2050 high-and-low emissions
scenarios. A high-emission scenario is business number of days above 30 degrees Celsius,
scenarios to show projections for the
as usual, meaning it assumes no new actions to frost-free season, and precipitation, compared
Edmundston, Campbellton, Dalhousie,
to the 1976 to 2005 mean.
13 Healthy Climate, Healthy New BrunswickersCLIMATE CHANGE AND HEALTH: THE NEW BRUNSWICK STORY
Temperature 3 Projected mean annual temperature (°C) annual, spring, winter
New Brunswick Mean annual °C Mean °C Annual °C Annual % Spring change Winter change
Temperature influences natural cycles, our
Community 1976 – 2005 2021 - 2050 Increase Increase (1976 – 2005 mean) (1976 – 2005 mean)
lifestyles and our physical and mental health.
Edmundston area 3.1 5.2 2.1 68% 3.9 (1.8) -8.7 (-11.3)
Heat waves, for example, can cause death
Campbellton area 3 5 2 67% 3.6 (1.6) -8.6 (-11.1)
in the elderly or sick as seen in recent years
in Europe, the United States and Québec. Dalhousie area 3.9 6 2.1 54% 4.2 (2.3) -7.4 (-9.9)
Researchers find increases in intimate Bathurst area 4.6 6.7 2 46% 4.6 (2.6) -6.1 (-8.6)
partner violence and criminal activity during Caraquet area 4.7 6.7 2 43% 4.2 (2.3) -5.6 (-8.1)
and right after heat waves.
Miramichi area 5 7 2 40% 5.2 (3.2) -6 (-8.4)
Table 3 summarizes the 2021 to 2050 annual Moncton 5.9 7.8 1.9 32% 5.8 (3.9) -4.3 (-6.6)
temperature projections for New Brunswick Sackville area 6 7.9 1.9 32% 7.9 (3.8) -3.5 (-5.8)
and for spring and winter. Across the
Sussex area 5.8 7.8 2 34% 6.1 (4.2) -4.4 (-6.6)
province, average temperatures in the 16
communities reviewed could rise 1.9 to 2.1 Oromocto area 6 7.9 1.9 32% 6.5 (4.6) -5 (-7.3)
degrees Celsius, with most of this warming in Fredericton 5.6 7.6 2 36% 6.2 (5.6) -5.5 (-7.8)
winter and spring. Two degrees Celsius may Minto area 5.6 7.5 1.9 34% 6 (4) -5.4 (-7.7)
not seem like much warming, but it represents
Woodstock area 4.3 6.3 2 37% 5 (3) -7.1 (-9.5)
annual temperature increases of 68 per cent
Grand Falls area 4 6.1 2.1 53% 5 (2.9) -7.9 (-10.4)
increase in Campbellton, 67 per cent in
Dalhousie, 58 per cent in Grand Falls and St. Stephen area 6.1 8 2.1 31% 6.5 (4.6) -4 (-6.1)
32 per cent in Saint John. These projected Saint John area 6 7.9 1.9 32% 6.2 (4.3) -3.2 (-5.3)
temperature increases are in addition to Source: Averaged for high-and-low-emissions scenarios by CCNB using Canadian Climate Atlas data.
warming already experienced.
Edmundston. The trend reverses in winter 21 per cent in fall. In Edmundston, summers
Seasonally, modeling projections show spring
with Edmundston temperatures increasing could be 12 per cent warmer, and fall could be
temperatures increase 44 per cent above
23 per cent from 2021 to 2050, and 40 per 39 per cent warmer, compared to the 1976 to
the 1976 to 2005 mean in Saint John for
cent in Saint John. The increase in summer 2005 mean.
the 2021 to 2050 period, and 117 per cent in
temperature in Saint John is 11 per cent and
14 Healthy Climate, Healthy New BrunswickersCLIMATE CHANGE AND HEALTH: THE NEW BRUNSWICK STORY
Spring warming, if combined with more intense
spring rainfall and projected increases in winter 4 Projected increase in the number of 30°C+ days 2021 to 2050
precipitation in northern New Brunswick (Table 4) New Brunswick Mean # 30°C days Mean # of 30°C+ days % increase from
Community 1976 - 2005 2021 - 2050 1976-2005 mean
increases the risk of extreme flooding throughout
the St. John watershed, especially when combined Edmundston area 3 9 200%
with land-use changes (e.g., agriculture, forestry, Campbellton area 4 10 150%
and urban development increasing open spaces
Dalhousie area 4 11 175%
and runoff, and poor planning allowing people to
Bathurst area 6 14 133%
develop land in flood plains). We discuss flooding
in the section on precipitation. For the remainder Caraquet area 3 9 200%
of this section, we discuss projections for hot days Miramichi area 9 20 122%
and frost-free season. Moncton 6 16 167%
Table 4 shows per cent increase in the number Sackville area 1 4 300%
of days per year above 30 degrees Celsius. New Sussex area 4 12 200%
Brunswick can normally expect a few of these kind Oromocto area 9 21 133%
of hot days every year, with Miramichi averaging
Fredericton 8 20 150%
nine days a year to a low of one in Saint John
Minto area 9 20 122%
(1976 - 2005 average). Northern communities
average three to four days a year, while Oromocto, Woodstock area 6 15 150%
Fredericton and Minto average eight to nine days Grand Falls area 5 13 160%
a year at 30 degrees Celsius or more. Sussex, St. St. Stephen area 4 11 175%
Stephen and Sackville average one to four days per
Saint John area 1 3 200%
year. Models predict increases, ranging from 122
Source: Averaged for high-and-low-emissions scenarios by CCNB using Canadian Climate Atlas data.
per cent increases in Miramichi to 300 per cent in
Sackville for 2021 to 2050.
15 Healthy Climate, Healthy New BrunswickersCLIMATE CHANGE AND HEALTH: THE NEW BRUNSWICK STORY
The province’s Heat Alert and Response System
(HARS) has three alert levels based on three 5 New Brunswick Heat Alert Response System (HARS)
factors that characterize an extreme heat event:
Level Temperature Description
intensity, duration and night. Table 5 summarizes Requirement
these levels, with Level 1 triggered when there
Humidex of 30 or greater with a Certain vulnerable persons may be affected.
is a humidex of 30 or greater with a nighttime nighttime low of 18 or greater for The main cause of illness and death during a heat
low of 18 or greater for two days or more or a
1 two days or more OR a humidex of
36 or greater for two days.
wave is the aggravation of pre-existing respiratory
and cardiovascular diseases.
humidex of 36 or greater for two days. Level 2 Everyone is at increased risk of heat stress and
2 Level 1 criteria plus either of the two heat stroke under the conditions.
triggers when Level 1 conditions are met but days reaches humidex of 40-44. People living alone without air conditioning are at
high risk especially if the heat wave lasts many days.
the humidex exceeds 40 and Level 3 triggers
Everyone is at high risk for heat related illnesses
Level 1 criteria plus either of the
at a humidex of 45 or greater. As temperatures two days reaches humidex of 45 or
and heat stroke.
warm and we experience more hot days, we can
3 greater.
People living alone without air conditioning are at
extreme risk.
expect to have more heat alerts affecting day- Source: https://www2.gnb.ca/content/gnb/en/departments/ocmoh/healthy_environments/content/heat_related_illnesses/
ResponseSystem.html
to-day life and health.
In just a few decades, Fredericton can expect New Brunswickers are not used to hot days. an air conditioner, or to live in areas surrounded
20 hot days a summer, compared to the One effect of living in a location with a cooler by cooling green space. These kind of projected
1976 to 2005 mean of eight, a 150 per cent climate than other parts of Canada is lower changes in the number of hot days increase the
increase. Bathurst will experience 14 hot use of air conditioners. About 40 per cent importance of New Brunswick’s health alert
days a year by 2021 to 2050, compared to the of provincial households use a standalone or system to manage heat risk.
1976 to 2005 mean of six days. While scientists central air conditioner, according to Statistics
expect precipitation to increase overall, this Canada, compared to almost 80 per cent in
precipitation could fall in fewer, but more Ontario and Manitoba. Seniors, people in ill
intense events, with hot days indicative of drier health, and especially if on lower incomes, may
summer conditions between events. be less able to tolerate extreme heat, to own
16 Healthy Climate, Healthy New BrunswickersCLIMATE CHANGE AND HEALTH: THE NEW BRUNSWICK STORY
HOW TO PREVENT
HEAT STRESS
Spend a few hours in a cool place or in an air-conditioned
location (mall, library, church, shaded park or at a pool). Make
Wear light-coloured, loose-fitted and ventilated arrangements to spend time or sleep in a cooler place.
clothing. A ventilated, light-coloured, wide-
brimmed hat is also recommended. Plan outdoor activities for cooler parts of the day.
Remember mosquitoes will also be active at those
times. Protect yourself with insect repellent.
Avoid exposure to the sun. If sun exposure
is unavoidable, protect yourself from
sunburn by using a sunscreen with SPF of Make arrangements to move high-risk
15 or higher and apply it at least 30 minutes people living in apartments with no air
before a sun exposure. conditioning to a cool location.
Never leave people or pets in your
Organizers of sporting events should
care inside a parked car or in direct
modify the rules to accommodate
sunlight. Temperatures can rise to
additional water breaks or consider
52ºC (125ºF) within 20 minutes in an
rescheduling outdoor activities.
enclosed vehicle when the outside
temperature is 33ºC (93ºF). Leaving
the car windows slightly open will not Keep sun out with curtains or blinds. Keep
keep the inside of the vehicle at a safe windows closed if the temperature outside
temperature. is higher than it is inside. If the temperature
outside at night drops lower than it is inside,
Drink plenty of fluids, especially water, How to prevent heat open the windows if it is safe to do so.
before feeling thirsty. Beverages that
contain alcohol are not recommended as
stress during an
Visit older family members, neighbours and friends,
they may cause the body to lose fluids and extreme heat event especially the chronically ill, to make sure they are
can interfere with the body’s ability to cool cool and hydrated. Those living in an apartment with
itself. no air conditioning are at greater risk.
Avoid using the oven
for cooking a meal.
Be aware that fans alone may not
provide enough cooling when the
temperature and humidity are high. Take cool showers or baths.
Splash cool water on your
face and back of neck.
Source: https://www2.gnb.ca/content/gnb/en/departments/ocmoh/healthy_environments/content/heat_related_illnesses/IdentifyingPreventingHeatRelatedIllnesses.html
17 Healthy Climate, Healthy New BrunswickersCLIMATE CHANGE AND HEALTH: THE NEW BRUNSWICK STORY
Frost-free days
6 Projected average frost-free days 2021 – 2050
Higher average temperatures, especially in spring New Brunswick Mean 1976-2005 Projected frost-free season # of additional Frost-free season
and winter, increase the number of frost-free days Community days per year (days) 2021 - 2050 frost-free days % increase
per year as shown in Table 6. New Brunswickers Edmundston area 125 147 22 18%
can expect 19 to 22 more frost-free days a year from
Campbellton area 115 137 22 19%
2021 to 2050, compared to the 1976 to 2005 mean.
Dalhousie area 135 158 23 17%
Warmer temperatures increase the risk of exposure
to ticks carrying Lyme disease and enhance climatic Bathurst area 146 166 20 14%
suitability for the expansion and establishment of Caraquet area 156 175 19 12%
other tick species and diseases. Miramichi area 140 161 21 15%
Moncton 146 167 21 14%
2 Distribution of blacklegged tick risk areas in
New Brunswick in 2017 Sackville area 154 175 21 13%
Sussex area 142 163 21 15%
Oromocto area 145 166 21 14%
Fredericton 141 161 20 14%
Minto area 139 159 20 14%
Woodstock area 126 147 21 17%
Grand Falls area 128 150 22 17%
St. Stephen area 150 172 22 15%
Moncton
Fredericton Saint John area 163 182 19 12%
Source: Averaged for high-and-low-emissions scenarios by CCNB using Canadian Climate Atlas data.
Saint John
Figure 2 shows the growing range for ticks to New Brunswick Public Health, which is
Blacklegged
tick risk areas in New Brunswick. Southern communities higher than the eight cases reported in 2016.
are already living with ticks and increased Provincial public education programs are active
exposure to Lyme disease. In 2017, there were relating to blacklegged ticks and Lyme disease
Retrieved from: https://www2.gnb.ca/content/gnb/en/departments/
ocmoh/cdc/content/vectorborne_andzoonotic/Tick-Borne_Diseases/ 29 confirmed cases of Lyme disease reported (such as Be Tick Smart and Lyme NB).
brief.html
18 Healthy Climate, Healthy New BrunswickersCLIMATE CHANGE AND HEALTH: THE NEW BRUNSWICK STORY
TICK BITE
PREVENTION
WHERE DO YOU FIND THEM? CHECK FOR TICKS WHAT TO DO IF YOU ARE BIT
Avoid areas where ticks live. Blacklegged Examine your clothing, outdoor gear, and Remove any attached ticks immediately.
ticks are usually found within and along the pets and remove ticks before coming Removing ticks within 24 hours after attachment
edges of wooded or forested areas, and in indoors. (tick bite) usually prevents infection. Use fine-
areas with woody shrubs and vegetation such tipped tweezers or one of the many available tick
as tall grasses. Walk in the middle of trails and Put dry outdoor clothes in a dryer on high removal devices. With tweezers grasp the tick’s
avoid contact with tall grasses, woody shrubs, heat for 10 minutes to kill any remaining head as close to the skin surface as possible.
and leaf litter. ticks. If the clothes are damp, additional Pull slowly upward with steady, even pressure.
drying time is needed. If you need to wash Do not twist or crush the tick. Wash the site of
Use insect repellents containing DEET or your clothes, hot water is recommended. If attachment with soap and water, or disinfect with
Icaradin that are effective against ticks and the clothes cannot be washed in hot water, alcohol or household antiseptic.
approved by Health Canada. Repellents may tumble dry on low heat for 90 minutes or
be applied to clothing as well as exposed skin high heat for 60 minutes. Try to save the tick that bit you in a sealed
but should not be applied to skin underneath container and record the date of the bite. If
clothing. Always read and follow label Shower or bathe within two hours after you develop symptoms bring it to your medical
directions. Learn more about using insect being outdoors to help find ticks that are appointment as it may help the doctor in their
repellents safely. crawling on you and have not attached yet. assessment of your illness. Avoid removals such
as “painting” the tick with nail polish or petroleum
Clothing treated with permethrin can repel Check your whole body and your child’s
jelly, or using heat to burn the tick.
ticks and gives protection through several body after being outdoors and remove any
washings. Do not use permethrin on skin. ticks you find. Check the scalp and neck, Watch for early symptoms of Lyme disease
in and around the ears, the back and under or other tick-borne illnesses. Early symptoms
Cover up to keep ticks off your body. Wear the arms, inside the belly button and around may include fever, aches and pains (headache,
long socks, long pants, and long-sleeved shirts. the waist, pelvic area and between the legs, fatigue, muscle pain, and/or joint pain), and rash (a
Tuck pant legs into socks or boots and tuck and behind the knees. Blacklegged ticks characteristic skin rash called erythema migrans
shirts into pants to keep ticks on the outside of are very small and difficult to see so look may occur with Lyme disease). Symptoms of
your clothing. Light-colored clothing will help carefully. Use a mirror to view all parts of Lyme disease may begin as soon as three days
you spot ticks more easily. your body. A magnifying glass can help you after a tick bite or can be as long as 30 days later.
spot ticks.
Make your yard less attractive to ticks.
See your family doctor if you develop a rash
Remove leaves, clear brush, and tall grasses
or have flu-like symptoms. Lyme disease is
around your house and the edges of lawns.
treatable with antibiotics and early treatment
Keep the grass mowed, and place playground
almost always results in full recovery.
equipment, decks, and patios away from yard
edges and trees and in a sunny location. For
more information see the Tick Management Source: https://www2.gnb.ca/content/gnb/en/departments/ocmoh/cdc/content/vectorborne_andzoonotic/Tick-Borne_
Handbook. Diseases/how_to_be_protected.html
19 Healthy Climate, Healthy New BrunswickersCLIMATE CHANGE AND HEALTH: THE NEW BRUNSWICK STORY
Precipitation
7 Projected increase in precipitation 2021 – 2050
Average precipitation rates (1976 to 2005) for our Spring mm change Winter mm change
16 communities range from a low of 991 millimetres New Brunswick Mean mm Mean mm Annual mm Annual % (1976 – 2005 (1976 – 2005
Community 1976 - 2005 2021 - 2050 Increase Increase mean) mean)
(mm) at Dalhousie to a high of 1,243 mm at Saint
Edmundston area 1021 1089 68 7% 247 (228) 257 (232)
John. Models project a six to seven per cent increase
in annual average precipitation for 2021 to 2050, Campbellton area 1070 1142 72 7% 260 (242) 277 (250)
compared to the 1976 to 2005 mean. Table 7 also Dalhousie area 991 1059 69 7% 238 (222) 257 (231)
summarizes results for spring and winter, the two Bathurst area 1026 1097 71 7% 265 (247) 285 (258)
seasons where precipitation will increase most.
Caraquet area 1028 1099 74 7% 259 (241) 292 (263)
Projected annual spring precipitation could increase Miramichi area 1052 1124 72 7% 276 (258) 293 (265)
seven to nine per cent in the immediate to medium- Moncton 1117 1188 71 6% 300 (280) 327 (300)
term, with winter precipitation increasing eight to 11
Sackville area 1131 1198 67 6% 298 (276) 329 (303)
per cent, and higher amounts expected in northern
communities. In the longer term (to 2100), in a high- Sussex area 1163 1236 73 6% 301 (281) 345 (317)
emissions scenario, annual precipitation increases Oromocto area 1103 1174 71 6% 284 (264) 314 (288)
throughout the province could double to 12 per cent Fredericton 1111 1182 71 6% 284 (265) 311 (285)
from the six to seven per cent expected by 2050.
Minto area 1097 1168 73 6% 283 (264) 315 (288)
More snow and rain in winter in northern New Woodstock area 1112 1185 73 7% 280 (261) 300 (273)
Brunswick, combined with warmer temperatures Grand Falls area 1048 1118 70 7% 250 (232) 271 (246)
in spring helps explain projections for greater flood
St. Stephen area 1151 1218 67 6% 300 (281) 326 (302)
risk during the spring freshet, similar to what New
Saint John area 1243 1319 76 6% 322 (301) 372 (344)
Brunswick has experienced in 2018 and 2019.
Source: Averaged for high-and low-emissions scenarios by CCNB using Canadian Climate Atlas data.
A recent Canadian Broadcasting Corporation (CBC)
story cites University of Moncton hydrologist Nassir in 2018 and 2019 could be 21 per cent bigger
El-Jabi who estimates that in New Brunswick frequent by 2100. Flooding damages our properties and
but minor floods could see water levels increase 30 homes, disrupts home and work life, which, in
to 55 per cent by 2100 and extreme floods like those turn, causes stress and anxiety.
20 Healthy Climate, Healthy New BrunswickersCLIMATE CHANGE AND HEALTH: THE NEW BRUNSWICK STORY
Have an Keep a 72 hr
emergency plan: emergency kit
getprepared.ca at home
How to Prepare for
FLOODING
Keep the sewer
Follow NB
cleared out
River Watch
Clear the area Check your
around your insurance
Water Meter coverage
Protect your Securely fasten
important or brace oil tanks
documents and hot water
For more information click here.
tanks
Source: www.fredericton.ca/en/safety-services/emergency-preparedness/flooding
21 Healthy Climate, Healthy New BrunswickersCLIMATE CHANGE AND HEALTH: THE NEW BRUNSWICK STORY
Flood Protection Resources to Help Residents
Reduce their Basement Flood Risk
Flood Protection Tips Reducing Mould Risk
Flood Protection Best Practices Mould Risk Reduction Best Practices
Three Steps to Basement Flood Protection Infographic Guide for Understanding and Fixing Interior Moisture
Top Actions to Reduce Your Risk of Basement Flooding Problems in Housing
Estimated Cost Ranges for Completing Residential Mold in Housing: Information for First Nation Occupants
Flood Protection Projects
One out of every Understanding Water Damage Insurance
Water-resistant Building Materials Coverages
six homes in New
Brunswick is built in a Do-it-yourself Checklists Resource Links
flood-prone area. Basement Flood Protection Checklist Questions to Ask your Insurance Provider
Seasonal Flood Protection Maintenance Checklist Understanding Different Types of Water Damage Risks at
Your Home – Infographic
Resource Links Self-Help Resources for Understanding Water Damage
Self-Help Flood Protection Resources Inside and Insurance Coverages
Outside the Home
Emergency Preparedness
Instructional Videos
Resource Links
Three Practical Actions to Reduce Your Risk of
Basement Flooding Emergency Flood Preparedness Resources
Introduction to Reducing Flood Risk Flood Barriers for Homeowners
How to Extend Downspouts Get a Kit
How to Maintain a Sump Pump
How to Maintain Backwater Valve Source: https://www.intactcentreclimateadaptation.ca/programs/home_
flood_protect/resources/
Best Practices for Maintaining Your Backwater Valve
How Flood Alarms Work
22 Healthy Climate, Healthy New BrunswickersCLIMATE CHANGE AND HEALTH: THE NEW BRUNSWICK STORY
Mental health effects
Mental health professionals are increasingly
worried about the psychological effects of
climate change. Climate change effects such
as flooding and extended power outages can
undermine well-being and cause ecoanxiety,
a “chronic fear of environmental doom.” The
American Psychological Association (APA)
assessment of the mental health effects of
climate change (p. 69) summarizes research
showing that following disasters, damage
to social or community infrastructural Students in Fredericton, New Brunswick, participate in May 2019 School Strike for Climate.
components, such as food systems and medical
services, results in many acute consequences Aggression and violence anxiety and other mental health symptoms years
for psychological well-being. In contrast, gradual Loss of personally-important places after an event. At the same time, women are
impacts of climate change, such as changes Loss of autonomy and control more willing to talk about their mental health,
in weather patterns and rising sea levels, will Loss of personal and occupational control compared to men. Men also need support.
cause some of the most resounding chronic Identity First responders are vulnerable to “post-
psychological consequences. Acute and chronic F eelings of helplessness, fear, fatalism, traumatic stress syndrome, major depressive
mental health effects include the following: solastalgia (the lived experience of disorder, anxiety, depression, complicated
Trauma and shock negatively perceived change to a home/ grief, survivor guilt, vicarious trauma, recovery
Post-traumatic stress disorder community environment), and ecoanxiety fatigue, substance abuse, and suicidal ideation.”
Compounded stress We know young children and adults are These events can also trigger “post-traumatic
Strains on social relationships increasingly anxious about climate change growth (altruism, compassion, optimism, sense
Depression as demonstrated by the global School Strike of meaning and personal growth) in response
Anxiety for Climate movement started by 16-year-old to increasingly extreme weather events and
Suicide Greta Thunberg from Sweden. Studies show effects,” according to a recent research paper
that women, in particular, experience ongoing by Katie Hayes (p. 2, 3).
Substance abuse
23 Healthy Climate, Healthy New BrunswickersCLIMATE CHANGE AND HEALTH: THE NEW BRUNSWICK STORY
Hayes, a leading researcher focused on the Multiple challenges, multiple
mental health effects of climate change points
opportunities
out in her recent paper, that the mental health
effects of climate change are accelerating, Climate change does not travel alone. The
“resulting in a number of direct, indirect and physical and mental health effects due to
overarching effects that disproportionately climate change have greater risks for people
affect those who are most marginalized” (p.2). dealing with existing social and health inequities.
A person with asthma is more at risk from
The American Psychological Association
hotter days and more smog (ground-level
researchers point out that a changing climate
ozone). Smog forms when air pollutants like
can also negatively affect community well-being
sulphur dioxide and nitrogen oxide and fine
through “loss of identity and cohesion, hostility,
particles from industry and cars combine in the
violence and interpersonal and intergroup
presence of the sun and heat to form lung and
aggression” (p.7). To strengthen psychosocial
heart-damaging smog.
well-being, the APA researchers recommend
helping individuals: New Brunswick generally has low levels of
smog-related pollution. Communities like Saint
Build belief in one’s own resilience
John, Belledune and Edmundston, however, that
Foster optimism
house industrial operations (pulp and paper,
ultivate active coping and self-regulation
C coal-fired power, lead smelting, and oil refining),
skills
experience close to maximum levels for fine
aintain practices that help to provide a
M particulate matter and higher levels of smog
sense of meaning
(although at levels below the objective of not Saint John oil refinery
P
romote connectedness to family, place, exceeding 63 parts per billion over an eight-hour
culture, and community (p.7) during an extreme event such as flooding.
period).
The next section summarizes some of the
A person with asthma, or who is older, may be existing social and health conditions in the 16
less able to manage health risks during a heat New Brunswick community areas we discuss
wave or smog event and may be less mobile through a climate change lens.
24 Healthy Climate, Healthy New BrunswickersCHAPTER 4
COMMUNITY
HEALTH PROFILES
The New Brunswick Health Council (NBHC) 2017 community profiles (based on
administrative, census and volunteer survey information) provide an invaluable resource
for understanding how climate change might interact with social and health challenges
communities already face. In this section, we report on the incidence of low-income
households, seniors, food insecurity, living alone, and quality of life and explore how
climate change might exacerbate these issues.
25 Healthy Climate, Healthy New BrunswickersCOMMUNITY HEALTH PROFILES
The community areas covered by the New
Brunswick Health Council profiles are: 8 Living in low-income households (%)
All age Child under Youth under Adults Seniors
Edmundston, Riviére-Verte, Lac-Baker Area; groups 6 years old 18 years old 18-64 (65+)
Campbellton, Athoville, Tide Head Area; New Brunswick 17 23 21 15 20
Dalhousie, Balmoral, Bellledune Area;
Edmundston area 19 20 21 17 27
Bathurst, Beresford, Petit-Rocher Area
Campbellton area 24 46 37 20 27
Caraquet, Pacquetville, Bertrand Area;
Dalhousie area 26 48 33 23 30
Miramichi, Rogersvile, Blackville Area;
Moncton; Bathurst area 20 27 24 17 24
Sackville, Dorchester, Port Elgin Area; Caraquet area 23 41 30 18 33
Sussex, Norton, Sussex Corner Area; Miramichi area 16 21 20 14 21
Fredericton; Moncton 17 22 21 16 14
O
romocto, Gagetown, Fredericton Junction Sackville area 18 27 18 18 18
Area;
Sussex area 15 26 20 12 19
M
into, Chipman, Campbridge-Narrows,
Oromocto area 11 14 13 10 12
Fredericton Junction Area;
F lorenceville-Bristol, Woodstock, Wakefield Fredericton 17 24 23 18 9
Area; Minto area 21 38 26 19 24
G
rand Falls, Saint-Léonard, Drummond Woodstock area 22 24 27 20 24
Area;
Grand Falls area 22 24 27 20 24
Saint Andrews, Campobello Island Area; and
St. Stephen area 23 28 30 22 19
Saint John, Simonds and Musquash.
Saint John area 21 35 30 20 19
For ease of reporting, we describe Edmundston,
Source: Table compiled by CCNB using New Brunswick Health Council 2017 Community at a Glance data.
Riviére-Verte, Lac-Baker as the Edmundston
area. As noted, the geographic boundaries for
these community areas roughly align with the Based on the 2017 community health profiles provincial average for young children and youth
areas covered by climate change modeling grids by the NBHC, we see that the Campbellton, under 18 years-of-age and seniors living in low-
(i.e., the 10 x 10-km grids are reasonable proxies Dalhousie, Caraquet, Minto, Grand Falls, St. income households (Table 8). The Oromocto
for the community area). Stephen, and Saint John areas are well above the area is below average across all age segments.
26 Healthy Climate, Healthy New BrunswickersCOMMUNITY HEALTH PROFILES
Low-income households can also be at risk for
moderate to severe food insecurity, especially if
9 Seniors living alone
Seniors, 65 years and over, as a Seniors living alone Female seniors living
they lack the capacity to grow some of their own proportion of the population (2011) % (2011) (%) alone (2011) (%)
food, as can be the case in urban environments.
New Brunswick 19 24 31
St. Stephen (16%), Moncton (14%), Campbellton
(13%), Woodstock (13%), Sackville (13%), and Edmundston area 22 31 33
Saint John (11%) area communities are above the Campbellton area 24 26 34
provincial average of nine per cent of households Dalhousie area 24 25 32
experiencing food insecurity. Fredericton and
Bathurst area 23 23 29
Oromocto areas have the lowest levels of
Caraquet area 23 24 28
household food insecurity at six per cent each
(not shown in a separate table). Miramichi area 22 26 35
Moncton 18 26 34
Local food self-sufficiency has potential benefits
Sackville area 18 22 28
for food security, particularly if climate change
disrupts global food production, and food Sussex area 18 27 37
imports to locations such as New Brunswick Oromocto area 17 24 29
become more expensive. Higher costs for food, Fredericton 17 26 35
especially fruits and vegetables, is a concern
Minto area 17 27 35
given that the NBHC reports only about half of
Woodstock area 17 26 34
New Brunswickers eat five or more servings a day
of fruit and vegetables. Grand Falls 22 25 32
St. Stephen area 18 28 36
Almost 20 per cent of the New Brunswick
population is over 65 years old, three per Saint John area 18 29 37
Source: Table compiled by CCNB using New Brunswick Health Council 2017 Community at a Glance data.
cent higher than the national average in 2011.
Northern communities exceed the provincial average of 24 per cent, while the Sussex, St. Post-tropical storm Arthur in July 2014,
average at 22 to 24 per cent in Edmundston, Stephen and Saint John areas have more senior followed by the January 2017 ice storm in the
Campbellton, Dalhousie, Bathurst, Caraquet and women living alone than the provincial average Acadian Peninsula, taught us some important
Miramichi areas. More seniors in the Edmundston of 31 per cent (Table 9). lessons about the effects of extreme events on
and Saint John areas live alone than the provincial the isolated and the sick.
27 Healthy Climate, Healthy New BrunswickersYou can also read