Psychosis Data Report Describing variation in numbers of people with psychosis and their access to care in England - Gov.uk
←
→
Page content transcription
If your browser does not render page correctly, please read the page content below

Psychosis Data Report Describing variation in numbers of people with psychosis and their access to care in England
Psychosis Data Report

About Public Health England
Public Health England exists to protect and improve the nation's health and wellbeing,
and reduce health inequalities. It does this through world-class science, knowledge and
intelligence, advocacy, partnerships and the delivery of specialist public health services.
PHE is an operationally autonomous executive agency of the Department of Health.

Public Health England
Wellington House
133-155 Waterloo Road
London SE1 8UG
Tel: 020 7654 8000
www.gov.uk/phe
Twitter: @PHE_uk
Facebook: www.facebook.com/PublicHealthEngland

© Crown copyright 2016
You may re-use this information (excluding logos) free of charge in any format or
medium, under the terms of the Open Government Licence v3.0. To view this licence,
visit OGL or email psi@nationalarchives.gsi.gov.uk. Where we have identified any third
party copyright information you will need to obtain permission from the copyright
holders concerned.

Published September 2016
PHE publications gateway number: 2016292

                                                2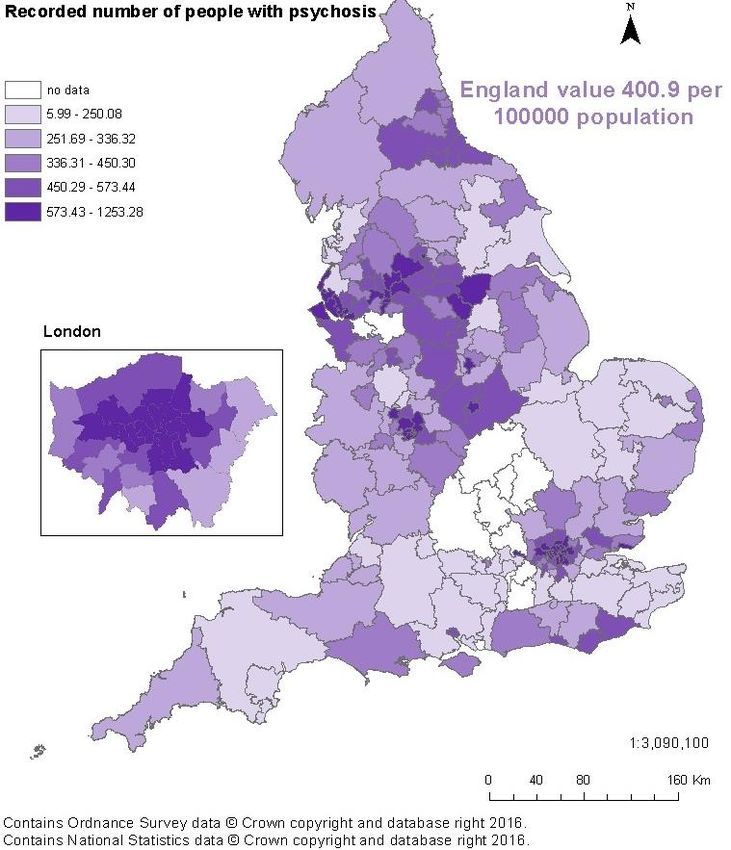
Psychosis Data Report

Contents
About Public Health England                                                     2
Glossary of terms                                                               4
About the National Mental Health Intelligence Network                           6
Executive summary                                                               7
Introduction                                                                    10
Notes on the data presented in this report                                      12

Number of people with psychosis                                                 15
Predisposing factors and prevention                                             24
Access to, and quality of, commissioned services                                28
Improving the physical health of people with psychosis and reducing premature
mortality                                                                       43
Conclusion                                                                      57

References                                                                      58
Acknowledgements                                                                67
Appendix 1                                                                      68
Metric metadata                                                                 68
Appendix 2                                                                      74
In-scope services and teams for mental health currencies                        74
Care cluster descriptions                                                       74
Appendix 3                                                                      76
Comparison of prevalence rates with other countries                             76

                                             3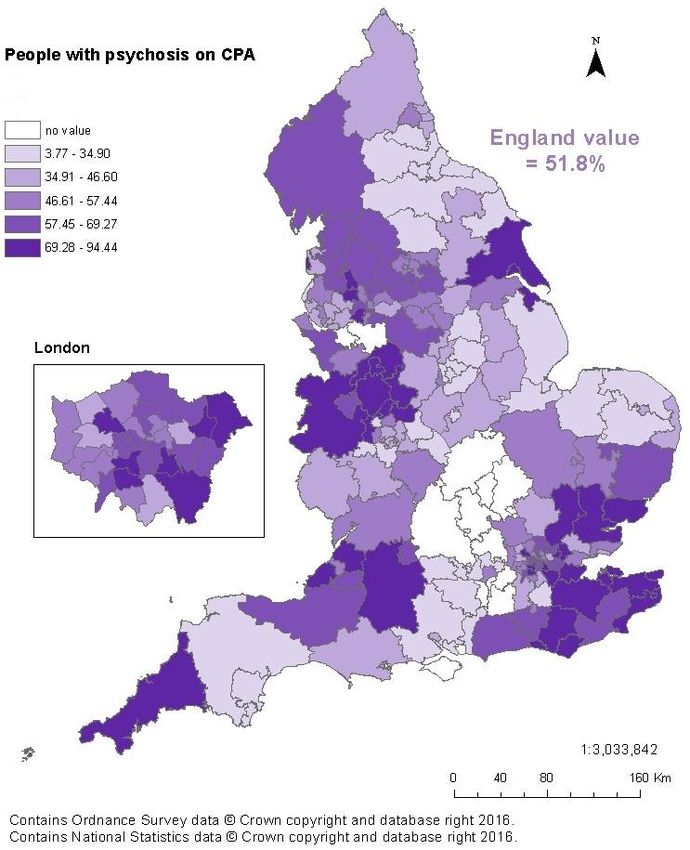
Psychosis Data Report
Glossary of terms
APMS: Adult Psychiatric Morbidity Survey. A general population survey of psychiatric
morbidity among adults aged 16 and over living in private households in England. The
last survey was carried out in 2014 by the National Centre for Social Research
(NatCen) commissioned by NHS Digital and published September 2016.
ARMS: At Risk Mental State. Typically, before an episode of psychosis, many people
will experience a relatively long period of symptoms, which is described as having
ARMS. This may include:
a more extended period of attenuated (less severe) psychotic symptoms; or
an episode of psychosis lasting less than seven days; or
an extended period of very poor social and cognitive functioning (perhaps
accompanied by unusual behaviour including withdrawal from school or friends
and family) in the context of a family history of psychosis.
Cardiometabolic assessments: A set of physical health assessments aimed at
preventing cardiovascular disease and diabetes. The assessments cover in general six
areas: smoking status, lifestyle including exercise and diet, body mass index, blood
glucose, blood lipids and blood pressure.
CBT: Cognitive Behavioural Therapy. This is a talking therapy that can help manage
mental health problems. It helps by changing the way people think about themselves,
other people and the world and how what they do, affects their thoughts and feelings. It
focuses on current problems and difficulties and looks for ways to improve a person’s
current state of mind.
CPA: The Care Programme Approach. A system of intensive case management for
those with complex needs.
EIP: Early Intervention in Psychosis services. These services should provide a full
range of psychological, psychosocial, pharmacological and other interventions shown
to be effective in NICE guidelines and quality standards, including support for families
and carers. Effective and integrated approaches address the social and wider needs of
people with psychosis to help them live full, hopeful and productive lives.
First episode psychosis: this term is used to describe the first time a person
experiences a combination of symptoms known as psychosis. Each person will have a
unique experience and combination of symptoms. Core clinical symptoms are usually
divided into ‘positive symptoms’, so called because they are added experiences,
including hallucinations (perception in the absence of any stimulus) and delusions
(fixed or falsely held beliefs), and ‘negative symptoms’, so called because something is
4
Psychosis Data Report

reduced (such as emotional apathy, lack of drive, poverty of speech, social withdrawal
and self-neglect). A range of common mental health problems (including anxiety and
depression) and coexisting substance misuse may also be present.

HSCIC: Health and Social Care Information Centre. From August 2016 known as NHS
Digital (NHSD). A trusted national provider of high quality information, data and IT
systems for health and social care.

MHLDDS: Mental Health and Learning Disabilities Data Set. Contained record level
data about the care of adults who are in contact with mental health and learning
disabilities services. From January 2016 it was replaced by the MHSDS.

MHSDS: The Mental Health Services Data Set. A patient level dataset which delivers
robust, comprehensive, nationally consistent and comparable person-based
information for children, young people and adults who are in contact with mental health
services. It covers services provided in hospitals, outpatient clinics and in the
community. The data set can be used to inform service improvements and monitor
service performance, clinical interventions, patient experience and treatment outcomes.

NHSD: NHS Digital. Formerly known as the Health and Social Care Information Centre.
A trusted national provider of high quality information, data and IT systems for health
and social care.

NMHDNIN: National Mental Health Dementia and Neurology Intelligence Network.
Analyses information and data and turns it into timely, meaningful health intelligence for
commissions, policy makers, clinicians and health professionals to improve services,
outcomes and reduce the negative impact of mental health, dementia and neurology
problems. The NMHIN refers to the mental health side of the network.

NICE: National Institute for Health and Care Excellence, whose role it is to improve
outcomes for people using the NHS and other public health and social care services by
producing evidence-based guidelines and advice and developing quality standards and
performance metrics.

Psychosis: Psychosis is characterised by hallucinations, delusions and a disturbed
relationship with reality, and can cause considerable distress and disability for the
person and their family or carers. A diagnosis of schizophrenia, bipolar disorder,
psychotic depression or other less common psychotic disorders will usually be made,
although it can take months or even years for a final diagnosis.

SMI: Severe Mental Illness. In this report it generally covers a collection of conditions:
schizophrenia, bipolar affective disorder and other psychosis.

                                                 5
Psychosis Data Report
About the National Mental Health
Intelligence Network
The NMHIN is part of Public Health England’s (PHE) National Mental Health, Dementia and
Neurology Intelligence Network (NMHDNIN).
The purpose of the NMHDNIN is to:
develop relevant, timely and authoritative intelligence tools and resources
take a strategic lead across the system on the innovative development of
information for improvement, embedding our intelligence tools and products in
local systems
develop strong partnerships with key stakeholders and the academic,
commercial and voluntary sectors – with the aim of continually driving up
standards in intelligence products aimed at improving population health and
reducing health inequalities
The intelligence resources and tools produced by the NMHIN can be found on the network’s
website. There is also an SMI profile which can be found on fingertips, together with a suite of
other profiles relating adult and children’s mental health, suicide and crisis. All profiles are
updated routinely and the SMI profile will be developed to take into account measures reported
in this report.
6
Psychosis Data Report
Executive summary
Psychosis is one of the most life-impacting conditions in healthcare and arguably the
most significant in mental health in terms of poorest lifelong outcomes, greatest
variation in access to evidence-based care and highest resultant costs. The ‘Five Year
Forward View for Mental Health’ has made the case for transforming mental health care
in England, and ‘Implementing the Five Year Forward View for Mental Health’ drives
forward delivery of this programme including enhanced action on Early Intervention in
Psychosis (EIP) access and wait standards. This report aligns with ambitions within
these documents, aiming to assist in the move towards improved access to quality care
for people at risk of, or living with psychosis. It also seeks to encourage continuous
quality improvement through better data collection and reporting of information on
mental health to service users, clinical teams and the wider health and social
care system.
A range of sources are used within the report, including data relating to primary care,
but it particularly draws upon the last monthly data from the MHLDDS, published by the
HSCIC in November 2015.
The report describes variation in England under four headings, these and the key
findings under them are:
Number of people with psychosis
Investigating inequalities and the variation in the number of people with psychosis is
necessary to understand local need and to develop appropriate health strategies and
effective services:
the three measures of incidence and prevalence presented show a similar
pattern of geographical variation, with inner city and more deprived areas being
associated with higher numbers of people with psychosis. The magnitude of
difference varies significantly between the datasets
the data shows that more men than women have psychosis. Between the ages
of 18 and 59 years, higher numbers of men have psychosis, while for ages 60
years and over, higher numbers of women have psychosis. It was found that
higher proportions of people from black and minority ethnic groups in contact
with secondary mental health services were assigned to the psychosis
supra-cluster
there is variation in estimates of incidence and prevalence of psychosis
between different sources. Consideration should be given to how the use of
different data sources could contribute to more accurate estimates of incidence
and prevalence
7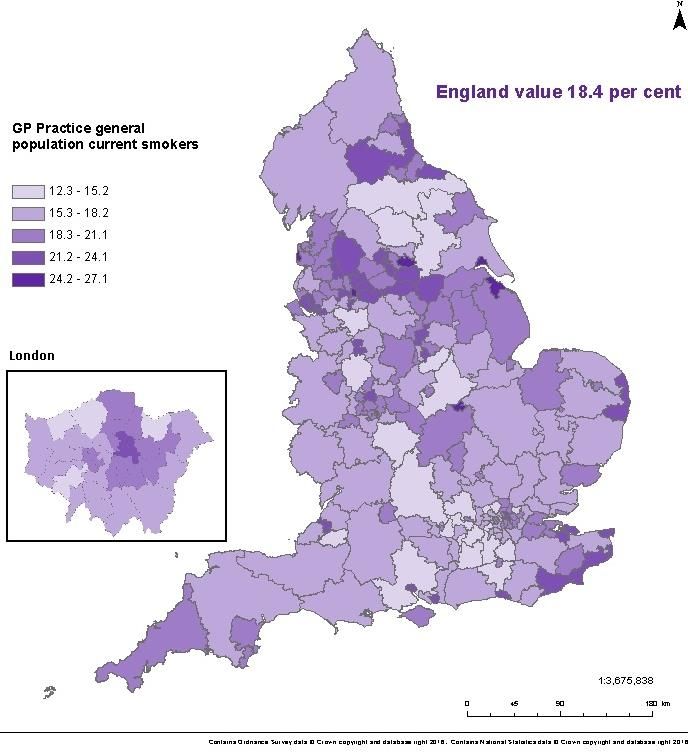
Psychosis Data Report
Predisposing factors and prevention
Routine data is not available to reliably define variation in levels of predisposing factors
and to measure outcomes of prevention interventions for psychosis, but evidence is
available to direct best practice. Metrics which can reliably define levels of risk and
protective factors and intervention outcomes will be developed over time. In addition
the Prevention Concordat Programme for Better Mental Health will support local and
national action around the prevention of mental illness, including psychosis, through
supporting local areas to put in place a detailed mental health Joint Strategic Needs
Assessment (JSNA) and to develop a joint mental health prevention plan.
Access to and quality of commissioned services
Despite there being NICE guidelines and Quality Standards for psychosis since 2002
too few people with psychosis are supported in the evidence-based way, and there is
major variation in reported quality of clinical care and support provided:
prior to the introduction of the access and waits standard, EIP audit data from
2014 shows that 33% of patients with first episode or suspected psychosis were
allocated to, and engaged by, an EIP care co-ordinator within two weeks of
referral, range 4% to 82%.
EIP audit data from 2014 and the national Audit of Schizophrenia (2014) found
41% of service users with first episode, or suspected psychosis, and 39% of
service users with schizophrenia, had been offered cognitive behavioural
therapy (CBT) for psychosis
there is great variation in reported clinical commissioning group (CCG) level
access to appropriate care for people with psychosis, eg the proportion of
people with psychosis on the Care Programme Approach (CPA) ranges from
3.8% to 94.5%, and the proportion of people with psychosis who have a crisis
plan in place ranges from 0.3% to 85.7%
employment and safe accommodation are important factors for aiding recovery.
It was found that the proportion of people with psychosis in employment was
5.8% (range 1% - 18.5%) compared to 40.6% in the population with a mental
health condition. NICE quality standards state that adults with psychosis or
schizophrenia who wish to find, or return to work, are offered supported
employment programmes. It was found that the proportion of people with
schizophrenia who wanted to work and were getting help to find work was
48% with 63% of EIP patients looking for work were offered supported
employment programmes
8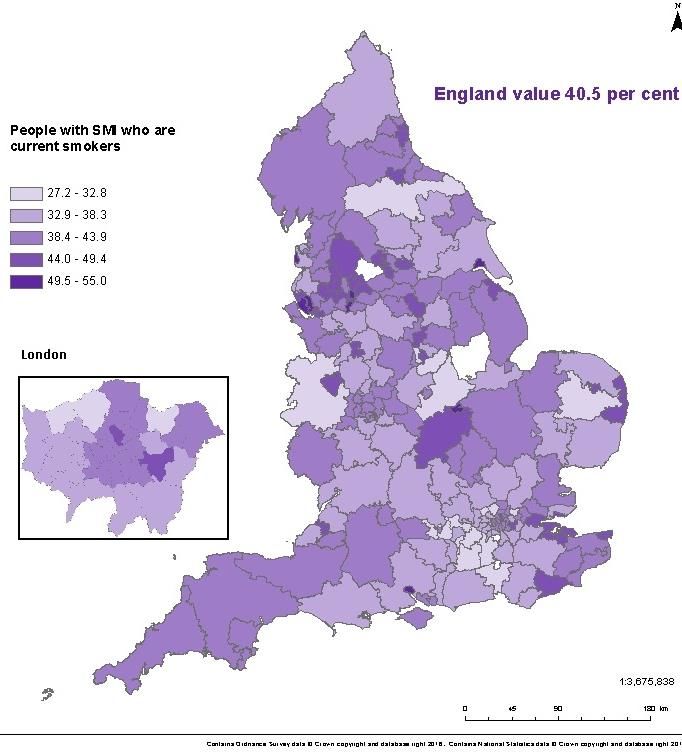
Psychosis Data Report
Improving the physical health of people with psychosis and reducing
premature mortality
People with severe mental illness (SMI), such as psychosis are at increased risk of
poor physical health and die on average 15 to 20 years earlier than the general
population. The main causes of premature death are from chronic physical conditions
such as coronary heart disease, type 2 diabetes and respiratory disease. These
conditions are associated with modifiable risk factors and can be preventable:
data from 2014/15 shows that monitoring of physical health and access to
preventative treatment for people with SMI varies considerably. In primary care
(CCG), the proportion of people with SMI receiving the complete list of physical
health checks ranged from 17.5% to 52.4%. In secondary mental health
services, 25% of people with schizophrenia were offered interventions for
elevated blood pressure, 53% for abnormal glucose control, 57% for smoking
and 76% for weight management.
people in contact with secondary mental health services aged under 75 have
three and a half times the death rate of the general population aged under 75,
the rate for this group is higher in all CCGs, ranging from 1.35 to
5.9 times higher
the major causes of premature mortality for people in contact with secondary
mental health services are cancer, cardiovascular, respiratory and liver
diseases. Cardiovascular disease has the greatest number of excess deaths
(189.3 per 100000), but liver disease has the greatest percentage difference
(365.3%)
The report draws attention to the issues around the availability and quality of data on
psychosis and the implications of data interpretation in light of these data issues.
This report aims to inform an ongoing process whereby better data can drive better
intelligence that helps achieve improved care for those at risk of/or suffering from
psychosis.
Data sets that were processed for this document will inform the National Mental Health
Intelligence Network’s (NMHIN) profiling tools, as will further related metrics as they
become available.
9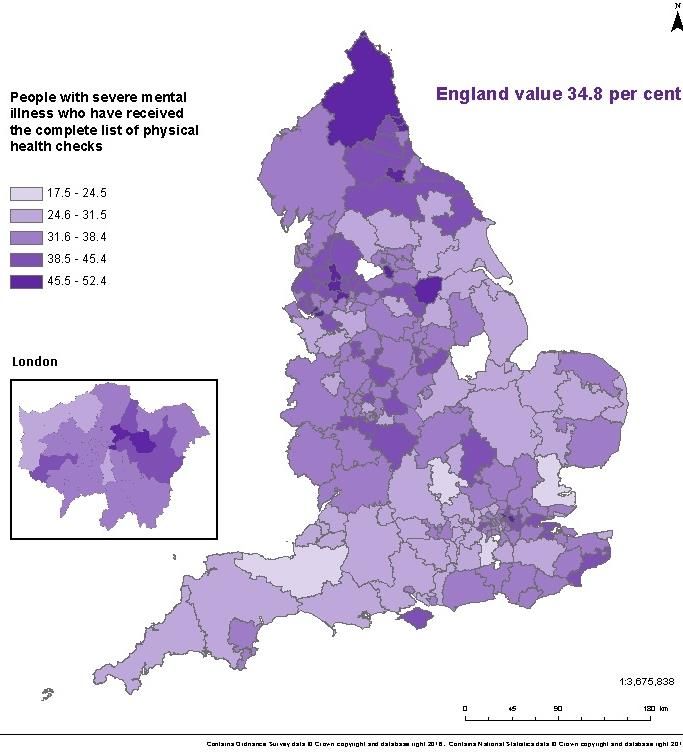
Psychosis Data Report

Introduction
Why report on data and information relating to psychosis now?

Psychosis is one of the most life-impacting conditions in healthcare, and arguably the
most significant in mental health in terms of poorest lifelong outcomes, greatest
variation in access to evidence-based care and highest resultant costs. However,
people who experience psychosis can and do recover. The time from onset of
psychosis to the provision of evidence-based treatment has a significant influence on
long-term outcomes. The sooner treatment is started the better the outcome and the
lower the overall cost of care1.

The use of data and intelligence has a vital role to play in ensuring appropriate and
timely evidence based care is provided to people with psychosis. This report begins a
period where the NMHIN has an increased focus on sharing and interpreting available
data on or related to psychosis.

What is the purpose of this report?

This report aims to contribute to the drive for improved access to quality care for people
at risk of, or living with psychosis. It also aims to encourage continued improvement in
the collection and reporting of data which can help provide a sound basis for planning
and providing that care. These ambitions align with the objectives set out in the ‘Five
Year Forward View for Mental Health’2 and ‘Implementing the Five Year Forward View
for Mental Health’3.

This report mostly presents available data from sources that have been in use for some
time. It does this now, in advance of new and more detailed reporting on psychosis, to
provide a baseline of what information and intelligence can tell us about people with
psychosis in England. The report describes variation across England in the occurrence
of people with psychosis and their access to care and support. It is written to help
highlight variation and enable local systems to benchmark their data with other areas
and use the information to influence their commissioning of services for those at risk
of/or suffering from psychosis.

As data on psychosis develops, so will our ability to use it to plan effectively for the
needs of our population. Although this report covers the whole care pathway, there are
clear gaps, for instance, aiding understanding of prevention and risk reduction requires
more detailed focus than is provided here. The report draws attention to gaps in data
and issues around the quality and completeness of some data on psychosis.

                                               10
Psychosis Data Report
Evidence-based interventions and improving outcomes
This report aims to be part of a process that uses data to seek to ensure the delivery of
evidence-based care as required by population need. NICE has developed guidance4,5
and associated quality standards6,7 covering the treatment and management of
psychosis and schizophrenia for children and young people and adults. The new Early
Intervention in Psychosis (EIP) waiting time standard requires that people experiencing
a first episode of psychosis should have access to a NICE-approved care package
within two weeks of referral. To deliver the effective, holistic care that achieves the best
outcomes requires a service model that brings together teams comprising the right skill
mix and care pathways. The NICE quality standard6 states that services should be
commissioned from, and coordinated across, all relevant agencies, encompassing the
whole psychosis and schizophrenia care pathway; and that staff assessing patients and
delivering care and treatment should have sufficient and appropriate training and
competencies to deliver the actions and interventions described in the quality standard.
The evidence base on effective implementation of guidelines shows that the
prerequisites include: ‘board to floor’ commitment, skilled operations managers, working
with patients and clinicians to streamline pathways, and information and intelligence
systems that provide continuous feedback of baseline and improvement standards 8.
Who is this report for?
The report is for policy makers, planners, local commissioners, psychosis care
providers, professional bodies and advocacy groups. It aims to inform key policies and
commissioned programmes that drive improvement in data quality and availability, and
to support those working locally to improve experience and outcomes for those at risk
of/or suffering from psychosis.
How is psychosis defined in this report?
Psychosis is characterised by hallucinations, delusions and a disturbed relationship with
reality, and can cause considerable distress and disability for the person and their family
or carers. A diagnosis of schizophrenia, bipolar disorder, psychotic depression or other
less common psychotic disorders will usually be made, although it can take months or
even years for a final diagnosis9.
11Psychosis Data Report
Notes on the data presented in this report
Information on data sources and measure definitions
Information on the data sources and definition of each of the measures in this report are
found in appendix 1. It is recommended that this is referred to when reading the report
in order to fully understand the context of each measure.
The complete dataset, covering all CCGs, or local authorities (LA), for each of the
measures presented in this report, is made available in a spreadsheet on the MHDNIN’s
website102. The spreadsheet holds the measure metadata and displays the measure
value together with its numerator, denominator; lower and upper confidence intervals;
and whether the value, when compared with the England average, is significantly lower
(dark blue), significantly higher (light blue) or has no significant difference (orange). This
is a different breakdown to that shown in the maps, where the data is broken down into
quintile groupings.
Different diagnosis groupings
Schizophrenia and psychosis can be difficult to diagnose and require careful
assessment over time. Diagnoses of schizophrenia and psychosis can be poorly
recorded and reported and, as such, it has not been possible to use metrics
consistently.
With the lack of good quality diagnostic coding, data from the MHLDDS used in this
report allows people with psychosis to be identified through the use of the Payment by
Results (PbR) psychosis supra cluster classification. Appendix 2 contains descriptions
of the clusters which make up the psychosis supra cluster.
The metrics from the Quality and Outcomes Framework (QOF)10 report on people
known to primary care with SMI. The physical health check metrics cover people
suffering from schizophrenia, bipolar affective disorder and other psychoses. However,
the prevalence metric (recorded number of people with SMI) has a wider definition that
also includes other patients on lithium therapy.
The NAS11 surveyed people who have had a diagnosis of either schizophrenia or
schizoaffective disorder for at least 12 months.
The Early Intervention in Psychosis Audit12 (EIP Audit) surveyed all people who had
been referred to EIP services who met the following criteria: people who were having
first episode or suspected psychosis, at risk mental state, or other condition, but not
12Psychosis Data Report
experiencing psychotic symptoms due to an organic cause. Full details of the definitions
can be found in the audit report12.
The metric, which measures emergency admissions to hospital, uses data from the
Hospital Episode Statistics (HES), which extracts records which have an ICD10 primary
diagnosis of psychosis (F20-F29).
Data quality of sources used
A number of data sources used in the report have shortfalls around data completeness
and data quality. They are used because no other data is available which can describe
variation in psychosis incidence, prevalence or quality of care. The known data
completeness and quality issues to be considered when interpreting the findings are:
the November 2015 currency and payment (CaP) data from the MHLDDS13
shows the number of people in contact with mental health services at that time
as around 965 000. Of these, 665 000 were in scope with 85% (562 000) being
assigned to a cluster; this ranged from 2.3% to 98%. Where CCGs had less than
50% of people in scope assigned to a care cluster, they have been excluded
from being reported:
Bedfordshire (2.3%) Oxfordshire (30.4%) Vale Royal (46.8%)
Milton Keynes (3.7%) Aylesbury Vale (31.7%) North West Surrey (47.2%)
Luton (5.4%) Chiltern (34.9%) Eastern Cheshire (48.0%)
Portsmouth (8.2%) Nene (44.0%)
Appendix 2 covers the definition of in scope services, as used for the CaP data,
November 2015. However, it is known that there is local variation in how
services apply this definition.
Data is suppressed if counts are less than five and all data is rounded to the
nearest five. Numbers may not reflect true counts of cases with psychosis due to
reasons such as incomplete data recording. All reported low values should
therefore be treated with caution.
the NAS11 is an initiative of the Royal College of Psychiatrists Centre for Quality
Improvement (CCQI), which is commissioned by NHS England (NHSE) and
managed through the Healthcare Quality Improvement Partnership (HQIP) as
part of the National Clinical Audit and Patient Outcomes Programmes. This
collected data from 64 mental health provider trusts, on a randomly selected
population of 100 people with schizophrenia across all stages of the pathway –
84% of trusts returned data for at least 73 cases. Questionnaires were also
13Psychosis Data Report
distributed to service users and their carers – there was a response rate of 26%
for service users and 19% for carers
the EIP Audit12, commissioned by HQIP on behalf of NHSE, collected
retrospective data on a sample of up to 100 patients accepted onto the caseload
of EIP services between 30/06/2014 and 31/12/2014 and the treatment they
received over the following six months. Also provided was service level
information for each EIP team. 55 out of 66 providers participated and submitted
data on 144 EIP teams. 54 providers and 135 EIP teams submitted usable data
on 2,761 patients for the patient level audit
metrics using data from the GP Extraction Service (GPES)14,15 are accompanied
at national and CCG level, by a data completeness banding. This reports on the
percentage of the population registered with a GP practice whose data was
extracted. Where this was less than 50% of the total registered population of the
CCG, the indicator values were suppressed
Warranted and unwarranted variation
Variations in the data presented within this report may be due to a number of different
reasons, some of which can be described as warranted and some unwarranted.
Warranted variation is where observed variation is due to accepted reasons. An
example of warranted variation in this report could be the differences in the number of
people identified with or estimated to have psychosis due to variation in recognised
demographic and socio-economic factors.
Unwarranted variation reflects limitations within the health and social care system which
become apparent in differences in the level and quality of treatment and care received.
An example of unwarranted variation in this report could be the difference in delivery of
interventions to help reduce the impact of physical health problems.
When assessing the nature of the variation of the measures in this report, it is important
to keep in mind the quality of the data being used, variation seen could be due to data
quality issues rather than the nature or quality of care being delivered.
Range within which the middle 60% of the values lie
Within the commentary accompanying the presentation of maps, the total range within
which CCG values fall is reported, together with a range within which the middle 60% of
CCG values lie. This latter range represents the range which spans the ‘middle’ 60% of
the data set. It cuts out the highest 20% and lowest 20% of data values, so eliminating
outlying values at the top and bottom of the range.
14Psychosis Data Report
Number of people with psychosis
Context
Investigating variation in the occurrence of new cases of psychosis (incidence) and the
number of people with ongoing psychosis (prevalence) is necessary to understand and
develop appropriate prevention, health and care strategies and effective services to
meet local need. The use of the measures have different purposes; understanding the
level of new cases of psychosis is key for planning prevention and EIP services, while
understanding current cases can help the planning of longer term supporting and
management services.
Identifying differences in numbers of people with psychosis between demographic and
social groups will show where strategies and services need to address health
inequalities and provide services designed to meet those differing needs.
Metrics
It is not currently possible to report true counts of cases of psychosis or people living
with psychosis. Dataset limitations restrict how much can be said on the inequality
aspect of how psychosis affects different parts of society.
The ‘Adult Psychiatric Morbidity Survey 2014’, published in September 201616, includes a
chapter on psychosis. It includes an estimated prevalence of psychotic disorder in the last year
in England of 0.7% of adults aged 16 and over. This is higher than the estimate from the 2007
survey (0.4%) and the report includes the commentary ‘while statistical tests indicate that this
might be a significant increase, these figures are also consistent with a continued trend of
broad stability in rates of psychosis. Any conclusions about trends should be treated with
caution considering the numbers of confirmed cases were low (23 in 2007; 26 in 2014)’.
Although low numbers of identified cases restricts subgroup analysis, from consideration of the
2007 and 2014 cases together, the report highlights higher prevalence of psychosis among
black men, people who are economically inactive and people living alone.
Data from the APMS report cannot yet be used to help estimate local variation in numbers of
people with psychosis. In the absence of local measures of incidence and prevalence of
psychosis, estimates can be developed through the use of mathematical modelling. However,
estimating at local level is difficult and is unlikely to be accurate; prevalence surveys are difficult
to design and undertake as a result of psychosis having a low prevalence in the general
population, the nature of psychosis influences people’s participation and household surveys will
miss the higher prevalence of psychosis among those who are homeless, resident in temporary
accommodation or in prison16.
15Psychosis Data Report
The data used in this report to show geographical variation in new cases of psychosis is
based on a modelled estimate17. The estimated incidence for England reported in NICE
guidance4 and the NHSE ‘Implementing the Early Intervention in Psychosis Access and
Waiting Time Standard guidance’18 (31.7 per 100000) is based on best available
empirical evidence which is different to the modelled estimate England figure used in
this report (24.2 per 100 000).
The measures on prevalence of psychosis use data from the QOF SMI registers and
the MHLDDS, so are measures of treated prevalence (counts of contacts with services)
and not true prevalence.
Whilst these measures of incidence and prevalence may not be accurate, used
pragmatically and in conjunction with local knowledge, they offer a basis on which
to plan.
When assessing social inequalities in the number of people with psychosis, the
following three data sources are used: the CCG prevalence measure (MHLDDS data),
the CCG deprivation score from the English indices of deprivation (2015) 19 and the
Health and Social Care Information Centre (HSCIC) (now NHS Digital (NHSD) Mental
Health Bulletin: Annual Statistics 2014-1520, which reports on the number of people
assigned to the psychosis supra cluster by age, gender and ethnic group.
Detailed information on the data source and definition of each measure can be found in
appendix 1 and in the data document which accompanies this report and which can be
found on the MHDNIN’s website102.
16Psychosis Data Report
Estimated number of new cases of psychosis 16-64 years (2011 based, published 2014)
Map 1: New cases of psychosis Table 1: Highest and lowest 10 CCGs – estimated new cases of psychosis
Number Number
CCGs with highest incidence per 100 CCGs with lowest incidence per 100
000 000
City and Hackney 69.36 East Riding of Yorkshire 15.73
Newham 67.98 Northumberland 15.85
Tower Hamlets 59.63 Kernow 16.02
Lambeth 52.44 Isle of Wight 16.09
Islington 52.23 Somerset 16.19
Southwark 50.58 Cumbria 16.28
Haringey 49.58 North Somerset 16.33
Lewisham 48.61 Shropshire 16.34
Waltham Forest 48.26 Scarborough & Ryedale 16.41
Brent 44.93 Harrogate & Rural District 16.42
Size of variation
for CCGs in England, the estimated number of new cases of psychosis ranges from 15.7 to 69.4 per 100 000
population aged 16-64 years
the average for England is 24.2 new cases per 100 000 population
the range within which the middle 60% of CCGs lie is 17.8 to 26.8. Most CCGs have a rate of new cases similar to
England, however, the spread in variation increases among the CCGs with higher estimates of new cases
higher numbers of new cases occur across the densely populated areas and cities of the North East, North West,
Yorkshire, Midlands and London
17 of 209 CCGs had significantly lower estimated numbers of new cases than the England average and 31 had a
significantly higher estimated number
17Psychosis Data Report
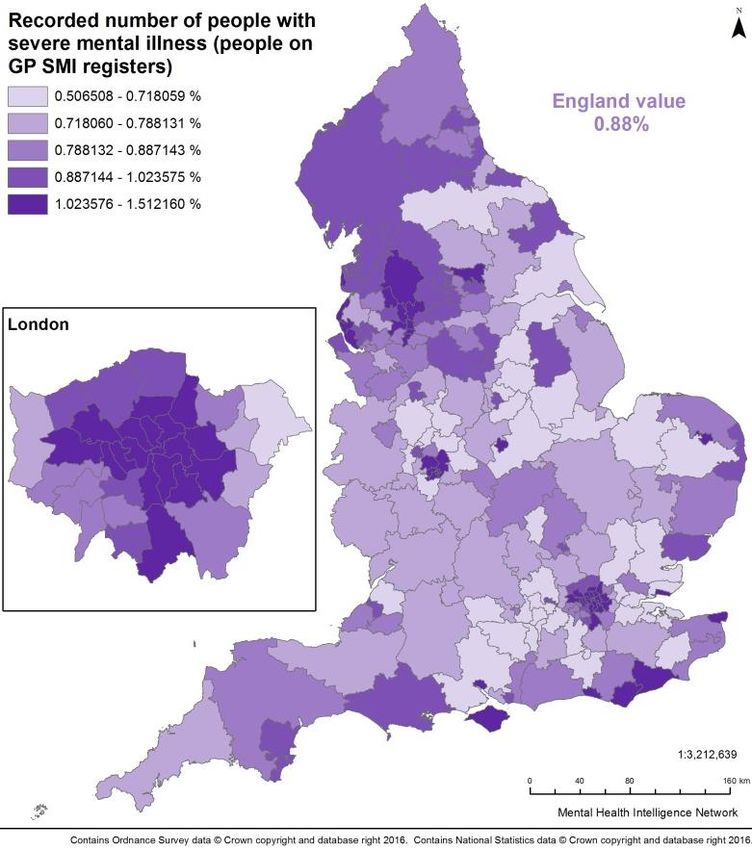
Recorded number of people with severe mental illness all ages (people on GP SMI registers 2014/15)
Map 2: Number with psychosis Table 2: Highest and lowest 10 CCGs – recorded number with SMI
CCGs with highest percentage of CCGs with lowest percentage of
% %
people recorded on SMI register people recorded on SMI register
West London 1.51 Wokingham 0.51
Islington 1.50 Surrey Heath 0.54
Camden 1.39 South Gloucestershire 0.55
Blackpool 1.38 East Staffordshire 0.59
City and Hackney 1.36 South Lincolnshire 0.61
Tower Hamlets 1.32 Castle Point & Rochford 0.61
Hammersmith & Fulham 1.31 Bracknell and Ascot 0.61
Lambeth 1.29 Cannock Chase 0.62
Central London (Westminster) 1.29 Warwickshire North 0.62
Liverpool 1.29 South West Lincolnshire 0.62
Size of variation
for CCGs in England, the percentage of people recorded on GP SMI registers ranges from 0.5% (507 per 100 000)
to 1.5% (1512 per 100 000)
the range within which the middle 60% of CCGs lie is from 0.7% (718 per 100 000) to 1% (1024 per 100 000)
the average for England is 0.9% (881 per 100 000)
there were 107 out of 209 CCGs which had significantly lower percentage of people recorded on GP SMI registers
than the England average and 67 which had significantly higher percentage on SMI registers than England
18Psychosis Data Report
Recorded number of people with psychosis 16+ years (people assigned to psychosis supra cluster, snapshot November
2015)
Map 3: Number with psychosis Table 3: Highest and lowest 10 CCGs – recorded number with psychosis
CCGs with highest proportions of Number CCGs with lowest proportions of Number
people assigned to the psychosis per 100 people assigned to the psychosis per 100
supra cluster 000 supra cluster 000
Liverpool 1253.3 North East Hampshire & Farnham 6.0
Leicester City 1210.4 Surrey Downs 17.4
Central Manchester 1091.9 East Surrey 20.8
Birmingham South and Central 1043.2 Medway 41.2
North Manchester 1041.2 Dartford, Gravesham & Swanley 41.6
Bradford City 1037.0 West Kent 50.3
Southport and Formby 985.0 Swale 50.8
Camden 934.8 Ashford 66.4
South Sefton 902.4 South Kent Coast 71.0
South Manchester 886.6 Canterbury & Coastal 105.1
Size of variation
for CCGs in England the rate of people assigned to a psychosis supra cluster ranges from 6.0 to 1253.3 per 100 000
population 16 years and over
the range within which the middle 60% of CCGs lie is from 251.4 to 574.1 per 100 000 population
the average for England is 400.9 per 100 000 population
there were 92 CCGs which had significantly lower proportions of people assigned to a psychosis cluster than the
England average and 79 which had significantly higher proportions assigned to a psychosis cluster
three CCGs had counts of less than five so no value is calculated: Corby, Surrey Heath and Guildford and Waverley
19Psychosis Data Report
Assessing Inequalities: Recorded number of people with psychosis (assigned to psychosis supra cluster) and socio-
economic deprivation; and inequalities by age, gender and ethnic group (Mental Health Bulletin: Annual Stats 2014/15)
Chart 1: Number of people assigned to psychosis supra Chart 2: Deprivation and estimated numbers of people with
cluster by age and gender at the end of the year 2014/15 psychosis (people assigned to the psychosis supra cluster)
30,000
Number of care clusters assigned
surpa cluster / 100000 population
1400
Number assigned to psychosis
2
R =0.45
25,000 1200
20,000 1000
800
15,000
600
10,000
400
5,000 200
- 0
17 or 18-19 20-29 30-39 40-49 50-59 60-69 70-79 80-89 90 or 0 10 20 30 40 50 60
under Males Females over
CCG IMD Average Score (higher scores = more deprived)
Table 4: Number of people assigned to psychosis supra cluster by ethnic group
Total Total % of ethnic
number number group
Ethnic Group assigned to assigned assigned to
psychosis to a care psychosis
supra cluster cluster supra cluster
White 143026 544682 26%
Asian or Asian British 16249 29773 55%
Black or Black British 17822 25006 71%
Mixed groups 4341 8332 52%
Other ethnic group 5066 12499 41%
20Psychosis Data Report
Assessing inequalities: key points from those assigned to the psychosis supra cluster
overall more males than females are assigned to the psychosis supra cluster, and
specifically more males between the ages of 15 and 59, and more females aged 60
and over are assigned to the psychosis supra cluster
for males the age group with the highest numbers assigned to the psychosis supra
cluster was 30 to 49, for females it was 40 to 59
there is an association between increasing deprivation and increasing numbers of
people assigned to the psychosis supra cluster (R2=0.45)
there are large differences between ethnic groups in the proportions of people in
touch with secondary mental health services assigned to the psychosis supra
cluster, for instance table four shows that around a quarter of people identified as
White are assigned to the psychosis supra cluster whereas the proportion rises to
more than 70% for those identified as Black or Black British.
Discussion of findings
Gaps in data and data quality concerns
As service planning for those with or at risk of psychosis should be based on estimates
of prevalence and incidence of psychosis and contacts with services, it is important that
these metrics are accurate. National estimates of psychosis based on a household
survey may miss important populations or under report prevalence 16, and there are no
known recent robust estimates of local numbers of people with psychosis. The service
contacts reported here are not wholly based on diagnosis of psychosis and the reported
variation across the country for one measure suggests there may be value in reviewing
data collection and reporting methodology.
Variation in numbers of people with psychosis
The three metrics included report on similar but different populations. However, there is
consistent reporting of local variation between them. All three report higher rates of
psychosis (or SMI) in urban inner city areas and lower rates in more rural and sparsely
populated areas. However, looking in more detail, the incidence measure and the SMI
QOF prevalence measure report the highest rates in London, where as the CaP
psychosis supra cluster measure suggests the highest rates in North West and Central
England cities such as Manchester, Liverpool, Bradford, Birmingham and Leicester.
This illustrates the importance of assessing results from more than one data source to
take into account variation caused by different measurement methods.
Demographic and social-economic inequalities in people with psychosis
In the general population, first episode psychosis occurs most commonly between late
teens and late twenties, with more than three quarters of men and two thirds of women
21Psychosis Data Report
experiencing their first episode before the age of 3521. This means that areas serving
younger populations may have higher rates of psychosis. Higher rates within the
general population have also been found amongst migrants and people from Black
Caribbean and Black African ethnic groups22.
Factors likely to contribute to variation in numbers of people with psychosis
Geographical variation in prevalence and incidence of psychosis is likely to be linked to
the nature of the development of psychosis and its association with poverty and access
to life chance opportunities. This will affect the range of areas people with psychosis are
able to live in or move into. The data indicates that larger inner cities tend to have
higher incidence and prevalence of psychosis. There is evidence22 linking the onset of
psychotic disorders with the social environment, such as: inner city living, deprivation,
population density, social fragmentation and ethnic density; and individual life
experiences such as: childhood adversity and abuse, early experience of alcohol or
substance use and abuse, discrimination and adult social disadvantage. Many of these
factors are characteristics which can define urban areas and deprived neighbourhoods.
The distribution of these factors will therefore influence the patterns of variation in
psychosis seen across the country.
Data, survey and methodological factors
Due to the absence of data which allows reporting of true counts of incidence and
prevalence, and the resulting use of modelled estimates, there are data and
methodological factors which influence the counting and estimation processes:
data recording completeness on information systems
variation in interpretation of the definitions of psychoses in QOF and MHLDDS.
For instance there is 3 fold variation in CCG level reporting for the QOF SMI
register, whereas there is 200 fold variation in those allocated to the MHLDDS
psychosis supra cluster. The supra cluster is unable to identify one off episodes
of psychosis in terms of trauma, drug use; remitting and continuous and long
term psychosis
the use of different diagnostic categories and condition assessment methods to
identify people with psychosis
type of survey used to identify people with psychosis (eg household v case-
finding using registers in primary and secondary care)
different reference periods (eg point in time, annual, lifetime)
reliability of method: reluctance of people with psychosis to take part in a
household survey and sample sizes being too small
the way survey sampling take account of influencing factors such as higher risk
populations (eg children in care, transient populations, people in institutions).
22Psychosis Data Report
Estimates of prevalence – a wider comparison
Estimates of prevalence rates for psychotic disorders, particularly when including
countries other than the UK, show sizeable variation (see appendix 3). For example, the
Adult Psychiatric Morbidity Survey (APMS) (annual prevalence) reports a figure for
England of 7.00 per 1000, which broadly aligns with an English study systematic review
(annual prevalence 4.10 per 1000)22. However, a Swedish study of health records23
(annual estimate) reports 6.7 per 1000, and a Finnish study of a population survey24
(lifetime prevalence) reports 34.6 per 1000 for all psychosis when the non-responder
group is included. This emphasises the complexities of calculating prevalence
accurately and also the importance of prevalence type (point, period, lifetime) and study
methodology when estimating the numbers of people with psychosis in an area.
Recommendations
There may be benefit in further consideration of how to estimate prevalence of
psychosis in England and variation between areas. Household surveys may
underestimate prevalence of psychosis in the population and consideration should be
given to how different data sources could contribute to more accurate estimates. For
example the use of psychosis registers like those available in Scandinavia linked to a
national audit of psychosis, and the use of clinical data sets such as the Clinical
Practice Research Datalink (CPRD)25, The Health Improvement Network database
(THIN)26 and Clinical Record Interactive Search (CRIS)27. Primary care data collections
such as GPES should also be investigated as a data source that could enable the
identification of people with psychosis from which estimates of prevalence of psychosis
could be derived.
There would be benefit in working to ensure definitions of incidence and prevalence of
psychosis and SMI in community populations, primary care, specialist mental health and
drug and alcohol services, are consistent. There needs to be clarity on what to include,
eg substance misuse induced psychoses, and exclude, eg those with bipolar disorder
episodes who do not have psychotic symptoms, and where possible psychosis should
be disaggregated from SMI.
Psychosis incidence and prevalence should be included in each local area’s JSNA,
which looks at local health need to inform the commissioning of health, wellbeing and
social care services within local authority areas and underpins health and wellbeing
strategies. The MHDNIN profiling tools should be promoted to aid JSNA development.
23Psychosis Data Report
Predisposing factors and prevention
Context
Inequality underlies many risk factors for mental illness, including psychosis, and needs
to be addressed through the wider determinants of health. Mental illness can further
increase inequality, which can be prevented through early access to evidence-based
interventions and support.
Most mental illness arises before adulthood and is a risk factor for adult mental illness.
Both prevention and early treatment can reduce a range of associated impacts across
the life course. Understanding the occurrence of predisposing factors allows prevention
measures and the planning of services and interventions to be targeted to reach areas
and population groups in most need.
Predisposing factors
There are a number of predisposing factors which can influence the chances of
experiencing a psychotic episode. Family history of schizophrenia is a significant risk
factor, with an approximate lifetime incidence of 6-17% for a first degree relative28.
However, the resilience of individuals and the balance of adverse and protective life
events and social and economic factors will influence whether this genetic risk
translates into psychosis.
Life events and social factors
Examples of life events which have been shown to increase the risk of experiencing a
psychotic episode are:
adverse childhood experiences (ACE), for example, child abuse, which includes:
physical, emotional, sexual abuse, bullying and neglect22,29
stressful life events such as death of a parent, family conflict, domestic violence
Although single severe stress events can carry risk, there is an increased risk of
developing psychosis with multiple events, and events which are associated with
chronic adversity carry the greatest risk30.
Examples of social and economic factors shown to be associated with psychosis:
early experience of alcohol abuse22
24Psychosis Data Report
heavy abuse of drugs including skunk, other forms of cannabis, kat and
amphetamines22,31,32
neighbourhood factors: the incidence of schizophrenia varies significantly from
place to place depending on characteristics of places such as population age,
sex, ethnicity; density22
economic environment: deprivation22
social environment: social capital and social fragmentation22
At risk mental state
Often psychoses are preceded by a phase known as ‘at risk mental state’ (ARMS).
NICE Clinical Guidance4 and the Melbourne Criteria33 state an individual is considered
at risk of developing psychosis if they are: distressed, suffering a decline in social
function and have:
transient or attenuated psychotic symptoms or
other experiences or behaviour suggestive of possible psychosis or
a first-degree relative with psychosis or schizophrenia
It is estimated that the median prevalence rate for subclinical psychotic experiences in
the general population is 5%34. The proportion of people with ARMS who develop a
psychotic episode is 18% after six months, 22% after one year, 29% after two years and
36% after three years35. French and Morrison36 and French et al.37 show how the
provision of ARMS processes and services lead to the detection and prevention of
onset of psychosis.
Prevention
With knowledge of psychosis predisposing factors, there are opportunities for
prevention at three levels:
primary prevention: addressing the wider determinants of health at population
level in order to prevent psychosis from developing
secondary prevention: early identification of ARMS and early intervention to
prevent the development of a psychotic episode
tertiary prevention: treating and supporting people with developed psychosis to
aid recovery and prevent or reduce the risk of recurrence
Primary prevention
Early childhood experiences have been found to have a lasting impact upon a child’s
mental health38, and 75% of mental health problems in adult life (excluding dementia)
start by the age of 1839. As such, initiating improvements in the mental health and
25Psychosis Data Report
wellbeing of children and young people, could deliver mental health improvement
across the whole life course. Early intervention can prevent young people falling into
crisis and later avoid expensive and longer term interventions in adulthood.
Addressing mental health issues of children and young people could be seen as an
important aspect of primary prevention. Having identified populations at risk, primary
prevention is possible through childhood, school40,41 and parenting interventions, which
are known to be effective in reducing mental health problems and promoting
resilience41.
Other interventions which tackle wider determinants of health, such as support in
reducing alcohol and drugs and help into education, employment and stable
accommodation, are also important in primary prevention.
Tackling stigma is another aspect of primary prevention. There may be reluctance in
seeking help early, when psychosis is developing, for fear of being set apart from peers,
suffering prejudice and discrimination and for fear of coercion and hospitalisation.
Secondary and tertiary prevention
Early identification of ARMS and early intervention to prevent the development of a
psychotic episode can be significantly cost effective to public services through reducing
loss of employment and diminished quality of life for the patient and family42. Effective
interventions to prevent or delay transition from ARMS to psychosis are needed to
address the significant personal, social, and financial costs associated with the
development of psychosis. Evidence suggests that early treatment with CBT may
prevent ARMS from developing into first episode psychosis43,44.
People experiencing first episode psychosis should have consistent early access within
two weeks of onset to a range of evidence-based biological, psychological and social
and biological interventions as recommended by NICE guidelines and quality standards
for psychosis and schizophrenia4,5,6,7. Family interventions for existing psychosis have
consistently demonstrated an ability to reduce relapse rates45,46. CBT for psychosis has
been shown to be effective in reducing the number of hospitalisations, bed day and
crisis contacts, there is also a strong indication that it reduces symptomatology and has
a positive effect on social functioning47,48. In the short and long-term supported
employment appears to improve employment outcomes, functioning and quality of life 4.
As part of delivering the recommendations in ‘The Five Year Forward View for Mental
Health’2, PHE is working with partners to develop a national Prevention Concordat
Programme for Better Mental Health, which will be launched in 2017. The programme
will focus on galvanising local and national action around the prevention of mental
26Psychosis Data Report
distress and mental illness, including psychosis. It will include developing resources to
support local areas to understand the mental health needs of their population through
an improved mental health needs assessment toolkit and commission the right mix of
provision to meet local needs, which will be supported by updated information about the
return on investment of various mental ill health prevention programmes. The work will
complement the work of the suicide and self-harm prevention strategy and will take
account of this psychosis data report.
Gaps in data and data quality concerns
Data is available to identify crude levels of population level risk factors such as ACE, for
example: looked after children49, children in need due to abuse, neglect or family
dysfunction and children on the child protection register50, and the use of drugs and
alcohol in children51 and adults52. However, it is not known if these metrics can reliably
measure the true levels of population psychosis predisposing factors. Further
assessment will be made into their possible inclusion in a future report.
The NICE quality standards6 propose structure, process and outcome measures to
monitor each of the eight quality standards covering the treatment and management of
psychosis and schizophrenia. Currently, audits are relied upon to allow monitoring of
secondary and tertiary prevention processes and interventions: examples of these
include the Early Intervention in Psychosis Audit (2016)12, National Schizophrenia
Audits (2011/12, 2013/14, 2015/17)11 and Commissioning for Quality and Innovation
payment framework (2014/15, 2015/16, 2016/17)53. Future routine data collection and
reporting will need to improve to allow more routine monitoring to take place.
Recommendations
There will be benefit in further consideration of metrics that help measure variation in
predisposing risk and protective factors of psychosis and which assess the
implementation and effectiveness of prevention interventions. Any metrics developed to
consider variation should be presented within NMHIN products and profiling tools.
27Psychosis Data Report
Access to, and quality of, commissioned
services
Context
The impact of psychoses in specialist mental health care
The 2014/15 HSCIC ‘Mental Health Bulletin: Annual Statistics’20, published in October
2015, reported that 1.8 million people in England used mental health services in the
year. The November 2015 CaP data from the MHLDDS13 shows that around 965000
people were in contact with mental health services at that point in time. Of these,
562000 were assigned to a cluster, with 176 000 in the psychosis supra cluster,
indicating that of people assigned to a cluster, one third were assigned to the psychosis
supra cluster. In a review of mental health care, it was found that 65% of adult acute
occupied bed days were taken by services users experiencing psychosis 54, varying with
bed type, with psychiatric intensive care units being highest. In perinatal units, 30% of
presentations were for psychosis55 and 70% of patients discharged from medium
secure forensic psychiatry services were diagnosed with psychosis56.
Implementing high-quality care
It is important that the quality of care delivered offers the greatest effectiveness and
highest standards to achieve the best rates of improved outcomes and return on
investment. The NICE quality standard QS806 includes eight quality statements
designed to enable measureable quality improvements in the treatment and
management of psychosis and schizophrenia, they are:
1 Adults with a first episode of psychosis start treatment in early intervention in
psychosis services within two weeks of referral
2 Adults with psychosis or schizophrenia are offered CBT for psychosis
3 Family members of adults with psychosis or schizophrenia are offered family
intervention
4 Adults with schizophrenia that have not responded adequately to treatment with at
least two antipsychotic drugs are offered clozapine
5 Adults with psychosis or schizophrenia who wish to find or return to work are offered
supported employment programmes
6 Adults with psychosis or schizophrenia have specific comprehensive physical health
assessments
7 Adults with psychosis or schizophrenia are offered combined healthy eating and
physical activity programmes and are helped to stop smoking
28Psychosis Data Report
8 Carers of adults with psychosis or schizophrenia are offered carer-focused
education and support programmes
‘Implementing the Five Year Forward View for Mental Health’3, published by the NHS
England in association with partners in July 2016 makes the delivery commitment that
by 2020/21, adult community mental health services will provide timely access to
evidence-based, person-centred care, which is focused on recovery and integrated with
primary and social care, and other sectors. This will deliver:
at least 60% of people with first episode psychosis starting treatment with a
NICE-recommended package of care with a specialist EIP service within two
weeks of referral
a reduction in premature mortality of people living with SMI; and 280,000 more
people having their physical health needs met by increasing early detection and
expanding access to evidence-based physical care assessment and intervention
each year
a doubling in access to individual placement and support (IPS), enabling people
with severe mental illness to find and retain employment
increased access to psychological therapies for people with psychosis, bipolar
disorder and personality disorder
Early intervention in psychosis
The NICE quality standard QS806 states: “Early Intervention in Psychosis services can
improve clinical and service outcomes, such as admission rates, symptoms and
relapse, for people with a first episode of psychosis.” NICE also found these services
reduce the likelihood of being detained under the Mental Health Act. Another study
found people under the care of an EIP service were more likely to be in employment
than those in traditional care (35% compared with 12%) and were at reduced risk of
suicide (from around 15% to 1%)57.
Early intervention for first episode psychosis has been shown to be significantly cost
effective in terms of the reduction in the use of crisis and inpatient services, improved
employment outcomes and reduction in risk of admission to hospital. In the short and
longer-term there are estimated net cost savings of £7972 per person after the first four
years and £6780 per person in the next four to 10 years, if full EIP provisions are
provided. Over a 10-year period this would result in £15 of costs saved for every £1
invested in EIP services18.
Currently, it is known that not all people experiencing first episode psychosis, or who
are at high risk of first episode of psychosis, are receiving the right care at the right
time12. There can be long delays in accessing the full range of NICE-recommended
29You can also read