ANNUAL OUTLOOK: THE PRICE OF OPPORTUNITY - Legg Mason
←
→
Page content transcription
If your browser does not render page correctly, please read the page content below
ANNUAL OUTLOOK:
            THE PRICE OF OPPORTUNITY
            WHAT OUR MANAGERS SEE AHEAD IN 2020

Past performance is no guarantee of future results. All investments involve risk, including possible loss of principal. This material is only for distribution in those countries and to those
recipients listed. Please refer to the disclosure information on the final page.

                                                   INVESTMENT PRODUCTS: NOT FDIC INSURED * NO BANK GUARANTEE * MAY LOSE VALUE
Our managers expect positive growth for the world economy
in 2020, but the pace may continue to slow. There will be
selective opportunities for gains, but at a price: episodes of
market volatility driven by political and policy concerns may
test investors’ resolve along the way.
3 KEY THEMES
Gradual Growth
Investors should expect global growth to advance in 2020, underpinned by the
largesse of central banks. But the pace of expansion may continue to slow, with
the potential for income and return somewhat muted.
Persistent Volatility
Some macro risks, such as an unruly Brexit, appear to be moderating, yet the U.S.-
China trade relationship remains a major source of uncertainty. Markets remain
highly sensitive to the news cycle and are likely to test investors’ patience during
the year amid shifting expectations on rates, politics, and earnings.
Cautious Confidence
The challenges surrounding markets now merit caution, but selective
opportunities continue to surface across asset classes for active managers with
specialized expertise and disciplined processes. Looking beyond traditional asset
classes, small-caps, real estate, emerging markets, infrastructure and alternatives
all merit consideration heading into the new year.
2GLOBAL FIXED INCOME
GROWTH RESILIENT DESPITE RISKS
While downside risks have risen, central bank stimulus and a strong U.S. consumer
should keep global growth positive.
Global growth prospects remain clouded by a Europe: Growth Sturdy, Risks
number of interconnected risks: a sustained decline Rising, All Eyes on Brexit
in global manufacturing activity due to ongoing
Looking ahead to 2020, we expect eurozone growth to
global trade tensions, a more pronounced slowdown
be around 1%, which reflects recent disappointments
in Europe and China, the possibility of policy
in soft data including service PMIs. While there are
missteps by developed market (DM) and emerging
many downside risks and some countries might be
market (EM) central banks, and newer flashpoints in
at the brink of a technical recession, we feel that the
Hong Kong and Saudi Arabia, with ramifications that
market has become too pessimistic. In addition, the
remain unknown.
European Central Bank (ECB) has restarted its asset
While downside risks have risen this year, we purchase program, linking its duration explicitly to
believe global growth should prove to be resilient inflation outcomes.
in 2020. We remain encouraged by the ongoing
We expect the German economy to accelerate in 2020
strength of the consumer globally and the
and a growth rebound in Italy on abating political noise.
enormous amount of monetary stimulus supplied
Other large eurozone countries could slow somewhat,
by both DM and EM central banks—the combined
but are likely to grow supported by accommodative
weight of these two forces should truncate
monetary and fiscal policies across the continent.
downside growth risks as we move closer to 2020.
Risks around this baseline for 2020 are skewed to the
In the U.S., we’re encouraged by a recent rebound downside; for example, if the service sector weakness
in consumer spending and a tentative improvement in soft data becomes more pronounced and starts
in manufacturing data. We see nothing in Fed policy showing up increasingly in hard data. Other key risks
nor in the ongoing growth rates of nominal GDP next year include a disorderly Brexit, higher crude
that would suggest any inflation spikes over the prices, and further trade escalation.
near- to mid-term.
Eurozone Growth Remains the Principal Source of
For the eurozone, while there are many downside Global Growth Worries
risks and some countries might be at the brink of Citi Economic Surprise Index, Jan 2019 through Sept 2019
a technical recession, we feel that the market has 80
Citi Economic Surprise Index
become too pessimistic and we look for growth to 60
recover modestly next year. 40
20
This macro backdrop, along with reasonably solid 0
credit fundamentals, is likely to continue to provide -20
strong technical support for corporate bonds. -40
The U.S. investment-grade market remains a -60
compelling destination for global investors given -80
its size, liquidity and attractive yield, relative to the -100
UK, Europe and Japan. With inflation declining in -120
many EM countries – which allows central banks to Jan 18 Mar 18 May18 Jul 18 Sep 18 Nov 18 Jan 19 Mar 19 May 19 Jul 19 Sep 19
lower rates and support economic activity – we also Source: Bloomberg. Reflects data through Sept. 25, 2019. Past performance
is no guarantee of future results. Indexes are unmanaged and not available
believe EM real yields look attractive with additional for direct investment. Index returns do not include fees or sales changes. This
information is provided for illustrative purposes only and does not reflect the
room to compress. performance of an actual investment.
3China: No Quick Fix year. Asian currencies and local bond yields may
benefit from the Fed dovish pivot amid subdued
China’s economy is slowing for both structural inflationary pressures. An emphasis on higher
and cyclical reasons at a time when the global carry currencies could help maintain a yield buffer/
economy is softening. Although USDCNY has advantage, noting that the yield spread between
traded above the 7.00 level, we do not consider the the JPMorgan Government Bond Index (Emerging
bilateral exchange rate to be of great significance Markets Asia) vs. the Citi World Government Bond
as Chinese policymakers have fixed the CNY via Index stands at over 250 bps (as at 30 September
a basket of trading partner currencies. On U.S.- 2019). In addition, Asian USD bonds, especially
China trade tensions, we do not expect to see issues by Asian investment-grade corporates,
a quick permanent turnaround in the near term, crossover credits and Asia sovereigns/quasi-
as neither country appears keen to concede sovereign entities can be key considerations for
meaningful ground. Looking ahead, escalating investors looking for a diversifier and yield enhancer.
tensions and uncertainty will continue to weigh
on sentiment, leading to further drags on capital Australia: Avoiding Stall Speed, For Now
expenditures and consumer confidence.
Growth in Australia has slowed in line with other
Asia in general looks well poised to provide fiscal DMs and we now expect growth of 2.0%-2.5%
easing to address near-term cyclical shocks from in 2019. Although a reluctant cutter, the Reserve
trade tensions and structural headwinds from the Bank of Australia (RBA) reduced rates three
global economy. Countries likely to increase policy times since June 2019 after almost three years
accommodation include Korea, Singapore, Hong on the sidelines and has maintained an explicit
Kong and Taiwan. Yet in EM economies, the case easing bias. The market has brought forward
for structural reforms, for removing more barriers expectations for the next rate cut, perceiving a
to foreign investment, increasing banking system greater likelihood of one more cut before year-end
liquidity to support domestic corporates and for and the possibility of further easing in 2020.
infrastructure investment remains critical. Recent
Additionally, we now expect growth of 2.0%-
data out of Thailand and even the Philippines
2.5% in 2019 as there are indications that the
suggest economic growth continues to decelerate,
housing market has bottomed. Although very
driven by a slowdown in external demand and
strong, jobs growth has failed to keep pace with
with domestic growth highly dependent on fiscal
record labor force participation over the past year,
impulse and execution. Inflation (or the lack thereof)
resulting in a small rise in the unemployment
supports the base case for more monetary support
rate, one of the key indicators the Reserve
even as central banks in Asia are increasingly aware
Bank of Australia (RBA) has explicitly targeted
that the challenges lie not just in policy rates but in
in its rate-setting deliberations. This would
still-weak transmission channels. Price pressures
point to at least another cut in the near term.
are subdued across Asia, with structural factors
such as informal employment and still-strong
demographic growth in EM Asia keeping wages low.
Against this backdrop, Asia local currency bonds
in selected markets such as China, India and
Indonesia could outperform broader EM this coming
4GLOBAL EQUITIES
CONSUMERS HOLD THE KEY
Equity markets may be volatile, but solid consumer spending should
help avert a U.S. recession.
U.S. Equities: Volatility but Growth • The wildcard among our consumer indicators is
The S&P 500 Index made new all-time highs in 2019, retail sales, which posted a surprise decline in
as on-and-off trade tensions with China eased, the September ahead of robust October jobs data.
Federal Reserve cut interest rates three times and • Monthly sales numbers can be noisy, but a drop
corporate earnings held up better than anticipated. in spending – which accounts for 70% of the U.S.
Strong market performance came against a backdrop economy – would be a major concern.
of weakening economic activity, reflected in the overall While volatility will likely remain elevated, a market
signal for the ClearBridge Recession Risk Dashboard drawdown next year is not imminent. In fact, over
turning yellow in June, indicating caution. the last 19 U.S. presidential election cycles, stocks
As we enter 2020, both the U.S. and global economies have suffered losses just twice in the 12 months
are clearly slowing; the key question is whether leading up to election day, delivering an average
we are on the cusp of a recession or a late-cycle return of 8%. Equities have also tended to do well in
slowdown. The economy typically sees an inflection periods following a yield curve inversion, especially
point six to nine months after tour Dashboard turns if no recession occurs, rising 13.5% on average in
yellow, so we should have confirmation by early next the subsequent 12 months. The 2-year/10-year U.S.
year of the severity of the current soft patch. Treasury yield curve inverted in August, suggesting
Our base case is for a slowdown within an ongoing that stocks could climb through most of next year.
economic expansion. While we expect the contraction Cyclicals have gotten a bid from the Fed easing, but
of the manufacturing sector to marginally worsen this rally could be short-lived; we do not believe the
as the ongoing trade war hurts business confidence manufacturing side of the economy is out of the
and slows capex, the consumer side of the economy woods yet. For example, corporate credit spreads at
should remain strong enough to avert recession. The the lowest quality ratings, which encompass energy,
labor market and wage growth are healthy, which industrials and some retail names, are at their widest
should underpin consumer spending, while the Fed levels in over a year.
has joined with central banks around the world in Instead, the likelihood of continued volatility in 2020
ramping up monetary accommodation. steers us to high-quality growth companies with
The potential strength of this support is reflected by strong moats around their businesses and more
all four consumer indicators in the dashboard flashing defensive areas of the market that have tended to
green, indicating expansion. hold up well during turbulent periods. Consumer
staples and utilities should continue to lead unless
• fter slowing in line with rising mortgage rates,
A
we see a clear resolution of the trade war and
housing permit growth has resumed since
improvement in global growth.
the Fed shifted its monetary policy stance and
mortgage rates eased. One of the benefits of these stocks is dividends,
particularly given the low yields on bonds in general.
• A strong October jobs print and upward revisions
It’s worth noting that through the third quarter of
for the prior two months are consistent with
2019, 42% of S&P 500 stocks had a higher dividend
jobless claims continuing to trend around 50-year
yield than the 30-year U.S. Treasury bond.
lows -- while job sentiment has improved after a
mid-year decline, with job openings outnumbering
unemployed workers by a significant margin.
5Dividend Stocks Look Attractive with a new moderate government in place. Fiscal
% of S&P 500 stocks with Dividend Yields stimulus is being discussed within the EU, which
> 30-year Treasury yield would be a clear positive. Brexit remains a wild
card with Prime Minister Boris Johnson calling
for December elections after his initial Brexit deal
was rejected by Parliament and the EU granted
an extension for a deal until the end of January.
European Equities Are Historically Cheap
Relative performance (in basis points) between
European and U.S. stocks
Source: FactSet as of 9/30/19. Past performance is no guarantee
of future results. Indexes are unmanaged and not available for direct
investment. Index returns do not include fees or sales changes. This
information is provided for illustrative purposes only and does not reflect the
performance of an actual investment.
International Equities Could Surpass Low
Expectations
Economic sentiment in most international regions
worsened over the course of 2019, which we Source: FactSet. Data as of 9/30/19. Past performance is no guarantee of
future results. Indexes are unmanaged and not available for direct investment.
believe sets a low bar for non-U.S. equities heading Index returns do not include fees or sales changes. This information is provided
for illustrative purposes only and does not reflect the performance of an
into 2020. Manufacturing data continued to weaken, actual investment. U.S. stocks are represented by the MSCI USA Stock Index.
yet consumers held up relatively well. We see European stocks are represented by the MSCI Europe Stock Index.
reasons for optimism that are underpinned by policy
moves. The European Central Bank has resumed Asia: Japan, China and emerging markets are very
a measured program of quantitative easing, and dependent on progress in trade talks. A positive trade
the U.S. Federal Reserve is lowering interest rates resolution should cause the U.S. dollar to weaken,
while China and Japan continue to provide ample which would most benefit emerging markets. How
liquidity. In past cycles, increasing money supply Beijing deals with the protests in Hong Kong and
has supported stock values after a several-month the ongoing trade standoff will provide important
lag, with the manufacturing sector picking up soon signs of where the global economy and equity
after. If we do not see a hardening of the U.S.- markets are headed. Geopolitical risks are a constant
China trade tensions, this could be the case again. but can represent opportunity for investors.
Europe: Valuations in the United Kingdom and
Europe are attractive, particularly compared with
U.S. equities (as indicated in the chart). European
stocks are at 50-year lows vs the U.S., which has
represented a good entry point the last two times
performance dispersions became this extreme.
Near-term risks in Italy are contained for now
6GLOBAL FIXED INCOME
GROWTH IN THE SLOW LANE
In addition to reduced trade tensions between the U.S. and China, there are several
points of support for the world economy.
OECD World Consumer vs. Business Confidence
Indexes, January 1985 through September 2019
Jack McIntyre, CFA, Anujeet Sareen, CFA,
Portfolio Manager Portfolio Manager
2020: Making Progress, But Still Stuck in
the Slow Lane
As we prepare for 2020, some market participants Source: Haver Analytics. Past performance is no guarantee of future results.
Indexes are unmanaged and not available for direct investment. Index returns
and investors remain concerned about whether do not include fees or sales changes. This information is provided for illustrative
a downturn in U.S. economic conditions could purposes only and does not reflect the performance of an actual investment.
precipitate a global recession. Rather than making However, the chart also shows that consumers
a recession call, we instead prefer to highlight the have been globally optimistic, including in the U.S.
factors that should support the global economy in In 2020, we believe consumer optimism and strong
2020 and turn the two-year slowdown into a period household fundamentals could lead business
of slow but sustainable growth. These supportive confidence higher. In particular, the U.S. consumer
factors include improving consumer fundamentals, could determine whether the domestic economy
improving economic indicators from emerging emerged from a mid-cycle slowdown or is headed
markets, impending reform, and the global backdrop toward a recession that could spread to the rest
of low inflation that has ushered in a wave of global of the world. We will be monitoring consumer
monetary easing. sentiment and expectations very closely in the U.S.
and beyond, to determine whether that continues to
Global Business Conditions Should Take buoy household spending, and eventually feed into
Cues from Consumers the business cycle by encouraging companies to
Looking at how 2019 unfolded, it’s easy to increase capital expenditures.
understand why optimism gave way to pessimism.
U.S.-China trade tensions escalated while the Positive Signs Emerge in Asia
Federal Reserve (Fed) neglected to modify policy The positive impact that global consumers could have
quickly and expand it broadly enough to offset on business conditions has become evident in Asian
the domestic consequences of this dispute, export activity. Following one of its deepest troughs at
which then fed into the global economy. These the beginning of 2019, Asian export volume rebounded
factors had a profound impact on global business significantly over the past few months despite
conditions, which took a significant hit in in 2019. headwinds from the trade dispute and the resulting
Both investment spending and business sentiment drag on China’s economic activity. Even countries with
declined, as shown below: significant ties to the Chinese economy—such as
7Taiwan, Singapore, and South Korea—took part in this Global Manufacturing PMI and Monetary Policy
recovery, underscoring the role of consumer demand Stimulus, Jan 1997 through October 2019
in the global economy, and how governments are
taking steps to preserve household health.
More Countries Are Expected to
Implement Reform
Australia is another example of an economy that
has significant ties to China. In 2020, we expect to
see more countries follow Australia’s lead, by taking
a multi-faceted approach to stimulus as a way to
buffer the lingering effects of weak economic activity
from the prior year. In Australia’s case, the governing
Liberal Party has pledged to pursue a pro-growth Source: Haver Analytics. Monetary Policy Stimulus reflects net difference
between central banks whose last move was a rate cut, versus those that
agenda while the Reserve Bank of Australia eases. did not. Past performance is no guarantee of future results. Indexes are
Although Australia runs a modest budget surplus, unmanaged and not available for direct investment. Index returns do not include
fees or sales changes. This information is provided for illustrative purposes only
it has some slack to implement reform and fiscal and does not reflect the performance of an actual investment.
stimulus intended to support households, improve
The tailwinds of easier monetary conditions should
infrastructure, and invest in potentially competitive
transmit into global economic activity in 2020 and
sectors. Therefore, we expect countries with
eventually push global manufacturing Purchasing
relatively stronger fiscal and external positions to
Manager Indices (PMIs) higher. While the chart
pursue fiscal stimulus in 2020. Since the efficacy
above shows global PMIs hovering at that crucial
of easier monetary policy from developed market
“50” mark, emerging market manufacturing and
central banks is expected to fade, generating a
services PMIs have remained expansionary in 2019,
growth impulse from government reform and fiscal
helping that broader metric stay in neutral territory.
stimulus should become increasingly important in
We expect emerging market PMIs will remain
2020 and beyond.
strong in 2020 and lend support to developed
Global Monetary Easing Should Register in markets. Similarly, strength from the services
the Economy sector of the global economy could also offset the
slowdown in manufacturing.
Most central banks around the world joined the
G3 in 2019 by easing monetary conditions, a trend This emerging market strength should come from
that should persist in 2020. For its part, the Federal lower policy rates—global short-term rates on a
Reserve (Fed) course-corrected three times to weighted GDP basis should stay around 2% in
address global headwinds and improve domestic 2020—targeted reform, and improved external
business conditions. The effects of these coordinated balances, including their current accounts.
easing efforts will continue to take time to register in
the global economy as shown in the chart below:
8Developed market manufacturing PMIs contracted Investment Implications
in 2019, likely dragged down by Germany and the The slump in Chinese economic activity significantly
broader eurozone economy, which have been contributed to global malaise in 2019, as the country
collateral damage in the U.S.-China trade dispute. attempted to structurally change its economy amidst
The regional bloc has exhausted monetary policy a trade dispute without implementing enough
and fiscal stimulus is needed. We have previously stimulus. Later in 2020, Chinese policymakers
invoked German and European Commission officials may pivot away from stimulus and refocus on
to leverage their twin surpluses to stimulate the generating organic growth. Meanwhile, emerging
regional economy. However, it will be an incredibly markets have run a combination of prescriptive
high hurdle to convince more member countries and policies to preserve industrial activity and consumer
European Commission officials to increase spending confidence. In aggregate, emerging markets are
to address flagging growth in 2020. running an approximate 1% current account surplus
on a GDP-weighted basis in spite of a challenging
A More Constructive Growth Outlook in 2020 macro backdrop. So long as emerging market
A weak global macro pulse has started to support central banks continue easing, we expect these
the world economy. For example, consumer improvements to extend into 2020. As economic
confidence remains high, Asian export volume activity outside the U.S. picks up in 2020, the
rebounds, emerging market PMIs remain relative growth differential should narrow and allow
expansionary, central banks ease in concert, and the U.S. dollar to weaken more broadly.
government budgets account for stimulus. While
these factors should bode well for the global
economy, the onus will nevertheless be on the
U.S. and China to rein in those risk factors that
precipitated the broad-based slowdown that started
in 2018. We will need to see credible progress in
terms of a trade deal, and sound policymaking from
the Fed and Chinese authorities. If these factors
were to crystallize, we expect that cyclical inflation
pressures would remain controlled, U.S. economic
growth would level off around 2% and Chinese
economic growth would rebound. The biggest risks
to this outlook include more policy inaction from
the Fed and Chinese authorities, or the onslaught of
political volatility related to the U.S. election cycle.
9REAL ESTATE
CAUTIOUS OPTIMISM AMID CHANGE
Demand for tech-friendly spaces and multi-family dwellings should help keep
commercial real estate on course in 2020.
Heading into its twelfth year, U.S. economic As such, Clarion Partners sees the most compelling
expansion has maintained solid momentum. A ongoing opportunities in industrial and multifamily,
strong macro environment and healthy property as well as a few alternative or specialty niche
fundamentals have supported U.S. privately-held sectors – such as medical office, life sciences/labs,
commercial real estate investment performance. The self-storage, senior housing, student housing, and
ongoing rise in occupancies, rents and asset values entertainment/sports.
has continued to offer attractive risk-adjusted returns. Going forward, key issues to watch are:
Institutional investor allocations to the asset • -commerce climbing to almost 50% of all
E
class have continued to increase. Average GAFO retail sales;3
target allocations to the real estate asset class • The continued and rapid rise in housing prices;
increased 10 basis points (bps) to 10.5% in 2019, • Faster job growth in tech-influenced U.S. cities
up approximately 160 bps since 2013.1 Investment (e.g. Seattle, Austin, the San Francisco Bay area,
sales momentum has been very strong year-to- and Boston);
date after a near peak level in 2018, and we expect • The shift by both aging Millennials and Baby
a strong year ahead in 2020 given the resilience Boomers to both low-tax and less costly areas
(e.g. the suburbs and Texas, Florida, Arizona,
of the U.S. expansion. U.S. transaction volume
and North/South Carolina);
reached $579 billion, the highest level so far in this
• Higher construction costs largely due to labor
expansion (just below the 2007 peak).2
shortages, which have impacted the pace of
Figure 1: Real Estate as a % of Institutional new development.
Investor Current & Target Allocations Clarion Partners’ outlook for 2020 is cautiously
optimistic. U.S. consumer spending remains strong,
buoyed by a tight labor market and record-high stock
market. The Federal Reserve is on an easing path,
having lowered interest rates three times in 2019
and injected $250 billion of liquidity into the repo
market. Low interest rates have led to historically
high asset values and ongoing appreciation
(excluding retail) at a time when top markets abound
with capital. We believe that U.S. commercial real
Source: Preqin. November 2019. Note: Based on over 8,000 global institutional
estate will continue to be a source of steady current
investors in database. Past performance is no guarantee of future results. income over the next year.
Indexes are unmanaged and not available for direct investment. Index returns
do not include fees or sales changes. This information is provided for illustrative
1
Cornell Baker Program in Real Estate and Hodes Weill & Associates. 2019
purposes only and does not reflect the performance of an actual investment. Institutional Real Estate Allocations Monitor. October 2019.
2
Real Capital Analytics. Q3 2019.
3
U.S. Census Bureau. Q3 2019. Note: GAFO = General merchandise stores,
Most key demand indicators have remained Clothing and clothing accessories stores, Furniture and home furnishings stores,
positive; however, growth has varied significantly Electronics and appliance stores, Sporting goods, hobby, book, and music stores
and Office supplies, stationery, and gift stores.
by region, industry, and property sector. Going
into 2020, influential investment themes include
the omni-channel consumer, affordable housing,
generational demographics, tech clusters, and
functional obsolescence.
10GLOBAL EQUITIES
SHIFTING THE GLOBAL BALANCE
Emerging markets could be poised to replace the U.S. as the main engine of
global growth as current trends normalize.
In the U.S., economic activity has been waning, In some cases, such as Russia, South Africa and
principally caused by trade tensions with China. Turkey this represents a rebound after years of
There are green shoots in the negotiations, but subdued growth. In most emerging economies,
as the tensions have escalated and tariffs have however, growth has remained intact and should
affected supply chains and product price inflation, the expand further on the back of widespread interest
economy has slid closer to recession. It is likely that rate cuts made throughout 2019.
the Federal Reserve will continue to provide liquidity
to the U.S. dollar, funding markets and cutting Europe
interest rates further to stimulate activity which European economies have been struggling with
should boost the economy in 2020. It is also possible demand weakness spreading from the automotive
that President Trump might seek a large tax cut for industry into wider manufacturing. The magnitude of
middle-income Americans to garner support for his the PMI declines now mirrors 2001-02 and 2014-
re-election. This would underpin equity markets, with 15, with the malaise spreading to Asia and North
consumer sectors set to benefit the most. America. Producers, distributors and purchasers
The UK is now looking very likely to exit the have been reducing inventories for some time
European Union at the end of January with a which has helped depress growth. As this ends, it
withdrawal deal in place. Brexit certainty should should lead to stabilization in the first half of 2020
bring with it a relief surge of economic activity, and hopefully improvement after the summer. It is
leading to European macroeconomic indicators important that the synchronized global slowdown
bottoming out and rebounding particularly the is brief, otherwise we will need to see emergency
manufacturing PMIs. Sectors such as autos, interest rate cuts to offset a global recession under
insurance and capital goods could do well as a which circumstances equities will suffer.
result. We should also see some better performance The UK general election may help break the Brexit
from those companies with a UK domestic focus as deadlock and therefore create a material investment
many are trading at appealing valuations versus their opportunity. This relies on the composition of the
own history. But we do need to see a resurgence next government: for equities, the best result
in capital investment in Europe to ensure that is a decent Conservative majority. Under this
productivity and corporate earnings rebound to scenario we would expect UK domestic stocks to
drive stocks higher over the longer term in our view. materially outperform as the new government takes
Some fiscal stimulus may be required by countries fiscal action to stimulate the economy, corporate
such as Germany, which currently find themselves investment levels improve as uncertainty is
bogged down in a technical recession. removed and risk premiums fall. The more complex
We expect emerging economies to see stronger the general election result, the more likely that
domestic growth in 2020 and once more become Brexit will be delayed, Sterling will weaken, and the
the main engine of global growth. Yet there are FTSE will materially outperform domestic equities.
risks in the form of international trade disputes, 2019, like 2017, has seen unusually low market
public protests and uncertainty within post-Brexit volatility. With central banks coming to an end of
Europe that could leave investors seeking refuge their rate cutting, we are likely to see a return to
in safer assets. We believe many emerging market higher levels of volatility. In recent years, equities
economies will see an uptick in growth in 2020. have been boosted by slower economic growth due
11to the central bank dovishness; however, a global Emerging Markets
recession would likely see equities materially Throughout 2019, the direction of emerging markets
de-rate. It would be hard to have accelerating was dictated by each new development in the
earnings forecasts when GDP growth and inflation U.S.-China trade negotiations. No one has given
are likely to be below 1%. up hope that good sense will prevail, but with only
Asia limited resolution to date, trade concerns will remain
front of mind for investors in 2020. Against this
In Asia we view the bottoming of earnings
backdrop, we expect emerging market investors will
expectations, coinciding with basing-out of global
look to secular growth sectors such as health care,
PMI data, as near-term market catalysts. Valuations,
education, cloud computing and clean energy as
especially asset-based metrics, are supportive. The
sources of relative strength within the asset class.
ratio of earnings upgrades to downgrades in Asia
has been exhibiting signs of stabilisation and may At a regional level, China’s policy objectives in
have already bottomed – any modest improvement recent years have been as much focused on the
in the underlying business environment will filter sustainability and quality of economic output as
swiftly into this ratio and drive stock prices higher. they have been the absolute level of growth. We
Several factors are causing this stabilization and expect this trend to continue in 2020 and would
could act as potential catalysts for more sustained not be surprised to see growth slip below 6%.
improvement: This still leaves China as one of the highest-growth
economies and we believe Chinese equities will
• Coordinated monetary policy relaxation
continue to attract increasing interest from global
within the region and globally, combined with
investors. Of particular note, China is implementing
increasing adoption of more supportive fiscal
corporate bankruptcy policies that are very
policy measures.
recognizable to Western investors.
• The U.S. dollar has strengthened steadily since
Meanwhile, India is introducing far-reaching labor
the end of Q1 2018, amid a deceleration of
reform policies; this is a necessary condition for
global economic growth. This is typically not
India’s emergence as a regional manufacturing
supportive of Asian stock prices, so a dissipation
powerhouse. Enactment of these policies is not
of the dollar appreciation impetus would likely
guaranteed, but they could be attractive for global
be a positive for Asian stocks.
manufacturers while also reducing costs for local
• Stable or lower energy prices. Strong energy manufacturers and creating the right incentives for
prices are a tax on growth for Asia given that smaller companies to scale up. All of this would
most countries in the region are net importers. enable more workers to enter the formal economy.
• asing of trade tensions between the U.S. and
E Elsewhere, 2020 looks set to be a challenging year
China – tensions between these two countries for politicians in Latin America as populist demands
may be a persistent feature for many years to and ideological divisions are likely to set a tricky path
come; however, a workable trade agreement, for progress. The incoming government in Argentina
including a de-escalation of the tariff regime, is stepping into the midst of a currency crisis and
would be an obvious positive for the business facing demands for wealth distribution from a
environment. disillusioned populace. Dissatisfaction with the level
of wealth distribution was also behind recent riots
12in Chile and has forced the government to back
down on proposed price hikes in public services.
On a more positive note, Brazil looks well placed to
drive through pension reform, a keystone in building
future confidence in the country’s public finances.
Australia
The Australian economy retains viable options to
boost growth given low government debt and a
fiscal surplus. Fiscal stimulus is likely to be far more
effective than monetary easing in boosting activity
and incomes. Economic growth is benefiting from
the low Australian dollar, strong commodity prices
and strong population and employment growth;
however, disposable income growth is stubbornly
low because of the high tax take.
The current uncertain global and political environment
has caused weaker recent growth data. High
household debt, restrictive household lending, falling
investment income and falling iron ore prices pose
tail risks. Government tax cuts, the recent interest
rate cuts by the Reserve Bank of Australia (RBA) and
easing of residential housing credit restrictions are
positive for the economic outlook. While index equity
valuation levels are fair to high, this hides a large
divergence between premiums for defensive/quality/
growth assets versus cyclical/value assets. This
dispersion has parallels to past turning points such as
the global financial crisis and the tech bubble.
13ALTERNATIVES
LOOKING BEYOND THE U.S.
Conditions that have favored the U.S. are eroding, while risks that
have held back the rest of the world may be dissipating.
Central banks have, once again, begun a As a result, “U.S. exceptionalism” may wane. The
synchronized easing cycle. There is a near-unified environment would become negative for the U.S.
commitment by central banks globally to keep dollar. It is possible, with improved economic
rates low -- and in many cases negative -- for the momentum, to see a cyclical recovery and reflation
foreseeable future. That was largely in response theme take hold. Emerging market assets may
to a deteriorating growth outlook in the U.S., led by finally start to outperform, and EM currencies would
increased trade tensions in May. Chinese stimulus outperform more defensive developed market
policies, up until recently, had been too measured to currencies.
be effective in supporting global growth. Additionally, cyclical and value-driven equities would
As a result, U.S. assets outperformed; equities outperform. This is an out-of-consensus view that
and bonds performed well, and the U.S. dollar would be supported by positioning as it is under-
was resilient relative to other currencies especially owned in investors’ portfolios that have been focused
in emerging markets. While global growth on growth and low volatility, defensive sectors
is undoubtedly slowing and the IMF recently recently. Early September 2019 hinted at how
downgraded growth to 3% for 2019, the lowest level powerful a reversal in long-held positioning could be
since the Global Financial Crisis (GFC), that does not on certain segments in the market
necessarily mean a recession is imminent. Other risks, primarily political in nature, also
In Q3 2019, China adopted broader stimulus support ROW (i.e. rest of world) vs. the U.S. The
measures, both fiscal and monetary, which combined impeachment fight could lead to volatility in financial
with accommodative monetary policy and easier markets and the 2020 election cycle will really heat
financial conditions globally may support renewed up and the potential for left-leaning candidates to take
economic momentum. Additionally, the two primary the Democratic nomination could further pressure
tail risk events, Brexit and U.S.-China tensions, are markets. Being able to capitalize on volatility in 2020
potentially dissipating and will soon be either behind will be increasingly important to navigate uncertain
us or diminished in impact. political, economic and market outcomes.
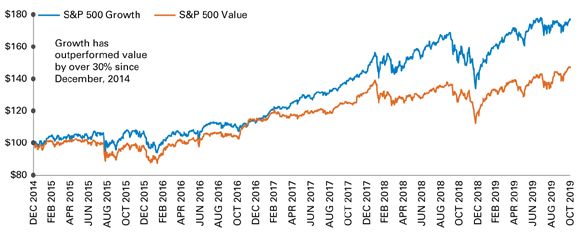
Growth vs. Value: Growth of $100
Source: Bloomberg as of Sept. 30, 2019. Past performance is no guarantee of future results. Indexes are unmanaged and not available for direct investment.
Index returns do not include fees or sales changes. This information is provided for illustrative purposes only and does not reflect the performance of an actual
investment. Growth is represented by the S&P 500 Growth Index. Value is represented by the S&P 500 Value Index.
14SMALL-CAP STOCKS
POSITIVE SIGNS FOR SMALL-CAPS
Conditions today are similar to past periods that led up to solid gains for the asset class.
Most investors also know that an accommodative
Fed has been good for equity returns regardless
of cap size. If we add environments when the Fed
Funds rate was lower than it was 12 months prior
with those periods of low ISM Manufacturing Index
readings, the subsequent small-cap results were
even stronger, with an average subsequent 12-month
Steve Lipper, return under these dual conditions of 24.3%.
Senior Investment Strategist
Small-Cap Results inTwo Scenarios vs. Long-Term
Looking ahead to 2020, we see three favorable
Rolling Average
factors in place for small-cap stocks: a slow economy, Russell 2000 Monthly Rolling 1-Year Returns by Starting ISM Level (%), From
an accommodative Fed, and the calendar, all of which 12/31/78 through 9/30/19
add up to positive prospects for this asset class.
That conviction reflects our recent research into what
had happened historically when market, monetary, and
seasonal conditions were similar to what we have in the
U.S. today. This research uncovered some interesting
historical patterns that offer a sizable measure of
encouragement to small-cap investors now.
When economic, monetary, and market conditions
have looked similar to today’s, small-caps have
enjoyed subsequent returns nearly twice their
historical average while avoiding losses the
vast majority of the time. This three-ingredient Source: FactSet as of 9/30/19. Past performance is no guarantee
cocktail is near-term weak economic growth, an of future results. Indexes are unmanaged and not available for direct
investment. Index returns do not include fees or sales changes. This
accommodative Fed, and positive seasonality. information is provided for illustrative purposes only and does not reflect the
performance of an actual investment.
Most investors are aware that small-caps are more
subject to cyclicality than their large-cap siblings and The percentage of periods in which investors avoided
that small-caps typically do well when the economy a loss in these environments was also striking—
is expanding. However, many investors may not be and are especially relevant for cautious investors
aware that the weaker the current economy, the concerned about preserving capital and avoiding
stronger subsequent small-cap returns tend to be. losses. In periods with both low economic readings
and an accommodative Fed, small-cap returns were
Our analysis began by taking an investment start
positive in 82% of all one-year periods, 91% of two-
date during months when the ISM Manufacturing
year periods, and 99% of three-year periods.
Index was in the bottom 25% of its historical
readings—that is, less than 49.3—since 1978. From
those low points, the subsequent average 12-month
return for the Russell 2000 Index was 21.4%
compared with 12.8% for all 12-month periods since
the small-cap index’s 1978 inception.
15Percentage of Periods with Positive Russell 2000 The Historical Impact of Seasonality
Returns (%)*, 12/31/78 through 9/30/19 Average Returns for the Russell 2000, 12/31/78 – 9/30/19
*In Periods With Near-Term Weak Economic Growth and an Accommodative Fed
Source: FactSet as of 9/30/19. Past performance is no guarantee of future
results. Indexes are unmanaged and not available for direct investment. Index
returns do not include fees or sales changes. This information is provided for Source: FactSet through 9/30/19. Past performance is no guarantee of
illustrative purposes only and does not reflect the performance of an actual future results. Indexes are unmanaged and not available for direct investment.
investment. Index returns do not include fees or sales changes. This information is provided
for illustrative purposes only and does not reflect the performance of an actual
investment.
The final component to this bright outlook for
small-cap performance is seasonality. Across the
With all three of these positive conditions currently
globe, equities as a whole have enjoyed higher
present—low ISM Manufacturing Index readings, an
historical median returns from October through
accommodative Fed, and positive seasonality—we
March than they have from April through September.
think the prospects for small-caps are attractive now.
Explanations vary as to the cause of this pattern, but
regardless of the reasons, we think it’s important that
investors know about it. For the Russell 2000, the
historical median return for the six-month period from
October through April was 8.9%, while it was only
4.4% for the April through September period.
16MULTI-ASSET INVESTING
UNCERTAINTY ON THE HORIZON
Late-cycle market concerns make turbulence more likely in US equities –
but the underlying issues may generate opportunity elsewhere.
Despite significant bouts of volatility, equity markets Middle East and Hong Kong, among others, have
have continued to march on, surpassing record heightened investor fears and sparked volatility in
highs several times in 2019. At end of the October equity markets. Furthermore, a number of warning
2019 , U.S. equities had returned over 450% since signals have begun to flare, including the inversion
the March 2009 Global Financial Crisis bottom. of the 2- and 10-year segment of the U.S. yield
Investor optimism has been supported by three curve in August and expectations of lower equity
successive interest rate cuts by the U.S. Federal market returns as we enter the latter stages of this
Reserve and, more generally, hints of a return to protracted expansion.
expansionary monetary policies by central banks While an inversion in the yield curve is typically
across the globe, coupled with the promise of a associated with recession, it is key to note that
U.S.-China trade agreement. historically, an inversion in the U.S. yield curve has
However, uncertainty lurks on the horizon. preceded a recession by an average of 14 months
Recurrent tensions in U.S.-China relations, lack and in multiple cases the period between one
of clarity in the implementation of Brexit, soft (the inversion of the yield curve) and the other
economic data and geopolitical tensions in the (recession) has been closer to two years.
Time between U.S. Yield Curve Inversion (2 years - 10 years) and Recession
Source: Bloomberg. Past performance is no guarantee of future results. Indexes are unmanaged and not available for direct investment. Index returns do not include
fees or sales changes. This information is provided for illustrative purposes only and does not reflect the performance of an actual investment. Short-term dated bond
yield is represented by the 2-year yield index and long-term yield represented by the 10-year bond yield. Time to recession is calculated as the time between the final
sustained inversion of the yield curve prior to the recession, and the onset of recession.
17Additionally, as shown below, it is worth noting that Defensively oriented stocks can lower overall
U.S. equity market returns have been exceptionally portfolio volatility and dampen drawdowns
robust prior to a peak in equity markets. while allowing for equity market participation.
Against this backdrop, investors confront two Dividends typically become a larger and more
seemingly conflicting objectives; how to maintain stable component of total return in low return
equity market participation (for capital growth), environments and lower volatility profiles may
while limiting vulnerability to a late-cycle correction mitigate drawdowns during periods of market
or negative market shock (for capital preservation). turbulence. Defensive equity income strategies may
Repositioning portfolios away from cyclical, high- help investors prepare their equity allocations for a
beta stocks, and diversifying into defensively turbulent, yet potentially profitable 2020.
oriented stocks that pay sustainable dividends is a
compelling strategy.
Historically Robust Equity Returns Pre-Peak Average Total Equity Return 1945-2018 (%)
Source: FactSet, Robert Shiller, S&P 500 Index, JP Morgan Asset Management. Chart is based on return data from 11 bear markets since 1945. A bear market is
defined as a decline of 20% or more in the S&P 500 Index. Monthly total return data from 1945-1970 is from the S&P Shiller Composite Index. From 1970 to present,
return data is from Standard & Poor’s. Past performance is no guarantee of future results. Indexes are unmanaged and not available for direct investment. Index
returns do not include fees or sales changes. This information is provided for illustrative purposes only and does not reflect the performance of an actual investment.
18INFRASTRUCTURE
HOW INFRASTRUCTURE IS EVOLVING
A renewed focus on projects related to sustainability and climate change bodes
well for infrastructure stocks, despite market pessimism about growth.
2019 has seen a continuation of the trend of However, fiscal stimulus has been slow and small in
decelerating global growth, but we believe this has contrast to the slowdown that we’ve seen in global
likely troughed for key economies – think of it as a growth (Chinese stimulus, in particular, has been
late-cycle pause rather than a slide into recession. lackluster). We believe this has underpinned the
Inflation was missing in action in 2019, and we global social upheaval that has been more prevalent
see no signs of a breakout anytime soon -- which in 2019 and will provide the backdrop for potential
should result in bond yields being lower for longer. changes in the political landscape in 2020.
During 2019 RARE reduced its long-term bond Political uncertainty and the shift toward nationalistic
yield forecasts; we feel there is still a dispersion policies and approaches have created uncertainty
of market views on this topic, but participants are for corporates and delayed investment decisions.
trending toward a lower yield environment Infrastructure has been spared this theme as
Central banks continue to move to the regulators continue to approve projects driving near-
accommodative end of the spectrum, and we see record asset base growth and giving certainty to
that trend continuing into 2020, anchoring yields at future earnings growth across the sector.
the lower end of recent trading ranges. We have Market perspective and infrastructure
seen a steady decline in the markets’ expectations positioning
for where bond yields will track over time.
We are at the latter stages of the economic and
Market Forecast of 10-year U.S. Treasury Yield market cycle. However, the market has been too
in 2 Years pessimistic for growth for 2020 (particularly in the
U.S. where in late 2019 we estimate that consensus
had a 40% chance of a 2020 recession priced in)
leading to a cycling toward growth and value from
defensive stocks. We expect this to continue into
at least mid-2020. However, we recognize the
latter stages of a market cycle are characterized by
periods of market volatility, and we have certainly
seen that in 2018 and 2019.
Source: Bloomberg. Past performance is no guarantee of future results.
Indexes are unmanaged and not available for direct investment. Index returns The challenges to this upbeat thesis may come from:
do not include fees or sales changes. This information is provided for illustrative
purposes only and does not reflect the performance of an actual investment. • Underlying macroeconomic data not recovering
This could lead to a further expansion of earnings as quickly as the market expects and hence
multiples for equities as the market factors in a pressure on earnings growth expectations
lower cost of capital in the long term. (for example, in late 2019 earnings growth of
10% for 2020 in Europe seemed optimistic)
There is now general acceptance that monetary
policy has become less effective, and that central • Continued sensitivity around FX, with the
banks don’t have the levers to offset a large eurozone and China both needing a lower
downturn. Negative interest rates and QE are not currency, but with weaker countries and EMs
the silver bullet to offset slower growth and virtually threatened by a higher U.S. dollar. Currency wars
absent productivity improvements (jobs growth isn’t will likely continue ad infinitum
resulting in quality-of-life improvements anymore).
192020 will likely see increasing pressure on public development of renewable energy and drive toward
policy from a range different, but connected greater electrification in the future. Governments
directions. Central banks will want fiscal stimulus for are setting targets for renewable-energy-sourced
economies, climate change activists will continue electricity (EU 32% by 2030, California 60%
to pressure for change, and populist groups will by 2030, Virginia 0% carbon by 2050) and the
pressure for governments to ease cost of living Bloomberg New Energy Finance researchers expect
pressures and begin to address wealth gaps. The 80% of new capacity growth through 2050 will
direction and evolution of public policy will have come from renewables.
critical implications for markets in 2020. Meanwhile, significant capital is being spent to
The importance of earnings growth and confidence mitigate the effects of climate change and adapt
that companies will not disappoint continues to networks and infrastructure to cope with more
support higher multiples in the infrastructure sector, volatile climatic events (such as ice storms, wildfires),
which are now at the high end of the relatively increase the efficiency of infrastructure (development
tight trading range since the global financial of electricity storage) and reduce wastage (leaking
crisis. Current multiples appear reasonable given pipes in water networks). This is driving near-record
confidence in the underlying growth in asset bases rate base growth across the sector.
driving growth in earnings, cash flows and dividends We expect infrastructure to be the centerpiece of
across the sector. several governments’ desires to stimulate their
Key drivers for infrastructure in 2020 economies with the building of infrastructure
utilizing local labor, local materials and improving
We have seen a broader global acceptance of the efficiency of local economies. The U.S. election
ESG principals in investing, with investors actively campaign will likely see “green” infrastructure
adjusting positions to take account of this. We programs gain momentum.
believe the market has been too focused on the “E”,
with not enough focus on the “S”:
• This is creating opportunities where companies
operating “dirty” infrastructure are out of
favor. For most of these companies, regulators
approved the original expenditure and building
of, for example, coal-fired generation, and will
continue to provide appropriate returns on that
investment
• An upcoming challenge is the pressure placed
on household bills from the speed of changing
from fossil fuels to renewables
Infrastructure will likely continue to be in the
headlines for all the right (and wrong) reasons.
Global initiatives to reduce carbon emissions are
resulting in local actions to support the continued
20Forecasts are inherently limited and should not be relied upon as indicators of actual or future performance.
Any information, statement or opinion set forth herein is general in nature, is not directed to or based on the
financial situation or needs of any particular investor, and does not constitute, and should not be construed
as, investment advice, forecast of future events, a guarantee of future results, or a recommendation with
respect to any particular security or investment strategy or type of retirement account. Investors seeking
financial advice regarding the appropriateness of investing in any securities or investment strategies should
consult their financial professional.
Yields represent past performance and there is no guarantee they will continue to be paid.
Active management does not ensure gains or protect against market declines.
Dividends represent past performance and there is no guarantee they will continue to be paid.
Investments in small-cap and mid-cap companies involve a higher degree of risk and volatility than
investments in larger, more established companies.
Investment in real estate entails significant risks and is suitable only for certain investors as part of an
overall diversified investment strategy and only for investors able to withstand a total loss of investment.
Currencies contain heightened risk that include market, political, regulatory and natural conditions and may
not be suitable for all investors.
U.S. Treasuries are direct debt obligations issued and backed by the “full faith and credit” of the U.S.
government. The U.S. government guarantees the principal and interest payments on U.S. Treasuries when the
securities are held to maturity. Unlike U.S. Treasury securities, debt securities issued by the federal agencies
and instrumentalities and related investments may or may not be backed by the full faith and credit of the U.S.
government. Even when the U.S. government guarantees principal and interest payments on securities, this
guarantee does not apply to losses resulting from declines in the market value of these securities.
Definitions:
”Brexit” is a shorthand term referring to the UK vote to exit the European Union.
“USD” refers to the U.S. dollar, the national currency of the United States.
FX, or foreign exchange, is a reference to exchange rates among currencies.
GAFO, or General Merchandise, Apparel and Accessories, Furniture and Other Sales (retail sales categories)
represents sales at stores that sell merchandise normally sold in department stores.
Research and development (R&D) refers to corporate activity intended to create and deploy new
technologies, products, and services.
G3 refers to the world’s top three developed economies: US, Europe and Japan.
U.S., or American exceptionalism refers to the idea that the history of the United States is inherently
different from those of other nations and has conferred special advantages in its historical development.
The Federal Reserve Board (“Fed”) is responsible for the formulation of U.S. policies designed to promote
economic growth, full employment, stable prices, and a sustainable pattern of international trade and payments.
The federal funds rate (fed funds rate, fed funds target rate or intended federal funds rate) is a target
interest rate that is set by the FOMC for implementing U.S. monetary policies. It is the interest rate that banks
with excess reserves at a U.S. Federal Reserve district bank charge other banks that need overnight loans.
The European Union (EU) is an economic and political union established in 1993 by members of the
European Community. The EU now comprises 28 countries after its expansion to include numerous Central
and Eastern European nations.
The European Central Bank (ECB) is responsible for the monetary system of the European Union (EU) and
the euro currency.
21You can also read