FY 2020 Earnings Call Presentation (pages 2-28) & Investor Presentation (pages 29-50) - EQS Group

Page created by Janet Sutton
 
CONTINUE READING
FY 2020 Earnings Call Presentation (pages 2-28) & Investor Presentation (pages 29-50) - EQS Group
FY 2020
Earnings Call Presentation    (pages 2-28)

& Investor Presentation (pages 29-50)

March 4, 2021
FY 2020 Earnings Call Presentation (pages 2-28) & Investor Presentation (pages 29-50) - EQS Group
Consistent Strategy Execution since IPO
Business Built for Long-term Growth

                                IPO                                                Today
                                                Rental & Value-add (efficient, scalable B-to-C operating business).
    Business            Rental and condo
                                                Development (profitable business & our answer to supply/demand imbalance).
     Scope              sales
                                                Recurring sales (track record of ~2.5k p.a. at 30%+ gross margin).
                                                     85% - 15 urban growth regions.
  Geographic            Legacy portfolio              9% - Stockholm, Gothenburg and Malmö.
    Scope               all across Germany            5% - Mostly Vienna.
                                                      Small stakes to prepare and be ready for potential future growth.
                        Plans for insourcing
    Vertical                                    Vonovia’s in-house Service Center, Craftsmen Organization and
                        strategy yet to be
  Integration                                   Residential Environment Service Team are a clear USP in Germany.
                        implemented
                                                Track record of >300k units acquired with swift deal execution and
                                                subsequent integration; appetite for more.
                        Self-image of
                                                (i) Low cost of capital, (ii) best-in-class platform with lowest operating costs,
       M&A              market consolidator
                                                and (iii) committed strategy for decarbonizing the portfolio are competitive
                        yet to be proven
                                                advantages that will lead to accretive acquisition opportunities in the
                                                future.
                                                Scalability proven for German portfolio.
                        Concept introduced
                                                Next step: replicate efficient platform with increasing EBITDA margins and
                        at IPO but met
   Scalability                                  declining costs per unit outside of Germany to prove it is not a German
                        with substantial
                        doubt
                                                phenomenon but the Vonovia business model.

                                                Business is firmly anchored around sustainability.
 Sustainability         Not a focus
                                                Binding climate path in place for CO2 neutral portfolio by 2050.
                        Starting a new
                        chapter after years     Increasingly recognized as a reliable partner by local communities.
   Reputation
                        of private equity       Stakeholder approach on fundamental environmental and social issues.
                        ownership

FY 2020 Earnings Call & Investor Presentation                     page 2
FY 2020 Earnings Call Presentation (pages 2-28) & Investor Presentation (pages 29-50) - EQS Group
Impeccable Track Record of Consistent & Sustainable Growth
Confident to Maintain Earnings and Value Growth Going Forward

    FFO (€/share)1                                                                                                     Dividend (€/share) – 70% payout ratio from FFO

                                      +14% CAGR

                                                                                   2.38
                                                                        2.25                                                                            +14% CAGR
                                                             2.06
                                                 1.90
                                      1.63                                                                                                                                                         1.692
                                                                                                                                                                                          1.57
                                                                                                                                                                                 1.44
                           1.30                                                                                                                                      1.32
                                                                                                                                                          1.12
     0.95       1.00                                                                                                                          0.94
                                                                                                                       0.67       0.74

    2013       2014        2015       2016       2017       2018       2019       2020 2021(E)                         2013       2014        2015       2016        2017       2018      2019     2020 2021(E)

    Adj. NAV (€/share)                                                                                                LTV and Interest Cover Ratio

                                           +15% CAGR
                                                                                                                                                                                                  4.9       4.8
                                                                                                                                                                            4.6          4.7
                                                                                             59.5
                                                                                 52.0                                 49.0%        49.3%
                                                                                                                                                46.9%          3.7
                                                                    44.9
                                                        38.5                                                                                      3.0
                                                                                                                                     2.7                                                42.8%    43.1%
                                           30.8                                                                                                              41.6%                                         41.1%   Equity
                                                                                                                        2.2                                               39.8%                                    hybrid
                  22.7         24.2
     21.7

     2013         2014        2015         2016        2017         2018        2019         2020                      2013         2014         2015         2016         2017         2018     2019      2020
                                                                                                                                     LTV (%)               Interest cover ratio         target range

1   Based on prevailing internal management KPI, which was FFO1 from 2013-2018 and Group FFO starting in 2019.   2   To be proposed to the Annual General Meeting on April 16, 2021.

FY 2020 Earnings Call & Investor Presentation                                                          page 3
FY 2020 Earnings Call Presentation (pages 2-28) & Investor Presentation (pages 29-50) - EQS Group
Agenda
                   1. FY2020 Results                                                 2. Investor Presentation                  3. Additional Information

     Together with renowned Fraunhofer Institutes, Vonovia is implementing a 3yr-hands-on                       Innovation Lab Bochum Weitmar
     innovation project as part of Open District Hub e. V. in our neighborhood in Bochum-
     Weitmar to develop and test new technologies in ongoing operations.                                        Energy for the Future
     The aim is to supply the neighborhood with largely carbon-neutral electricity & heating.
     We aim to achieve this by linking the energy sectors via a central platform.                                                              5
     A smart, self-learning energy management system then ensures that the right energy is
     distributed to tenants when they need it – at electric charging stations, in the form of
                                                                                                                                                              6
     electricity for tenants’ own households or in the form of heating.                                                       7

                                                                                                                      1
      Level              Measure
                         Implementation of measures that do not involve any structural intervention, e.g.,
                     1   optimized heating system settings
   Apartment
                     2   Digitalization of buildings and apartments, e.g., to feature smart meters                                8

                         Energy-efficient refurbishment, e.g., measures relating to the building shells and
                     3   heating systems                                                                        2

    Building         4   Infrastructure for e-mobility, e.g., charging stations and e-wall sockets                                      3

                     5   Sustainable energy supply, e.g., photovoltaic systems for tenant electricity

                                                                                                                                       4
                     6   Building digitalization and networking

                         Sector coupling (heat, electricity, mobility, etc.) in the neighborhood via digital
                     7   platform
Neighborhood             Storage and distribution of energy generated in a decentralized structure enables
                     8   on-site consumption

                     9   Promotion of biodiversity                                                                        9

             1.                                                    2                                                     3
           FY2020                                               Investor                                             Additional                              See
                                                                                                                                                             Page
           Results                                            Presentation                                          Information                             Finder
                                                                                                                                                           on page
                                                                                                                                                            85 for
                                                                                                                                                           detailed
         pages 4-28                                                 pages 29-50                                     pages 51-85                             index

FY 2020 Earnings Call & Investor Presentation                                               page 4
FY 2020 Earnings Call Presentation (pages 2-28) & Investor Presentation (pages 29-50) - EQS Group
Agenda FY 2020 Results
                   1. FY2020 Results                            2. Investor Presentation   3. Additional Information

                                       6        Highlights

                                   7-14         Segment Results

                                 15-19          NAV & Valuation

                                 20-21          LTV & Financing

                                 22-24          Update on Regulation

                                 25-26          Update Sustainability

                                       27       Guidance 2021

                                       28       Wrap-up

FY 2020 Earnings Call & Investor Presentation                          page 5
FY 2020 Earnings Call Presentation (pages 2-28) & Investor Presentation (pages 29-50) - EQS Group
Highlights FY 2020
Another Successful Year
                   1. FY2020 Results                              2. Investor Presentation                     3. Additional Information

                               Robustness and stability of the business model clearly proven
   Milestones                  Social responsibility and stakeholder reconciliation particularly evident during the pandemic
                               Substantial ESG progress with sustainability now firmly anchored in our business model

                               Total Segment Revenue €4,370.0m (+6.3%)
                               Adj. EBITDA Total €1,909.8m (+8.5%)
  Performance
                               Group FFO €1,348.2m (+10.6%) and €2.38 per eop share (+6.0%)
                               3.1% organic rent growth (3.6% excluding the one-off rent reduction in Berlin)

                               9.4% l-f-l total value growth (7.5% from performance & yield compression plus 1.9% from investments)

     NAV &                     Adj. NAV €59.47 per share (+14.4%)
    Valuation                  “Brick and mortar” EPRA NTA €62.71 per share (+14.3%)
                               “Beyond the bricks” EPRA NRV €77.18 per share (+12.9%)

                               LTV 39.4% (-370bps ytd) and 41.1% incl. the perpetual hybrid
     Capital
                               Net debt/EBITDA multiple 12.3x (+80bps)
    Structure
                               Latest issuance: €500m bond with 20-year maturity and 1% coupon

                               Sustainability Performance Index (SPI) introduced as a binding commitment to ESG
                               SPI starting point in 2020 established and 2021 guidance alongside operational and financial KPIs
 Sustainability
                               Green bond framework defined; Timing of issuance depends on overall financing strategy considerations
                               and market conditions

FY 2020 Earnings Call & Investor Presentation                            page 6
FY 2020 Earnings Call Presentation (pages 2-28) & Investor Presentation (pages 29-50) - EQS Group
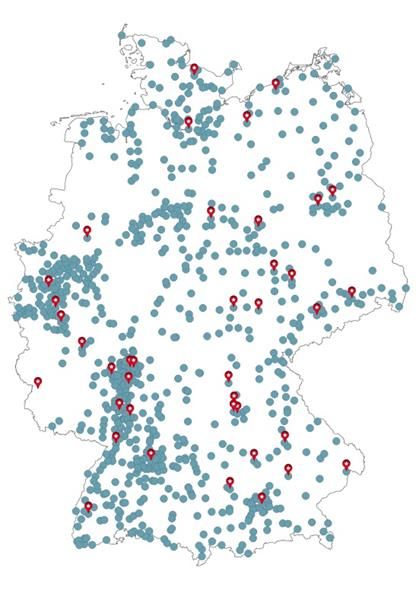
Earnings Growth in All Four Segments
                            1. FY2020 Results                                                        2. Investor Presentation                                                  3. Additional Information

        On the back of a ca. 3.9% larger portfolio, Vonovia delivered 6.3% Total Segment Revenue
        growth, 8.5% EBITDA Total growth, and 10.6% Group FFO growth (6.0% per share).

    €m (unless indicated otherwise)                                           FY 2020              FY 2019                                              Adj. EBITDA Total (€m)

    Total Segment Revenue                                                      4,370.0              4,111.7           +6.3%
                                                                                                                                                                                     8.5%
    Adj. EBITDA Rental                                                         1,554.2              1,437.4
                                                                                                                                                                   1,909.8
    Adj. EBITDA Value-add                                                         152.3                146.3                                                                                        1,760.1
    Adj. EBITDA Recurring Sales                                                     92.4                 91.9
                                                1
    Adj. EBITDA Development                                                      110.9                 84.5
    Adj. EBITDA Total                                                          1,909.8              1,760.1           +8.5%

    FFO interest expenses                                                        -380.1               -358.6
    Current income taxes FFO                                                       -52.4                -50.1
                                                                                                                                                                                       +3.9%
    Consolidation       2
                                                                                 -129.1               -132.8                                                           415
                                                                                                                                                                                                           400
    Group FFO                                                                  1,348.2              1,218.6          +10.6%

     of which Vonovia shareholders                                             1,292.0              1,165.6
     of which hybrid investors                                                      40.0                 40.0
                                                                                                                                                                      2020                             2019
     of which non-controlling interests                                             16.2                 13.0                                                                      Development
                                                                                                                                                                                   Recurring Sales
    Number of shares (eop)                                                        565.9                542.3                                                                       Value-add
    Group FFO per share (eop NOSH)                                                 2.38                 2.25          +6.0%                                                        Rental
                                                                                                                                                                                   Residential units (`000)3
    Group FFO per share (avg. NOSH)                                                 2.45                 2.29

1Excl. €0.8m (FY2019: €0.0m) capitalized interest.   2   Consolidation in FY 2020 (FY 2019) comprised intragroup profits of €33.5m (€43.9m), gross profit of development to hold of €62.8m (€58.9m), and IFRS 16 effects of
€32.8m (€29.9m). 3 Quarterly average.

FY 2020 Earnings Call & Investor Presentation                                                                page 7
FY 2020 Earnings Call Presentation (pages 2-28) & Investor Presentation (pages 29-50) - EQS Group
Rental Segment
Acquisitions and Organic Growth Drive Adj. EBITDA Rental
                         1. FY2020 Results                                                      2. Investor Presentation                                                 3. Additional Information

                                                                                                                     Rental revenue growth in 2020 was primarily driven
Rental Segment (€m)                                   FY 2020             FY 2019                Delta               by the acquisition of Hembla plus organic rental
                                                                                                                     growth.
                                                                                                                     The increase in operating expenses was mainly
                                                                                                                     attributable to two Hembla-related specifics:
Rental revenue                                          2,285.9              2,074.9         +10.2%
                                                                                                                           more all-inclusive rents1 in Sweden compared to
Maintenance expenses                                      -321.1              -308.9           +3.9%                       2019;
Operating expenses                                        -410.6              -328.6         +25.0%                        double cost structure between Victoria Park and
                                                                                                                           Hembla (operational synergies to be realized in
Adj. EBITDA Rental                                     1,554.2             1,437.4            +8.1%
                                                                                                                           2021 after successful integration at year-end
                                                                                                                           2020).
    Rental revenue by geography                                                                                Scale and efficiency gains in Germany2

                                                                                                                                                                                             76.5%       76.7%
                                                                                                                                                                                 75.0%
                                                                                                                                                                    73.6%
                       15%                                                                                          830                                71.4%
                                                                                                                                754        67.7%
                                                                                                                               63.8%
              5%                                                                                                  60.8%                      645         343         346          361          357        355
                                                                                                                                            324          570
                                                                              Germany                                                                                 498
                                                                                                                                                                                  445
                                                                              Austria                                                                                                          394         405
                                                                              Sweden                                179         184

                                             81%
                                                                                                                   2013        2014        2015         2016        2017         2018         2019       2020
                                                                                                                                                                        Adj. EBITDA Operations Margin
                                                                                                                           Avg. number of units (‘000)
                                                                                                                                                                        Cost per Unit
1In Sweden, rental revenue includes ancillary costs. Rough estimate assuming 30% of rental revenue relates to ancillary expenses would reduce the Rental revenue and Operating expenses by ca. €100m in FY 2020 and
ca. €50m in FY 2019. 2 EBITDA Operations margin (Adj. EBITDA Rental + Adj. EBITDA Value-add – intragroup profits) / Rental revenue. Margin 2019 and beyond includes positive impact from IFRS 16. Cost per unit is
defined as (Rental revenue – EBITDA Operations + Maintenance) / average no. of units.

FY 2020 Earnings Call & Investor Presentation                                                          page 8                                                       Related page(s): 34-36, 48-49, 56-60
FY 2020 Earnings Call Presentation (pages 2-28) & Investor Presentation (pages 29-50) - EQS Group
Rental Segment
Operating KPIs
                   1. FY2020 Results                   2. Investor Presentation                          3. Additional Information

    Organic rent growth of 3.1% year-on-year.                           Organic rent growth (y-o-y, %)

    (3.6% excluding the one-off rent reduction in Berlin)                                                                 3.9
                                                                                    3.1                                   0.5
    Vacancy levels continued to trend downward as a
                                                                                    0.6
    result of unbroken demand for our product and                                                                         2.3
    strong operational performance in spite of COVID-                               1.9

    19 restrictions.                                                                                                      1.1
                                                                                    0.6
                                                                                   2020                                  2019

                                                                                  Market    Modernization        New construction

 Vacancy rate (eop, %)                                                  Expensed and capitalized maintenance (€/sqm)

                                                2.6                                 22.3
                                                                                                                         19.0
                 2.4                                                                10.2
                                                                                                                          6.8

                                                                                    12.1                                 12.2

                2020                            2019                               2020                                  2019
                                                                                  Expensed maintenance       Capitalized maintenance

FY 2020 Earnings Call & Investor Presentation                 page 9                                        Related page(s): 35, 49, 78
FY 2020 Earnings Call Presentation (pages 2-28) & Investor Presentation (pages 29-50) - EQS Group
Value-add Segment
                         1. FY2020 Results                                                      2. Investor Presentation                                                  3. Additional Information

     FY 2020 Adj. EBITDA Value-add mainly held back by
         Temporary effect from Covid-19 related delays in our modernization program (but higher margin on lower volume)
         Lower residential environment service volume due to mild winter temperatures
     Continued expansion and roll-out of different Value-add initiatives on track with growth predominantly in
         Multimedia supply to customers
         Residential environment services provided with own employees
         Smart metering supply to customers
         Energy supply to delivery points for electricity and gas in the portfolio

                                                                                                                               Value-add EBITDA mostly from internal savings2
Value-add Segment (€m)1                              FY 2020            FY 2019               Delta

                                                                                                                                                                                       Craftsmen cost savings
                                                                                                                                                                                       (VTS)
Value-add revenue                                      1,104.6            1,154.8            -4.3%
                                                                                                                                                                                       Multimedia

    of which external                                       51.6               50.6         +2.0%                Covid-19                                                              Residential environment
                                                                                                                impact on
                                                                                                               investment                                                              Smart metering
    of which internal                                  1,053.0            1,104.2            -4.6%
                                                                                                                  volume
                                                                                                                                                                                       Energy
Operating expenses Value-add                             -952.3         -1,008.5             -5.6%
                                                                                                                                                                                       Other (e.g. 3rd party
                                                                                                                                                                                       management, insurance)
Adj. EBITDA Value-add                                    152.3               146.3          +4.1%

1Disclosure of Value-add segment has been changed with the introduction of the new metric Total Segment Revenue. See FY 2020 financial report (cf. Notes A2/C23) for further details. 2019 figures adjusted.   2   Distribution
based on 2021 budget.

FY 2020 Earnings Call & Investor Presentation                                                          page 10                                                                    Related page(s): 67
Recurring Sales Segment
Unbroken Demand for Individual Condos
                             1. FY2020 Results                   2. Investor Presentation                                      3. Additional Information

          Slightly lower volume but increased                  Recurring Sales Segment (€m)                         FY 2020              FY 2019                        Delta
          proceeds are a reflection of the ongoing
          positive price momentum in condominium
                                                               Units sold                                                2,442                 2,607                -6.3%
          sales.
          Outside the Recurring Sales Segment we               Revenue from recurring sales                              382.4                 365.1               +4.7%
          sold 1,235 non-core units in 2020 with a             Fair value                                               -274.0               -258.4                +6.0%
          fair value step-up of 40.1%, partly driven
                                                               Adjusted result                                           108.4                 106.7               +1.6%
          by the disposal of a commercial property.
                                                               Fair value step-up                                       39.6%                41.3%                -170bps

                                                               Selling costs                                              -16.0                -14.8               +8.1%

                                                               Adj. EBITDA Recurring Sales                                92.4                  91.9              +0.5%

    Historical Recurring Sales volumes and FV step-up1

          The Recurring Sales Segment comprises of             3,000                                                                                                     50%
          single-unit sales from
                      a defined subportfolio of ca. 26k        2,500                                                                                                     40%
                      units in Germany for which we
                                                               2,000
                      already have a separate title                                                                                                                      30%
                      the Austrian portfolio with 22k units,   1,500
                      where sales are made                                                                                                                               20%
                                                               1,000
                      opportunistically when apartments
                      become vacant                             500                                                                                                      10%

          The cash proceeds from Recurring Sales
                                                                   0                                                                                                     0%
          are used as an equity contribution for the                      2013           2014   2015         2016   2017        2018         2019          2020
          investment program.                                                                                       Current guidance                 Current guidance
                                                                            Sold units          FV step-up
                                                                                                                      (units sold)                    (FV step-up)
1   2018 onwards also including recurring sales in Austria.

FY 2020 Earnings Call & Investor Presentation                          page 11                                                         Related page(s): 64
Development Segment
Adj. EBITDA Development Ramp-up Continued
                          1. FY2020 Results                                                         2. Investor Presentation                                                   3. Additional Information

                                                                                                                           Development to sell                                    Development to hold
        Significant increase in volume and EBITDA as                                                                       (by revenue)                                           (by fair value)

                                                                                                                                                                                              Sweden
        we continued to ramp up our development                                                                                                                                                 4%

                                                                                                                               Austria
        activities.                                                                                                             32%

                                                                                                                                                                                  Austria
        Shift towards higher development-to-hold                                                                                                                                   43%                       Germany
                                                                                                                                                      Germany                                                  53%
                                                                                                                                                        68%
        volume particularly in Austria safeguards future

        rental revenue.

                  Development Segment (€m)                                                                                               FY 2020                   FY 2019                           Delta

                  Revenue from disposal of to sell properties                                                                               297.7                       249.5                   +19.3%

                  Cost of Development to sell                                                                                              -235.9                      -197.3                   +19.6%

                  Gross profit Development to sell                                                                                            61.8                        52.2                  +18.4%

                  Fair value Development to hold                                                                                            298.2                       266.3                   +12.0%

                  Cost of Development to hold1                                                                                             -235.4                      -207.4                   +13.5%

                  Gross profit Development to hold                                                                                            62.8                        58.9                    +6.6%

                  Rental revenue Development                                                                                                    1.2                         1.1                   +9.1%

                  Operating expenses Development segment                                                                                     -14.9                       -27.7                   -46.2%

                  Adj. EBITDA Development                                                                                                  110.9                         84.5                  +31.2%
1Excl. €0.8m (FY2019: €0.0m) capitalized interest. Note: This segment includes the contribution of to-sell and to-hold constructions of new buildings. Not included is the construction of new apartments by adding floors to
existing buildings, as this happens in the context of modernization.

FY 2020 Earnings Call & Investor Presentation                                                             page 12                                                                      Related page(s): 76
Development Segment
Vonovia‘s Contribution towards Reducing the Housing Shortage
                   1. FY2020 Results                        2. Investor Presentation                        3. Additional Information

 New rental apartments for our own portfolio (to hold)

      1,442 units completed in FY 2020 (including floor additions).
                                                                                                8%
      Total pipeline of ca. 38k apartments, of which more than 70%
                                                                                                     11%
      in Germany and the remainder in Austria and Sweden.
                                                                                                                         Under construction
      Average apartment size between 60-70 sqm and broadly in line                                                       Short-term pipeline
      with overall portfolio average.                                                                                    Longer-term pipeline

      The Development to-hold investment volume is part of the overall                 81%
      investment program.

                                                                                              2021 target: ~1,500 completions

 New apartments for disposal (to sell)

      646 units completed in FY 2020.

      Total pipeline volume of ca. €3.1bn (ca. 9k apartments), of which
      ca. two thirds in Germany and ca. one third in Austria.                                      30%                  Under construction

      Investment capital for Development to sell is not part of investment                                              Short-term pipeline
                                                                                        58%
                                                                                                  12%                   Longer-term pipeline
      program.

      Average apartment size between 70-80 sqm.

      Average investment volume of €4.5k – €5.0k per sqm.
                                                                                              2021 target: ~1,000 completions
      Gross margins between 20-25% on average.

FY 2020 Earnings Call & Investor Presentation                     page 13                                          Related page(s): 76
Investment Program for Organic Growth
                         1. FY2020 Results                                                      2. Investor Presentation                                                 3. Additional Information

Three main investment categories lead to incremental rental revenue1, value appreciation and
an overall improvement of our portfolio quality, including CO2 emission reductions.

       New                     Construction of apartments for our own portfolio through entirely new
    construction               buildings or floor additions to existing buildings, applying modular and
      to hold                  conventional construction methods (Excl. development to sell).
      Upgrade                  Energy-efficient building modernization usually including new facades,
      Building                 roofs, windows and heating systems.
                                                                                                                                                                        Optimize         Upgrade         New construc-
      Optimize                 Primarily senior-friendly apartment renovation usually including new                                                                    Apartment         Building         tion to hold

     Apartment                 bathrooms, modern electrical installations, new flooring, etc.                                                                                    Neighborhood Development

Target IRR for the overall investment program is ca. 9%.

    Investment program evolution (€m)
                                                                                                                                                                                                1,300
                                                                                                                                                                                                  -
                                                                                                                                                                                                1,600
                                                                                                                                                  1,489
                                                                                                                                                                                                                 Target
                                                                                                                                                                         1,344                                   range

                                                                                                                           1,139

                                                                                                     779

                                                                             472
                                                      356
                               172
        71

      2013                   2014                    2015                   2016                   2017                    2018                   2019                   2020                 2021(E)
1An aggregate amount of ~€87m additional rent p.a. is still in the pipeline from the investment programs 2017 to 2021 where projects are underway but not fully completed. Note: The target volume of €1,300 - €1,600
million does not account for any additional impacts that may arise from using the new Federal Funding Regulation for Energy-Efficient Buildings (“BEG”) and that may possibly lead to higher volumes.

FY 2020 Earnings Call & Investor Presentation                                                         page 14                                                                 Related page(s): 62-64
Another Year with Strong Value Growth
                           1. FY2020 Results                                                      2. Investor Presentation                                                  3. Additional Information

     2020 fair value evolution (€bn)

                                                                                                                                                                                                               58.9
                                                                               53.3                                                                     53.8                4.9               0.3
                                                                                                  0.6                0.6               0.4
       9.4% l-f-l value growth

          7.5% Performance & Yield compression                                                                                                                                 +9.0%
                                                                                                                                                                           (L-f-l +9.4%4)
          1.9% Investments

       Excluding Berlin, 2020 l-f-l value growth

       was similar to 2019 levels

                                                                             12/2019        Acquisitions            Sales           New       12/2019                 Total value         Currency           12/2020
                                                                                                                                constructions rebased                   growth             impact

    Valuation KPIs                Vonovia                                                                            Value growth drivers
    Dec 31, 2020                    Total
                                                     Germany              Sweden               Austria
                                                                                                                     (l-f-l)
                                                                                                                                                                                     2020                   2019

    In-place rent
                                     24.2x               25.4x             17.4x1             25.5x1                 Performance & Yield compression                                      7.5%                   9.6%
    multiple
    Fair value
                                     2,063               2,099              2,090              1,570                 Investments                                                          1.9%                   2.3%
    €/sqm
    L-f-l value
                                     9.4%               10.3%                5.6%               3.8%                 Total                                                               9.4%                 11.9%
    growth2

    Fair value €bn                    58.93                49.2                 6.3                 3.4              Additional currency impact                                           0.5%                  -0.1%

1 In-place rents in Austria and Sweden are not fully comparable to Germany, as Sweden includes ancillary costs and Austria includes maintenance and property improvement contributions from tenants. The data above shows
the rental level unadjusted to the German definition. 2 Excludes currency impact from fair value changes in Swedish Krona (2020: +€255m, 2019: -€24m). 3 Including €2.1bn for undeveloped land, inheritable building rights
granted (€0.6bn), assets under construction (€0.4bn), development (€0.8bn) and other (€0.3bn) and excluding €0.3bn IFRS16 use of rights. 4 L-f-l calculation of property portfolio excl. undeveloped land etc.
    FY 2020 Earnings Call & Investor Presentation                                                         page 15                                                              Related page(s): 48, 57-58
We Expect Yield Compression to Continue
                            1. FY2020 Results                                                          2. Investor Presentation                                                    3. Additional Information

        We have no direct influence on yield compression                                                                    Value growth from YC. Vonovia Germany excl. Berlin1
        and cannot predict the quantum in our markets                                                                        10%
        going forward.                                                                                                         8%
        However, in light of the trend reversal in 2020,                                                                       6%
        there are strong indications, also backed by our
                                                                                                                               4%
        preparation work for the H1 2021 valuation and
                                                                                                                               2%
        our observations in the market, that we will
                                                                                                                               0%
        continue to see material yield compression.                                                                                        2016              2017                2018            2019             2020

                                                 Today’s transactions in our markets will serve as data points in tomorrow’s valuations
          Market
    transactions are a                                       Transactions of comparable portfolios are often done at yields substantially below
    potential precursor                                      Vonovia’s current gross yield of 4.1%.
      of future yield                                        Condo prices have been on an almost straight line upward path for several years now;
       compression                                           with persisting supply/demand imbalance the trend will likely stay intact.

                                                 The next three years will see upcoming                                                                    Volume of upcoming maturities in government bonds
                                                                                                                                                              with positive coupons issued by countries with
                                                 maturities of an estimated €674bn of positive                                                                   currently negative 10-year yields (€bn)2
                                                 yielding government bonds, though the issuing
                                                                                                                                                                                                                 262
                                                 countries currently have a negative 10yr bond                                                                                            234
    Negative sovereign                           yield.2                                                                                                            178
       bond yields
                                                 Refinancings in the context of this yield gap may
                                                 well drive a part of these funds into property
                                                 markets and could lead to increasing prices
                                                 going forward.                                                                                                  < 1 year               1-2 years              2-3 years

1   Value growth from yield compression. Timeline includes portfolio changes but is l-f-l for individual years.   2   Source: Bloomberg, Kepler Cheuvreux; data as of 01/2021.

FY 2020 Earnings Call & Investor Presentation                                                                 page 16
EPRA NAV and Adj. NAV
                             1. FY2020 Results                                                            2. Investor Presentation                                  3. Additional Information

        Adj. NAV +19.3% in absolute terms and +14.4% on a per share basis (NOSH +4.4%).

                      €m                                                                                                       Dec. 31, 2020       Dec. 31, 20191                      Delta
                      (unless indicated otherwise)

                      Equity attributable to Vonovia's shareholders                                                                    23,143.8         19,308.3                 +19.9%

                      Deferred taxes on investment properties                                                                          11,947.8         10,288.9                 +16.1%

                      Fair value of derivative financial instruments2                                                                      74.5               1.6              >+100%
                      Deferred taxes on derivative financial instruments                                                                  -19.6              -6.3              >+100%
                      EPRA NAV                                                                                                         35,146.5         29,592.5                 +18.8%

                      Goodwill                                                                                                          -1,494.7        -1,392.9                   +7.3%
                      Adj. NAV                                                                                                         33,651.8        28,199.6                +19.3%

                      EPRA NAV €/share                                                                                                    62.11            54.57                 +13.8%
                      Adj. NAV €/share                                                                                                    59.47            52.00               +14.4%
                      Number of shares (eop)                                                                                              565.9            542.3                   +4.4%

1   Dec. 31, 2019, numbers adjusted (cf. Note A2 of FY 2020 financial report).   2   Adjusted for effects from cross currency swaps.

FY 2020 Earnings Call & Investor Presentation                                                                   page 17                                                  Related page(s): 69-70
Vonovia’s Application of EPRA Best Practice Recommendations
Distinction between Hold and Sales Portfolio
                   1. FY2020 Results                                          2. Investor Presentation                                      3. Additional Information

                                                                                               “Companies are recommended to use the IFRS values (usually the Net Value
                                                                                               in the Valuation Certificate, i.e. the property value net of any purchasers’ costs
                              “Entities buy and sell assets, thereby crystallising
                              certain levels of unavoidable deferred tax.”                     and adjusted for any items addressed in § IAS40.50). Companies also have
                              EPRA BPR (10/2019) pg. 7                                         the option to use the optimised net property value if it can reasonably
                                                                                               demonstrate that it can actually achieve this optimisation on a consistent
                                                                                               basis. Companies will have the option to use a transfer tax optimisation
                                                                                               adjustment to gross-up their Net Values if they can justify this and provide
                                                                                               sufficient disclosure. A way to justify the adjustment would be for a company
                                                                                               to show that it has consistently achieved over the past periods lower transfer
                                                                                               tax on its real estate transactions. The average transfer tax achieved could
                                                                                               then be used.”
                                                                                               EPRA BPR (10/2019) pg. 17
EPRA BPR (10/2019) pg. 15

   Vonovia’s unchanged strategy since the IPO is to be the
                                                                                              Portfolio split between Hold and Sell
   “eternal” owner of the Hold portfolio (no cyclical asset
   rotation).
   Because no disposals are foreseen from this Hold
   portfolio, costs that are directly linked to a disposal, by
                                                                                                                            88% Hold.
   definition, will not occur. That is why Vonovia extends the                                       12%                    No intention to sell (eternal owner)
   logic for excluding deferred taxes to purchaser’s costs                                                                   Germany (excl. condo & non-core) and Sweden
   as well.
   The Purchaser’s costs, which are deducted from the
   discounted rental cash flow value under IFRS, are added
                                                                                                              88%           12% Sales.
   back to reflect the true rental fair value of the portfolio.
                                                                                                                            Disposal expected in the future
   Vonovia’s past tax disclosures also show the company                                                                     Recurring & Non-core Sales Germany, Austrian assets

   achieved optimal RETT structures in its transactions.

FY 2020 Earnings Call & Investor Presentation                                        page 18                                                     Related page(s): 69-70
EPRA NTA and EPRA NRV
                    1. FY2020 Results                                        2. Investor Presentation                                             3. Additional Information

 Net Tangible Assets (NTA) – “brick and mortar”                                              Net Reinstatement Value (NRV) – “beyond the bricks”

   Distinction between (i) Hold portfolio and (ii) Sales portfolio                              No distinction between Hold and Sales portfolio

   Based on this fundamental distinction, our NTA reflects the                                  Proxy for company value (value required to rebuild the
   portfolio value of the Hold portfolio under the assumption                                   company)
   that it will never be sold                                                                   Reflects long-term nature of the business and is based on
   As a consequence, deferred taxes and purchaser’s cost are                                    the assumption that all assets are held in perpetuity
   added back for the hold portfolio but not for the sales                                      (all deferred taxes on assets and purchaser’s costs are
   portfolio                                                                                    added back for total portfolio)

 Equity to EPRA NTA bridge (Dec. 31, 2020; €m)                                               Equity to EPRA NRV bridge (Dec. 31, 2020; €m)

                                                                                                                                                                              43,677
                                                                                                                                                            3,921
                                                                           35,489
  33,611
                    55            1,495                      3,435                              35,092                                  4,610
                                                 117                                                                  55
   10,467                               Total RETT and other                                                                                                                  €77.18
                                                                                                 11,948
                                        purchaser’s costs                                                                                                                      p.s.
                                                                                                               Intangible values are included with the
                                        €3,921m, of which
                                                                           €62.71                              enterprise values of the Value-add and
                                        €3,435m Hold portfolio and
                                                                            p.s.                               Development segments, net of the
                                           €486m for Sales portfolio
                                                                                                               respective carrying amounts. The
                                                                                                               enterprise value is the result of a DCF
              Total deferred taxes on                                                                          valuation by an independent valuer and
   23,144                                                                                        23,144
              investment properties                                                                            based on Vonovia’s internal 5-year
              €11,948m, of which                                                                               business plan
              €10,467m Hold portfolio and
                €1,481m for Sales portfolio

 IFRS share- FV of financial     Goodwill     Intangibles RETT and other    NTA               IFRS share-        FV of financial   FV of intangibles    RETT and other         NRV
holders’ equity instruments                 (IFRS balance   purchaser’s                      holders’ equity      instruments                          purchaser’s costs
 + def. taxes                                   sheet)      costs (Hold                       + def. taxes
on Hold portf.                                                portf.)                         on inv. prop.

FY 2020 Earnings Call & Investor Presentation                                      page 19                                                             Related page(s): 69-70
LTV at the Lower End of the Target Range (incl. Hybrid)
                             1. FY2020 Results                                                2. Investor Presentation                       3. Additional Information

          Based on the stable cash flows and the strong long-term fundamentals in our portfolio locations,
          largely driven by a structural supply/demand imbalance, we see continued upside potential for our
          property values and do not see material long-term downside risks for our portfolio.
          We remain committed to our LTV target range of 40-45%.
          The S&P Global Ratings requirement for replacing the equity component of the perpetual hybrid has
          already been resolved via the 09/2020 capital increase, giving Vonovia all options for paying back the
          instrument at the first call date in Q4 2021.
        €m
        (unless indicated otherwise)
                                                                                                           Dec. 31, 2020          Dec 31, 2019                             Delta

        Non-derivative financial liabilities                                                                       24,084.7          23,574.9                             +2.2%
        Foreign exchange rate effects                                                                                     -18.9          -37.8                            -50.0%
        Cash and cash equivalents                                                                                        -613.3        -500.7                            +22.5%
        Net debt                                                                                                   23,452.5          23,036.4                             +1.8%
        Sales receivables/prepayments                                                                                    -122.3          21.4                                  -
        Adj. net debt                                                                                            23,330.2            23,057.8                             +1.2%

        Fair value of real estate portfolio                                                                       58,910.7           53,316.4                            +10.5%
        Shares in other real estate companies                                                                            324.8          149.5                            >+100%
        Adj. fair value of real estate portfolio                                                                 59,235.5            53,465.9                            +10.8%

        LTV                                                                                                              39.4%         43.1%                             -370bps
        LTV (incl. perpetual hybrid)                                                                                41.1%             45.0%                              -390bps
        Net debt/EBITDA multiple1                                                                                        12.3x         11.5x                               +0.8
1   Adj. net debt quarterly average over Adj. EBITDA Total (LTM), adj. for IFRS 16 effects.

FY 2020 Earnings Call & Investor Presentation                                                       page 20                                         Related page(s): 71
Solid Capital Structure with Smooth Maturity Profile and Diverse
Funding Mix
                             1. FY2020 Results                                                         2. Investor Presentation                                             3. Additional Information

                                                                                                                                                                                                          Current level
    KPI / criteria                                                 Dec. 31, 2020             Dec. 31, 2019             Bond covenants                                            Required level
                                                                                                                                                                                                         (Dec. 31, 2020)

                                                                                                                       LTV
    Corporate rating (Scope)                                                      A-                        A-                                                                      125%                    211%
    LTV (net debt incl. equity hybrid / fair value)                          41.1%                    45.0%            (Unencumbered assets / unsecured debt)

    Net debt/EBITDA multiple2                                                 12.3x                     11.5x          Evolution of LTV and Interest Cover Ratio

    Fixed/hedged debt ratio3                                                   99%                       96%                                                                            4.7         4.9         4.8
                                                                                                                                             49.3%                         4.6
                                                                                                                             49.0%
                                                                                                                                                          46.9%    3.7
    Average cost of debt3                                                     1.4%                      1.5%                                               3.0                       42.8%        43.1%
                                                                                                                                               2.7                41.6%                                                   target
                                                                                                                                                                          39.8%                               39.4% range
                                                                                                                                  2.2
    Weighted average maturity (years)1                                           7.9                       7.9

    Most recent bond issuance (Jan 2021)                                   1.000%
    €500m, 20 years                                                         coupon                                               2013         2014         2015   2016    2017     2018     2019               2020
                                                                                                                                                        LTV (%)               Interest Cover Ratio

    Diverse funding mix with no more than 12% of debt maturing annually (as of January 2021)
    €m
                                                                                                                                  Corporate bond
                                                                                                                                                                                                    6%
3,500                                                                                                                                                                                                        Savings & Loan
                                                                                                                                                                                                    8%       Assoc.
3,000                                                                                                                                                                              4%              10%
                                                                                                                                  Equity hybrid                                                              Landesbanken
2,500                                                                                                                                                                                              14%

2,000                                                                                                                                                                                                        Cooperatives
                                                                                                                                  Bank loans German lenders                             23%
1,500
                                                                                                                                                                   62%
1,000                                                                                                                                                                                              62%
                                                                                                                                                                                                             Subsidized

    500                                                                                                                           Bank loans Austrian lenders
                                                                                                                                                                                        4%                   Private
         0
                                                                                                                                                                                     7%
             2021 2022 2023 2024 2025 2026 2027 2028 2029 2030 2031 2032 from                                                     Bank loans Swedish lenders
                                                                                                                                                                                                    Bank
                                                                         2033                                                                                                                     lenders
1   BRP = business risk profile. 2 Adj. net debt quarterly average over Adj. EBITDA Total (LTM), adj. for IFRS 16 effects.   3   Excl. equity hybrid.

FY 2020 Earnings Call & Investor Presentation                                                                 page 21                                                                Related page(s): 71
Update on Regulation (I)
                   1. FY2020 Results                              2. Investor Presentation                                       3. Additional Information

                              As expected, the negative consequences of the legislation are obvious: fewer rental apartments, less
                              new construction, lower investment volumes into energy efficiency and senior-friendly refurbishments
                              Federal Constitutional Court (FCC) ruling widely expected for Q2 2021
  Berlin Rent                 Vonovia remains convinced that the Berlin Rent Freeze legislation is largely or even entirely
    Freeze                    unconstitutional
                              But: past FCC rulings were usually nuanced and differentiated, rather than binary
                              Independent of what the FCC will rule, a verdict is unlikely to mark the end of the housing debate in
                              Berlin, and Vonovia expects the situation to remain challenging in the short and medium-term

                              As of January 1, 2021, CO2 emissions from fossil heating and fuel in Germany are taxed at a rate of €25 per
                              ton of CO2; this rate will increase to as much as €55 by 2025
                              Based on current legislation, the tax is fully recoverable and borne by tenants
                              A discussion is underway about how the CO2 tax should be shared between tenant and landlord, also
                              with a view towards setting the right incentives for energy savings
     CO2 tax                  Because the CO2 emission of a building is determined by tenants’ heating consumption and the energy
     law enacted              efficiency of the building, Vonovia supports a burden sharing between tenants and landlords based
                              on the building’s energy efficiency

                                Vonovia          More efficient                                                                           Less efficient
                                                                         lower     Landlord’s contribution to CO2 tax   higher
                                Proposal          energy class                                                                             energy class

  Renewable
                              Better incentives for landlord-to-tenant electricity models
  Energy Act
                              Improved conditions for on-site energy generation
   (Erneuerbare-
                              “Neighborhood concept” – electricity can now be consumed by tenants in other buildings in the
 Energien-Gesetz)
                              neighborhood, not only in the building in which it was generated
     law enacted

FY 2020 Earnings Call & Investor Presentation                           page 22
Update on Regulation (II)
                    1. FY2020 Results                                  2. Investor Presentation                               3. Additional Information

                               Draft law adopted by Federal Government in December 2020
                               Objective is to increase Mietspiegel reliability as well as legal certainty
  Mietspiegel                  Landlords and tenants to be required to disclose certain information to improve data quality
  Reform Act                   (e.g. rent level, apartment features)
    (Mietspiegel-              Updates to come every three years (currently every two years)
   reformgesetz)               Rent increases in cities with a Mietspiegel may no longer be made on the basis of comparable apartments
       draft law               Next step: Resolution by the Bundestag (Federal Parliament) and Bundesrat (Federal Council) required to
                               become law. Legislative process expected for Q2

                               Draft law adopted by Federal Government in November 2020.
                               Two main elements:
 Mobilization
                                        Improved process to designate land as development land; extended periods for pre-emptive
  of land for
                                        purchase rights of local governments
 construction
                                        Stricter regulation for conversion of rental units into condos. In constrained housing markets,
     (Bauland-
                                        any conversion would require prior approval from the local authorities (not applicable to rental
  mobilisierungs-
                                        units already converted previously)
       gesetz)
                               Next step: Resolution by the Bundestag (National Parliament) and Bundesrat (Federal Council) required to
       draft law
                               become law. Legislative process expected for Q2

                               2021 is an important election year in Germany                      Mar 14 Baden-Wuerttemberg
                               with federal elections plus 5 state elections                      Mar 14 Rhineland Palatinate
     It’s an                   The subject of housing and how to address the                      Jun 6 Saxony-Anhalt
    election                   supply-demand imbalance in urban areas is                          Sep 26 Federal Parliament
      year                     expected to be one of the key issues of the                        Sep 26 Berlin
                               different political campaigns and is likely to be                  Sep 26 Thuringia
                               discussed intensively leading up to the elections                  Sep 26 Mecklenburg-Western Pomerania

FY 2020 Earnings Call & Investor Presentation                                page 23
Update on Regulation (III)
                   1. FY2020 Results                               2. Investor Presentation                     3. Additional Information

                                                Developed by Germany’s Federal Ministry for Economic and Energy Affairs; effective on
                                                July 1, 2021
                                                The goal was to harmonize the different subsidy regulations and combine them into one
                                                single, comprehensive subsidy program for existing and new buildings
                             Scope and          The objective is to set adequate incentives for owners to substantially increase
                             content of         investments in energy-efficiency and renewable energy
    Federal                        the          Subsidies are determined by the amount of energy efficiency gains and the proportion of
    Funding                  regulation         renewable energy contribution in heating supply resulted from projects and can be as
  Regulation                                    high as 45% of an investment amount up to €120k/apartment
  for Energy-                                   Flexible funding format – applicants can choose between investment grants or
    efficient                                   subsidized loans
   Buildings                                    Targeted subsidy volume is €32bn p.a. until 2030
 (“Richtlinie für
                                                Increased investment volume in energy efficient modernization
   die Bundes-
                                                       Acceleration of CO2 reduction efforts
  förderung für
                                                       Additional NAV growth
     effiziente
    Gebäude –                                   Increased modernization depth

 Wohngebäude,                                   Rental growth and investment yields expected to remain broadly similar
                              Expected
    BEG WG”)                 impact on          Higher EBITDA contribution in the Value-add segment from increased volume through
                                                Vonovia craftsmen organization
                               Vonovia
     law enacted
                                                Improved social acceptance of energy-efficient modernizations because of reduced
                                                modernization allowance and increased savings on heating bill
                                                Vonovia is reviewing its Upgrade Building Program and portfolio in light of the new
                                                regulation to achieve the best possible outcome for our stakeholders by selecting the
                                                right subsidy elements for each individual project

FY 2020 Earnings Call & Investor Presentation                            page 24
Sustainability Update
                   1. FY2020 Results                           2. Investor Presentation                3. Additional Information

    Sustainability                      Starting point established for 2020
                                        Target set for 2021 and included in guidance
     Performance
                                        Guidance of 100% implies full achievement of the individual goals across the six
       Index (SPI)                      SPI categories

                                        Green bond framework defined
                                        Further diversification of funding structure
      Green bond
                                        Timing of issuance depends on overall financing strategy considerations and
                                        market conditions

                                        Comprehensive inclusion of ESG-related risks in Vonovia’s risk management
                                        system
   ESG integrated                       No material ESG risks identified

  into internal risk                    The most relevant ESG-related risk is the CO2 tax in Germany, which under the
                                        current legislation is fully paid by tenants but which may become payable at least
     management
                                        in part by landlords. This risk is (i) manageable in the overall context and (ii)
                                        mitigated through pro-active strategies to reduce CO2 emissions in our portfolio

FY 2020 Earnings Call & Investor Presentation                        page 25                                Related page(s): 42-47
Sustainability Performance Index (SPI)
                         1. FY2020 Results                                                     2. Investor Presentation                                                           3. Additional Information

    Vonovia has established the Sustainability Performance Index with quantitative, non-financial KPIs to
    measure sustainability performance in the most relevant areas
    SPI reporting is audited by our statutory auditor1
    The SPI is a relevant criterion in the long-term incentive plan for the executive board2 as well as for the
    leadership group below the executive management
    To achieve the target of 100%, all six individual targets must be fully achieved

                                                                                                                       2020                                    2021                               Medium-term
                                                                                                                      Actuals                                 Targets                               Targets
                                                                                                                          43.9                             Reduction
2021 Guidance
                           1. FY2020 Results                                                          2. Investor Presentation                                                      3. Additional Information

                                                                                        2020                                                             2021                                              Mid-term
                                                                                       Actuals                                                         Guidance                                            Outlook

    Total Segment Revenue                                                            €4.370bn                                                 ~€4.9bn - ~€5.1bn                                              growing

    Rental revenue                                                                   €2.286bn                                                 ~€2.3bn - ~€2.4bn                                              growing

    Organic rent growth (eop)                                                            3.1%                                                   ~3.0% - ~3.8%1                                                  stable
                                                                  (3.6% excl. one-off effect in Berlin)

    Recurring Sales (# of units)                                                        2,442                                                            ~2,500                                                 stable

    FV step-up Recurring Sales                                                         39.6%                                                              ~30%                                                  stable

    Adj. EBITDA Total (€m)                                                              1,910                                                      1,975 – 2,025                                             growing

    Group FFO (€m)                                                                      1,348                                                      1,415 – 1,465                                             growing

                                                                                                                                                  ~70%                                             stable payout ratio;
    Dividend (€/share)                                                                   1.692                                                                                                      €/share growing
                                                                                                                                          of Group FFO per share

    Investments (€bn)                                                                €1.344bn                                                 ~€1.3bn – ~€1.6bn                                        at least stable

                                                                                                                                                                                                         continuous
    SPI                                                              Starting point established                                                          ~100%                                          improvement

Note: The 2021 guidance is based on the current legislation under which the CO 2 tax is part of the recoverable expenses; equally, the 2021 guidance does not include any positive impacts expected from the Federal
Funding Regulation for Energy-Efficient Buildings (“BEG”). 1 If the current Berlin-specific rent freeze regulation is in place at the end of 2021, we expect to come out towards the lower end of the range; if the legislation is no
longer in place at the end of 2021, we expect to come out towards the higher end of the range. A ruling by the Federal Consti tutional Court is widely expected in Q2 2021. 2 To be proposed to the Annual General Meeting in
2021.

FY 2020 Earnings Call & Investor Presentation                                                                page 27
Wrap-up
                   1. FY2020 Results            2. Investor Presentation   3. Additional Information

               2020 with earnings and value growth
               across the board and continuation of
               impeccable track record since IPO

               The underlying market fundamentals
               are fully intact, and our operating
               environment remains favorable.

               We remain confident in our ability to
               continue to deliver growth as per our
               guidance for 2021 and beyond.

FY 2020 Earnings Call & Investor Presentation         page 28
Agenda
                   1. FY2020 Results                                      2. Investor Presentation                    3. Additional Information

                                                Vonovia operates more than 3,500 elevators across its portfolio.
                                                Continued operations and timely servicing are key to minimizing
                                                downtimes & operating costs and maximizing customer satisfaction.
                                                That is why Vonovia has developed its own IoT Elevator Monitoring
                                                Platform to remotely monitor and improve the servicing of its
                                                elevator fleet. This patented solution is independent of elevator
                                                make and model. Ca. 25% of all elevators have been equipped with
                                                this technology, which we continue to roll out across the remainder
                                                of the portfolio. Next stop: heating systems.

                                                 [address]

              1                                                   2                                           3
           FY2020                                              Investor                                   Additional                                See
                                                                                                                                                    Page
           Results                                           Presentation                                Information                               Finder
                                                                                                                                                  on page
                                                                                                                                                   85 for
                                                                                                                                                  detailed
         pages 4-28                                           pages 29-50                                   pages 51-85                            index

FY 2020 Earnings Call & Investor Presentation                                   page 29
Agenda Investor Presentation
                   1. FY2020 Results                             2. Investor Presentation      3. Additional Information

                                       31       Europe’s Leading Resi Player

                                       32       Compelling Investment Case

                                       33       Earnings & Value Growth Across Four Segments

                                       34       Granular B-to-C End Consumer Business

                                       35       Robust Operating Business

                                       36       Cost per Unit – Peer Comparison

                                       37       Megatrends

                                       38       Capital Allocation

                                       39       Market Outperformance

                                 40-41          M&A Criteria & Track Record

                                 42-47          Sustainability

                                       48       Residential Market Trends

                                       49       Rent Growth

                                       50       Summary of Investment Case

FY 2020 Earnings Call & Investor Presentation                          page 30
Europe’s Leading Residential Property Owner and Operator
                    1. FY2020 Results                                 2. Investor Presentation                              3. Additional Information

We are the long-term owner and full-scale                                                                     355k
                                                                                                           apartments
                                                                                                       in 15 urban growth
operator of Europe’s largest listed multifamily                                                              regions

housing portfolio with ca. 416k apartments
for small and medium incomes in
metropolitan growth areas.                                                                                                                            38k
                                                                                                                                                 apartments in
                                                                                                                                                  Stockholm,
                                                                                                                                                Gothenburg, and
                                                                                                                                                    Malmö

  Geographic split (by number of units)

                    5%
              9%
                                                                 2.6% stake in
                                                               portfolio with 27k
                                                                  apartments
                                                               Focus: Randstad
                                                             (greater Amsterdam)
                                                                                                                                                     22k
                                                                                                                                              apartments mainly in
                                                                                                                                                    Vienna

                                86%

                                                                                             10% stake in
     Germany           Sweden           Austria                                            portfolio with 4k
The small stakes we own in the Dutch and in the French                                        apartments
portfolios are less of a financial investment and more R&D                               Focus: Île de France
to gain an even better understanding of the markets.                                        (greater Paris)

 FY 2020 Earnings Call & Investor Presentation                              page 31
Compelling Investment Case
                   1. FY2020 Results                               2. Investor Presentation                   3. Additional Information

                           We are Europe’s largest residential landlord and the long-term owner and full-scale operator of a
     Market                multifamily housing portfolio with ca. 416k apartments for small and medium incomes in metropolitan growth
     Leader                areas.

                           The granularity and B-to-C nature of our business are unique in real estate. Our strategy of
  Uniquely                 standardization, industrialization and process optimization makes us the industry leader with best-in-class
 Positioned                service levels and superior cost control.

       Low                 Fundamental megatrends provide a positive backdrop in a regulated environment that safeguards
       Risk                attractive risk-adjusted returns and offers downside protection.

                           Organic earnings and value growth plus substantial long-term upside potential from acquisitions in
    Growth                 selected European metropolitan areas. Low execution risk from track record of acquiring and integrating
                           >300k apartments in eight large transactions since IPO.

                           All of our actions have more than just an economic dimension.

  Built-in                     We provide a home to around 1 million people from ca. 150 nations.

 ESG Focus                     CO2 emissions related to housing are one of the largest sources of greenhouse gas emissions.

                               As a listed, blue-chip company we are rightfully held to a high standard.

FY 2020 Earnings Call & Investor Presentation                            page 32
Earnings and Value Growth across Four Segments
                   1. FY2020 Results                               2. Investor Presentation                             3. Additional Information

 Development                                                Rental & Value-add                                                          Recurring
 New construction
                                                             (Operating business)                                                         Sales
 of apartments to                      Efficient property and portfolio management including ancillary                                  Disposal of
  hold and to sell                        service business for internal savings and external revenue                                     individual
   via greenfield                                                                                                                     apartments to
  and brownfield                                                                                                                       retail buyers
   development

    Vonovia is one                     Robust top-line growth from regulated environment with high pass-                                Steady sale of
    of the leading                     through rate at >75% EBITDA margin and growing
                                                                                                                                        ca. 2.5k
                                       13-year average duration of rental contracts with no cluster risk
    homebuilders in                                                                                                                     apartments
                                       because of granular B-to-C business
    Germany
                                       High degree of insourcing with standardization, industrialization and                            annually at
    New                                process optimization along the value chain                                                       ~30% (est.)
    construction is                    Segment contribution to 2020 Adj. EBITDA ca. 89%
                                                                                                                                        above fair
    a financially and
                                       Property Management                                      Technical Service                       market value
    strategically                 (~1,500 letting agents & caretakers)                          (~5,000 craftsmen)
    valuable                      Face to the customer and eyes & ears            Wholly-owned      craftsmen   company                 Segment
                                  on the ground in our local markets              (“VTS”) for large share of maintenance                contribution
    addition to the
                                                                                  and modernization plus pooling of
    core business                                                                 entire purchasing power                               to 2020 Adj.
    Segment                                                                                                                             EBITDA ca.
    contribution                         Residential Environment                                 Service Center
                                                                                                                                        5%
                                       (~ 1,000 landscape gardeners)                          (~1,000 service agents)
    to 2020 Adj.
                                  Mainly maintenance and construction             Centralized   property     management
    EBITDA ca.                    of gray and green areas and snow/ice            including inbound calls and e-mails,
                                  removal in the winter                           recoverables      billing,     contract
    6%
                                                                                  management, maintenance dispatch
                                                                                  and rent growth management
FY 2020 Earnings Call & Investor Presentation                            page 33
Granular B-to-C End Consumer Business
                   1. FY2020 Results                  2. Investor Presentation                    3. Additional Information

 Residential real estate is a granular mass business with large volumes that offers a
 competitive advantage to companies with an efficient operating platform, a high degree of
 standardization and process excellence.

     2.6 million inbound                          400,000 payment                         8 million invoices to
          calls p.a.                               reminders p.a.                            process p.a.

                                                                                 40,000 heating
                                       360,000 outbound
                                                                                 systems to be
                                           calls p.a.
                                                                                   maintained

    700,000 ancillary
     expense bills to                             220,000 trees and                       650,000 repair jobs
 prepare and settle with                        300 kilometers hedges                            p.a.
        tenants

                                 3,500 elevators to be                       15 million sqm of
                                      maintained                               green spaces

FY 2020 Earnings Call & Investor Presentation               page 34
Robust Operating Business
                           1. FY2020 Results                                                         2. Investor Presentation                                                     3. Additional Information

                                                                                                                      Bread & butter market rent growth levered with investments
     Successful portfolio management has resulted in
                                                                                                                         Rent growth from new construction to hold                                         3.6% excluding the
                                                                                                                                                                                       4.4
     portfolio concentration in urban growth areas.                                                                      Rent growth from modernizations
                                                                                                                                                                          4.2
                                                                                                                                                                                                              one-off rent
                                                                                                                                                                                                           reduction in Berlin1
                                                                                                                                                                                                   3.9                   ~3.81
                                                                                                                         Market rent growth
     Sustainable rent growth momentum and structural                                                                                                          3.3                                                         ~0.82
                                                                                                                                                                                                                3.1
     supply/demand imbalance in these urban areas                                                                                                 2.9
                                                                                                                                                                                                                          ~3.0
                                                                                                                                      2.5
     safeguard highly robust top-line.                                                                                    1.9

     Focus on scale, standardization and industrialization
     delivers increasing efficiencies.

                                                                                                                         2013        2014        2015        2016        2017         2018         2019       2020      2021(E)

    High occupancy rates – vacancies almost all modernization
                                                                                                                      Scale and efficiency gains in Germany2
    related
                                             97.6          97.5          97.6          97.4          97.6                                                                                               76.5%         76.7%
                               97.3                                                                                                                                                       75.0%
    96.5         96.6                                                                                                                                                        73.6%
                                                                                                                           830                                  71.4%
                                                                                                                                       754         67.7%
                                                                                                                                      63.8%
                                                                                                                         60.8%                       645         343           346           361          357         355
                                                                                                                                                    324           570
                                                                                                                                                                               498
                                                                                                                                                                                             445
                                                                                                                                                                                                          394          405
                                                                                                                          179          184

    2013        2014          2015          2016          2017          2018          2019          2020                 2013         2014         2015         2016          2017         2018          2019         2020
                                               Occupancy rate                                                                                                                     Adj. EBITDA Operations Margin
                                                                                                                                 Avg. number of units (‘000)
                                                                                                                                                                                  Cost per Unit
1 If the current Berlin-specific rent freeze regulation is in place at the end of 2021, we expect to come out towards the lower end of the range; if the legislation is no longer in place at the end of 2021, we expect to come
out towards the higher end of the range. A ruling by the Federal Constitutional Court is widely expected in Q2 2021. 2 EBITDA Operations margin = (Adj. EBITDA Rental + Adj. EBITDA Value-add – intragroup profits) /
Rental revenue. 2019 onwards, margin includes positive impact from IFRS 16. Cost per unit is defined as (Rental revenue – EBITDA Operations + Maintenance) / average no. of units. Incremental cost per unit is ca. €250
in Germany.

FY 2020 Earnings Call & Investor Presentation                                                               page 35
Cost per Unit – Peer Comparison
Residential Real Estate Is a Scalable Business
                                      1. FY2020 Results                                          2. Investor Presentation                                              3. Additional Information

  Cost per unit is a simple and straight forward measure to compare efficiency: the fully loaded operating costs

  (property related costs plus overhead) divided by the average number of apartments. Maintenance expenses are

  excluded in this calculation, as maintenance levels are largely discretionary and more or less maintenance

  spending is not a sign of (in)efficiency.

  Cost per Unit Comparison 2014 and 2019: Increased scale leads to increased efficiency. More scale leads to more efficiency.

                           1000

                           900

                           800                                   -15%
                                                                                       -28%
  Cost per unit (€/year)

                           700

                           600
                                                                                                                                               -48%

                           500

                           400

                           300

                           200
                                  0              50           100                     150                      200                      250                      300                  350          400
                                                                                                    Average units ('000)

                                                 2014     2019             Vonovia (Germany)                                    Peer 1                                 Peer 2
Cost per unit is defined as (Rental revenue – EBITDA Operations + Maintenance) / average no. of units. Peer group includes Deutsche Wohnen (excl. nursing) and LEG.

FY 2020 Earnings Call & Investor Presentation                                                          page 36
Megatrends – Challenge & Opportunity
                   1. FY2020 Results                        2. Investor Presentation                   3. Additional Information

                                                                    Energy
                      Urbanization                                 efficiency                                   Demographic
                                                                                                                  change

An increasing part of the population                Ca. 1/3 of greenhouse gas                   An increasing share of the
     is moving into urban areas                 emissions are related to real estate             population is 65+ years

We are providing apartments at                  We are a driving force of the              We are preparing at least one
fair price levels to a growing                  industry and have embarked on a            third of all apartments that
urban population                                climate path that will result in a         become vacant for elderly tenants
Our products and services give more             CO2 neutral portfolio by 2050              Demographic changes require
than one million people an affordable           The energy-efficient modernization of      refurbishing apartments to enable an
home in their apartment and                     the housing stock and innovative           ageing population to stay in their
neighborhood                                    solutions for carbon neutral residential   homes with little or no assistance for
                                                neighborhoods are paramount for            longer
                                                achieving climate protection targets

       Our scale, sustainable business model and access to capital markets
        enable us to assume a leading role in our industry for finding and
                             implementing solutions.
FY 2020 Earnings Call & Investor Presentation                     page 37
Disciplined Capital Allocation Focused on Long-term Earnings and Value
Creation
                               1. FY2020 Results                                                2. Investor Presentation                                                                                        3. Additional Information

                                                                                                                                                                                                                                                                    2.38
                                                                                                                                                                                                                                                    2.25
                                                         70% of recurring cash earnings (FFO) paid                                                                                                              1.90
                                                                                                                                                                                                                                    2.06
                                                                                                                                                                                                                                                                             1.692
    Organic Core Business

                                                                                                                                                                                            1.63
                                                         out as dividend                                                                                                                                                                   1.44
                                                                                                                                                                                                                                                            1.57

                             Dividend                    We expect to continue to be able to deliver                                  0.95                   1.00
                                                                                                                                                                           1.30
                                                                                                                                                                                    0.94
                                                                                                                                                                                                      1.12
                                                                                                                                                                                                                          1.32

                              policy                                                                                                              0.67              0.74

                                                         sustainably growing dividends
                                                         Scrip dividend option since FY2016                                              2013                 2014               2015           2016             2017                2018               2019           2020           2021(E)
                                                                                                                                                                                              Recurring cash earnings ("FFO")1                                       Dividend
                                                                                                                                                                                                                                                                                           1,300
                                                                                                                                          €m                                                                                                                                                 -
                                                         Investments in modernization and new                                                      New construction to hold
                                                                                                                                                                                                                                                                                           1,600
                                                                                                                                                                                                                                                        1,489
                                                         construction to hold to address the                                                       Upgrade Building
                                                                                                                                                                                                                                                                           1,344
                                                                                                                                                                                                                                     1,139

                            Investment                   megatrends urbanization, energy efficiency                                                Optimize Apartment
                                                                                                                                                                                                                    779

                             Program                     and demographic change
                                                                                                                                                                                 356
                                                                                                                                                                                                     472

                                                         Drives organic earnings, value growth, and                                         71
                                                                                                                                                               172

                                                         overall portfolio quality                                                       2013                 2014               2015            2016              2017              2018               2019               2020        2021(E)

                                                                                                                                                                                                                                                                                      416
                                                         Disciplined and opportunistic approach                                           ‘000 apartments                                                                                               5

                                                         Clear set of criteria to safeguard earnings
                                                                                                                                                                                                                     319
                                                         and value growth for shareholders
                              M&A                        Impeccable track record of execution with
                                                                                                                                                   180
    Opportunistic

                                                                                                                                                                                     88

                                                         >300k apartments acquired and integrated
                                                         since IPO                                                                                 IPO                            Sales                             Acq.                   New construction                           2020

                                                         Shareholder authorization in place (until
                                                                                                                                    70
                                                         2023)                                                                      60
                                                                                                                                    50

                              Share                      General preference for allocating capital to                               40
                                                                                                                                    30

                            buy-backs                    long-term growth of the company                                            20
                                                                                                                                    10
                                                                                                                                     0
                                                         Potentially an option in case shares trade
                                                                                                                                         Jul-13

                                                                                                                                                               Jul-14

                                                                                                                                                                                   Jul-15

                                                                                                                                                                                                       Jul-16

                                                                                                                                                                                                                           Jul-17

                                                                                                                                                                                                                                               Jul-18

                                                                                                                                                                                                                                                                  Jul-19

                                                                                                                                                                                                                                                                                       Jul-20
                                                                                                                                                    Jan-14

                                                                                                                                                                        Jan-15

                                                                                                                                                                                            Jan-16

                                                                                                                                                                                                                 Jan-17

                                                                                                                                                                                                                                      Jan-18

                                                                                                                                                                                                                                                         Jan-19

                                                                                                                                                                                                                                                                             Jan-20

                                                                                                                                                                                                                                                                                                Jan-21
                                                         at steep discount to Adj. NAV
                                                                                                                                                                                  VNA share price                                   Last reported Adj. NAV
1    Based on prevailing internal management KPI, which was FFO1 from 2013-2018 and Group FFO starting in 2019.   2   To be proposed to the Annual General Meeting on April 16, 2021.

FY 2020 Earnings Call & Investor Presentation                                                         page 38
Market Outperformance
                          1. FY2020 Results                                                      2. Investor Presentation                                                  3. Additional Information

  Since the IPO in 2013, Vonovia has consistently outperformed the real estate
  sector and the wider equity markets.

 305%

                                                          131%

              68%
                                                                                                                    54%
                                    40%
                        33%                                            28%                                                                                                    28%
                                                                                   9%                                            6%                                                        4%
                                                                                                                                             2%
 Dividend                                                 Dividend                            -3%                  Dividend                            -4%                   Dividend
                                                                                                                                                                                                       -5%
Share price                                              Share price                                              Share price                                               Share price                         -13%
 Vonovia      DAX     EuroStoxx EPRA                      Vonovia       DAX     EuroStoxx EPRA                      Vonovia      DAX     EuroStoxx EPRA                      Vonovia       DAX     EuroStoxx EPRA
                         50     Europe                                             50     Europe                                            50     Europe                                             50     Europe

              Since IPO                                                  5 years                                                   3 years                                                    1 year
Note: As of Dec. 31, 2020. DAX is a performance index with dividends reinvested; EURO STOXX 50 and EPRA Europe are excl. dividends. Vonovia share price return is calculated as the percent change of end of period over
beginning of period; Vonovia dividend return is calculated as cumulative DPS over the period as a percent of the share price at the beginning of the period.

 FY 2020 Earnings Call & Investor Presentation                                                         page 39
M&A Philosophy
Growing through Acquisitions Makes Sense – But Only at the Right Price
                   1. FY2020 Results                   2. Investor Presentation                         3. Additional Information

 Acquisition philosophy                                                  Acquisition criteria

   Increased scale delivers efficiencies, performance and
                                                                                        Strategic Rationale
   value growth.
   In principle, any acquisition in our core markets makes
   sense – but only if it is made at the right price.                      Long-term view of the portfolio with a focus
   We remain disciplined and opportunistic.                                         on urban growth regions
        No quantitative acquisition target
        No target ratios for the geographic distribution of                             Financial Discipline
        our portfolio
        Management is not incentivized through                                               At least neutral
        acquisitions                                                                   to investment grade rating
                                                                                  (assuming 50% equity/ 50% debt financing)
   M&A is a key element of our strategy. On the basis
   of our acquisition criteria we keep up-to-date models
   for any acquisition opportunity of >1k                                               Earnings Accretion
   apartments in our core markets.
   We see these main competitive advantages
        Efficient operating platform and low incremental                            Accretive to EBITDA Rental yield
        cost per new unit
        Wide footprint across urban growth markets in
        Germany and selected European metropolitan                                         Value Accretion
        areas
        Access to capital markets
        Superior sustainability profile                                           At least neutral to EPRA NTA per share

FY 2020 Earnings Call & Investor Presentation                 page 40
Portfolio Volume More than Doubled since IPO
                             1. FY2020 Results                                                       2. Investor Presentation                        3. Additional Information

    Portfolio evolution (‘000 units)                                                                                  Major transactions

                                                     319                                         416                                                                         Synergies
                                                                              5                                                    Units        Strategic
                                                                                                                         Target                                               (over-)
                                                                                                                                  (‘000)        rationale
                                                    Hembla
                                                                                                                                                                             delivered
                                                 Victoria Park
                                                                                                                                   11         adding scale and
                                                                                                                                            additional exposure to
                                                    Buwog
                                                                                                                          2014                 growth regions

                                                    conwert                                                                        30         adding scale and
                                                                                                                                            additional exposure to
                                                    Südewo                                                                2014                 growth regions

                                                                                                                                  145          adding scale and
                                                                                                                                           establishing the German
                                                                                                                          2015                     champion

                                                    Gagfah                                                                         19         adding scale and
                                                                                                                                            additional exposure to
         180                                                                                                              2015                 growth regions

                                                                                                                                   23         adding scale and
                             Non-core                                                                                                       additional exposure to
                             disposals
                                                                                                                          2017                 growth regions
                                                      Vitus
                             Recurring                                                                                             48         adding scale in
                                                                                                                                           Germany and Austria;
                               sales                DeWAG
                                                                                                                                           acquiring development
                               -88                                                                                        2018                   capabilities

                                                                                                                                   14        entry into Swedish             no synergies in
                                                                                                                                                   market                   Swedish nucleus
                                                                                                                          2018
                                                                                                                                   21                                                  1

          IPO                 Sales                  Acq.               New                      2020                                      adding scale in Sweden
                                                                     construction                                         2019
1   Financial synergies from Hembla acquisition already realized. Operating synergies to come mostly in 2021.

FY 2020 Earnings Call & Investor Presentation                                                              page 41
Serving a Fundamental Need in a Highly Relevant Market
Our Business Is Deeply Rooted in ESG
                   1. FY2020 Results                       2. Investor Presentation              3. Additional Information

   We provide a home to around 1 million people from ca.
   150 nations.                                                                        All of our actions have more than
   CO2 emissions related to housing are one of the largest                              just an economic dimension and
   sources of greenhouse gas emissions.                                                  require adequate stakeholder
   As a listed, blue-chip company we are rightfully held to                                     reconciliation.
   a high standard.

                     Commitment to

                   climate protection
                                                          E S                             Responsibility

                                                                                      for customers, society

                                                           G
                   and CO2 reduction                                                     and employees

                                                Reliable and transparent corporate

                                                    governance built on trust

FY 2020 Earnings Call & Investor Presentation                    page 42
Recognition of ESG Performance
ESG Ratings and Indices
                      1. FY2020 Results                                             2. Investor Presentation                                       3. Additional Information

 ESG Ratings

                                                                                                                               Upgraded in both ratings in 2020; Risk rating
                                                                                                                               within 1st percentile of global rating universe

                                                                                                        ESG Risk Rating 2020       100                ESG Company Rating           83
                                                                                                                                             50              52           58
                                                                                                      7.7                           50

   2016               2017                     2018           2019              2020                                                  0
                                                                                                                                            2017          2018          2019       2020

                                                      Upgraded from BBB to A
                                                                                                                                             Reduced from B to B-

  30%                                                                                             40%
  20%
                                                                                                  20%
  10%
   0%                                                                                               0%
            CCC            B              BB          BBB         A        AA       AAA                           D                 C                    B                     A

                                                      Upgraded from C- to C
                                                                                                                                                       Inclusion in Dow Jones
                                                                                                                                     57              Sustainability Europe Index
  40%

  20%                                                                                                                  No participation in 2020. See Vonovia‘s open letter at
                                                                                                                      https://investors.vonovia.de/websites/vonovia/English/4080/news-
   0%                                                                                                                            detail.html?newsID=2024595&type=corporate
          D-      D      D+      C-        C      C+     B-   B       B+   A-   A      A+                               Constructive dialogue with GRESB to try and enable
                                                                                                                                        participation going forward

 ESG Indices

 Vonovia is a constituent of various ESG indices, including the following: DAX 50 ESG, STOXX Global ESG Leaders,
 EURO STOXX ESG Leaders 50, STOXX Europe ESG Leaders 50, Dow Jones Sustainability Index Europe.

FY 2020 Earnings Call & Investor Presentation                                               page 43
You can also read