MOZAMBIQUE ECONOMIC UPDATE - Mind the Rural Investment Gap December 2019
←
→
Page content transcription
If your browser does not render page correctly, please read the page content below
Public Disclosure Authorized   Public Disclosure Authorized   Public Disclosure Authorized                               Public Disclosure Authorized

                                                                      December 2019
                                                                                                                      UPDATE
                                                                                                                      ECONOMIC
                                                                                      Mind the Rural Investment Gap
                                                                                                                      MOZAMBIQUE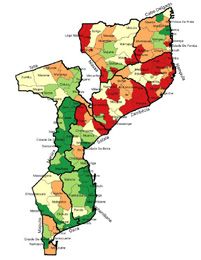
mozambique economic update december 2019

The World Bank’s Mozambique Economic Update (MEU) series is
designed to present timely and concise assessments of current
economic trends in Mozambique in light of the country’s
broader development challenges. Each edition includes a
section on recent economic developments and a discussion of
Mozambique’s economic outlook, followed by a focus section
analyzing issues of particular importance. The focus section in this
edition explores the disparities in access to basic infrastructure
for service delivery between Mozambique’s provinces and
provides recommendations to improve the distribution of the
public investment program. The MEU series seeks both to
inform discussions within the World Bank and to contribute
to a robust debate among government officials, the country’s
international development partners, and civil society regarding
Mozambique’s economic performance and key macroeconomic
policy challenges.

The cutoff date for the current edition of the MEU was November
30, 2019.

                                                                              i
Contents
Abbreviations and Acronyms ......................................................................................................................................... iv
Acknowledgements ...................................................................................................................................................... v
Executive Summary ...................................................................................................................................................... 1
Part One: Recent Economic Developments ........................................................................................................ 4
Economic Growth .................................................................................................................................................. 4
Exchange Rate and Inflation ................................................................................................................................ 9
The External Sector ................................................................................................................................................. 10
Fiscal Policy ............................................................................................................................................................... 14
Monetary policy ...................................................................................................................................................... 19
Part Two: Mind the Rural Investment Gap ............................................................................................................ 23
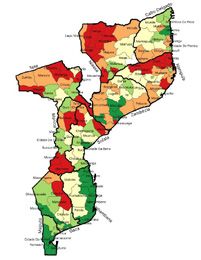
A Growing Gap in Access to Basic Infrastructure ........................................................................................... 24
Did the Public Investment Program Contribute to the Growing Disparities in Access? ...................... 26
The Spatial Distribution of the Public Investment Program ......................................................................... 27
Why Invest in Closing the Rural Investment Gap? ......................................................................................... 30
How to Close the Rural Investment Gap? ........................................................................................................ 33
References ..................................................................................................................................................................... 36
FIGURES
Figure 1: Reduction in electric lighting in Beira after Idai .............................................................................. 5
Figure 2: Estimated number of poor directly affected by floods and destructive winds associated
with Cyclone Idai ..................................................................................................................................... 5
Figure 3: Cyclonic shocks have weakened crop production in 2019 ........................................................ 7
Figure 4: … and coal production is also lower .................................................................................................. 7
Figure 5: In contrast, demand for service and manufactured goods is starting to recover ................. 7
Figure 6: GDP growth is expected to narrow in 2019, before recovering towards 5 percent in 2021 ... 7
Figure 7: Requests for bribes are increasing and most common when obtaining a construction
permit or electricity connection ......................................................................................................... 8
Figure 8: If all local good practices were adopted, Mozambique’s global performance would improve
by 22 places ............................................................................................................................................. 9
Figure 9: Lower food price pressures have contributed to an easing in overall inflation .................... 10
Figure 10: The recent real exchange appreciation may be contributing to slower non-extractive
export growth .......................................................................................................................................... 11
Figure 11: The CAD (excluding capital gains) is set to remain stable in 2019 ............................................ 12
Figure 12: …as lower import levels .......................................................................................................................... 12
Figure 13: … offset a drop in commodity exports ............................................................................................... 12
Figure 14: High FDI levels continue to support the external position .......................................................... 12
iimozambique economic update december 2019
Figure 15: Progress in fiscal adjustment has been reverted in 2019 .............................................................. 17
Figure 16: Spending on priority sectors is set to pick up in 2019 reflecting higher capital expenditures .......... 17
Figure 17: Currency appreciation has helped to bring total debt down .............................................................. 17
Figure 18: …but domestic debt pressures are growing ............................................................................................. 17
Figure 19: Inflation easing has set the stage for further policy rate cuts but at a gradual pace ….................. 20
Figure 20: … whilst FX reserves requirement increased during the year ............................................................... 20
Figure 21: …but interest rates remain amongst the highest on the continent .................................................... 20
Figure 22: …which has contributed to dampened credit growth ........................................................................... 20
Figure 23: Growth in mobile wallets has exceeded bank accounts ....................................................................... 21
Figure 24: …but women continue to be underpresented ........................................................................................ 21
Figure 25: Mozambique has a large infrastructure gap ............................................................................................. 23
Figure 26: Regional disparities in access are evident ................................................................................................. 24
Figure 27: …and largely mirror the country’s poverty trends .................................................................................... 24
Figure 28: Public administration was the largest investment spending category prior to 2015 ..................... 27
Figure 29: … but fiscal consolidation contributed to shedding of public administration spending ............... 27
Figure 30: Insufficient progress was made in channeling resources to underserved areas ............................ 28
Figure 31: …with expenditure trends mirroring access indicators .......................................................................... 28
Figure 32: A large share of the budget for roads focused on urban connectivity, whilst non-roads spending
is more evident as the levels of urbanization decrease ......................................................................... 29
Figure 33: Investment levels tend to have a weak relationship with population growth ................................. 29
TABLES
Table 1: Growth outlook ................................................................................................................................................ 6
Table 2: The Balance of Payments .............................................................................................................................. 13
Table 3: External outlook ............................................................................................................................................... 14
Table 4: Government Finances (commitment basis) .............................................................................................. 18
BOXES
Box 1: Exposure and socioeconomic vulnerability to Cyclone Idai ................................................................ 5
Box 2: What is the recent experience of Mozambican firms with corruption? ............................................ 8
Box 3: Advancing reforms for an enabling business environment – evidence from Mozambique’s
Subnational Doing Business .......................................................................................................................... 9
Box 4: Strengthening financial inclusion in Mozambique: progress to date and further reforms needed ... 21
Box 5: The access to basic infrastructure index ................................................................................................... 25
Box 6: The economy-wide model ........................................................................................................................... 30
Box 7: District level fixed effects model specifications ....................................................................................... 32
iiiAbbreviations
and Acronyms
BdM Bank of Mozambique (Banco de Moçambique)
BoP Balance of Payments
CAD Current-Account Deficit
CGE Computed General Equilibrium (model)
CGT Capital Gains Tax
CPI Consumer Price Index
FAO Food and Agriculture Organization of the United Nations
FDD State Development Fund (Fundo de Desenvolvimento Estatal)
FDI Foreign Direct Investment
FPC Standing Lending Facility (Facilidade Permanente de Cedência)
FPD Standing Deposit Facility (Facilidade Permanente de Depósito)
GDP Gross Domestic Product
GEP Global Economic Prospects
GFSM Government Finance Statistics Manual
GIEWS FAO Global Information and Early Warning System
IMF International Monetary Fund
INE National Statistics Institute (Instituto Nacional de Estatística)
IOF Household Survery (Inquérito sobre Orçamento Familiar)
IPI Industrial Production Index
LIC Low Income Countries
LNG Liquefied Natural Gas
MASA Ministry of Agriculture and Food Security (Ministério de Agricultura e Segurança Alimentar)
MBTU Million British Thermal Units
MEF Ministry of Economy and Finance (Ministério da Economia e Finanças)
MIMO Interbank Reference Interest Rate.
MPC Monetary Policy Committee
MPO Macro-Poverty Outlook
MSME Micro, Small and Medium Enterprises
Mt Metric tons
MZN New Mozambican Metical
NPL Non-Performing Loan
NSO National Statistics Organization
PER Public Expenditure Review
PERPU Urban Poverty Reduction Program (Programa de Redução da Pobreza Urbana)
PMI Purchasing Managers Index
RCF Rapid Credit Facility
REER Real Effective Exchange Rate
SADC Southern African Development Community
SAM Social Accounting Matrix
SOE State Owned Enterprise
SSA Sub-Saharan Africa
UNICEF United Nations Children’s Fund
US United States
USD United States Dollar
WB World Bank
WDI World Development Indicators
WEO World Economic Outlook
ivmozambique economic update december 2019
Acknowledgements
This edition of the Mozambique Economic Update was prepared
by a team led by Shireen Mahdi (Senior Economist, EA1M2). The
team included Anna Carlotta Allen Massingue (Research Analyst,
EA1M2), Fernanda Ailina Pedro Massarongo Chivulele (Research
Analyst, EA1M2), Brigida Tchamo (Program Assistant, AFCS2),
Ruben Barreto (Consultant, EA1F2), Julian Casal (Senior Financial
Sector Economist, EA1F2) and Javier Baez (Senior Economist,
EA1PV). Peer reviewers were William G. Bataille (Lead Economist,
EA1M1), Jean-Pascal Nguessa Nganou (Senior Economist, EEAM1)
and Ricardo Santos (Research Fellow, UNU-WIDER). The report
was prepared under the overall guidance and supervision of Mark
R. Lundell (Country Director, AFCS2) and Mathew Verghis (Practice
Manager, EA1M2).
vexecutive summary
Executive
Summary
manufacturing, backbone services or non-
Recent Economic extractive export growth. So, having put much
Developments. of the past economic volatility behind, structural
reforms for more sustainable and inclusive
As 2019 drew to a close, a year when growth must return to the center of the agenda,
Mozambique faced devastation caused by two with the objective of recovering from the recent
severe cyclones, the country looks ahead having cyclones in the short-term and, in the medium
made significant progress in terms of economic term, of using the LNG opportunity to produce,
stability, having strengthened its external buffers export and employ.
and having improved its fiscal position. The
metical has been broadly stable since mid-2017,
contributing to reduced inflationary pressures Estimated number of poor directly affected by
and providing room for an appropriately floods and destructive winds associated with
cautious monetary policy easing cycle. Growing Cyclone Idai
investment flows, mostly linked to the extractive
1 331 868
industries, have bolstered international reserves.
Additional progress has been made in fiscal
management with a notable reduction in the
primary deficit between 2015 and 2018 and 638 941
significant efforts to protect priority spending. 375 720 317 207
Plus, with the progress to date in advancing its
LNG interests, there is much to anticipate from
the coming years. So, in this context and as the
government enters a new term, where should Sofala Manica Zambezia Total
the focus of policy makers be? Source: World Bank staff calculations.
The challenge remains to be growth. Growth The fiscal outlook is also challenging. Having
was set further back in 2019 as Cyclones Idai and made progress in consolidating public finances
Kenneth and slower coal production affected up to 2018, the costs of the cyclone response,
output and is expected to fall to around 2.3 the electoral cycle and a still growing civil service
percent in 2019, down from 3.3 percent in 2018. wage bill forced the departure from this trend
With a population growth rate of 2.8 percent, in 2019. And although debt levels have declined
this translates into a decline in the standard of since 2016, the debt burden is still elevated.
living. Poverty has been further aggravated by Thus, the outlook points to a tight fiscal setting
the cyclones, which are likely to have impacted and requires near term measures to reduce the
both the urban and rural poor in the affected deficit. A persistent focus on increased efficiency
areas. Growth is expected to accelerate with in expenditure, tackling the sources of fiscal
developments in the LNG sector and progress risk and continued improvements in revenue
in post-cyclone reconstruction. But much of this management is essential in the coming years
expected growth is generated from the demand to bring financing down whilst meeting national
side of the economy, namely extractives-led development needs. And whilst significant
investment and growing consumer demand, progress has been made with subsidy reforms
and less so from the supply side such as in recent years, measures to control the civil
1mozambique economic update december 2019
service renumeration and to restructure loss- significant deterioration in rural connectivity and
making SOEs are critical. contributing heavily to the overall decline in the
measure of access to basic infrastructure.
Lastly, Mozambique is entering a period of
widening current account deficits as it enters With this context in mind, the report asks if the
the early stages of the LNG investment cycle. large increases in public expenditure during
As in previous years, the current account deficit Mozambique’s 2009 to 2015 investment boom
is expected to be largely financed by foreign years boosted funding to the underserved
direct investment and, increasingly, by LNG areas: did the public investment program
project financing. It enters this cycle with an seek to address the growing disparities? The
improved external reserve position bolstered by results indicate that the provinces with the
investment inflows. But lackluster non-extractive lowest levels of access to basic infrastructure
export performance, lower growth in key trading in 2009 were amongst the least well-funded in
partners and commodity price movements subsequent years. Per capita investment levels
continue to be a source of external risk for were relatively lower in northern and central
Mozambique. Moreover, large forex inflows zones, especially Nampula, Zambezia and
in the medium to long-term are an additional Cabo Delgado, which are amongst the most
source of risk if not well managed. Mozambique underserved areas. It also indicates that capital
is set to receive a significant influx of foreign investment in roads has been skewed towards
currency: firstly to finance LNG projects then, urban areas, contributing to the declining rates
towards the end of this decade, as natural of rural connectivity, whereas the non-road
resource revenues. If not well managed, this capital budget was more balanced, potentially
influx could result in a significant strengthening reflecting progress in rural water, electricity and
of the local currency which would erode health access. Moreover, the analysis notes that
Mozambique’s competitiveness on the global only 42 percent of the investment budget went
market and place further pressures on the to capital expenditure on basic infrastructure for
external position. Mismanagement could also service delivery between 2009 and 2015, with
hinder the good use of these resources through the remainder going towards non-capital outlays
a well-executed public investment program and such as administrative and overhead costs.
savings of surplus income for future generations.
Mind the rural Composition of the investment budget (%)
investment gap. 2009-15
The special focus section of this edition of the 22%
Mozambique Economic Update places a spotlight Public
Administration
on public investment in basic infrastructure, a
topic of significant importance if Mozambique
is to raise equality in opportunity and pursue
more inclusive growth. First, it asks whether 36% 42%
Recurrent Capital
disparities in access to basic infrastructure are
growing or declining. The analysis finds that
overall, disparities have been growing between
rural and urban areas, especially in the rural Source: World Bank staff estimates based on MEF and BOOST.
parts of Mozambique’s central and northern
provinces. Beneath the regional trends is mixed The section concludes by recommending
performance at the sectoral level, with mild setting specific targets to reach underserved
improvements in access to water, electricity areas in the Plano Quinquenal do Governo and
and health facilities. However, access to the Plano Económico e Social, taking a forward-
transport deteriorated significantly, along with looking approach to target areas with growing
a moderate deterioration in access to primary populations, revising budget allocation formulas
schools, on average. The deterioration in access to account for access gaps and reducing the
to transport is particularly notable, indicating a misallocations of investment resources to
2executive summary recurrent or administrative uses through a sound widen fiscal space significantly in the late 2020s. public investment management system. Looking In this favorable context, such reforms will help ahead, Mozambique is approaching a second in getting public investment priorities right to investment boom in the coming decade as ensure that the population benefits evenly from revenues from gas production are expected to these resources. 3
mozambique economic update december 2019

Part One:
Recent Economic
Developments
Economic Growth                                                  the severe weather that accompanied the cyclone
                                                                 is estimated to have destroyed about 15 percent
Mozambique’s reliance on the extractive                          of planned agricultural output for the year, a large
sector and exposure to climate shocks was                        dent to a sector that accounts for 22 percent
evident in 2019 as lower coal production                         of GDP.3 As a result, Mozambique is currently
and tropical cyclones contributed to a                           experiencing severe food insecurity in some areas
further reduction in growth.                                     with an atypically high number of households in
                                                                 need of emergency assistance.4 Production of key
Still healing from the economic fallout that                     cash crops which contribute to exports, such as
followed the hidden debts crisis, Mozambique’s                   cotton and sugar, was also affected (Figure 3).
economy was set further back in 2019 as
Cyclones Idai and Kenneth1 and slower coal                       Furthermore, coal production, which had been
production dented output. GDP growth is                          an important driver of growth since 2017, has
expected to fall to around 2.3 percent in 2019,                  slowed. Coal is affecting growth in two ways.
down from 3.3 in 2018.2 With a population growth                 Firstly, base effects are at play: with the 2017-
rate of 2.8 percent, this translates into a drop in              2018 ramp-up phase that had bolstered growth
GDP per capita in real terms and with this, a decline            in those years now slowing, production volumes
in the overall standard of living. Poverty has been              are more stable at a higher level. Secondly, coal
further aggravated by the cyclones, which are likely             operations have been affected by the heavy
to have impacted both the urban and rural poor in                rainy season at the start of the year, causing
the affected areas (Box 1).                                      production targets to be revised downwards for
                                                                 the second year in a row.5 With coal accounting
Cyclone Idai’s impact on agricultural production                 for 71 percent of extractives exports last year,
is one of the main contributors to lower growth                  and 33 percent of overall exports, these
expectations. The cyclone reached Mozambique                     circumstances have contributed to a significant
just before the first and largest harvest season of              drop in the extractive sector’s contribution to
the year and affected an area representing almost                growth in 2019 (Figure 4).
a quarter of Mozambique’s agricultural production.
And whilst not all production in the area was lost,              It is positive to note that private services and

1   In March and April 2019, Mozambique was struck by two consecutive major cyclones with significant impacts on local
    populations, business and core infrastructure. More than 1.7 million people were affected, with damages and losses amounting
    to US$ 3 billion, and an estimated US$ 3.2 billion of total cost for recovery and reconstruction.
2   The World Bank forecast for GDP growth in 2019 was revised downwards from 3.7 percent to approximately 2.3 percent
    post-cyclone Idai. GDP growth fell to 2.4 percent in the first half of 2019, down from 4.1 percent in 2018 and an average
    4.2 percent over the last three years.
3   World Bank staff estimates based on data shared by the Ministry of Agriculture and Food Security (MASA).
4   FewsNet, Food Security Outlook for Mozambique, June 2019.
5   In August 2019, Vale Mozambique revised production target for 2019 to from 14 million tons to 10 million tons, after having
    revised last year’s production targets from 16 million tons to 12 million tons.(see https://clubofmozambique.com/news/
    vale-revises-moatize-coal-production-downwards-139289/).

                                                                                                                             4
part one: recent economic developments
manufacturing, which together accounted of from 1.1 percent in the first half of 2018 to 1.3
39 percent of GDP in 2018, are slowly starting percent in the same period of 2019. This trend is
to recuperate. Stimulated by improving investor echoed by Mozambique’s Purchasing Managers
sentiment with progress in LNG investments, Index (PMI). This indicator of economic health
easing interest rates and gradually recovering for manufacturing and service sectors6 shows a
private demand, private services and manufacturing gradually improving trend backed by growth in
slightly increased their contribution to growth new orders and a pick-up in production (Figure 5).
Box 1: Exposure and socioeconomic vulnerability to Cyclone Idai
Cyclone Idai, one of the worst tropical have ravaged livelihoods in rural areas along
cyclones on record to affect Africa, struck its path, chiefly agricultural activities. Sofala
mostly the provinces of Sofala, Manica and and Manica, for instance, are important
southern Zambezia, causing catastrophic producers of maize, contributing nearly 30
damages. It is estimated that around 2,3 percent of the total production nationally.
million people resided in areas exposed to Overlaying the trajectory of the cyclone with
potentially destructive winds (above 119km/ land use maps suggests that a significant share
hour) and flooded by the torrential rains, equivalent to around half of the total output of
exceeding in some parts 50 centimeters. The maize may have been affected by the event.
city of Beira was one of the areas hardest Furthermore, evidence from Jokwe, a cyclone
hit by Idai. Satellite data on nighttime lights, of comparable magnitude that made landfall
a proxy of economic activity, fell by 75 in Mozambique in 2008, shows large drop on
percent relative to the levels of luminosity consumption, food security and assets, which
pre-disaster, indicating major damages to translated into sizable increases in poverty
infrastructure and economic systems in the among affected households. An analogous
city. The burden of the destruction appears level of vulnerability is seen in the parts from
to have disproportionally affected the parts Sofala, Manica and Zambezia impacted by Idai,
of the city with the largest concentration of where over half of the population affected (1.3
poor households. million people) were already poor and many
more were close to falling back into poverty
Along the same lines, Idai is expected to if hit by a large shock.
Figure 1: Reduction in electric lighting in Figure 2: Estimated number of poor
Beira after Idai directly affected by floods and destructive
winds associated with Cyclone Idai
4,000
Cyclone Idai
(March 15)
Sum of nighttime
1 331 868
light luminosity
3,000
2,000
638 941
1,000
375 720 317 207
0
1
M 2
M 3
M 4
9
24
1
ch
ch
ch
ch
ch
ril
ch
Ap
Sofala Manica Zambezia Total
ar
ar
ar
ar
ar
ar
M
M
M
Source: World Bank staff calculations based on nighttime Source: World Bank staff calculations.
light data from VIIRS.
Source: Poverty Global Practice - World Bank.
6 The Purchasing Managers’ Index™ (PMI) published by Standard Bank is a weighted average of the following five indices:
New Orders (30%), Output (25%), Employment (20%), Suppliers’ Delivery Times (15%) and Stocks of Purchases (10%).
5mozambique economic update december 2019
Growth is projected to accelerate in the production, professional services, real estate and
medium-term with developments in the transport, amongst others. Ensuring that steady
LNG sector and progress in post-cyclone progress is made in strengthening the business
reconstruction. environment, including at the sub-national level,
will improve operating conditions for firms
Mozambique is expected to follow an upward (see Box 3). Another important reform area is
growth trajectory over the coming years as it increasing the supply of skilled labor to firms. In
prepares to experience a second FDI boom. the long term, an improved education system
Progress with the post-cyclone reconstruction would enhance the supply of skills, but in the
program, a kick-off in the development short to medium-term, easing access to foreign
of Mozambique’s large LNG projects and labor where skills gaps exist may be beneficial.
recovering investor confidence, supported There are a number of other areas, including
by monetary policy easing and higher foreign reforms to support more rapid development
direct investment (FDI) inflows are expected of backbone digital services, promote financial
to steer growth towards 5 percent by 2021 inclusion and improve property rights. If paired
(Figure 6). After this, growth is set to begin with improvements in infrastructure and
increasing sharply in the mid-2020s as LNG connectivity, such a focused structural reform
production begins. program would provide a more conducive
setting for future growth.
Although the LNG industry will create an
impetus for growth in the medium-term, Post-cyclone rehabilitation efforts will also
the challenge of ensuring that these gains influence the pace of the growth recovery in
can boost growth and job creation in the central Mozambique. The reconstruction and
broader economy remains. As Mozambique’s recovery program could provide much-needed
LNG prospects begin to materialize and send stimulus to the economy in the short-term,
a positive signal to foreign investors, policy although the extent depends on two factors:
focus should increasingly be oriented towards financing and absorption capacity. The authorities
improving the macroeconomic management to estimated the total damages and losses caused
help de-risk the Mozambican setting, particularly by cyclones Idai and Kenneth at US$ 3.2 billion,
through more a sustainable debt outlook, of which approximately 38 percent has been
improved fiscal transparency and by tackling pledged by donors for relief and reconstruction.
corruption (see Box 2). The ability to convert pledges into disbursements
will be key in defining the timing and pace of the
Faster progress in the implementation of recovery. As it stands, the disbursement profile for
structural reforms will further strengthen many of the pledged amounts remains unclear.
linkages between the LNG sector and the rest More important still, will be the authorities’ ability
of the economy. As the LNG sector begins to ensure efficient and timely resource absorption
investing, inflows into the economy will create through strengthened implementation and
demand for a number of sectors, including food transparency mechanisms.
Table 1: Growth outlook
2018 2019p 2020p 2022p
Real GDP, % ∆ 3.3 2.3 4.3 5.0
Source: World Bank staff estimates. p = Projection
6part one: recent economic developments
Figure 3: Cyclonic shocks have weakened crop Figure 4: … and coal production is also lower.
production in 2019…
Production of key agricultural goods (% change), 2017 -19 Coal production (metric tons) and prices (US$/mt), 2015 – 19
20% 14,000 120
15% 12,000 100
10%
10,000 80
5%
0% 8,000
60
-5% 6,000
-10% 40
4,000
-15% 20
-20% 2,000
-25% - 0
Actual 2017/18 Estimates 2018/19 2015 2016 2017 2018 2019f
Maize Rice Legumes Tubers Coal production Coal prices, RHS
Source: MASA. Source: Vale Mozambique.
Figure 5: In contrast, demand for service and Figure 6: GDP growth is expected to narrow
manufactured goods is starting to recover in 2019, before recovering towards 5 percent
in 2021
Quarterly growth (% change) and Purchasing Managers GDP growth (% change), 2014 – 21
Index (> 50 = an improvement), 2018 - 19
54 4.5% 9%
52 4.0% 8% 7.4%
3.5% 7% 6.7%
50 3.0% 6% 5.0%
48 2.5% 5% 3.8% 3.7% 4.3%
46 2.0% 4% 3.4%
1.5% 3% 2.3%
44 2%
1.0%
42 0.5% 1%
40 0.0% 0%
Q1 Q2 Q3 Q4 Q1 Q2 Q3 -1%
2014 2015 2016 2017 2018 2019f 2020f 2021f
2018 2019
Quarterly growth in private services and Agriculture Extractives Manufacturing
construction, RHS Private Services Public Services
Purchasing Managers Index Tax GDP
Source: INE; Standard Bank Mozambique / IHS Markit. Source: INE; World Bank staff estimates.
7mozambique economic update december 2019
Box 2: What is the recent experience of Mozambican firms with corruption?
According to Mozambican firms, corruption is trends (41 and 33 percent, respectively). It
a major problem. Corruption, major or petty, is thus, of concern that in the most recent
is undesirable. A third of Mozambican firms World Bank enterprise survey (2018),
have cited it as a significant constraint to Mozambican firms cite corruption as the
their activities, mirroring regional and global main obstacle for their businesses.
Figure 7: Requests for bribes are increasing and most common when obtaining a
construction permit or electricity connection
% of firms that said "yes"
30
20
10
0
Getting an operating license
Getting import cleared
Getting export cleared
Paying taxes
Getting an electrical connection
Getting a water connection
Getting a phone connection
Getting a construction permit
Getting an import license
2007 2018
What are the bribes paid for? Firms and in sub-Saharan Africa. Bribes to get
report typically being asked to make an import or an operating license are also
informal payments when obtaining prevalent. Another type of corruption that
public services. Bribes to get electricity many Mozambican firms face are payments
or water connections and construction- to secure government contracts, which is
related permits are the most widespread. experienced by 13 percent of firms that
Demand for these bribes has increased reported having secured or attempted
when compared to 2007 and is at or above to secure a government contract in the
the average levels recorded both globally previous year.
Source: Mozambique Enterprise Survey, 2018.
8part one: recent economic developments
Box 3: Advancing reforms for an enabling business environment –
evidence from Mozambique’s Subnational Doing Business
The 2019 subnational doing business of the global ranking on trading across
(SDB) assessment found pockets of borders. The assessment, which considers
good practice in Mozambique, which, if four regulatory areas impacting the
scaled up nationally, would significantly business environment across the country
improve the business environment. For (starting a business, registering property
example, the Ressano Garcia border and enforcing contracts) also found that
post, where there has been a gradual contract enforcement is an area where
implementation of the one-stop border Mozambique performs well at five points
post project, ranks near the top third above the average for SSA.
Figure 8: If all local good practices were adopted, Mozambique’s global performance
would improve by 22 places…
2013 2014 2015 2016 2017 2018 2019f Hypothetical
110
115
120
125
130
135
140
145
150
Mozambique's overall ranking SSA average SADC average CPLP average
Source: World Bank Doing Business database.
Mozambique’s overall ranking would jump Mozambique’s current ranking). Similarly, a
22 places (assuming all other countries stay location where property registration takes 37
the same) if all country-wide good practices days (as in Inhambane), costs 5.2 percent of
were adopted. The SDB findings show that the warehouse value (as in Maputo City and
provinces across Mozambique have much to Zambezia), requires seven procedures (as in
learn from each other, and that some reforms six provinces14) and has a score of 10 on the
are of an administrative nature and can be quality of land administration index (as in Tete)
implemented in a short period of time. A would rank 113 — a jump of 20 places in the
hypothetical location where a commercial global ranking. Altogether, the assessment
dispute is solved in 348 days (as in Tete), shows that by adopting all the good practices
costs 21.8 percent of the claim value (as found at the subnational level across the four
in Manica) and scores 8.5 on the quality of indicator areas, Mozambique’s ranking would
judicial processes index (as in four provinces) jump 22 places on the overall ease of doing
would stand at 35 in the global ranking business, from 135 to 113 – exceeding the
on this indicator (132 places higher than average for SADC countries.
Source: Doing Business in Mozambique 2019 - World Bank.
Year-on-year inflation stood at 2.6 percent in
Exchange Rate November 2019 (down from 4.3 a year earlier)
and Inflation placing 12-month average inflation at 2.8
percent. Mozambique has now gone from being
Inflationary pressures remain low in a one of the countries on the continent with the
context of subdued domestic demand. highest inflation rate (having peaked at 26 percent
9mozambique economic update december 2019
in November 2016) to one with the lowest levels prices. Moreover, Cyclone Idai’s overall impact
in 2019. Mozambique’s USD exchange rate, an on inflation so far has been modest and mostly
important determinant of inflation, has remained localized. Beira, the area most affected, saw food
broadly stable, having traded at an average of 61 inflation reach 10.3 percent in April this year as
to the US dollar since mid-2017, contributing to agricultural output suffered, but with a weight
lower inflation. But other factors are also affecting of just 18.6 percent in national CPI and limited
the price setting, including a combination of weak integration amongst Mozambique’s agricultural
demand and recent downward revisions of fuel markets, its overall impact on inflation was muted.
Figure 9: Lower food price pressures have contributed to an easing in overall inflation…
Contributions to inflation (%) and USD/ MZN exchange rate, 2016 - 19
30% 80
75
25%
70
20% 65
15% 60
55
10% 50
5% 45
40
0%
35
Jan-16
Feb-16
Mar-16
Apr-16
May-16
Jun-16
Jul-16
Aug-16
Sep-16
Oct-16
Nov-16
Dec-16
Jan-17
Feb-17
Mar-17
Apr-17
May-17
Jun-17
Jul-17
Aug-17
Sep-17
Oct-17
Nov-17
Dec-17
Jan-18
Feb-18
Mar-18
Apr-18
May-18
Jun-18
Jul-18
Aug-18
Sep-18
Oct-18
Nov-18
Dec-18
Jan-19
Feb-19
Mar-19
Apr-19
May-19
Jun-19
Jul-19
Aug-19
Sep-19
Oct-19
-5% 30
Other non-food items Food items Electricity, gas and fuel Transport
Inflation - Mozambique Inflation - Beira MZN/USD, RHS
Source: INE.
The External Sector Commodity export performance in 2019 has
been lackluster with lower prices for some of
Mozambique’s current account deficit Mozambique’s largest commodities. Goods
(excluding capital gains receipts) is exports are expected to decline by 14 percent
expected to keep steady in 2019 as export in 2019. Coal and aluminum, which together
performance flags and megaproject accounted for approximately 60 percent of
imports decline. exports in 2017 and 2018, experienced significant
reductions in their prices in 2019 which has affected
The current account deficit (CAD), excluding overall export receipts (Figure 13). Coal prices at the
capital gains receipts, is expected to remain end of November 2019 were 33 percent lower
stable at around 31 percent of GDP in 2019 than at the end of 2018 whilst aluminum prices fell
(reducing to 25 percent of GDP with capital by 8 percent during the same period. Conversely,
gains).⁷ The megaproject deficit is expected to non-megaproject exports continued to increase in
narrow in 2019, despite a drop in commodity 2019, albeit at a slower growth rate. An 11 percent
exports, mainly due to a significant reduction appreciation of the real exchange rate (RER) since
in megaproject imports in the pre-LNG the start of 2018 may be contributing to the slower
investment phase. This counteracts a wider non- growth in exports. But, with the RER being well
megaproject deficit, driven mostly by growth below historical levels (Figure 10), it continues to
in consumer imports (Figure 11 and Figure 12; provide a better setting for export growth as seen in
Table 2). 2019 for sectors such as tobacco amongst others.
⁷ In 2019, Mozambique received USD 880 million (approximately 6 percent of GDP) in capital gains receipts from the sale
of assets in the LNG industry.
10part one: recent economic developments
Figure 10: The recent real exchange appreciation may be contributing to slower non-extractive
export growth
Real effective exchange rate index (2010 = 100) and Exports (USD millions), 2011 – 19
190 300
170
150 250
130
200
110
90 150
70
50 100
Jan-11
Jul-11
Jan-12
Jul-12
Jan-13
Jul-13
Jan-14
Jul-14
Jan-15
Jul-15
Jan-16
Jul-16
Jan-17
Jul-17
Jan-18
Jul-18
Jan-19
Jul-19
Real effective exchange rate, LHS Exports excl. coal and aluminum (3 month moving avg), RHS
Source: World Bank staff estimates based on BdM and INE data.
Bolstered by strong investment inflows, A softer global growth setting and falling
the external position remains adequate commodity prices present a less favorable
despite a growing current account deficit. external outlook.
As in previous years, the current account deficit Lower growth, globally and for key trading
was largely financed by foreign direct investment partners, and falling commodity prices continue
and, increasingly, by LNG project financing. FDI to be a source of external risk for Mozambique
inflows continue to be the main source of external (Table 3). Global growth has been revised
financing and are well above sub-Saharan Africa downward from 2.9 percent to 2.6 percent,
or low-income country averages (Figure 14), reflecting weaker than expected international
accounting for 64 percent of the CAD in 2019. trade and investment at the start of the year,⁸ thus
Private external debt to finance the LNG investment suggesting a sluggish outlook especially outside
program is also increasingly financing the deficit. the extractive sector. Weakening commodity
Non-megaproject FDI has also expanded in prices continue to be a cause for concern for
2019, bolstered by a large one-off investment for Mozambique’s key exports. Coal prices fell 42
ports and logistics in the Nacala Corridor whilst percent in the third quarter of 2019 (compared
investment levels in other sectors remain muted to the same period last year) following already
amidst a still weakened economic setting. steep declines in the second half of 2018 and
could weaken further if slower growth in China
With the significant increase in external inflows, weakens demand.⁹ The consequences of the
gross international reserves are expected geopolitical tensions in the Middle-East, and in
to reach approximately USD 3.7 billion by particular fears of rising oil prices, may also create
end 2019, covering around 6 months of added risk for the outlook.
imports (excluding megaprojects). This places
Mozambique’s reserves at an adequate level and Moreover, large forex inflows in the medium
increases capacity to cushion potential external to long-term are an opportunity to bolster
and domestic shocks. Mozambique’s external buffers but are also an
additional source of risk if not well managed.
⁸ World Bank Global Economic Prospects, June 2019.
⁹ Risks are skewed to the downside and include weaker global growth and environmental policies aimed at reducing air
pollution – particularly in China, which accounts for 11 percent of global demand.
11mozambique economic update december 2019
Mozambique is set to receive a significant influx would erode Mozambique’s competitiveness on
of foreign currency – initially to fund post-cyclone the global market and place further pressures
reconstruction efforts and to finance LNG projects on the current account deficit. In this context,
then, towards the end of upcoming decade, resource inflows are an opportunity provided
as natural resource revenues. If not managed that policy makers prioritize structural reforms,
well, this influx could result in a significant implement strategic investments well and increase
strengthening of the local currency, which institutional capacity to counteract risks.
Figure 11: The CAD (excluding capital gains) is Figure 12: …as lower import levels
set to remain stable in 2019…
Current Account Balance (USD millions), 2011-19 Goods and Service imports (USD million), 2011-19
1,000 0% 15,000
-
(1,000)
-20% 10,000
(2,000)
(3,000)
(4,000)
-40% 5,000
(5,000)
(6,000)
(7,000) -60% 0
2011
2012
2013
2014
2015
2016
2017
2018
2019f
2011
2012
2013
2014
2015
2016
2017
2018
2019f
Megaproject Non-megaproject
Overall CAB Overall CAB (excl. capital gains) Megaproject Non-megaproject Total imports
Source: BdM; World Bank staff estimates. Source: BdM; World Bank staff estimates.
Figure 13: … offset a drop in commodity exports Figure 14: High FDI levels continue to support
the external position
Exports (USD million) and price index (2005 = 100) of key
goods, 2016-19 Net foreign direct investment (% of GDP), 2012-19
3,500 250 40%
3,000 35%
200 30%
2,500
150 25%
2,000
20%
1,500 100 15%
1,000 10%
50
500 5%
- - 0%
2015 2016 2017 2018 2019f 2012 2013 2014 2015 2016 2017 2018 2019f
Coal exports Aluminum exports Mozambique SSA LIC
Coal (Australia USD/mt), RHS
Aluminum (USD/mt), RHS
Source: BdM; World Bank staff estimates. Source: BdM, WDI.
12part one: recent economic developments
Table 2: The Balance of Payments
(USD millions, unless 2016 2017 2018 2019 ∆ ∆ ∆
otherwise stated) Actual Actual Estimate Forecast 16/17 17/18 18/19
Current Account Balance
(% of GDP) -32.0 -19.6 -30.6 -25.1 … … …
Megaproject -3.4 8.0 -4.6 -2.4 … … …
Non-megaproject -28.6 -27.6 -26.0 -22.8 … … …
Current Account Balance
(% of GDP), excl. capital gains -32.0 -22.2 -30.6 -31.0 … … …
Megaproject -3.4 8.0 -4.6 -2.4 … … …
Non-megaproject -28.5 -30.2 -26.0 -28.6 … … …
Current Account Balance -3,846 -2,586 -4,502 -3,792 -33% 74% -16%
Trade Balance -4,106 -2,830 -4,544 -4,642 -31% 61% 2%
Goods, net -1,405 -498 -973 -2,007 -65% 95% 106%
Exports 3,328 4,725 5,196 4,472 42% 10% -14%
Megaproject 2,413 3,657 3,913 3,045 52% 7% -22%
Non-megaproject 915 1,068 1,282 1,426 17% 20% 11%
Imports 4,733 5,223 6,169 6,478 10% 18% 5%
Megaproject 771 733 1,277 1,206 -5% 74% -6%
Non-megaproject 3,962 4,490 4,892 5,272 13% 9% 8%
Services, net -2,701 -2,332 -3,571 -2,636 -14% 53% -26%
Income and transfers, net 260 244 42 851 -6% -83% 1906%
Capital & Financial Account 3,383 3,838 4,220 4,256 13% 10% 1%
of which
FDI, net 3,093 2,293 2,692 2,428 -26% 17% -10%
Megaproject 1,322 911 2,013 972 -31% 121% -52%
Non-megaproject 1,771 1,382 679 1,456 -22% -51% 114%
Other, net (1) 83 1,342 1,363 1,676 1520% 2% 23%
Overall Balance -463 1,253 -282 465 … … …
excl. capital gains & -463 903 -282 -415 … …
support for cyclones
Source: BdM, World Bank staff estimates.
Notes: A positive growth rate for the Current, trade and goods balances indicates a wider deficit.
(1) Other flows include net portfolio investment; net currency and deposits; loans; insurance, pensions and standardized guarantee
schemes (net); net trade credits and advances; net other accounts payable/receivable.
13mozambique economic update december 2019
Table 3: External outlook
2018 2019p 2020p 2021p
Nominal Commodity Price
Aluminum USD/mt 2,108 1,790 1,760 1,800
Coal, Australia USD/mt 107 79.0 71.0 69.8
Hard coking coal, Australia USD/t 194 184 162 157
Liquefied Natural Gas, Japan USD/mmbtu 10.7 10.7 10.0 9.8
Tobacco USD/mt 4,863 4,750 4,727 4,704
Current Account Deficit, % of GDP -30.6 -25.1 -39.6 -56.0
Financial and Capital Account, % of GDP 28.7 28.2 38.6 56.6
Net Foreign Direct Investment, % of GDP 18.3 16.1 22.0 28.8
Source: World Bank staff estimates, Thomson Research, KPMG Analysis; p = Projection.
Fiscal Policy
But recovery efforts following the tropical
Having made progress in consolidating cyclones, election related costs and a growing
public finances, costs associated with the wage bill added spending pressures in 2019
cyclone response and electoral spending, and are expected to push the primary deficit
along with a still growing wage bill have to 3.3 percent of GDP (excluding capital gains
reverted this trend in 2019. receipts). Immediate relief efforts and repair of
critical infrastructures have contributed to put the
With a reduction in the primary deficit from expected capital budget for 2019 at 7.7 percent
almost 6 percent in 2015 to 1.5 percent by of GDP. The other main source of pressure,
2018, Mozambique made significant progress which has persisted in recent years, stems from
in remedying its fiscal imbalances.¹⁰ The growing civil services salary costs, which have
overall fiscal deficit also narrowed from 7.1 to been steadily increasing from 10 percent GDP in
5.1 percent of GDP (Figure 15). While revenues 2015 to an estimated 12 percent of GDP in 2019.
(excluding capital gains) did experience slight It was therefore fortunate that Mozambique
growth (0.8 percentage points of GDP), most collected US$ 880 million in capital gains tax,
of the consolidation effort took place on the equivalent to 6 percent of GDP, from the sale of
expenditure side where total spending fell from assets between LNG operators this year. These
33 to 31 percent of GDP during this period. much-needed funds will cushion these spending
Considerable advances were also achieved on needs, support the authorities in continuing
key reforms to strengthen fiscal management, supplier arrears clearance and provide a buffer in
including better regulation of debt and guarantee the form of savings. It also brings the primary and
management, an improved legal framework for overall balances (including capital gains taxes -
managing state-owned enterprises and improved CGT) to an estimated 2.5 and -1.4 percent of
public investment management procedures. The GDP in 2019, respectively.
authorities have also cleared most of the validated
arrears which amounted to 2 percent of GDP in Spending on investment, social and
2018.¹¹ About 59 percent of these arrears were economic sectors: improving in a
repaid in 2018 and 2019, and an additional 26 challenging financing environment.
percent were settled through issuance of treasury
bonds in the first half of 2019. The authorities have continued to make
10 The primary balance is equivalent to the overall fiscal balance less interest payments.
11 In 2018 the government validated a total of MZN 13.5 billion arrears that have been accumulated since 2015. An additional
MZN 6 billion of estimated arrears are still being analyze.
14part one: recent economic developments
efforts to bolster priority spending on social metical during this period, as well as a significant
and economic sectors.12 After remaining steady reduction in external borrowing (Figure 17).
at 14 percent of GDP since 2016, spending on External debt ratios are lower when the debt
priority sectors went up by a percentage point of of the Empresa Nacional de Hidrocarbonetos
GDP to 15 percent in 2018, reflecting an increase (ENH)13 is excluded, declining from 95 to
in the investment budget for the health and 85 percent of GDP between 2016 and 2019,
infrastructure sectors (Figure 16). Safeguarding of reflecting the contribution Mozambique’s LNG
priority spending has also been helped by directing financing to the debt stock.14 Similarly, public
a share of the capital gains windfall received in sector debt (excluding ENH) dropped from 118
2017 towards rehabilitation of road infrastructure to 104 percent of GDP over the same period.
and the conclusion of several social projects. Yet, Yet, debt service obligations have continued to
overall, the burden of the fiscal adjustment since be elevated with the external and public debt
2016 has fallen disproportionately on a category service to revenue and grants ratios estimated
of expenditure that is important for future to reach 16 and 34 percent, respectively, at end
growth: public investment. A significant share 2019 (excluding capital gains tax).
of the fiscal adjustment to date relied on cuts
to the investment budget with capital spending With domestic credit growing as a source
having declined from 12 to 7.7 percent of GDP of financing, the stock of domestic debt
between 2015 and 2018, which if continued, has continued to grow. Central government
would result in reduced progress in access to domestic debt picked up by MZN 32 billion in
basic infrastructure. the first 9 months of 2019 (around 3.4 percent of
GDP) to meet budget financing needs, advance
Spending on social and economic sectors is with domestic arrears clearance and to support
set to increase further in 2019 but efficiency ailing SOEs. These needs brought the stock
of spending remains a challenge. At MZN 96 of central government domestic debt to 18.2
billion, total priority spending in the first 9 months percent of GDP by the end of September 2019,
of the year was 11 percent higher than the same up from 11.7 percent at end 2016. This increase,
period last year, driven by recurrent spending which has taken place during a period of high
in education and health and infrastructure interest rates, has raised the domestic debt
(in particular energy, public works and water) service burden to an estimated 2.2 percent of
sectors. This trend, along with the additional GDP in 2019, up from 1 percent in 2016. Looking
spending linked to cyclone recovery efforts, ahead, the maturity profile of these financing
suggests that priority spending could increase sources is contributing to considerable levels of
to 16.5 percent of GDP this year. Despite this, debt-service concentration: roughly 80 percent
efficiency of spending and the growing regional of the stock of treasury bonds as at June 2019,
inequality remain a challenge in Mozambique, estimated at 5 percent of GDP (equivalent to half
especially in key service delivery sectors. See of the domestic debt stock), is due between 2019
section two of this report for a more detailed and 2022, raising rollover risk in the medium-
discussion this topic. term (figure 18).
Although Mozambique remains in debt The authorities are have made progress in
distress, there has been progress in resolving the MOZAM bond default. The
improving the external debt profile. authorities concluded negotiations of the US$
727 million MOZAM 2023 bondholders in late
Although still elevated, debt levels are have 2019, resulting in a swap to a US$ 900 million
declined since 2016. Public sector external bond. Under the agreement, the maturity has
debt is estimated to have narrowed from 103 been extended from 2023 to 2031, and the
to 98 percent of GDP between 2016 and 2019 annual coupon rate has been reduced from
on account of a 13 percent appreciation of the 10.5 to 5 percent until 2023 and 9 percent from
12 Mozambique’s development plans consider as priority sectors education, health, infrastructures, agriculture, and social welfare.
13 Mozambique’s national hydrocarbons company.
14 IMF-World Bank Debt Sustainability Analysis (DSA) for Mozambique (2019) with GDP estimates for 2018 and 2019 updated.
15mozambique economic update december 2019
2023 onward. A US$ 40 million consent fee to of time, given current debt levels. As such,
bondholders is also included.15 The restructuring a persistent focus on increased efficiency
primarily offers cashflow relief. The resulting in expenditure, tackling the sources of fiscal
adjustment in Mozambique’s debt profile will risk and continued improvements in revenue
bring needed fiscal respite and could contribute management are essential in the coming year
to repairing the country’s credit rating over a to bring financing down whilst meeting national
period of time.16 In the meantime, the authorities development needs. With significant progress
took steps to legally challenge the Proindicus having been made with subsidy reforms in
linked debt and to advance negotiations with the recent years, measures to control the civil
creditors of the Mozambique Asset Management service remuneration and to restructure loss-
(MAM) linked debts.¹⁷ Nevertheless, the most making SOEs are critical.
recent debt sustainability analysis indicates
that Mozambique will remain at a high risk of This is the right time to strengthen medium-
debt distress in the medium term even under term fiscal planning, both to navigate through
the scenario that both the MOZAM and MAM the current fiscal context but also to establish
debts are restructured, and the Proindicus debt the framework for judiciously managing future
is excluded from the public debt stock. This resource inflows. If not managed well, an LNG
underlines the necessity of continued fiscal linked revenue boom would be a significant source
restraint and pro-active fiscal risk management of risk to macroeconomic stability. Managing
in the medium-term.18 these risks requires a battery of policies and
instruments including a credible medium-
The fiscal outlook remains concerning and term fiscal framework anchored in appropriate
requires near term measures to strengthen fiscal targets and a sovereign fund for saving
medium-term fiscal management. and smoothing volatility. Similarly, borrowing
decisions should be guided by a medium-term
The outlook points to a tight fiscal setting debt strategy anchored in sustainable debt
and the need to reign in the public sector’s objectives. Moreover, public investments would
financing needs whilst raising the efficiency of be more impactful if sourced from a pipeline of
expenditures, especially for service delivery and well-prepared projected that have been appraised
infrastructure sectors. Mozambique expects a from economic and social impact perspectives.
significant expansion in fiscal space with the start Improved reporting and fiscal and monetary policy
of LNG production. But these prospects require coordination are also essential. Mozambique
time to materialize. Given project development has made progress in some of these areas and,
and production flow timelines, a significant with additional efforts, can establish a solid
increase in fiscal revenues could potentially medium-term fiscal management framework
be 8-10 years away. This places Mozambique and the right conditions for managing any future
in a tight fiscal setting for an extended period resource boom.
15 http://www.mef.gov.mz/index.php/documentos/anuncios-e-comunicados/684-mozambique-reaches-an-agreement-in-
principle-on-the-key-commercial-terms-of-a-proposed-restructuring-transaction-relating-to-mozambiques-usd-726524000-
10-5-per-cent-notes-due-2023
16 Having downgraded Mozambique from B2 in August 2015 to CAA3 in July 2016, Moody’s upgraded Mozambique’s sovereign
debt rating by one notch, to Caa2, in September 2019. Similarly, adjustments to Mozambique’s sovereign credit ratings have
also been carried out by Fitch (from RD to CCC) and Standard & Poor (from SD to CCC+) in November 2019.
17 The Proindicus and MAM credits are part of the hidden debts package, and amount to US$ 622 million and US$ 535
million, respectively.
18 The IMF-Word Bank 2019 DSA for Mozambique shows that, despite improvements compared to baseline scenario, under no hidden
debt scenario present value of debt to GDP and debt service to revenue indicators would still breach their respective thresholds.
16You can also read