INVESTMENT CLIMATE REPORT 2020 - IN THE ARAB COUNTRIES

Page created by Richard Carroll
 
CONTINUE READING
INVESTMENT CLIMATE REPORT 2020 - IN THE ARAB COUNTRIES
INVESTMENT CLIMATE
REPORT 2020
IN THE ARAB COUNTRIES
INVESTMENT CLIMATE REPORT 2020 - IN THE ARAB COUNTRIES
ABOUT DHAMAN                                                                   TABLE OF CONTENTS
The Arab Investment & Export Credit Guarantee Corporation (Dhaman)
is a pioneer multilateral development organization that has provided           Letter from the Director-General                                3
guarantee services against commercial and political risks for the last 45
years. Established in 1974 in Kuwait as the first multilateral investment      SECTION 1:
guarantee provider in the world, Dhaman is owned by the governments of         Greenfield FDI into Arab world: Overview and regional trends    5
21 Arab States and 4 Arab financial institutions.
                                                                               SECTION 2:
Thanks to its very strong enterprise risk profile and very robust capital      What matters to investors in developing countries               17
and liquidity position, Dhaman is highly rated by Standard & Poor’s
global ratings since 2008. It’s rated AA– with stable outlook in April 2019.   SECTION 3:
                                                                               How Arab countries measure up?                                  23
Over the past twelve years, Dhaman accordingly consolidates its position
as a leading provider of trade credit and political risk insurance in the      SECTION 4:
Arab region.                                                                   Global FDI trends monitor: Impact of the outbreak Covid-19      31
                                                                               SECTION 5:
                                                                               Dhaman’s research insights: Greenfield FDI and political risk   39
 DHAMAN MISSION

                 To facilitate Arab exports, promote cross-border invest-
                 ment in the Arab region, and support the Member
                 Countries’ social and economic development by reduc-
                 ing risks and unleashing investment opportunities.

 DHAMAN VISION
                 To be a world-class specialized multilateral risk-
                 mitigating organization, serving as a strategic structure
                 driving forward Member Countries’ international trade
                 and investment schemes.

                                                                                           Head quarters
                                                                                           The Arab Organizations Headquarters Building, P.O BOX
                                                                                           23568 Safat 13096, Kuwait, State of Kuwait.
                                                                                           Telephone: +965 24959555 /000 Fax: +965 24959596 / 7
                                                                                           Email: operations@dhaman.org
INVESTMENT CLIMATE REPORT 2020 - IN THE ARAB COUNTRIES
3    INVESTMENT CLIMATE REPORT IN THE ARAB COUNTRIES 2020

    Letter from                                                      The globalization trend and the
                                                                     increasing interdependences of
                                                                                                            Based on the most recent data published by fDi Intelli-
                                                                                                            gence from The Financial Times Ltd, FDI greenfield
                                                                     world economies creates conside-       projects to our region amounted to an average USD 60
    the Director-General                                             rable opportunities for both deve-     billion in 2019, 27.2% lower than in 2018. This repre-
                                                                     loped and developing countries.        sents a 64% decrease compared to 2008, which was a
                                                                     Our region, with substantial hu-       peak year for greenfield FDI in the region, with USD
                                                                     man and natural resources, has         167 billion of capital expenditure and 1296 realized
                                                                     important potential to grow signi-     projects. Events that occurred in the last ten-year period
                                                                     ficant economic prospects, in          have had a negative spillover effect on the investment
                                             particular with respect to creating employment opportu-        attractiveness of the entire region.
                                             nities for millions of young people over the next two
                                             decades. Nonetheless, a number of challenges arise as          It is widely acknowledged that private sector develop-
                                             the increasing integration of national economies into          ment can build economic resilience in Arab countries.
                                             expanding international markets always comes with              A dynamic and vibrant private sector requires attracting
                                             various risks that spill beyond national borders. Indeed,      international firms by ensuring that international invest-
                                             businesses that engage in investment activities have to        ment finds an enabling environment. To compensate for
                                             face significant global business development risks as-         risks faced by foreign investors, governments in the
                                             sociated with changing legislations, expropriations,           region should strengthen investment policy frameworks.
                                             foreign currency inconvertibility troubles, inability to       Investment promotion agencies should also play a key
                                             repatriate funds and much more.                                role by developing targeted approaches to identify and
                                                                                                            reach out to adequate potential investors. Moreover,
                                             After almost a decade of sustained economic growth             risk mitigation mechanisms, including guarantees and
                                             and increased foreign investment inflows, economies in         political risk insurance, are needed to attract investors.
                                             the Arab region have since 2009 been exposed to re-
                                             peated external and internal shocks as a result of the         In this regard, the Arab Investment and Export Credit
                                             global economic and financial crisis. More importantly,        Guarantee Corporation (Dhaman) seeks to do more than
                                             political instability, conflicts, large-scale flows of refu-   offering custom-built insurance products for effective
                                             gees since 2011 and more recently Covid-19 virus glob-         mitigation of political risks. Dhaman is working conti-
                                             al outbreak have considerably slowed down the eco-             nuously with a number of partners, together with the
                                             nomic prospects of several countries in our region.            Member Countries, to pursue further tangible benefits
                                                                                                            of foreign direct investment by securing private in-
                                                                                                            vestment in key industries and providing decision-
                                                                                                            makers with up-to-date and reliable information.

                                              “ Dhaman   is working continuously
                                                with a number of partners to pur-
                                                      sue further tangible benefits of
                                                      foreign direct investment by secu-
                                                      ring private investment in key in-
                                                      dustries.
                                                                                                            Abdullah A. Alsabeeh
INVESTMENT CLIMATE REPORT 2020 - IN THE ARAB COUNTRIES
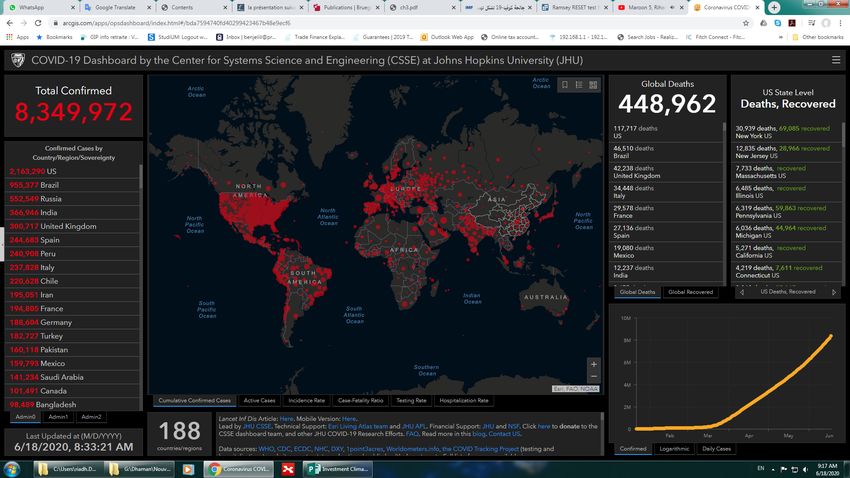
INVESTMENT CLIMATE REPORT IN THE ARAB COUNTRIES 2020   4
INVESTMENT CLIMATE REPORT 2020 - IN THE ARAB COUNTRIES
Section
Greenfield FDI into
Arab world            Overview and regional trends

                      This section of the report relies on a dataset on green-
                      field FDI projects into the Arab countries assembled
                      from a unique type of online database developed by
                      fDi Intelligence, a specialist division of the Financial
                      Times, which monitors cross border investments in
                      new projects and expansions of existing ventures, cov-
                      ering all sectors and countries worldwide since 2003.
                      The major advantage of the data source used with re-
                      spect to UNCTAD data is the availability of a sectoral
                      classification for each investment project. It contains
                      up to date and reliable information on countries of
                      origin and destination, and provides other relevant in-
                      formation, such as investment date, capital expendi-
                      tures, employment, sector and business activity under-
                      taken by the foreign affiliate.
                      Greenfield investments constitute a category of FDI in
                      which direct investors typically establish new enter-
                      prises in the host country. Greenfield investment
                      therefore involves the provision of fresh capital as op-
                      posed to reflecting a transfer in ownership of existing
                      assets (mergers and acquisitions).
INVESTMENT CLIMATE REPORT 2020 - IN THE ARAB COUNTRIES
INVESTMENT CLIMATE REPORT IN THE ARAB COUNTRIES 2020                                     6

Greenfield FDI into Arab world                                                                                                                                               FDI projects peaked in
                                                      TOTAL                                 ESTIMATED                             TOTAL                                      2008

Overview
                                                     PROJECTS                              JOBS CREATED                     COMPANIES
                                                                                                                                                                             Some 1,296 projects were record-
                                                     1092                                  115,837                                815                                        ed in 2008. This was the year in
                                                                                                                                                                             which the highest numbers of pro-
                                                                                                                                                                             jects were recorded. During this
                                                                                                                                                                             period a total of USD 167.31 bil-
■   FDI into Arab region accounted for 6% of                                                                                                                                 lions capital was invested, equat-
    global greenfield FDI in 2019, with project                                                                                                                              ing to a 13.5% of total capital in-
    numbers accounting for 5%.                                                                                                                                               vestment.

■   While the number of greenfield FDI pro-
    jects into Arab Region increased by 24%                                 TOTAL CAPEX
    to 1092 in 2019, capital investment de-                                                                                                                                   Key investors account for
    creased by 27% to $60.21 billions.
                                                                      $60.21 bn                                                                                               almost 40% of projects.
■   Manufacturing was the top business activi-                                                                                                                                The top 10% of investors have
                                                                                                                                                                              created a total of 5,598 projects,
    ty by capital investment, accounting for
                                                                                                                                                                              representing 38% of the total
    30% of FDI.                                                                                                                                                               projects. The combined capital
■   Real estate was the top sector by capital                                                                                                                                 investment from these companies
                                                                                                                                                                              reached USD 554.22 billions,
    investment in 2019, accounting for $8.97                                                                                                                                  equating to more than two-fifths
    billions or 15% of announced greenfield                                                                                                                                   of the total for all companies.
    FDI in the Arab region.
■   In total, 815 companies invested in the
    region, an increase of 16% on 2019.
                                                                                           167 305                                                                                           Top five desti-
                                                                                                                            FDI trends by year , 2003-2019                                   nations attract
                                                                                                                                                                                             the majority of
                                                                                                                                                                                             projects.
                                                                           112 005                     107 206
                                                                                                                                                                                             Out of a total of 20
“      Between January 2003 and December
       2019 a total of 14,816 greenfield FDI
                                                                  65 224
                                                                                                                                                         92 398
                                                                                                                                                                  72 136
                                                                                                                                                                           82 661
                                                                                                                                                                                             destination coun-
                                                                                                                                                                                             tries, the top five
       projects were recorded, equating to a                                                               61 125                                                                   60 208   account for the ma-
                                                                                                                59 477                     61 332
       5% share of global FDI. These projects
                                                           57 628                                                                 55 993
                                                                                                                                                44 251
                                                                                                                                                                                             jority of projects.
                                                  46 534                          49 103                                 48 374
       represent a total capital investment of                                                                                                                                               UAE is the top des-
                                                                                            1 296
                                                                                                     1 135 1 021 1 154 1 069                                                        1 092    tination     country
       USD 1,243 billions, which is an average                              831      701
                                                                                                                             951            820   770     775      824      878
                                                                                                                                                                                             accounting for al-
                                                                    618
       investment of USD 83.90m per project.       452      429                                                                                                                              most two-fifths of
                                                                                                                                                                                             projects tracked.
                                                  2003 2004 2005 2006 2007 2008 2009 2010 2011 2012 2013 2014 2015 2016 2017 2018 2019

                                                                                     Number of projects             Capital investment in USD million

Source: fDI Markets
INVESTMENT CLIMATE REPORT 2020 - IN THE ARAB COUNTRIES
7    INVESTMENT CLIMATE REPORT IN THE ARAB COUNTRIES 2020

                                                                                                                                   FDI into Arab Region by
Greenfield FDI into Arab world                       Number of FDI projects into top 10 Arab Countries, % change, 2019
                                                                                                                                    Project Numbers 2019

Regional                                                  Map shows the percentage change
                                                          from 2018 in project numbers.                       +7%
                                                                                                                           Destination Country
                                                                                                                           UAE
                                                                                                                                                        Projects
                                                                                                                                                            445

trends                                                           +56%
                                                                             +63%
                                                                                          +52%       +100%
                                                                                                              Bahrain

                                                                                                                +16%
                                                                                                                           Egypt
                                                                                                                           Saudi Arabia
                                                                                                                           Morocco
                                                                                                                                                            140
                                                                                                                                                            134
                                                                                                                                                            111
                                                               Morocco                               Jordan                Oman                              61
                                                                                          Egypt
                                                                            Tunisia                             UAE        Tunisia                           31
■   Egypt is the leading destination for FDI into                                                                          Bahrain                           29
    Arab region in 2019 with $13.7 billions of                                                                             Qatar                             28
    announced investments recorded.                                                                                        Jordan                            26
■   UAE continues to dominate FDI by number                                                                                Kuwait                            26
    of projects, recording 445 projects.                                                                                   Algeria                           24
                                                                                                                           Iraq                              13
■   UAE recorded one of the biggest increases
                                                                                                                           Lebanon                           12
    in FDI in absolute dollar value, with jobs
    created rising to 30,578 jobs.                                                                                         Djibouti                          3
                                                                                                                           Palestine                         3
■   The top 5 destination countries for FDI into
                                                                                                                           Sudan                             2
    Arab region account for 82% and 75% of
                                                                                                                           Mauritania                        2
    FDI in the region as a whole, by both num-
    ber of projects and capital investment re-                                                                             Libya                             2
    spectively.                                                                                                            Total                           1 092

■   Among the top 10 destination countries for
                                                                                                                    +7%          Shares in terms of number of FDI
    FDI into the region, Jordan, Tunisia, Moroc-                                         +28%
                                                                                                                                              projects
    co and Egypt achieved the strongest in-                                                                         Oman
    crease of number of projects with 100%,                                           Saudi Arabia
                                                                                                                                          Others
    63%, 56% and 52% respectively, in 2019.                                                                                                %18
                                                                                                Kuwait         Qatar
■   Qatar and Kuwait were the only two coun-                                                                                                                UAE
                                                                                                  -7%          -33%               Oman
    tries in the top to witness a decline in FDI                                                                                   %6                       %41
    by number of projects in 2019, achieving a
                                                                                                                                 Morocco
    rate of decline of 33% and 7% respectively.                                                                                   %10
                                                      Egypt has both the highest total and highest average investment                 Saudi
                                                      at $13.7 billions overall and $98 millions per project. UAE has                 Arabia
                                                      received the highest number of total jobs, while Egypt has the                               Egypt
                                                                                                                                       %12          %13
                                                      largest project size with 180 jobs per project on average.

                                                    Source: fDI Markets
INVESTMENT CLIMATE REPORT 2020 - IN THE ARAB COUNTRIES
INVESTMENT CLIMATE REPORT IN THE ARAB COUNTRIES 2020                      8

                                                                                                                                                      Recent Investor Signals
        FDI into Arab region by capital investment 2019         Real GDP growth rate 2019
                           CAPEX                    % Arab
Destination Country                   % Change
                         $ millions              Market Share
                                                                                Egypt                                                         Cleartrip (India), Software & IT services sector :
Egypt                     13 715          7%         23%                                                                                      India-based Cleartrip, an online travel platform
UAE                       13 557          14%        21%                    Morocco
                                                                                                                                              where travellers can search for and book flights to
Saudi Arabia              12 527         -19%        20%        United Arab Emirates
                                                                                                                                              any destination, has drawn up a major expansion
Oman                       3 647         -81%         6%                          Iraq                                                        plan for its Middle East operations. The plan would
Morocco                    3 069         -33%         5%                      Tunisia                                                         see the company making acquisitions as well as
Tunisia                    2 519         352%         4%                        Qatar                                                         heavy investments for organic growth in countries
Algeria                    2 316         -75%         4%                      Algeria                                                         including Bahrain, Oman and Kuwait. The invest-
Jordan                     2 290         478%         4%                                                                                      ments could involve $100m to $200m over the next
                                                                               Jordan
Iraq                       2 117         -48%         4%                                                                                      few years. Go to source.
                                                                        Saudi Arabia
Qatar                      1 581         194%         3%
                                                                               Oman
Bahrain                    1 051         -26%         1%                                                                                      HeyGears (China), Industrial equipment sector :
Kuwait                      695           94%         1%                                 0%    1%       2%    3%      4%       5%      6%     China-based HeyGears, a 3D digital application
Other                      1 126         -26%         2%                                                                                      startup, has raised $60m in series B1 round of fi-
Total                     60 208        -27.2%                                                                                                nancing led by Group 42. The company stated that
                                                                                                                                              the funding would be used to expand its presence to
                                                                 The Egyptian economy will probably          Two of the top 10 Arab           the UAE and beyond. Go to source.
                                                                 continue to outperform the region in        destination economies for
                                                                 2019-2020 with real GDP growth              FDI in terms of capital          Ziqitza Health Care (India), Healthcare sector :
           FDI into top 5 destination and others                 hitting 5.6% in the ongoing fiscal          investment have grown by         India-based Ziqitza Healthcare, an emergency med-
                  Share % in total Capex                         year (ending June 30) before rising to      more than 3% in 2019 –           ical services provider with life support ambulances,
                                                                 5.7% in the following one. Invest-          Egypt (5.5%) and Morocco         is set to raise up to $40m in funding for expansion
                                                                 ment will remain a key growth driver        (3.2%).                          in West Asia, Gulf Cooperative Council and Africa.
                                       Egypt
                                                                 in the near term, gradually with addi-      Source: International Monetary   Go to source.
                 Others
                                        %23                      tional support from private consump-        Fund, World Economic Out-
                  %25
                                                                 tion. The fiscal deficit will continue      look April 2019.
                                                                 to narrow, albeit predicated on the                                          FreshtoHome (India), Food & Beverages sector :
                                                                 government's ability to improve di-                                          India-based ecommerce company FreshtoHome,
           Morocco                                               rect tax collection. Political risk will                                     which provides a food delivery service, has raised
             %5                                                  also decrease thanks to stabilizing                                          $20m in a Series B funding round led by Iron Pillar
              Oman                         UAE                   macroeconomic conditions and tough                                           and Japan-based investor Joe Hirao. The company
                %6                         %21                                                                                                will use the new financing to support its growth
                                                                 security measures, but Egypt will still
                          Saudi                                  remain relatively risky by regional                                          plans in India and the United Arab Emirates. Go to
                          Arabia                                 standards.                                                                   source.
                           %20

                                                                 Source: Fitch Solutions, March 2020.

Source: fDI Markets
INVESTMENT CLIMATE REPORT 2020 - IN THE ARAB COUNTRIES
9    INVESTMENT CLIMATE REPORT IN THE ARAB COUNTRIES 2020

                                                                                                                          Investment Regions in Arab countries by
Greenfield FDI into Arab world                             Investing Regions in Arab Countries 2019                                   Capex in 2019

Source
                                                   Source World region         Capex ($mn)       % change
                                                                                                                                                                         Emerging
                                                                                                                                                North                     Europe
                                                   Western Europe               17,109.0         -42.5%                    Asia-Pacific        America                     %3.5

countries
                                                   Middle East                  17,106.0         -35.5%                       %21.1             %14.9
                                                                                                                                                                            Africa
                                                   Asia-Pacific                 12,693.0         -13.6%                                                                     %3.4
                                                   North America                 8,985.0          45.1%                                                                    Latin
                                                   Emerging Europe               2,106.0         -59.0%                                                                  America &
                                                                                                                                                                         Caribbean
                                                   Africa                        2,020.0         512.1%                 Middle East                 Western                %0.3
■   Western Europe and Middle East were the        Latin America & Caribbean      189.0          408.1%
                                                                                                                          %28.4                     Europe
                                                                                                                                                     %28.4
    top source regions for capital investment in
                                                   Total                        60,208.0         -27.2%
    Arab countries with $34.2 billions invested
    in 2019. Despite the 42.5% and 35.5%
    decreases, respectively, on the 2018 figure,
    western Europe and Middle East achieved
    a 28.4% market share each.                         ■     UAE and Saudi Arabia were on the top investing countries into Arab region with 25.6% market share and
                                                             projects valued at $15.4 billions in 2019.
■   Western Europe and Middle East were also
                                                       ■     China and Japan account for 12.5% market share of all inward FDI projects in the region, with projects
    the top source regions for number of green-              valued at $7.5 billions.
    field FDI projects in Arab countries
    achieving 44% and 21% market share re-
    spectively.
                                                         Top Investing Source Countries in Arab Region 2019
■   Out of a total of 65 source countries in
    2019, the top five account for the majority    Source Country                  Capex ($mn)      % Market Share           Investment Countries in Arab countries by
    of projects. With 143 projects, United                                                                                                CAPEX 2019
                                                   UAE                               8 683.6                14.4%
    States is the top source country accounting                                                                         India
    for more than one-eighth of projects           United States                     8 430.7                14.0%       2.6%                         Others
    tracked.                                       Saudi Arabia                      6 713.8                11.2%      Germany                       25.8%
                                                   China                             4 912.9                8.2%        4.2%                                             UAE
■   United States has generated the highest                                                                             United                                          14.4%
                                                   Switzerland                       3 495.1                5.8%
    number of total jobs, while UAE has the                                                                            Kingdom
    highest total investment ($8.7 billions).      France                            3 053.2                5.1%         4.3%
                                                                                                                                                                        United
    China has the largest project size on aver-    Japan                             2 632.3                4.4%         Japan                                          States
                                                                                                                          4.4%                                          14.0%
    age in terms of both investment ($136.5        United Kingdom                    2 615.4                4.3%                                               Saudi
    millions per project) and jobs creation (343   Germany                           2 533.9                4.2%         France                        China   Arabia
                                                                                                                                      Switzerland      8.2%    11.2%
    per project).                                  India                             1 583.0                2.6%          5.1%
                                                                                                                                         5.8%
                                                   Others                            15 554.1               25.8%
                                                   Total                             60 208.0               100%

                                                   Source: fDI Markets
INVESTMENT CLIMATE REPORT 2020 - IN THE ARAB COUNTRIES
INVESTMENT CLIMATE REPORT IN THE ARAB COUNTRIES 2020                       10

                                                             China project creation in Arab countries, 2003 to 2019

    China ranked
                                                                                           +500%                                                                        50
    4th                                                          From an average of 4 projects in the early 2000s, to an average                           38                  36
                                                                                                                                                                  36
    by capital invest-                                           of 40 projects over the last four years.
    ment and 8th by                 China created
    project numbers, it
                                       12,382
                                                                                                                                             19     18
    was the third most                                                                             14
                                                                                                                        16     15     14
                                                                                            13            12
    prolific foreign
    job creator in the
                                  Jobs across Arab              6             5
                                                                                                                 7
                                                                       3             3
    Arab region.                  countries in 2019
                                                               2003   2004   2005   2006   2007   2008   2009   2010   2011   2012   2013   2014   2015   2016   2017   2018   2019

■    Between January 2003 and December 2019 a total of       December 2019 - China State Construction Engineering Corporation (CSCEC) into Egypt
     305 FDI Chinese projects were recorded in the Arab
     region. These projects represent a total capital in-    China State Construction Engineering Corporation (CSCEC) (Beijing, China) is investing in Egypt in the Chemi-
     vestment of USD 61.7 billions, which is an average      cals sector in a Manufacturing project (estimated capex USD 355.7 millions and estimated jobs created 322).
     investment of USD 202.3 millions per project. Dur-
                                                             China-based China State Construction Engineering Corporation (CSCEC), a construction firm, is to establish an
     ing the period, a total of 78,484 jobs were created.
                                                             $848m phosphoric acid plant in the New Valley Governorate of Egypt. To be established in a joint venture with
■    Out of a total of 16 Arab destination countries, the    China-based companies Wengfu Group and East China Engineering Science and Technology, in addition to Egypt
     top five account for the majority of projects. UAE is   -based Phosphate Misr, the new plant will have a production capacity of 500,000 tonnes of phosphoric acid prod-
     the top destination country accounting for more than    ucts and 1,600,000 tonnes of sulfuric acid products.
     one-third of Chinese projects tracked. Project vol-
     ume in this destination country peaked during 2018,
     with 20 projects tracked.
                                                             September 2019 - DoubleStar into Algeria
■    Egypt has received the highest number of total jobs
     and greatest Chinese investment with a total of         DoubleStar (Qingdao, China) is investing in the city of Oum el-Bouaghi, Algeria in the Rubber sector in a Manu-
     23,930 jobs and USD 28.5 billions investment.           facturing project (estimated capex USD 249.2 millions and estimated jobs created 1422).
     Oman and Algeria have the largest project size on
     average in terms of investment and jobs creation,       Doublestar International Hong Kong, a subsidiary of China-based Qingdao Doublestar, a tyre manufacturer, is
     respectively.                                           planning to build a new plant in Algeria as part of a joint venture with local company Sarl El Hadj Larbi Pneuma-
                                                             tiques. It will have a 2 million unit annual capacity for truck and bus tyres and 5 million unit capacity for passen-
                                                             ger car tyres. The two company's combined investment will be 226.5 million euros.

Source: fDI Markets
11     INVESTMENT CLIMATE REPORT IN THE ARAB COUNTRIES 2020

Greenfield FDI into Arab world                                       FDI into Arab region by business activity, 2019         Top 5 Business activities of FDI into Arab region
                                                                                                      No. of                         in 2019 by number of projects

Business
                                                         Business activity                                        % Change
                                                                                                     projects
                                                         Business Services                             293          71.3%                               Others
                                                         Sales, Marketing & Support                    242          23.5%                               22.1%

activity
                                                                                                                                     Construction
                                                         Manufacturing                                 132          10.0%
                                                                                                                                        5.6%
                                                         Retail                                        123         -28.9%                                              Business
                                                                                                                                         Retail
                                                         Construction                                  61           27.1%                11.3%
                                                                                                                                                                       Services
                                                         Logistics, Distribution & Transportation      43           2.4%                                                26.8%
■    Business Services, Sales, Marketing & Sup-          Headquarters                                  43           87.0%          Manufacturing
     port and Manufacturing were the top three           Research & Development                        41           57.7%             12.1%
                                                                                                                                               Sales, Marketing
     business activities for FDI projects into Arab      Electricity                                   39          333.3%                         & Support
     region in 2019. These three activities alone        Education & Training                          29           81.3%                            22.2%
     account more than 61% of total FDI projects in      Maintenance & Servicing                       14           0.0%
     the region.                                         ICT & Internet Infrastructure                 12          -33.3%
■    Business Services saw a 71.3% increase in           Customer Contact Centre                        8           14.3%     United States was the top
     number of projects in 2019. Capital investment      Recycling                                      5          150.0%     source of manufacturing FDI
     also increased 61.6% to $3.1 billions.              Technical Support Centre                       4          100.0%     projects in the region, investing
                                                         Extraction                                     3          -72.7%     almost $3 billions.
■    Manufacturing accounted for $18 billions of         Total                                        1 092         24.4%
     announced FDI in 2019. Despite achieving
     10% increase in number of projects, the value
     of manufacturing projects dropped 46.8% in                      FDI into Arab region by business activity, 2019
     2019.                                               Business activity                          Capex ($mn)   % Change     Top 5 business activity of FDI into Arab region
                                                                                                                                              2019 by Capex
■    Infrastructure-related business activities such     Manufacturing                               17 982.9      -46.8%
     as Electricity, Construction and ICT & Internet     Construction                                15 706.5      -31.0%       Logistics,
                                                                                                                             Distribution &               Others
     Infrastructure made up more than 10% of all         Electricity                                 11 145.9      465.6%    Transportation               16.7%
                                                                                                                                                                       Manufacturing
     projects into Arab region (112 projects) and        Business Services                           3 119.1        61.6%         3.6%                                    29.9%
     accounted for 47% of capital invested ($28.2        Logistics, Distribution & Transportation    2 171.5       -68.8%
                                                                                                                              Business
     billions). Electricity, in particular, saw a 466%   Sales, Marketing & Support                  1 680.2        24.0%     Services
     increase in capital investment and a 333% in-       Extraction                                  1 523.3       -77.0%       5.2%
                                                                                                                                                  Electricity
     crease in project numbers .                         Retail                                      1 486.1       -51.4%                           18.5%
                                                                                                                                                                   Construction
■    Recycling projects saw a 150% increase in           ICT & Internet Infrastructure               1 376.0       -33.2%
                                                                                                                                                                      26.1%
                                                         Research & Development                      1 217.1        48.5%
     2019. A total of $1.1 billion was invested in
                                                         Recycling                                   1 104.9       232.8%
     2019 compared to $332 millions in 2018.
                                                         Headquarters                                 856.2        104.1%
                                                         Education & Training                         435.4         71.6%     Saudi Arabia was the top desti-
                                                         Maintenance & Servicing                      315.3         25.2%     nation in the manufacturing busi-
                                                         Technical Support Centre                      49.1         79.3%     ness activity, receiving $7.7 bil-
                                                         Customer Contact Centre                       38.6        -20.8%     lions in capital investment.
                                                         Total                                       60 208.0      -27.2%
Source: fDI Markets
INVESTMENT CLIMATE REPORT IN THE ARAB COUNTRIES 2020      12

Manufacturing in Saudi Arabia, 2019

                                                                                                                                $2 bn
                                                                                                                       In 2019, Ineos Switzerland-
                        Saudi Arabia                                                                                  based chemical company an-
                   Was the leading destination for                                                                    nounced it was establishing a
                   Manufacturing in the Arab re-                                                                      plant in the city of Al Jubail.
                   gion with 23 projects in 2019.

                                                                                    FDI Capex by sector
                                                                               Ceramics &      Others                Switzerland-based chemical company
                                                                        Food &    glass         3.2%                 Ineos has announced plans to invest $2bn
                                                                       Beverages 2.3%                                to build three new chemical plants as part
              Out of a total of 11 Manufacturing                         4.9%                                        of the Jubail 2 complex in Saudi Arabia
              sectors, the top five account for more                                                                 following an MoU with locally-based
              than two-thirds of projects. Chemicals                            Plastics                             Saudi Aramco and France-based Total.
              is the top sector accounting for more                              8.3%                                The company will build a 425 kilotonne
              than one-fifth of projects tracked.                                                                    per annum (ktpa) acrylonitrile plant
              Electronic components has generated                                                                    which is set for start-up in 2025. The
                                                                               Electronic
              the highest number of total jobs and                                                                   company will also build a 400ktpa linear
                                                                              components                             alpha olefin plant and an associated poly
              has the largest project size, with 1402                            14.4%         Chemicals
              jobs per project. Chemicals has both                                                                   alpha olefin unit, scheduled for produc-
                                                                                                66.9%                tion in 2025. The facilities will serve
              the highest total and highest average
              investment at USD 5.15bn overall and                                                                   customers directly in the Middle East and
              USD 1.03bn per project.                                                                                markets across Asia.
                                                        Source: fDI Markets

                                                                        During the year 2019 a total of 23 FDI Manufacturing projects were recorded.
                                                                        These projects represent a total capital investment of USD 7.7bn, which is an av-
                                                                        erage investment of USD 334.5m per project. During the period, a total of 8,800
                                                                        jobs were created.
13     INVESTMENT CLIMATE REPORT IN THE ARAB COUNTRIES 2020

Greenfield FDI into Arab world                                   Sector Breakdown of FDI in Arab Countries 2019
                                                                                            No. of
                                                        Sector                                           % change

Sectors
                                                                                           Projects
                                                        Business services                    156            59.2%
                                                        Financial services                   133            52.9%
                                                        Software & IT services                97            26.0%
                                                        Textiles                              57            -27.8%
■    Real estate was the top sector by capital in-
     vestment in Arab region for 2019 with almost
                                                        Hotels & tourism                      55            48.6%                   Almost all the investment in
     $9 billions and 44 projects.
                                                        Communications                        54             -6.9%                  Real estate sector has been
                                                        Transportation & Warehousing          50            22.0%                   made in three Arab countries:
■    Coal, Oil & Natural Gas sector decreased its                                                                                   Egypt, Saudi Arabia and
                                                        Consumer products                     47            -33.8%
     capital investment with 68.5% to record $7.3
                                                        Food & Beverages                      47              4.4%
                                                                                                                                    UAE with $7.1, $1.3 and
     billions in 2019.                                                                                                              $0.6 billions respectively.
                                                        Real estate                           44            51.7%
■    Almost $8.8 billions was invested in Alterna-      Others                               352            37.5%
     tive/Renewable Energy. The clean energy sec-
                                                        Total                               1 092           24.4%
     tor saw a 318% increase in capital investment,
     whereas     fossil    fuel    declined     by
     68.5%.
■    With a 10.3% market share of Arab FDI pro-
     jects, the Hotels & Tourism sector saw a 49%        Sector Breakdown of FDI in Arab Countries 2019
     increase in project numbers to 55, and a 40%                                                % Market                    Sector Breakdown of FDI into Arab region by
     increase in capital investment to $6.2 billions.   Sector                    Capex ($mn)
                                                                                                  Share                                     Capex 2019
■    The number of Electronic components projects       Real estate                  8 975.2      14.9%                  Food &
                                                                                                                        Beverages
     saw a 121.4% increase in 2019 and an overall       Renewable energy             8 754.8      14.5%                   2.6%                    Others
     capital invested increase of 971.4% to $1.7bn.     Chemicals                    7 612.6      12.6%                                           20.3%          Real estate
                                                                                                                     Communicati                                   14.9%
■    The number of Consumer products projects           Coal, oil & gas              7 266.2      12.1%                 ons
     saw a 34% decrease in 2019. Overall capital        Hotels & tourism             6 207.2      10.3%                 2.8%
                                                                                                                                                                       Renewable
                                                                                                                                                                         energy
     invested in the sector also decreased by 32%       Business services            2 448.0       4.1%               Electronic                                         14.5%
     $837.3 millions. The number of projects in the     Financial services           1 798.5       3.0%
                                                                                                                     components
                                                                                                                         2.8%
     Food & Beverages sector experienced a lim-                                                                                                  Hotels &
                                                        Electronic components        1 679.2       2.8%               Financial
                                                                                                                                                                      Chemicals
     ited increase from 45 to 47 projects. However                                                                    services
                                                                                                                                                 tourism                12.6%
                                                        Communications               1 678.5       2.8%                             Business      10.3%
     in 2019, capital investment dropped signifi-                                                                       3.0%
                                                                                                                                    services            Coal, oil & gas
                                                        Food & Beverages             1 553.5       2.6%
     cantly by 69% to $1.6 billions.                                                                                                 4.1%                  12.1%
                                                        Others                      12 234.4      20.3%
                                                        Total                        60 208

                                                        Source: fDI Markets
INVESTMENT CLIMATE REPORT IN THE ARAB COUNTRIES 2020         14

FDI in Renewable energy sector into Arab region 2019

 Some 42 projects, or 23% of projects, were recorded in 2019. This was the year in which the highest numbers of projects were
 recorded. During this period a total of 2,265 jobs were created and $8.75 billions capital was invested by these projects, equating      Marubeni into UAE
 to a 20.7% and 22.7% of total jobs and capital investment respectively.
                                                                                                                                          Japan-based Marubeni, a business
                                                                                                                                          conglomerate, has opened a solar
                                                                                                                                          plant in Abu Dhabi, UAE as part
                                                                                                                                          of a joint venture with China-
                                                                                                                                          based JinkoSolar and the UAE-
                                                                                                                                          based Abu Dhabi Power Corpora-
                                                                                                                                          tion. The $871.3 millions plant,
                                                                                                                                          spread across 8km, features over
                                                                                                                                          3.2 million solar panels and will
                                                                                                                                          supply electricity to 90000 people.

                                                                                                                                          Al Nowais Investments into
                                                                                                                                          Egypt
                                                                                                                                          UAE-based Al Nowais Invest-
                                                                                                                                          ments, an investment management
   10 000                                                                                            100                                  firm, is to build a $550 millions
                                                                                          $8 754.8 mn                                     wind farm in Egypt. Located in the
    9 000                                                                                            90
                                  Nb of projects         Capex in $ mn                                                                    Jabal Al-Zayt area and with a ca-
    8 000                                                                                             80          In 2019, Electricity    pacity of 500 megawatts, the site's
                                                                                                                  has generated the       production will be purchased by
    7 000                                                                                             70          greatest investment     the Egyptian Electricity Transmis-
    6 000                                                                                             60          with a total of $8.64   sion Company (EETC).
                                                                                                                  billions. This busi-
    5 000                                                                                      42     50          ness activity also
    4 000 $ 11.4 mn                                                                                   40          has the largest pro-    ACWA Power Internation-
                                                                                                                  ject size on average    al into UAE
    3 000                                                                                             30          in terms of both        ACWA Power is set to build and
    2 000                                                                                             20          investment and jobs     operate a 900-megawatt solar pro-
                                                                                                                  creation.               ject in Dubai, United Arab Emir-
    1 000                                                                                             10
              1                                                                                                                           ates. The company is set to build
        0                                                                                                                                 an operate the fifth phase of the
            2004 2006 2007 2008 2009 2010 2011 2012 2013 2014 2015 2016 2017 2018 2019                                                    5000-megawatt Mohammed bin
                                                                                                                                          Rashid Al Maktoum Solar Park.
                                                                                                                                          The fifth phase is set to become
                                                                                                                                          operational in the second quarter
                                                                                                                                          of 2021. The entire project is
  In 2019, out of a total of 10 destination countries, the top five account for the majority of projects. Egypt and Tunisia (11 pro-      scheduled for completion by 2030.
  jects for each country) are the top destination countries accounting for more than half of projects tracked. Egypt has received
  the greatest investment with $2.33 billions (Tunisia received $1.9 billions).

Source: fDI Markets
15     INVESTMENT CLIMATE REPORT IN THE ARAB COUNTRIES 2020

Greenfield FDI into Arab world                                                             Top investing companies in Arab region 2019

Companies
                                                                      Company                                 Capex ($mn)      No. of Projects     % Market Share
                                                                      Majid Al Futtaim Group (MAF Group)         2 690.5                5                4.5%
                                                                      ACWA Power International                   2 458.4                6                4.1%
                                                                      Ineos                                      2 000.0                1                3.3%
■    A total of 815 companies invested in Arab                        Marakez                                    1 664.3                2                2.8%
     countries in 2019 compared to 705 in 2018.                       Huajian Group                              1 649.3                1                2.7%
■    The top 10 companies account for 4.1% of job                     Arabian Centres Company                    1 649.3                1                2.7%
     creation and 5.4% of capital investment. Col-                    General Electric (GE)                      1 444.0                1                2.4%
     lectively, they create smaller projects in terms                 PetroJet                                   1 403.6                1                2.3%
     of job creation at 45 jobs on average. These                     Baker Hughes                               1 007.2                3                1.7%
     companies generally provide lower capital                        Hanergy Thin Film Power                    1 000.0                1                1.7%
     investment at an average of $31.5 millions per                   Others                                    43 241.4              1 070              71.8%
     project.                                                         Total                                     60 208.0              1 092
■    In terms of company size, more than one-third
     of companies have an annual turnover of $5
                                                         Top 5 investing companies in Arab region by capital investment 2015-2019
     billions or higher, while one-tenth of compa-
     nies have a turnover of $25 millions or less
■    VFS Global (Switzerland) and Emirates NBD
     Egypt (UAE) were the top investors by num-
     ber of projects in 2019 with 23 and 14 projects
                                                             ROSATOM
     respectively.
■    Majid Al Futtaim Group or MAF Group                     $30 bn               MAJID AL FUTTAIM
     (UAE) and ACWA Power International                     1 project                                       CHINA FORTUNE LAND
     (Saudi Arabia) were the top investors by capi-     Primary sector: Coal,        $21.2 bn                  DEVELOPMENT
     tal investment in the Arab region with $2.7        oil & gas .
     billions and $2.5 billions respectively in 2019.
                                                                                    33 projects                  $20 bn
                                                        Rosatom produces          Primary sector: Food
■    UAE-based Majid Al Futtaim, a family con-          nuclear electricity. It   & Beverages                   1 project                       TOTAL
                                                        engages in nuclear fuel
     glomerate, has announced it will be expanding      cycle, applied and        Majid Al Futtaim
                                                                                                            Primary sector: Real
                                                                                                            estate
                                                                                                                                               $13.1 bn               AL HABTOOR
     its Cairo Festival City Mall in New Cairo,         basic science, nuclear    Group engages in the                                        6 projects
     Egypt (Real Estate). The 22,000 sq m expan-
                                                        and radiation safety,
                                                        nuclear medicine, and
                                                                                  development and man-
                                                                                  agement of shopping
                                                                                                            CFLD provides invest-
                                                                                                            ment, development,         Primary sector: Coal,            $8.5 bn
     sion will include 120 stores, a food hall, brand   composite materials       malls, hotels and resi-   and operation services     oil & gas                       1 project
                                                        related activities.       dential and commercial    for industrial cities .                                Primary sector: Real
     entertainment concepts, and car parking facili-                                                                                   Total is an integrated
                                                                                  properties.                                                                      estate
     ties. The estimated capex is $1.65 billions.                                                                                      international oil and gas
                                                                                                                                       company .                   Engages in the con-
                                                                                                                                                                   struction, tourism,
                                                                                                                                                                   automobile distribu-
                                                                                                                                                                   tion, vehicle leasing.
Source: fDI Markets
INVESTMENT CLIMATE REPORT IN THE ARAB COUNTRIES 2020   16
Section
What matters to investors
in developing countries     Findings from the GIC Survey

                            The Global Investment Competitiveness Survey (GIC
                            Survey) offers practical evidence to help policy makers
                            in developing countries design policies and prioritize
                            reforms that investors value. It captures perceptions of
                            750 executives of multinational corporations on the
                            role of investment climate factors in their FDI deci-
                            sions. The survey carried out by IFC-World Bank was
                            designed to provide a broad understanding of corpo-
                            rate perspectives and investor behavior and was not
                            intended as a benchmarking tool to compare countries.
INVESTMENT CLIMATE REPORT IN THE ARAB COUNTRIES 2020                           18

What Matters to Investors in Developing Countries
Top Five Findings of the Global Investment
Competitiveness (GIC) Survey

Through interviews with 754 executives of multinational corporations           5.   For close to 30% of investors that have experienced shutting down an affiliate in a develop-
with investments in developing countries, the GIC survey finds the                  ing country, some reasons for exiting the investment could have been avoided, such as un-
following:                                                                          stable macro-economic conditions and increased policy and regulatory uncertainty. Three-
1.   Investors involved in export-oriented efficiency-seeking FDI that              quarters of investors have experienced disruptions in their operations due to political risk
     look for internationally cost-competitive destinations and potential           forces and events. A quarter of investors that did experience disruptions canceled or with-
     export platforms value linkages, incentives, trade agreements, and             drew their investment. Severe cases occur fairly infrequently—about 13 percent for breach
     investment promotion agency (IPA) services more than other in-                 of con-tract and 5 percent for expropriation—but when they do, the negative impact is
     vestors. Incentives such as tax holidays are important for 64% of              strong. In cases of breach of contract, over a third of investors cancel or withdraw invest-
     investors involved in efficiency-seeking FDI, compared to only                 ments, and for expropriation almost half do so.
     47% of their counterparts involved in other types of FDI. IPA ser-
     vices are rated important by about half of investors involved in
     efficiency- seeking FDI but by only about a third of those in-
     volved in other types of FDI.
2.   More than a third of investors reinvest all of their profits into the                       Most Investors Have Multiple Motivations and Are Market-Seeking
     host country. Investors value policies that help them expand their
     business more than just policies used by governments to attract                                          Motivation                                      Most important motivation
     them.
3.   Investment protection guarantees are critical for retaining and
     expanding investments in the long term across all types of
     FDI. Over 90% of all investor s r ate var ious types of legal pr o-
     tections as important or critically important, the highest rating
     among all factors included in the survey. These guarantees include
     the ability to transfer currency in and out of the country, and
     existence of legal protections against expropriation, against
     breach of contract, and against nontransparent or arbitrary
     government conduct.
4.   Investors strongly value the existing capacity and skills of local
     suppliers, but also find that government support, such as providing
     information on the availability of local suppliers, matters. With                                                                                              GVC: Global Value Chain
     foreign investors sourcing about 43 percent of their production
     inputs locally, supplier contracts and linkages with local business-
     es have the potential to create significant benefits for the local
     private sector.
                                                                             Source: Computation based on the GIC Survey, Global Investment Competitiveness Report 2017/2018, Chapter 1.
19      INVESTMENT CLIMATE REPORT IN THE ARAB COUNTRIES 2020

What Matters to Investors in Developing Countries

                                                                                          Business-Friendly Legal and Regulatory Environment Is Important for Investors
                                                                                          Share of respondents (percent)
                                                                                                                    Importance of country characteristics

      Respondents were asked, “How important are the following
      characteristics to your company’s decision to invest in devel-
      oping countries?” Factors were asked in random order. They
      are listed in the graph in descending order of importance,
      based on the combination of “critically important” and
      “important” in dark green and light green bars. Critically im-
      portant means it is a deal-breaker; by itself this factor could
      change a company’s decision to invest or not in a country.

Investors Seek Predictable, Transparent, and Efficient Conduct
of Public Agencies
Share of respondents (percent)

                                Importance of investment climate factors

                                                                                                                     MNCs involved in efficiency-seeking FDI place more im-
                                                                                                                     portance on investment climate factors compared to firms in-
                                                                                                                     volved in other types of FDI. Except for transparency and pre-
                                                                                                                     dictability in the conduct of public agencies, which firms find
                                                                                                                     most important regardless of motivation, firms involved in effi-
                                                                                                                     ciency-seeking FDI value most investment policies more highly.

Source: Computation based on the GIC Survey, Global Investment Competitiveness Report 2017/2018, Chapter 1.
INVESTMENT CLIMATE REPORT IN THE ARAB COUNTRIES 2020        20

What Matters to Investors in Developing Countries

                                                                                          Duty-Free Imports, Tax Holidays, and VAT Exemptions Are the Most Attractive Invest-
                                                                                          ment Incentives
                                                                                          Share of respondents (percent)
                                                                                                                         Importance of incentives

            Respondents were asked, “How important are the
            following characteristics to your company’s deci-
            sion to invest in developing countries?” Factors
            were asked in random order. They are listed in the
            graph in descending order of importance, based on
            the combination of “critically important” and
            “important” in dark green and light green bars.
            Critically important means it is a deal-breaker; by
            itself this factor could change a company’s deci-
            sion to invest or not in a country.                                           Investors Strongly Value Business-Friendly Policies and Proce-
                                                                                          dural Efficiency of Entry and Establishment of Affiliates
                                                                                          Share of respondents (percent)

                                                                                                                      Importance of ease of entry factors

Source: Computation based on the GIC Survey, Global Investment Competitiveness Report 2017/2018, Chapter 1.
21      INVESTMENT CLIMATE REPORT IN THE ARAB COUNTRIES 2020

What Matters to Investors in Developing Countries
                                                                                          Capacity and Skills of Suppliers Are Critical Linkages-Related Features
                                                                                          Share of respondents (percent)

                                                                                                                    Importance of factors related to linkag-

  Respondents were asked, “How important are the following char-
  acteristics to your company’s decision to invest in developing
  countries?” Factors were asked in random order. They are listed in
  the graph in descending order of importance, based on the combi-
  nation of “critically important” and “important” in dark green and
  light green bars. Critically important means it is a deal-breaker; by
  itself this factor could change a company’s decision to invest or
  not in a country.

                                                                                          Severe Political Risks Are Infrequent but Can Have Highly Negative Effects on FDI
                                                                                          Share of respondents (percent)

  The height of the bars reflects the percentage of respondents that
  experienced disruption in any of their investments owing to the
  political risk identified. The risks are arranged in descending order
  from most frequently experienced at the top, to least frequently
  experienced at the bottom. The numbers across rows do not add up
  to 100% because respondents could select multiple types of disrup-
  tions that their companies had experienced. The horizontal bars
  show the responses of companies, with the darker red bars reflect-
  ing more severe reactions. The bars reveal the most severe reac-
  tions of companies after experiencing the particular disruption. If,
  for example, a company experienced withdrawing an existing in-
  vestment in one country, but only delaying in another, the most
  severe reaction was considered and the company was included in
  the withdraw bar.

Source: Computation based on the GIC Survey, Global Investment Competitiveness Report 2017/2018, Chapter 1.
INVESTMENT CLIMATE REPORT IN THE ARAB COUNTRIES 2020                22

What Matters to Investors in Developing Countries

                                                                                             Respondents were asked, “How important are the following characteristics to your compa-
  Results are based on 219 respondents that were aware that their                            ny’s decision to invest in developing countries?” Factors were asked in random order. They
  companies had shut down an affiliate in a developing country.                              are listed in the graph in descending order of importance, based on the combination of
  Shares do not add up to 100 because respondents could select up to                         “critically important” and “important” in dark green and light green bars. Critically im-
  five of the most relevant reasons                                                          portant means it is a deal-breaker; by itself this factor could change a company’s decision
                                                                                             to invest or not in a country.

Reasons for Exiting an Investment Are Mixed, Some Controlla-                             Investors Value IPA Help in Resolving Problems and Setting Up More than Promotion Efforts
ble and Others Not                                                                       Share of respondents (percent)
Share of respondents (percent)

             Reasons for exiting an investment                                                                              Importance of IPA services

Source: Computation based on the GIC Survey, Global Investment Competitiveness Report 2017/2018, Chapter 1.
Section

How Arab countries
measure up?          Ease of doing business and country risk

                     This section of the report builds on Doing Business Da-
                     tabase (the World Bank) and Fitch Solutions’ Country
                     Risk Index (CRI). The latter quantifies the relative
                     strength of a country’s fundamentals and vulnerability
                     to shocks, on a numerical scale. The composite CRI
                     incorporates three dimensions of risk. First, the Eco-
                     nomic Risk Index quantifies the risk and resilience to
                     an economic crisis. Second, the Political Risk Index
                     measures the impact of politics on business, consider-
                     ing the transmission mechanisms to the economy, i.e.
                     expected effect of policies, capacity of enforcement,
                     and likelihood of policy reversals. Third, the Opera-
                     tional Risk Index measures the quality of the business
                     environment in four areas: labor market, trade and
                     investment, logistics, and crime and security.
INVESTMENT CLIMATE REPORT IN THE ARAB COUNTRIES 2020                            24

                                                                      How economies in Arab World rank on the ease of doing business 2020
How Arab countries measure up

■   The Arab region has continued to make solid strides in busi-
    ness environment reform in the last year, although with key
    regional disparities. We continue to highlight the GCC as the
    outperforming sub-region, especially in terms of investment
    and visa regulations, with Saudi Arabia and the UAE stick-
    ing out as the main reformers. Beyond these countries, how-
    ever, the record over the last year has been more mixed, with
    political instability thwarting reform to a significant extent.
■   Social unrest, or the threat of it, nevertheless continues to
    complicate reform efforts in large parts of the region. The
    governments of Iraq and Lebanon have both struggled to
    make any material progress on much-needed reforms, partic-
    ularly to address corruption, in the last year. While much of
    the blame falls on their complex and fragmented political
    systems, it is also the case that widespread (and in Iraq’s
    case, violent) protests have exacerbated existing political
    splits and hindered policy-making. Lebanon’s successive
    governments in the last year have failed to embark on re-
    forms with the depth required to drag it out of its current
    economic crisis. This applies to Tunisia as well where the
    threat of further instability has nonetheless discouraged au-
    thorities from pushing on with fuel price hikes and public
    sector wage freezes called for by the IMF. Similar issues
    have arisen in Jordan, where a weeks-long teachers’ strike
    forced the government to agree to large-scale pay hikes, also
    in contravention to IMF demands.
■   Overall, the Arab region’s business environment appears to
    be improving the fastest globally. Although the Arab coun-
    tries’ regulatory quality still lags behind that of the Central
    and Eastern Europe (CEE) region, it is worth noting that they
    have also made the fastest strides globally in the last two
    years. If this momentum is sustained – notwithstanding the
    risks to policy-making outlined above – then foreign direct
    investment into the region could well start to grow over the
    medium term from its current, relatively weak levels.                                 The ease of doing business score captures the gap of each economy from the best regulato-
                                                                                          ry performance observed on each of the indicators across all economies in the Doing Busi-
                                                                                          ness sample since 2005. An economy’s ease of doing business score is reflected on a scale
                                                                                          from 0 to 100, where 0 represents the lowest and 100 represents the best performance. The
                                                                                          ease of doing business ranking ranges from 1 to 190.

                                                                                                            Source: Fitch Solutions and Doing Business database, doingbusiness.org.
25   INVESTMENT CLIMATE REPORT IN THE ARAB COUNTRIES 2020

How Arab countries measure up

                                                                Rankings on Doing Business topics - Arab World 2020
                                                             Regional average ranking (Scale: Rank 190 center, Rank 1 outer edge)

                                                                     Kuwait made star ting a business easier by mer ging pr o-
                                                                         cedures to obtain a commercial license and streamlining the
                                                                         online company registration.

                                                                     Saudi Arabia made star ting a business easier by estab-
                                                                         lishing a one-stop shop that merged several pre-and
                                                                         postregistration procedures. Saudi Arabia also eliminated
                                                                         the requirement for married women to provide additional
                                                                         documents when applying for a national identity card.

                                                                     Tunisia made star ting a business easier by mer ging
                                                                         more services into the one-stop shop and by reducing fees.

                                                                     The United Arab Emirates made starting a business less
                                                                         expensive by reducing the fees for business incorporation.

                                                               Scores on Doing Business topics - Arab World 2020
                                                            Regional average scores (Scale: Score 0 center, Score 100 outer edge)

                                                                      Egypt made star ting a business easier by abolishing the
                                                                         requirement to obtain a certificate of non-confusion and
                                                                         improving its one-stop shop.

                                                                        The ease of doing business score captures the gap of each economy from the
                                                                        best regulatory performance observed on each of the indicators across all econo-
                                                                        mies in the Doing Business sample since 2005. An economy’s ease of doing
                                                                        business score is reflected on a scale from 0 to 100, where 0 represents the low-
                                                                        est and 100 represents the best performance. The ease of doing business ranking
                                                                        ranges from 1 to 190.

                                                                                       Source: Doing Business database, doingbusiness.org.
INVESTMENT CLIMATE REPORT IN THE ARAB COUNTRIES 2020                    26

How Arab countries measure up

                                                                                                                       Weights

             Fitch Solutions’ Country Risk Index (CRI) quantifies the relative strength of a country’s fun-
             damentals and vulnerability to shocks, on a numerical scale. The score incorporates three di-
             mensions of risk:

                 Economic Strength, via the Economic Risk Index

                 Political Stability, via the Political Risk Index

                 Business Environment Quality, via the Operational Risk Index

Most of Arab countries below global average in Country Risk Index
Country Risk Index (Fitch Solutions, Higher is better)

75
70                                                                                                     The composite Country Risk Index incorporates three dimen-
65
60
                                                                                                       sions of risk. First, the Economic Risk Index quantifies the risk
              World average
55                                                                                                     and resilience to an economic crisis. Second, the Political Risk
50                                                                                                     Index measures the impact of politics on business, considering
45                                                                                                     the transmission mechanisms to the economy: expected effect
40
35
                                                                                                       of policies, capacity of enforcement, and likelihood of policy
30                                                                                                     reversals. Third, the Operational Risk Index measures the quali-
25                                                                                                     ty of the business environment in 4 areas: labor market, trade
20                                                                                                     and investment, logistics, and crime and security.
15
10
 5
 0

                                                                                                                                        Source: Fitch Solutions, fitchconnect.com
27     INVESTMENT CLIMATE REPORT IN THE ARAB COUNTRIES 2020

How Arab countries measure up

Most of Arab countries below global average in Short Term Political Risk Index
Country Risk Index (Fitch Solutions, Higher is better)

95
90
85
80                                                                                                The Short Term Political Risk Index assesses pertinent political risks to
75
70                                                                                                investment climate stability over a shorter time frame, up to 24 months
                    World average
65
60
                                                                                                  forward. The STPRI components are best viewed as Fitch Solutions’
55                                                                                                assessment of whether the government can deliver its chosen agenda,
50
45                                                                                                without facing civil unrest, gridlock in policy making, or regional exter-
40                                                                                                nal threats within the short to medium term.
35
30
25
20
15
10
 5
 0

                                                                                       Most of Arab countries below global average in Long Term Political Risk Index
                                                                                       Country Risk Index (Fitch Solutions, Higher is better)

                                                                                       80
                                                                                       75
                                                                                       70
                                                                                       65            World average
     The Long-Term Political Risk Index assesses a country’s structural po-
                                                                                       60
     litical characteristics based on the assumption that liberal, democratic          55
     states with no sectarian tensions and broad-based income equality exhib-          50
                                                                                       45
     it the strongest characteristics in favor of political stability, over a multi-
                                                                                       40
     year timeframe. It is Fitch Solutions’ view that this offers a template for       35
     greater long-term stability as (a) opposition to the incumbent govern-            30
                                                                                       25
     ment can be resolved within the existing system; (b) the elected elite has        20
     sufficient power to govern (i.e., enforce its policies within the state’s         15
     territory), and (c) there are only limited existential threats to the prevail-    10
                                                                                        5
     ing constitutional order from an alternative world view.                           0

                                                                                                                                           Source: Fitch Solutions, fitchconnect.com
INVESTMENT CLIMATE REPORT IN THE ARAB COUNTRIES 2020                   28

How Arab countries measure up

Most of Arab countries below global average in Short Term Economic Risk Index
Country Risk Index (Fitch Solutions, Higher is better)

70
65
60                                                                                           The Short Term Economic Risk Index (STERI) seeks to define current
55               World average
                                                                                             vulnerabilities and assess real GDP growth, inflation, unemployment,
50
45
                                                                                             exchange rate fluctuation, balance of payments dynamics, as well as
40                                                                                           fiscal and external debt credentials over the coming two years, using the
35                                                                                           current year as a reference point. This skews the STERI in favor of econ-
30                                                                                           omies with low twin deficits (current account and fiscal) or surpluses,
25                                                                                           low inflation and higher growth rates. There is also a subjective compo-
20
                                                                                             nent, which measures the perceived independence of the central bank in
15
10
                                                                                             monetary policy.
 5
 0

                                                                                  Most of Arab countries below global average in Long Term Economic Risk Index
                                                                                  Country Risk Index (Fitch Solutions, Higher is better)

                                                                                   70
                                                                                   65
                                                                                   60
     The Long-Term Economic Risk Index takes into account the structural           55
                                                                                                   World average
     characteristics of economic growth, the labor market, price stability,        50
     exchange rate stability and the sustainability of the balance of payments,    45
     as well as fiscal and external debt outlooks. The Index is calculated by      40
     looking at the previous five years of economic data and our forecasts for     35
                                                                                   30
     the next five years. A number of other structural factors are also taken
                                                                                   25
     into account, including dependence on the primary sector, reliance on         20
     commodity imports, reliance on a single export sector, and central bank       15
     independence.                                                                 10
                                                                                    5
                                                                                    0

                                                                                                                                      Source: Fitch Solutions, fitchconnect.com
29    INVESTMENT CLIMATE REPORT IN THE ARAB COUNTRIES 2020

How Arab countries measure up

                                            The Operational Risk Index focuses on four main risk areas: labour market, trade and
                                            investment, logistics, and crime and security:
                                           ■     Labour Market: evaluation of the risks surrounding the size, education levels
                                                 and costs of employing workers in a country.
                                           ■     Logistics: evaluation of the quality and extent of the transport infrastructure,
                                                 ease of trading, and quality and availability of utilities.
                                           ■     Trade and Investment: evaluation of the openness of an economy, level of gov-
                                                 ernment intervention and the quality and efficacy of the legal environment.
                                           ■     Crime and Security: evaluation of operating conditions with respect to interstate
                                                 conflict risk, terrorism, crime, including cyber crime and organized crime.

Most of Arab countries below global average in Operational Risk Index
Country Risk Index (Fitch Solutions, Higher is better)

80
75
70
65
60                                                                                               Operational Risk Index quantitatively compares the challenges of operat-
55             World average                                                                     ing in 201 countries worldwide. The index scores each country on a
50
                                                                                                 scale of 0-100, with 100 being the lowest risk. Each country has a head-
45
40                                                                                               line Operational Risk Index score, which is made up of four categories
35                                                                                               of analysis, each further broken down into three sub-sectors. The indi-
30
                                                                                                 vidual categories and sub-categories are also scored out of 100, with 100
25
20                                                                                               the best. The index focuses on four main risk areas: labor market, trade
15                                                                                               and investment, logistics, and crime and security.
10
 5
 0

                                                                                                                                        Source: Fitch Solutions, fitchconnect.com
INVESTMENT CLIMATE REPORT IN THE ARAB COUNTRIES 2020                30

How Arab countries measure up

More than half Arab countries below global average in Logistics Risk Index      Half Arab countries below global average in Trade and Investment Risk Index
Country Risk Index (Fitch Solutions, Higher is better)                          Country Risk Index (Fitch Solutions, Higher is better)

80                                                                              85
75                                                                              80
70                                                                              75
65                                                                              70
60                                                                              65
55                                                                              60
         World average                                                          55
50                                                                                        World average
                                                                                50
45
                                                                                45
40
                                                                                40
35                                                                              35
30                                                                              30
25                                                                              25
20                                                                              20
15                                                                              15
10                                                                              10
 5                                                                               5
 0                                                                               0

More than half Arab countries below global average in Labor Market Risk Index   Most of Arab countries below global average in Crime and Security Risk Index
Country Risk Index (Fitch Solutions, Higher is better)                          Country Risk Index (Fitch Solutions, Higher is better)

                                                                                     75
80                                                                                   70
75                                                                                   65
70                                                                                   60
65                                                                                   55
60
                                                                                                   World average
                                                                                     50
55               World average
                                                                                     45
50
                                                                                     40
45
                                                                                     35
40
                                                                                     30
35
                                                                                     25
30
                                                                                     20
25
                                                                                     15
20
                                                                                     10
15
                                                                                      5
10
                                                                                      0
 5
 0

                                                                                                                                Source: Fitch Solutions, fitchconnect.com
Section

Global FDI trends   Impact of the outbreak Covid-19
monitor

                    The coronavirus outbreak, dubbed COVID-19, is
                    spreading human suffering worldwide. It is first and
                    foremost a human tragedy, affecting millions of people
                    globally. Consequently, minimizing the humanitarian
                    cost of this pandemic and effectively solving the chal-
                    lenges posed by COVID-19 needs to be the top priority
                    for all. However, it is important to note that COVID-
                    19 is most definitely spreading economic suffering
                    worldwide. This section of the report is intended to
                    provide readers with an initial perspective on the po-
                    tential impact on global FDI and implications for spe-
                    cific sectors.
INVESTMENT CLIMATE REPORT IN THE ARAB COUNTRIES 2020                               32

Covid-19 outbreak global economic impact
■   The contagious coronavirus, named SARS-CoV-2
    (formerly 2019-nCoV), which broke out at the close of
    2019, has led to a medical emergency across the world,
    with the World Health Organization officially declaring the
    novel coronavirus a pandemic on 26 March 2020.
■   The virus has now spread to 188 countries and territories
    with over 8,350,000 confirmed cases and more than
    449,000 deaths (June 18th), with its spread outpacing other
    major infectious outbreaks from the past.
■   Fears surrounding the impact of Covid-19 have already
    significantly impacted the world’s top economies, with key
    markets across the globe losing 20-50% of their value year-
    to-date.
■   Many economists and institutions have cut their forecasts,
    with consensus global GDP growth currently at 2.6% for
    2020, and many experts predicting the potential onset of
    recessionary environments.
■   Global companies are also concerned about the rising risk       Source: the Center for Systems Science and Engineering (CSSE) at Johns Hopkins University (JHU), Last Updated 6/18/2020, 9:58:14 AM
    of Covid-19, with thousands of the world’s leading compa-       https://www.arcgis.com/apps/opsdashboard/index.html#/bda7594740fd40299423467b48e9ecf6
    nies explicitly mentioning its impact on their business in
    their latest company filings.                                                          Earnings revisions and capital expenditures of the top 5000 MNEs
■   The impact scenarios for the pandemic are evolving day-by
    -day in response to the rapid spread of the virus. The
    UNCTAD projects the downward pressure on global FDI
    to be in the range of -30% to -40% leading up to 2021.
■   The top 5,000 multinationals, which account for a signifi-
    cant share of global FDI, now forecast downward revisions
    of their 2020 earnings estimates of -30% on average, with
    peaks of -200% in the most affected industries, and this
    trend is likely to deteriorate further.
■   The pandemic coupled with the necessary mitigation
    measures and lockdowns is affecting all components of
    FDI. Capital expenditures, greenfield investments and ex-
    pansions are all on hold due to the physical closure of sites
    and production slowdowns. New mergers and acquisitions
    (M&As) announcements are on course to drop by -70%
    globally in Q1.

                                                                                                                        Source: Investment Trends Monitor, Special Issue, UNCTAD, March 2020
33     INVESTMENT CLIMATE REPORT IN THE ARAB COUNTRIES 2020

Covid-19 outbreak global economic impact                                How will Covid-19 affect FDI

■    The outbreak of Covid-19 will slow down capital expendi-
     tures of Multinational Enterprises (MNEs) and their foreign
     affiliates. Production locations that are closed or that operate                               Primary Effect                             Indirect Mechanism
     at lower capacity will temporarily halt new investment in
     physical assets and delay expansions.
                                                                             Most
■    Greenfield investment projects that are already ongoing will          important                                                   Lower profits of foreign affiliates
     also be affected by this. As new investment projects have a
                                                                                             Negative demand shocks
     long gestation period and a lifecycle that can span decades.
     However, depending on the severity of the recessionary im-
     pact of the pandemic, projects could be interrupted or                                    Production stoppages
     shelved indefinitely.
■    Like greenfield projects, M&As are generally long-term
                                                                                              Supply chain disruptions
     commitments to overseas markets. Nevertheless, comple-
     tions of already announced M&A transactions are running
     into delays that could result in cancellations. Data for Febru-
     ary show a significant drop in the completion rate of cross-
                                                                                                    Delaying capital expenditures                  Lower reinvest earnings
     border acquisitions, to below $10 billion from normal
     monthly values of $40-50 billion. Announced cross border
     M&A transactions worldwide averaged 1200 deals per
     month in 2019, with all months above 1000. They fall to 874                                  Slow down capital expenditures
     in February 2020 and 385 in March so far (until 20 March).
     They would be on course for a 50% decrease in March, and
     at this clip a 70% decline from last year’s level next month.
     The decrease is the same in value terms.                                   ment Report – are indicative of the impact that Covid-19 could have on investment trends. Of the Top 100, 69 have
■    Market-seeking investment and FDI projects in extractive                   already made a statement regarding the impact of Covid-19 on their business. Of those, 41 have issued profit alerts
     industries could be delayed worldwide as a result of negative              or signaled increased risks, with 10 anticipating lower sales, 12 expecting negative effects on production or supply
     demand shocks. For now, the demand shock is most serious                   chain disruptions, and 19 expecting to be affected by both.
     in China; for example, Toyota reported a 70% drop in sales             ■   The automotive MNEs in the Top 100 appear to be most affected, with all 12 signaling negative implications (8 out
     in China in February. But the impact is already visible in                 of 12 due to production or supply chain disruptions). Nine out of 13 MNEs in the electronic components and equip-
     major markets beyond China as well, especially in consumer                 ment sectors have done the same. Most of the extractive industry and basic materials and chemicals MNEs, as well
     -facing industries such as travel and tourism, retail and                  as the consumer goods firms in the top 100, have issued warnings about negative demand shocks.
     wholesale, and other consumer cyclicals.
                                                                            ■   Looking at a wider sample of the global top 5000 (listed) MNEs, for almost 80% of these MNEs earnings forecasts
■    The negative effect on efficiency-seeking investment – in
                                                                                for fiscal year 2020 have been revised down in the last month and until 23 March by an average 30 %. This cold
     production facilities that are closely integrated in global val-           affect 52% of FDI flows, assuming that losses are spread uniformly across MNE operations. In reality, it is more
     ue chains (GVCs) – will be concentrated primarily in China                 likely earnings losses would be concentrated in foreign affiliates in affected areas, further augmenting the impact on
     and East and South-East Asia at first. However, they could                 reinvested earnings.
     rapidly spread outside the region through GVC linkages.
■    The MNEs in UNCTAD’s Top 100 – the largest MNEs
     worldwide based on their foreign assets, foreign sales and
     foreign employees published annually in the World Invest-                                                         Source: Investment Trends Monitor, Special Issue, UNCTAD, March 2020
You can also read