WP/20/143 Tax Revenues in Fragile and Conflict-Affected States -Why Are They Low and How Can We Raise Them? - International Monetary Fund
←
→
Page content transcription
If your browser does not render page correctly, please read the page content below
WP/20/143

Tax Revenues in Fragile and Conflict-Affected States
—Why Are They Low and How Can We Raise Them?

 by Bernardin Akitoby, Jiro Honda, and Keyra Primus
© 2020 International Monetary Fund WP/20/143

 IMF Working Paper

 Fiscal Affairs Department

 Tax Revenues in Fragile and Conflict-Affected States
 —Why Are They Low and How Can We Raise Them?

 Prepared by Bernardin Akitoby, Jiro Honda, and Keyra Primus1

 Authorized for distribution by Michael Keen

 July 2020

 IMF Working Papers describe research in progress by the author(s) and are published to elicit
 comments and to encourage debate. The views expressed in IMF Working Papers are those of the
 author(s) and do not necessarily represent the views of the IMF, its Executive Board, or IMF
 management.

 ABSTRACT

Raising revenues has been a formidable challenge for fragile and conflict-affected states (FCS), a
fact confirmed once again in the COVID-19 crisis. Nonetheless, achieving sizable gains in tax
collection in fragile environments is not impossible. This paper—with empirical analyses and case
studies—contributes to policy discussions on tax reform in such challenging environments. Our
analyses show that many FCS achieved some recovery of tax revenues, even though they found it
challenging to sustain the momentum beyond three years. We also find that changes in the
quality of institutions (e.g., government effectiveness and control of corruption) are a key
contributory factor to their tax performance (much more so than for non-FCS). Next, we look into
the tax increase episodes of four countries (Liberia, Malawi, Nepal, and the Solomon Islands).
Although each FCS is unique, their experiences suggest two lessons: (i) tax reforms can be
pursued even with initially weak institutions; and (ii) strong political commitment is important to
sustain reform efforts and realize long-lasting, sizable gains.

JEL Classification Numbers: E62, H11, H20
Keywords: Tax Revenue Mobilization; Fragile and Conflict-Affected States
Author’s E-Mail Addresses: BAkitoby@imf.org; JHonda@imf.org; KPrimus@imf.org.

1We are grateful for comments from Debra Adams, Thomas Baunsgaard, Margaret Cotton, Ruud De Mooij, Dan
Devlin, Elizabeth Gavin, Nikolay Gueorguiev, Michael Keen, Alex Klemm, Andrew Minto, Muyangwa Muyangwa,
Kiyoshi Nakayama, Andrew Okello, Christiane Roehler, and Artur Swistak. We would also like to thank Eslem
Imamoglu for research assistance.
3

 Contents Page

ABSTRACT _______________________________________________________________________________________ 2

I. INTRODUCTION _______________________________________________________________________________ 5

II. STYLIZED FACTS ______________________________________________________________________________ 7

III. EMPIRICAL ANALYSIS _____________________________________________________________________ 11

IV. CASE STUDIES ______________________________________________________________________________ 18
A. Liberia _________________________________________________________________________________________ 19
B. Malawi ________________________________________________________________________________________ 23
C. Nepal _________________________________________________________________________________________ 28
D. Solomon Islands ______________________________________________________________________________ 32

V. POLICY LESSONS AND CONCLUSIONS ____________________________________________________ 36

REFERENCES ___________________________________________________________________________________ 38

BOXES
1. Tax Revenue after the Ebola Outbreak in Guinea, Liberia, and Sierra Leone ___________________ 11
2. General Institutions and Revenue-Specific Institutions ________________________________________ 15

FIGURES
1. Tax Revenues in Fragile Country States and Developing Countries _____________________________ 8
2. Tax Revenues by Type __________________________________________________________________________ 9
3. Tax Revenues by Income Level in Fragile and Non-Fragile Country States______________________ 9
4. Tax Revenues in Fragile Country States ________________________________________________________ 10
5. Recovery of Tax Revenues in Fragile Country States __________________________________________ 13
6. Cross-Section Correlation Between General Institutions and Revenue Institutions ____________ 15
7a. Liberia: Tax Revenues ________________________________________________________________________ 19
Figure 7b. Liberia: Institutional Indicators ________________________________________________________ 20
7c. Liberia: Tax Revenues by Type ________________________________________________________________ 23
8a. Malawi: Tax Revenues ________________________________________________________________________ 23
8b. Malawi: Institutional Indicators _______________________________________________________________ 25
8c. Malawi: Tax Revenues by Type _______________________________________________________________ 27
9a. Nepal: Tax Revenues _________________________________________________________________________ 28
9b. Nepal: Institutional Indicators ________________________________________________________________ 29
9c. Nepal: Tax Revenues by Type ________________________________________________________________ 31
10a. Solomon Islands: Tax Revenues _____________________________________________________________ 32
10b. Solomon Islands: Institutional Indicators____________________________________________________ 33
10c. Solomon Islands: Tax Revenues by Type ____________________________________________________ 35

TABLES
1. Fragile and Conflict-Affected States Achieving Large Tax Increases ____________________________ 7
4

2. Empirical Results on Tax Revenues (Fixed Effect) ______________________________________________ 17

APPENDICES
I. Fragile Country States by Income Groups ______________________________________________________ 41
II. Statistical Summary ___________________________________________________________________________ 42
III. Empirical Results on Tax Revenues with Interaction Terms (Fixed Effect Model) ______________ 43
5

 I. INTRODUCTION

1. Fragile and Conflict-Affected States (FCS) face formidable economic and structural
challenges.2 These challenges are inextricably linked to the structural features of their
economies, such as poor governance, weak institutional capacity, as well as political and social
instability, while facing dire economic and developmental challenges. These institutional
weaknesses all suggest difficulty in achieving sustainable and inclusive growth and in securing
macroeconomic stability (IMF, 2008). The latest estimates suggest that by 2030, half of the
world’s poor will live in fragile countries (Commission on State Fragility, Growth and
Development, 2018). Therefore, FCS are typically trapped in a syndrome of interlocking
characteristics which makes it difficult to develop sustained progress. Those countries that are
trapped in a low-level equilibrium appear to be in a political and economic limbo that can last for
years (Carment and Samy, 2017). This makes the transition out of fragility neither simple nor
rapid. The inability of FCS to raise sufficient tax revenue is strongly associated with the
constraints they face in building resilience (Deléchat et al., 2018).

2. Building tax capacity is critical for FCS to improve state building and development.
As noted in Besley and Persson (2009) and Gaspar et al. (2016a, 2016b), increasing tax collection
is important for economic growth and development. Therefore, to exit from fragility, the ability to
mobilize revenue is undoubtedly a key factor. This was underscored in IMF (2017a), which
pointed out that 90 percent of countries that graduated from fragility had substantially improved
their CPIA sub-score for “efficiency of revenue mobilization.” This underscores the fact that
enhancing revenue—specifically tax revenue—is a pressing policy issue that is high on the
agenda for many FCS.

3. Enhancing tax collection is also critical for facilitating the post-COVID-19 recovery.
As elaborated in IMF Fiscal Monitor (April, 2020), in response to the COVID-19 pandemic,
ramping up public health expenditure is the number one priority, and many countries are
allocating more fiscal resources to the health sector by increasing spending on monitoring,
containment, and mitigation. Countries, including FCS, are also experiencing a fall in fiscal
revenues as economic activity and trade decline. These developments are putting pressures on
their fiscal balances, resulting in further increase in public debt. After the pandemic recedes,
temporary tax measures implemented to mitigate the economic fallout should be lifted and
compliance should be strengthened to help rebuild tax bases. Moreover, it would be even more

2 FCS are defined as having either weak institutional capacity, as measured by the World Bank’s Country Policy
and Institutional Assessment (CPIA) score (average of 3.2 or lower), and/or experience of conflict (signaled by
presence of a peace-keeping or peace-building operation). The IMF classified 39 countries to have met these
criteria in the most recent three-year period (Appendix I). This list was updated in Baer et al. (2020) to include 42
countries. This paper uses the IMF (2017a) list of FCS and considers the countries that were FCS during the period
when tax reforms were undertaken. It is important to note that FCS do not always progress in a linear manner.
Some FCS can start off in conflict/disaster, move to post-conflict/post-disaster, then fall back into conflict.
6

important to generate fiscal resources for addressing development needs and safeguarding debt
sustainability through enhancing revenue mobilization.

4. Furthermore, increasing fiscal revenues is paramount to meet the Sustainable
Development Goals (SDGs) and to support immediate spending needs. IMF 2019b shows
that delivering on the SDG agenda will require additional spending in 2030 of US$0.5 trillion (15
percentage points of GDP) for the low-income country group, which includes most FCS. This
substantial increase in additional spending would need to be supported at least in part by an
increase in domestic tax collection. Improving tax revenue is pivotal to address pressing
infrastructure needs and meet critical social spending needs. Mobilizing domestic revenue is also
important to provide and maintain basic public services, promote stability and achieve
development (Akitoby et al., 2019). In view of the recent declining trend of aid flows to FCS3,
enhancing tax collection is paramount to assist FCS in reducing aid dependency.

5. How can FCS improve their tax revenue performance? This paper attempts to answer
this question by empirically examining the key features of tax performance in FCS and exploring
the cases of specific countries which achieved long-lasting, sizable gains in tax revenue. All of
these cases have been identified as substantial tax revenue mobilization episodes by Akitoby et
al., (2018).

• Our analyses point to the sustainability of tax reform efforts and the quality of institutions as
 two important factors to achieve sizable gains. While many FCS demonstrated some recovery
 of tax revenues after the peak of fragility, their reform efforts generally only lasted for 2–3
 years, failing to catch up with non-fragile countries. We also find that changes in the quality
 of institutions is a key contributory factor to their tax performance (much more than it is for
 non-fragile states), and thus even a marginal improvement in institutions could bring large
 revenue increase.

• Based on the experiences of four FCS (i.e., Liberia, Malawi, Nepal, and Solomon Islands),
 several key lessons can be drawn.4, 5 Each of the four countries achieved sizable increases in
 tax revenues by 7–20 percentage points of GDP over about a decade (Table 1). Their reform
 experiences point to the importance of targeting a country’s high potential sector (e.g., the
 logging sector in Solomon Islands) and starting with reform steps with immediate effects to
 build momentum. Tax reforms can be pursued even with initially weak institutions, while
 political commitment is important to sustain reform efforts (e.g., over ten years) and realize
 long-lasting, sizable gains.

3Many IMF staff reports discuss the decline in donor aid to FCS in recent years (e.g., IMF Country Report No.
17/381).
4 Although Nepal was removed from the list of FCS in 2017, tax reforms were undertaken during the period when
the country was classified as an FCS. The other three countries remain in the FCS country list.
5 The analyses—based on these selective country experiences—do not allow conclusive dicussions for all FCS.
Nevertheless, their experiences are suggestive and are worth being considered in exploring an approach for tax
reforms in FCS.
7

 Table 1. Fragile and Conflict-Affected States Achieving Large Tax Increases
 Tax increase (Percent of GDP)
 Reform period Total years
 Total Annual average
 Liberia 2004-12 9 7.5 0.8
 Malawi 2002-13 12 11.0 0.9
 Nepal 2007-19 13 12.8 1.0
 Solomon Islands 2002-13 12 19.8 1.7
 Sources: Country authorities and authors’ estimates.

6. Notably, this paper presents an important contribution to policy discussions for
FCS. There have been few attempts to determine the factors affecting tax revenue mobilization in
FCS, using both an empirical and a case study analysis.

7. The rest of the paper is organized as follows. Section II presents stylized facts on tax
performance in FCS in comparison to non-FCS. Section III presents empirical analyses on the
pace of tax collection recovery in FCS and the factors that contribute to tax revenue. In Section
IV, a narrative assessment (e.g., case studies) is used to discuss countries that successfully
improved their tax performance. The final section discusses the key lessons learned, drawing
from the findings in the econometric analysis and the tax reform episodes.

 II. STYLIZED FACTS

8. This section documents the tax performance of FCS, in comparison with non-fragile
developing countries. In view of the data limitation in early years, the analysis in the paper
focuses on the developments since the early 2000s.6 The following stylized facts are drawn based
on recent performance in FCS:

6 Securing credible data for countries under fragile economic environments is technically challenging. Based on
the database for WEO, we confirmed the data availability and crosschecked with other sources (e.g., IMF staff
reports), as needed.
8

 • Overall tax performance Figure 1. Tax Revenues in Fragile Country States and
 in FCS has been Developing Countries
 constantly weaker than (Percent of GDP)
 in other developing 18

 countries (Figure 1). For 16

 the last decade, tax
 14
 collection for FCS has on
 12
 average hovered around
 11.5–12.5 percent of GDP. 10

 Compared with other 8

 developing countries
 (defined as low-income Fragile states Other developing countries

 countries and emerging Source: WEO.
 markets, excluding FCS), their tax revenues have been consistently lower by 4–6 percentage
 points of GDP.

 • FCS’s tax collection on goods and services are the weakest, compared with non-fragile
 developing countries (Figure 2). Compared with non-FCS, FCS collect far less taxes on
 goods and services7—both in resource rich8 and non-resource rich countries. This may
 reflect significant social or political challenges to implement (or enhance) a broad-based tax,
 where social or political stability is not fully secured (in fragile environments) and/or a social
 protection system is not established. IMF (2017a), Baer et al. (2020), and Mansour and
 Schneider (2019) note that FCS should rely more on easier tax handles such as taxes on
 goods and services, and excises, given that they exhibit a high concentration at their
 collection points—in particular, at customs border posts and for large companies.

7For the analysis in this paper, goods and service taxes are separated into VAT, excise taxes, and general (other)
goods and services taxes.
8For resource rich countries, non-commodity revenue is computed by subtracting total commodity revenue as
well as grants from general government revenue.
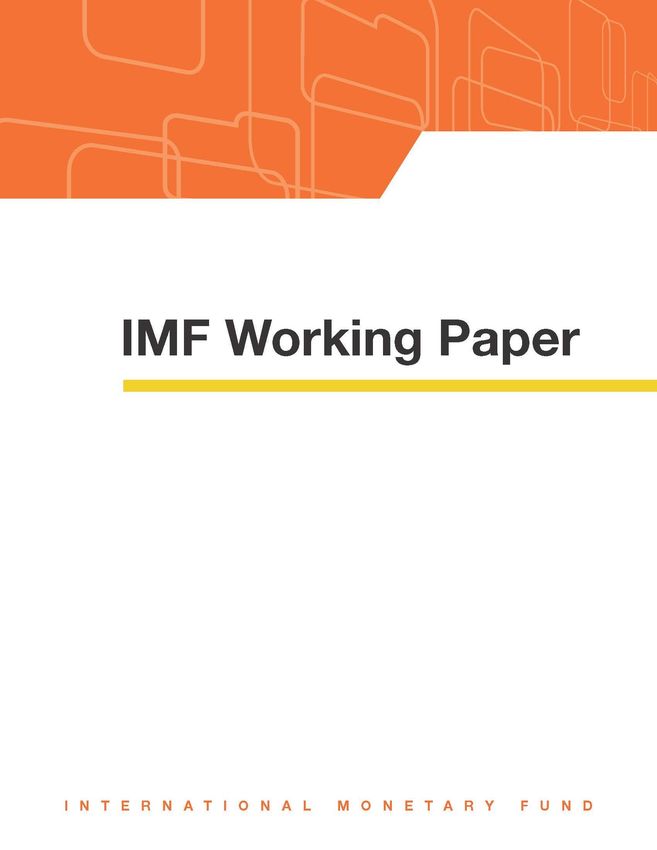
9

 Figure 2. Tax Revenues by Type
 (Percent of GDP, median value, 2019)
 Resource Rich Countries Non-Resource Rich Countries
 5 10

 4 8

 3 6

 2 4

 1 2

 0 0
 Goods & Income Income Trade Other Goods & Income Income Trade Other
 services taxes taxes taxes taxes services taxes taxes taxes taxes
 taxes (PIT) (CIT) taxes (PIT) (CIT)
 Fragile States Other Developing countries Fragile States Other Developing countries
 Source: WEO.

• With some exceptions, the tax- Figure 3. Tax Revenues by Income Level in Fragile
 to-GDP ratios in FCS are and Non-Fragile Country States (2019)
 generally lower than non-FCS of
 the same income level 30
 Tax Revenues (as a % of GDP)

 (Figure 3). Looking at the trend
 line for non-FCS at the same
 income peer, most FCS―about 80 20
 percent of the total FCS―are
 placed below the line (not
 reaching the trend average of the 10
 y = 0.0002x + 16.159
 income peer of non-FCS). Tax
 revenues of some FCS deviate
 0
 from the trend by even more than
 0 1,000 2,000 3,000 4,000 5,000 6,000
 10 percentage points of GDP.
 GDP per capita (US$)
• The analysis (Figure 3) suggests Non-Fragile Fragile
 that there may be other Source: WEO.
 contributory factors—besides
 fragility—behind the poor revenue performance. While a vast majority of FCS are below
 the trend line, some FCS are placed higher than the trend line, suggesting that being in
 fragile status may not necessarily be an absolute factor for weak tax performance. It is also
 important to note that having a high revenue ratio (which is a very important step toward
 sound economic development) is not sufficient to escape fragility.

• The COVID-19 outbreak is expected to cause a drop in domestic revenue. Tax revenue in
 FCS is projected to decline from 12 percent of GDP to 11.3 percent of GDP in 2020,
10

 before recovering in 2021 (Figure 4). Figure 4. Tax Revenues in Fragile
 The outbreak may affect tax collection Country States
 through multiple channels. (Percent of GDP)
 Preventative and containment efforts
 for COVID-19 can slow down
 economic activities and thus adversely
 affect tax collection. Moreover,
 lockdowns involving the closure of
 government offices and businesses
 are expected to obstruct pertinent
 administrative processes for revenue
 collection (as they are rarely
 automated in FCS). Some FCS—in an
 attempt to mitigate the impact of the Source: April 2020 WEO.
 pandemic—have also implemented
 tax waivers on specific import items (Malawi), granted tax relief for most-affected businesses
 (Solomon Islands, Togo), and reduced consumption tax on additional goods (Somalia). In
 addition, taxpayer compliance is expected to deteriorate during the economic crisis, leading
 to further revenue losses.9 These projections are subject to significant uncertainty, and the
 magnitude of the shock and the pace of the eventual tax recovery could widely differ by
 country, in light of the experiences with the Ebola outbreak (Box 1).

9 IMF (2020b) highlights that the far-reaching lockdown of private and public sectors implemented in many
countries to contain the spread of COVID-19 is significantly impacting revenue administrations’ operations. It
further argues that, when COVID-19 is contained and lockdown measures are loosened, revenue agencies will
have to be ready to reinvigorate their operations, restore the normal functioning of the revenue and trade
systems, safeguard tax collection and recover compliance to pre-crisis levels.
11

 Box 1. Tax Revenue after the Ebola Outbreak in Guinea, Liberia, and Sierra Leone

 The 2014-15 Ebola crisis was the largest Ebola outbreak in history and took a devastating toll
 on the people of Guinea, Liberia and Sierra Leone. Ebola infected over 28,000 people and
 caused more than 11,000 deaths in the three countries.

 Following the Ebola outbreak, tax collections in these countries declined significantly (by about
 1½ percentage points of GDP). IMF country documents unanimously point to the adverse
 impacts of the outbreak, which weakened economic activities, eroded revenue base, and
 weakened compliance with tax regulations. In Liberia, it is reported that arrears in tax
 obligations arose at end-2014 reflecting financial difficulties facing taxpayers as a result of the
 shocks.

 Among the three countries, the pace of recovery after the outbreak widely differed by country.
 While all of them had gradually increased tax collection before the outbreak, the momentum
 for tax increase has not been maintained in Liberia and Guinea. In Sierra Leone, however, tax
 collection reached a pre-Ebola level in 2016 (a year after the end of the outbreak), while the
 momentum apparently continues.1

 Tax Revenues Tax Revenues
 (In percent of GDP) (2012 revenues (percent of GDP)=100)
 120
 Ebola
 pandemic
 110

 100

 90

 80

 70

 60
 2006
 2007
 2008
 2009
 2010
 2011
 2012
 2013
 2014
 2015
 2016
 2017
 2018
 2019
 Guinea Sierra Leone Liberia
 Source: WEO.
 ____________________
 1 The increase in tax revenues in 2016 in Sierra Leone is partly associated with the one-off factors mainly
 related to arrears payments from mineral companies and a capital gains tax from the sale of a mineral
 company (IMF Country Report No. 17/154).

 III. EMPIRICAL ANALYSIS

9. The stylized facts—the weak revenue performance of FCS relative to non-FCS—raise
the question of what causes such weak performance in FCS. Specifically, despite all the
capacity building efforts by international partners for these countries, are FCS not recovering tax
revenues after the tax revenue troughs? If yes, why are they performing constantly weaker than
12

non-FCS? Furthermore, what are the key determinants of their tax revenues? To answer these
questions, this section empirically examines the pace of tax revenue recovery and explores the
determinants of tax revenues.

Pace of Tax Increase (Event Study Analysis)

10. To scrutinize the pace of tax revenue recovery, we now examine the behavior of tax
revenues around the year of the weakest revenue performance using an event study
approach. Although not necessarily implying causality, our results help to understand
subsequent revenue developments following the weakest revenue performance. As the year of
the weakest tax performance (often reflecting the peak of fragility) may also be associated with
conflict, we disentangle the analysis from post-conflict developments.10 Specifically, following
most closely Gourinchas and Obstfeld (2012), we specify a fixed-effects panel to capture the
dynamic of tax revenues during an 11-year window around the tax revenue troughs (defined as
the year of the lowest tax-to-GDP ratio during 1995–2017).11 The specification is the following:

Where y is tax revenue, is the country fixed-effect, + represents the 11 dummy variables
taking the value of 1 in period + (where t is the year when tax collection was the lowest during
the sample period), and is the conditional effects of tax performance over the event window
relative to tranquil times.

10Data relating to the conflict period (and three years after the conflict period) are removed from the analysis for
countries in which conflict-related incidents were reported and found to impact on tax revenue (based on IMF
(2004); Collier and Hoeffler (2004); and various IMF staff reports).
11
 These troughs are usually associated with the peak of fragility (often associated with weakening of institutional
capacity). During such periods, administrative capacity tends to weaken, including through a change in staff or
key directorates, the inability to implement tax reforms, or a temporary break away from maintaining basic
revenue collection principles, all of which could lead to low tax collection. For example, a low institutional index in
Comoros and Eritrea was associated with low tax capacity (tax-to-GDP level below 6 percent) (Akanbi, 2019).
13

11. The results suggest that tax Figure 5. Recovery of Tax Revenues in Fragile
recovery after the weakest revenue Country States
performance tends to be sustained up (Percent of GDP, before/after the peak of fragility)
to 2–3 years (Figure 5). On average, the
tax collection of FCS steadily improves by
3.5 percentage points of GDP from the
lowest level, over a period of three years.
While tax policy and revenue
administration reforms coincided with the
observed revenue increase after the
trough, causality cannot reliably be
established given the lack of additional
micro-evidence or natural control groups
for most reforms. For instance, some of
the revenue increase may be associated Note: Dotted lines denote the confidence interval.
with improved macroeconomic Sources: WEO and WoRLD.
 12, 13
environment. The momentum for tax recovery, however, is short-lived. After three years, FCS
recover the level of tax collection, though the momentum of tax increases is not sustained over
time. Not being able to sustain the momentum for revenue increase is apparently a factor behind
the weak revenue performance of FCS.

Determinants of Tax Revenues
12. Previous research revealed that economic and institutional variables affect tax
collection in developing countries. Gupta (2007) used fixed and random effects specifications
to examine the determinants of tax revenue efforts in developing countries. The study found that
structural factors such as per capita GDP, agriculture share in GDP, ratio of imports to GDP, and
foreign aid significantly affect revenue performance. Ghura (1998) applied a panel data analysis
to sub-Saharan Africa and found that variations in tax revenue to GDP ratios were influenced by
the level of corruption. Similarly, evidence provided by a system-Generalized Method of
Moments (GMM) panel model in Imam and Jacobs (2007) showed that corruption is a
contributory factor to the low revenue collection in Middle East countries. Using a random effects
panel data analysis, Epaphra and Massawe (2017) found that good governance—measured in
terms of government effectiveness, regulatory quality, rule of law and voice and accountability—
tends to raise tax revenue generation in African countries. Furthermore, evidence provided by a
cross-sectional analysis showed that countries with a more unstable and polarized political
system have an inefficient tax structure—in the sense that tax collection is more costly to
administer (Cukierman et al., 1992).

12
 For instance, some of the revenue increase may be associated with improved macroeconomic environment. For
further details on how reform efforts coincided with the tax recovery, see Akitoby et al. (2018).

13 These results should be interpreted with caution due to the wide confidence interval.
14

13. This study uses a fixed-effects econometric analysis to examine the factors
affecting tax revenue in FCS.14 We specify a fixed-effects panel in the form below:
 , = + + , + ,

Where: , is the log of the tax-to-GDP ratio for country at period year ; , is a vector of
independent variables; and represent a full set of country and time fixed effects,
respectively; and , is the error term. The sample comprises annual data from 2000 to 2017.
Data were constrained to this period due to limited availability of information for FCS prior to
2000. The main data sources are IMF’s World Economic Outlook (WEO) database, FAD Tax Policy
Revenue Analysis Tool (RAT) 15, and the publicly available World Revenue Longitudinal Database
(WoRLD).16 The tax revenue data exclude grants and non-tax revenue.

14. Independent variables are selected based on the findings in the literature. Similar
explanatory variables were selected based on other studies in the literature (e.g., Gupta (2007),
Epaphra and Massawe (2017) and IMF (2018)). The structural variables include real GDP per
capita growth, trade openness, net official aid, inflation, and the share of agriculture in total
output. Per capita GDP growth is included to control for the impacts of business cycles. Trade
openness captures the degree of liberalization. The inflow of foreign aid, once used productively,
is expected to improve revenue performance. Changes in macroeconomic policy in the previous
year are likely to affect revenue collection from different taxes in the following year. Therefore,
the lagged value of inflation—which gauges the effect of macroeconomic policy—is included as
a regressor. Also, given the large share that agriculture contributes to GDP in FCS, and its
different regime of taxation in many countries, this variable is also included. Furthermore, income
inequality (as measured by the GINI index) is included to capture the relationship between tax
collection and the income gap.17 Higher spending on education is included as a regressor
because it is associated with more qualified staff and it has a positive relationship with tax
morale.18 Public spending on education is also a proxy for social spending, which is low in many
FCS. Institutional and governance variables include the indices for control of corruption,
government effectiveness, and political stability (based on the Worldwide Governance
Indicators). Among these variables, government effectiveness and the control of corruption tend
to be highly correlated with the performance of revenue-specific institutions (Box 2).

14 Given the small number of countries in the FCS sample (19), using GMM can produce biased estimates.
15 See Mylonas, Victor, 2019. "Revenue Analysis Tool (RAT)" IMF Technical Notes and Manuals (Forthcoming),
International Monetary Fund.
16General government (GG) data are used wherever available, if not, central government (CG) tax revenue data
are used as a proxy for GG data.
17Several empirical studies include income inequality as an explanatory variable for tax performance (e.g., IMF,
2018; Fenochietto and Pessino, 2013). It is presumed that a more even income distribution should facilitate
collection as well as voluntary taxpayer compliance (Fenochietto and Pessino, 2013).
18Higher education levels are related positively to tax morale because educated people can better understand
the importance of government intervention or policies that enhance tax collection (e.g., Rodríguez, 2018).
15

 Box 2. General Institutions and Revenue-Specific Institutions
This box examines the relationship between general institutions and revenue-specific institutions.
Following IMF (2019a), the paper uses selective indicators from the International Survey on Revenue
Administration (ISORA), which contains relevant institutional measures related to tax administration.1 The
relevant indicators derived from the database are related to risk management, public accountability,
third party information and limits on discretionary power. These indicators are averaged, with equal
weights, to derive an overall revenue institution index. In light of the lack of historical ISORA data, this
paper undertakes a simple cross-section regression and correlation.
Following Akanbi (2019), we also confirm a positive relationship between general institutions
(government effectiveness, control of corruption) and revenue institutions. A higher government
effectiveness index is associated with better revenue institutions (Figure 6). Post-conflict countries have a
long history of political instability, which has caused a lack of proper management (and deterioration) of
revenue institutions. Meanwhile, structural and economic factors have led to inefficiencies in governance.
In FCS, poor governance of revenue agencies has coincided with weak administrative practices and a
drag on reforms, both of which impeded tax collection.
A lower control of corruption index corresponds to weaker revenue institutions (Figure 6). This is
particularly important in FCS because in 2015, two thirds of the FCS were among the countries with the
highest corruption levels in the world, as measured by the Corruption Perceptions Index (CPI) from
Transparency International.2 Also, corruption—including through tax loopholes in exchange for bribes
and undervaluation or underdeclaration of goods at customs—reduces revenue collection. IMF (2018)
and IMF (2019a) also find similar evidence that control of corruption is associated with an increase in
government revenues.

 Figure 6. Cross-Section Correlation Between General Institutions and Revenue Institutions
 (Government Effectiveness) (Control of Corruption)
 Revenue i ns ti tuti ons = 0.08 Government effecti venes s = + 0.56 Revenue i ns ti tuti ons = 0.06 Control of corrupti on = + 0.57
 R-s qua red = 0.22 R-s qua red = 0.11
 Sta ti s ti ca l s i gni fi ca nce a t 1% l evel Sta ti s ti ca l s i gni fi ca nce a t 1% l evel
 1.2
 1.2

 1 1
 Revenue Institutions

 0.8
 Revenue Institutions

 0.8

 0.6 0.6

 0.4 0.4

 0.2 0.2
 Non-Fragile Fragile Non-Fragile Fragile
 0 0
 -2 -1 0 1 2 3 -1.5 -1 -0.5 0 0.5 1 1.5 2 2.5
 Government Effectiveness
 Control of Corruption

 Sources: IMF (2019a) and WGI.
 ____________________
 1
 The data source is the participant review tables for ISORA 2016 (https://data.rafit.org/). ISORA uses an online data
 collection platform (called Revenue Administration Fiscal Information Tool—RA-FIT) developed and administered
 by the IMF. Akanbi (2019) points out that the performance of general state institutions—using measures for
 government effectiveness, the control of corruption, and freedom to trade—and of revenue-specific institutions
 are highly and positively correlated, implying that countries with good state institutions tend to have good
 revenue institutions as well.
 2
 In general, FCS are characterized by less favorable ratings in governance indicators (IMF, 2015).
16

Results

15. The regression results highlight that improving institutional variables is more
relevant in FCS than in non-FCS (Table 2).19, 20 Control of corruption, government
effectiveness, and political stability are important determinants of tax collection in FCS. This
underscores the importance of improving governance and political stability in proceeding with
effective tax reforms. This finding is not surprising, as FCS typically suffer from weak institutions,
high corruption, and/or instable political conditions, all of which would preclude tax collection
efforts. In the non-FCS group, control of corruption, government effectiveness, and political
stability are not significant, suggesting a possible nonlinear relation between tax performance
and the institutional variables. This implies that changes in institutional capacity may have a
different marginal impact in those countries that have very weak initial conditions (the FCS)
compared to those with stronger institutional capacity.21

16. Tax performance can also be explained by other factors. GDP per capita growth is an
important indicator for both FCS and non-FCS. This indicates that tax collection is boosted by
buoyant economic activity. Government expenditure on education is positive and significant in
the non-FCS group, indicating that more investment in education could lead to higher education
levels—which relate positively to tax morale (Rodríguez, 2018). IMF (2018) also notes that higher
spending on education could give governments incentives to collect more taxes (e.g., by
increasing tax rates) to finance new spending levels. Government expenditure on education is
insignificant in the FCS group. This may possibly reflect the low efficiency of their spending, often
associated with the weak institutional capacity in the group. Similar to other studies in the
literature (Fenochietto and Pessino, 2013), the share of the agriculture sector is statistically
significant in FCS. As FCS tend to have large informal sectors and a large share of agriculture in
total output, this constellation of factors often pushes FCS towards a lower level of tax collection
and a narrower tax base. In non-FCS, the results also suggest weaker tax performance with larger
agriculture sector. In FCS, the effect of inflation is slightly negative and statistically significant,
possibly reflecting that high inflation tends to reflect macroeconomic imbalances with dire
economic challenges in the country group. To the contrary, inflation has no impact on tax
revenue in non-FCS.

17. The results do not support the role of trade openness, income inequality and net
aid for tax performance in FCS. Although the coefficient for trade openness shows a positive

19The Hausman specification test was performed and confirmed that the null hypothesis of no correlation
between the effects and the error term is rejected. Therefore, a fixed effect model should be used rather than a
random effect model.
20Given the high correlation between each institutional variable and GDP per capita (Appendix II), we also
estimate the model without GDP per capita. We also consider different combinations of control variables. For all
these cases, our main results remain unchanged.
21This result is also confirmed using the interaction terms of institutional variables with FCS dummies. While most
of the interaction terms are statistically significant, none of the institutional variables (without FCS dummies) is
statistically significant (Appendix III).
17

 sign in FCS, it is not statistically significant. Furthermore, income inequality is not a significant
 determinant of tax revenue in FCS. In contrast, in non-FCS, the results point that lower income
 inequality and higher trade openness contribute to tax performance. The insignificant results on
 net official aid in FCS may suggest that in these countries, large aid would not necessarily imply
 aid dependency demotivating tax reform efforts.

 Table 2. Empirical Results on Tax Revenues (Fixed Effect)

 Fragile states Nonfragile states
 (1) (2) (3) (4) (5) (6)
Control of corruption 0.183** 0.0237
 (2.138) (1.233)
Government effectiveness 0.150* 0.0139
 (1.691) (0.686)
Political stability and absence of violence/terrorism 0.0713** 0.0102
 (2.142) (0.893)
Real GDP per capita growth 0.00800*** 0.00809*** 0.00823*** 0.00306*** 0.00312*** 0.00302***
 (3.969) (3.998) (4.099) (2.642) (2.689) (2.594)
Trade openness 0.000940 0.000797 0.000767 0.00156*** 0.00159*** 0.00160***
 (1.323) (1.122) (1.085) (6.038) (6.123) (6.109)
Consumer prices, period average, percent change (lag) -0.00239*** -0.00234*** -0.00248*** -0.000331 -0.000336 -0.000330
 (-4.641) (-4.490) (-4.834) (-0.973) (-0.987) (-0.969)
Agriculture sector, value added (% of GDP) -0.0122*** -0.0124*** -0.0112*** -0.00480*** -0.00498*** -0.00489***
 (-3.787) (-3.821) (-3.377) (-3.247) (-3.389) (-3.312)
Government expenditure on education (% of GDP) (lag) -0.00667 -0.0134 -0.00747 0.0143*** 0.0141*** 0.0138***
 (-0.430) (-0.826) (-0.481) (3.179) (3.127) (3.074)
Net official aid received (% of GDP) -0.00180 -0.00111 -0.00122 -0.00816*** -0.00810*** -0.00800***
 (-0.907) (-0.571) (-0.631) (-4.552) (-4.517) (-4.423)
Gini index (lag) -0.00103 -0.00273 -0.00156 -0.00506*** -0.00494*** -0.00501***
 (-0.236) (-0.623) (-0.359) (-3.357) (-3.275) (-3.321)
Constant 2.572*** 2.665*** 2.481*** 2.748*** 2.739*** 2.739***
 (10.94) (10.34) (10.76) (34.41) (34.41) (34.34)
Observations 298 298 298 1,201 1,201 1,199
R-squared 0.455 0.451 0.455 0.320 0.320 0.319
Number of ifscode 19 19 19 78 78 78
z-statistics in parentheses
*** p
18

 IV. CASE STUDIES

19. To draw lessons for FCS, we consider countries that achieved sizable, sustained
increases in tax revenues. This paper focuses on four episodes of large tax revenue mobilization
in FCS, namely in Liberia, Malawi, Nepal, and Solomon Islands. The paper selects episodes with
two criteria. First, all the cases have been identified in Akitoby et al. (2018) as episodes of
substantial tax revenue mobilization. 22 Second, in addition to the gains in tax revenue achieved
during the tax reform period identified in Akitoby et al. (2018), these countries achieved increases
in their tax-to-GDP ratios beyond 7 percentage points and sustained most of it over a long
period. The case studies provide detailed information on the tax policy and revenue
administration reforms undertaken during the tax reform period to achieve these gains.23 While
these countries enhanced tax collection over a long period, this does not imply that there
remains no scope to further increase tax collection or strengthen revenue performance.

20. However, given the heterogeneity of FCS, there is no one-size-fits-all reform. FCS
are heterogeneous in their economic structure, sources and degree of fragility, and
macroeconomic performance ( IMF, 2017a). As a result, it is not desirable to view FCS as a unified
group. Having said this, two high-level lessons emerge from the case studies: (i) tax reforms can
be pursued even with initially weak institutions; and (ii) strong political commitment is important
to sustain reform efforts (e.g., over ten years) and realize long-lasting, sizable gains.

21. Each case study is structured as follows: (i) a short background section gives the
political and economic context; (ii) the tax reform strategy is outlined to describe the fiscal
reform measures undertaken; and (iii) the outcome of the strategy is highlighted.

22In identifying the episodes of large tax revenue mobilization, Akitoby et al. (2018) focused on countries with
more tangible tax revenue mobilization results: (i) countries that have increased their tax-to-GDP ratios by a
minimum of 0.5 percent each year for at least three consecutive years (or 1.5 percent within three years); (ii)
countries with beyond average increases in their tax-to-GDP ratios; and/or (iii) countries with better tax
performance compared with peers in the same income group (utilizing the approach used in von Haldenwang
and Ivanyna (2012)).
23An in-depth analysis of each episode was conducted based on IMF country reports (including staff reports and
TA reports). We also consulted with staff who were engaged with the four countries during the reform period.
19

 A. Liberia

Following the signing of a peace agreement in Figure 7a. Liberia: Tax Revenues
2003 (after more than a decade of internal (Percent of GDP)
conflicts), Liberia undertook reforms in tax and 15
 Tax increase period
customs administration, as well as tax policy,
with political commitment, supported by 12
technical support from Liberia’s international
partners. Following the decade-long reform
 9
efforts, total tax revenues more than doubled
from 6.7 percent of GDP in 2003 to 14.2 percent
in 2012 (Figure 7a). It should be noted that the 6

 2000
 2001
 2002

 2005
 2006
 2007
 2008
 2009

 2012
 2013
 2014
 2015
 2016

 2018
 2003
 2004

 2010
 2011

 2017
tax reform was initiated at a time when these
key institutional indicators were among the
lowest in the world. Note: The red line represents the end of the conflict period.
 Sources: Country authorities and authors’ estimates.

Background

22. Following the civil war that ended in 2003, Liberia faced severe social and economic
difficulties. After about fifteen years of intermittent conflict through 2003, Liberia’s physical
infrastructure was largely destroyed. Poverty was pervasive; real GDP per capita (in 2005 prices)
was estimated to have declined by almost 90 percent from US$1,269 in 1980 to US$163 in 2005.
In 2006, unemployment reportedly stood at over 80 percent, and a similar percentage of the
population subsisted on less than US$1 a day, with no access to basic health, education, and
other social services. Liberia’s human capital had eroded, and public institutions were largely
dysfunctional. On the revenue front, the tax base had been severely eroded by the granting of
tax concessions, poor administration, extremely low tax morale, and widespread governance
problems. Liberia was heavily dependent on trade and income taxes; the contributions of
domestic sales and excise taxes were very small (IMF, 2017b).

23. With the newly elected President Ellen Johnson-Sirleaf, economic reforms gained
momentum, assisted by Liberia’s international partners. Until 2005, the pace of reform
implementation under the former government was slow and governance problems re-emerged.
In early 2006, the newly elected President Ellen Johnson-Sirleaf expressed commitment for
economic reforms and called for IMF support for developing a program to strengthen economic
performance.24 A staff-monitored program (SMP) in 2006 paved the way toward a Fund-
supported financial program and the eventual HIPC debt relief in 2008. Moreover, Liberia’s key
international partners (US, EU, UN, and ECOWAS) jointly formulated the Governance and

24It should be noted that the government, under President Johnson-Sirleaf, took action to implement structural
reforms to address governance issues, reestablish macroeconomic stability, rebuild institutional capacity, and
improve Liberia’s infrastructure.
20

Economic Management Assistance Program (GEMAP) in 2005 to strengthen economic
governance and financial management, and rebuild Liberia’s key economic institutions.25

24. Throughout the reform period, Liberia’s international partners, including the IMF,
provided intensive support for capacity building. After the Accra Peace Agreement in 2003,
IMF technical support began with a basic short-term and medium-term actions list to increase
government revenue (IMF, 2017b). After the January 2006 presidential election, Liberia’s reform
program proceeded rapidly. To support the program, the IMF coordinated with other donors and
took a multi-faceted approach towards the delivery of technical support in tax policy and
administration. Technical support was delivered in phases on a range of topics, to help create a
tax system based on sound economic principles, broad tax bases, and limited discretionary tax
policy. In 2011, the IMF launched a multi-year technical support program financed by the Tax
Policy and Administration Topical Trust Fund (TPA-TTF). It focused on strengthening the revenue
administration organization, defining the organizational structure, administrative and operational
frameworks, building a comprehensive risk strategy for large taxpayers, and building the capacity
of the Liberia Revenue Authority (LRA) to serve taxpayers.

25. The tax reform started when key Figure 7b. Liberia: Institutional
institutional indicators were low, followed by Indicators
their subsequent improvement. During the (Index)
reform period, control of corruption was -0.4 Tax increase period

strengthened substantially at an initial period,
with gradual improvement in government -1

effectiveness (Figure 7b). There was also
substantial improvement in the political stability -1.6

index, which is indicative of the shift in the
political atmosphere when the new president was -2.2
 2000
 2001
 2002
 2003
 2004
 2005
 2006
 2007
 2008
 2009
 2010
 2011
 2012
 2013
 2014
 2015
 2016
 2017
 2018
elected.
 Government effectiveness Control of corruption
 Political Stability
Reform Strategy Source: WGI.

26. The government implemented a broad
range of reforms to enhance the efficiency of revenue collection and broaden the tax base.
A key focus of the government was the pursuit of a tax reform program—centered on efforts to
strengthen both the policy and legislative framework, as well as to enhance the administrative
capacity. In the meantime, addressing inherited governance issues in tax collection was also a
major task.

27. In the initial phase, the tax reform focused on short-term measures to broaden the
tax base, increase indirect taxes, and strengthen revenue administration.

25The GEMAP framework, among others, provided for internationally recruited financial controllers with binding
cosignature authority in major revenue collecting agencies.
21

• Expanding the taxable base for the goods and services tax (GST) by: (i) applying it on all goods
 and services; (ii) expanding definition of import duty paid value to include c.i.f. value plus
 import duty, fees, and excises paid); and (iii) expanding the definition of domestic supplies on
 the sales price to include excise taxes. While broadening the tax base, annual turnover for
 entities subject to the GST was set at a high level to ease both cost of compliance and the
 administrative burden. Given the low level of tax administration capacity, it aimed at limiting
 the number of taxpayers that could be effectively controlled and monitored by tax
 administration.

• Reducing duty and tax exemptions on rice and petroleum. The government rationalized the
 extensive list of duty exemptions and drafted a legislation for the tax exemptions policy in
 2007, and passed the revenue authority law.26

• Utilizing excise taxes. A uniform excise tax of 15 percent was applied for imported and
 domestic alcoholic beverages. The excise tax on cigarettes was increased to 15 percent and
 higher excises were also levied on cell phone usage, air travel, and hotels.

• Strengthen the capacity to classify and value goods for customs purposes.

• Reorganizing domestic tax revenue administration on the basis of taxpayer segmentation. The
 authorities reorganized domestic tax revenue administration on the basis of taxpayer
 segmentation and strengthened the large taxpayers unit, including its capacity to conduct an
 audit of large taxpayers.

• Enhancing transparency of resource flows and the extractive industry. Improving transparency
 from key revenue generating agencies, such as the National Port Authority, Roberts
 International Airport, the Liberia Petroleum Refining Corporation, the Forestry Development
 Agency, and the Bureau of Maritime Affairs helped to increase tax collection. Also, tax
 revenues performed well as a result of inflows from the extractive industry.

28. In the early years of tax reform, the lack of facilities, equipment, and logistics was a
major constraint for tax administration reforms. In undertaking reforms which led to a more
professional tax administration, computers and vehicles were needed by auditors and for arrears
collection staff. The office facilities were in poor condition. Supplies of stationery and basic
equipment were lacking, particularly in the large and medium taxpayer divisions.

29. At a second phase, the authorities implemented more fundamental tax reform
measures. With technical support on tax policy from the IMF, the government also aimed to
increase tax collection from domestic-oriented activities, while further strengthening tax and
customs administration.

26 Import duty exemptions were widespread. In addition to embassies and international organizations, all
international and local nongovernmental organizations and religious groups, public corporations, and a large
number of companies enjoyed duty-free privileges. Imports for investment projects qualifying for incentives were
also exempted from duty. Intermediate goods used in agriculture were also exempted, while duty on raw
materials and capital equipment and machinery for manufacturers in “essential” industries paid a 5 percent tariff
compared with 15 percent paid by nonessential industries.
22

• On tax policy, the authorities stepped up efforts to remove tax and custom exemptions.
 Specifically, they reduced tax and tariff exemptions, clarified the regulations regarding tax
 exemptions for individual investors, and implemented measures to contain tax exemption
 abuse among nongovernmental organizations. Moreover, to enhance collection from
 property taxes, the authorities updated the unit values on which land and building taxes were
 based.

• On tax administration, the government continued to strengthen the segmentation of taxpayers
 and enhance the utilization of information systems. Strengthening the segmentation of
 taxpayers involved the creation of large, medium, and small taxpayer divisions. Under the
 new organizational structure for the administration of domestic taxation, large, medium, and
 small taxpayers have their own operational units for taxpayer services, returns and payments,
 collection enforcement, and audit. Also, as part of the Standard Integrated Government Tax
 Administration System (SIGTAS) project, large, medium, and small taxpayers were re-
 registered and issued new Tax Identification Numbers (TINs). The issuance of new TINs
 helped to improve information sharing and coordination between the tax and customs
 offices. Notably, the operations of the Bureau of Internal Revenue (BIR) were computerized
 through implementation of the Integrated Tax Administration System (ITAS).

• Customs reforms were mainly driven by introducing information systems and restructuring the
 customs authority. The Automated System for Customs Data (ASYCUDA) was rolled out at the
 major entry ports, and the government increased the level of tax revenues coming from
 domestic sources. A strategic plan for the Bureau of Customs and Excise (BCE) was
 developed, and the structure of the BCE was reorganized. Taxpayers services were improved
 by establishing a one-stop customer care center and rolling out the ASYCUDA.

Revenue Outcomes

30. Liberia’s tax revenues increased by 7.5 percent of GDP over nine years. The tax-to-
GDP ratio increased steadily reflecting progress in implementing tax reforms. Specifically, the
revenue increase was driven by an increase in trade taxes, by 3.33 percentage points of GDP in
nine years, and through customs reforms. Also, the curbing of tax exemptions was a contributory
factor to improving tax collection. Furthermore, through the TINs re-registration exercise, the
authorities developed the capacity to identify taxpayers and their tax obligations and collect and
process useful information for analyzing the behavior of taxpayers and preparing risk mitigation
strategies. The increase in tax revenue was not sustained, partly reflecting changes in the income
tax reporting base from presumptive to actual, legal issues in the forestry sector, and lower
imports.27

27The government imposed a moratorium on timber exports at end-2012 following abuses in the allocation of
permits in the forestry sector.
23

 Figure 7c. Liberia: Tax Revenues by Type
 (Percent of GDP)
 6 Tax increase period

 4

 2

 0
 2001 2002 2003 2004 2005 2006 2007 2008 2009 2010 2011 2012 2013 2014 2015 2016 2017 2018
 Income taxes Goods & services Trade taxes Other taxes
 Sources: Country authorities and IMF staff estimates.

31. Liberia’s experience highlights the importance of strong leadership, properly-
sequenced reform steps, and capacity building by international partners. Based on its
experiences in engaging with Liberia, IMF (2017b) notes that, in FCS, reform can be sustained
through properly sequenced and innovative capacity building approaches, championed by
strong leadership in the government.

32. Strong political drive for tax reforms—supported by technical support from
Liberia’s international partners—was a major factor in sustaining tax reforms over time.
The reform-minded government drove the economic reforms, expressed full commitment for
economic reforms, and called for IMF support to develop a program to strengthen economic
performance. Liberia was an intensive recipient of technical support. After the January 2006
presidential elections, the IMF coordinated with other donors to deliver technical support on a
range of topics that, among other areas, focused on building capacity in revenue administration
and tax policy. Liberia’s experience suggests the importance of political commitment as well as a
stable political environment to implement tax reforms consistently over time.

 B. Malawi

Malawi achieved a substantial increase in tax Figure 8a. Malawi: Tax Revenues
revenue of 11 percentage points of GDP during (Percent of GDP)
 22
2002–2013 (Figure 8a). The authorities’ reform Tax increase period
 20
efforts included strengthening administration in
the tax and customs offices, reviewing tax rates, 18

and tightening exemptions. Such reform efforts 16

led to initial gains. While there were changes in 14
political administrations, the reform efforts 12
were sustained. 10

 8
 2002
 2003
 2004
 2005
 2006
 2007

 2009
 2010
 2011
 2012

 2014
 2015
 2016
 2017
 2018
 2008

 2013

 Sources: Country authorities and IMF staff estimates.
24

Background

33. In the early 2000s, Malawi faced several fundamental economic challenges. The
uneven implementation of economic policies in the past left the country with a high debt burden
that consumed a large share of government revenue. The economy was inefficient, partly
because of insufficient public infrastructure, unreliable utilities, and inadequate institutions.
Malawi was buffeted by bad weather that worsened an already delicate food security balance,
and by high rates of HIV/AIDS and other infectious diseases.

34. The new Minister of Finance, who took office in January 2002, publicly announced
the need for a decisive turnaround from previous expansionary fiscal policy. Such a policy
change was needed to establish macroeconomic stability, halt the increase in public debt, and
create an environment conducive to private sector-led growth. Owing to a prolonged period of
expansionary fiscal policies, Malawi’s public domestic debt increased rapidly.28 The 2002/03
budget envisaged significant adjustment, reducing the fiscal deficit by over 2 percent of GDP.

35. The government first initiated tax reform and later increased petroleum products
and electricity tariffs to address the country’s economic problems. After President Bingu wa
Mutharika was elected in May 2004, the government initiated a tax reform process, and the
Minister requested an IMF technical support mission to look at the revenue implications of
reform options, with the goal of improving the structure of the system without losing revenue.
Building on this, when the new administration took office in early 2012 (the former vice president
was elected as the president following the death of the former president), they made further
progress in tax reforms (see below). In 2013, GDP growth rebounded, mainly on account of an
improved harvest and increased availability of foreign exchange. However, during that year, the
cashgate scandal caused donors to suspend financial assistance.29

28The fiscal expansion in 2000–02 came mostly from policy decisions to bail out parastatals, augment civil
servants’ wages, increase other low-priority public spending (such as travel and representation), and reduce
income taxes.
29The government responded quickly to the cashgate scandal by launching a forensic audit and developing a
short-term action plan of corrective measures in consultation with development partners. Following consultation
with key stakeholders, the authorities adopted a new PFM strategy, which had to be implemented for donor
resumption of budget support.
You can also read