Deloitte WA Index 2021 Diggers & Dealers Special Edition - A review of Western Australian companies listed on the Australian Securities Exchange
←
→
Page content transcription
If your browser does not render page correctly, please read the page content below
Deloitte WA Index 2021
Diggers & Dealers Special Edition
A review of Western Australian companies
listed on the Australian Securities Exchange
                                               1
Deloitte WA Index 2021 | Diggers & Dealers Special Edition

2
Deloitte WA Index 2021 | Diggers & Dealers Special Edition

Contents

Executive summary                                                        4

Deloitte WA Index Top Movers 2021                                        6

Commodity review                                                        13

Celebrating 30 years – Congratulations to Diggers & Dealers             21

Lithium and the shift to renewables and electric vehicles               23

WA Index Q&A with Peter Bradford,
Managing Director and CEO, IGO                                         26

Does it pay to play it clean?                                           28

WA’s top 100 listed companies                                           31

Contact us                                                              34

                                                                                                    3
Deloitte WA Index 2021 | Diggers & Dealers Special Edition

 Executive summary

 Welcome to the 2021 Diggers & Dealers edition of the Deloitte WA Index. This year
 the market capitalisation of Western Australian listed entities closed at AU$293.9
 billion, increasing a staggering 46% from 12-months prior.

 This year’s WA Index performance has                 iron ore, as well as battery-associated        markets achieved growth this year, again
 been a standout on so many fronts. The               metals with more environmentally               the WA Index outperformed the broader
 market capitalisation growth highlights              conscious applications.                        ASX All Ordinaries, US S&P 500, FTSE 100
 a buoyant economic recovery from the                                                                and the Nikkei 225 through the year to 30
 initial shocks of the COVID-19 pandemic,             Our weighting to the commodity price           June 2021.
 with the comeback clearly aided by the               upswing has seen Western Australian
 strength of commodity prices, particularly           companies fair well, and while all observed

 Performance
Performance ofof Global
               Global   Financial
                      Financial   Markets
                                Markets overover
                                             the the
                                                 pastpast 12 months
                                                      12 months
 1.50

 1.40

 1.30

 1.20

 1.10

 1.00

 0.90

 0.80

 0.70
    Jun 20       Jul 20     Aug 20      Sep 20      Oct 20    Nov 20      Dec 20      Jan 21    Feb 21      Mar 21   Apr 21   May 21   Jun 21

                       Deloitte WA Index             ASX All Ordinaries            US S&P 500            FTSE 100       Nikkei 225

 Western Australia has received its fair              bounced back, rather, catapulted to record     On percentage terms it was the
 share of scrutiny regarding its approach to          highs in May 2021, and settling at its         sustainable minerals stocks that boomed.
 managing COVID-19, in particular the hard            penultimate best of $293.9 billion at the      Battery and clean energy associated
 border responses during the year. While              end of June 2021.                              organisations made their mark in the
 local restrictions have placed significant                                                          WA Index this year as clean tech and
 challenge on our local companies                     Powerhouse corporates such as Fortescue        renewables recharge for a post-pandemic
 in managing rostering, hygiene and                   Metals Group and Wesfarmers added              world.
 distancing protocols and retaining skilled           significant value to the WA Index in dollar
 labour, the economic rebound from the                value terms, which between the two of
 COVID-19 pandemic has been powerful.                 them make up almost $140 billion (or close
 Most notably, the market capitalisation              to 50%) of the Deloitte WA Index’s total
 of WA Index participants has not just                value at 30 June 2021.

 4
Deloitte WA Index 2021 | Diggers & Dealers Special Edition

‘The sheer growth in                            Outside the bulk commodities, base               Based on the official listing date on
                                                metals such as Nickel, Cobalt, Zinc, Lead,       the Australian Securities Exchange, we
renewable energy and                            Aluminium, and Copper all achieved strong        acknowledge the Top Five as follows:
electric vehicles, which                        price growth as their use in the clean           • Iluka Resources Limited –
                                                tech industries grows. Lithium has also            listed 30 June 1962
have historically relied                        returned to growth this year, with Lithium
                                                                                                 • Alkane Resources Limited –
on lithium ion batteries,                       Carbonate up 40% as the excitement
                                                                                                   listed 1 May 1969
                                                around battery metals is renewed.
has driven the global                                                                            • Woodside Petroleum Limited –
demand for lithium such                         This year’s winners of the Deloitte WA             listed 18 November 1971
                                                Index High Growth Awards which will              • Mount Gibson Iron Limited –
that governments and                            be presented at the Diggers & Dealers              listed 12 February 1976
industries have become                          conference in Kalgoorlie on 2-4 August           • Resolute Mining Limited –
increasingly concerned                          2021, all hold ties to these important
                                                ingredients for our future.
                                                                                                   listed 11 January 1979

about a supply shortfall                                                                         With the clean energy thematic
                                                                                                 intensifying, this year’s special edition
within the coming decade.’                      The top three movers in the WA Index Top
                                                20 in terms of market capitalisation for the     of the WA Index includes a thought
Mark Upton                                      year ended 30 June 2021 are:                     leadership piece titled ‘Lithium, shaping
Partner, Global Investment and                                                                   markets for a green future and Australia’s
                                                • Piedmont Lithium Limited – increasing
Innovation Incentives (Gi3)                                                                      opportunity’ which looks further into the
                                                  its market capitalisation by 1,732%
Deloitte                                                                                         future for our clean and green shift.
                                                • Liontown Resources Limited –
                                                  increasing its market capitalisation           We also managed to get some valuable
As they say, ‘a rising tide lifts all boats’,
                                                  by 761%                                        Q&A time with Peter Bradford, Managing
and this has certainly played true across
the commodity complex this year. As we          • Chalice Mining Limited – increasing its        Director and CEO of IGO and ask his views
emerge from one of the most crippling             market capitalisation by 752%                  on clean energy strategy, climate resilience
global pandemics of this lifetime, the                                                           and the importance of decarbonisation to
                                                We also recognise the three largest
thirst for commodities has in many                                                               the industry and our future generations.
                                                movers of the WA Index Top 100 in terms
cases exceeded supply response and
                                                of market capitalsation growth for the year
consequently we have witnessed upward                                                            In addition, given the strength of
                                                ended 30 June 2021. These are:
movements across the board. This comes                                                           renewable energy and sustainable
with the exception of gold, which as the        • Venturex Resources Limited –                   minerals stocks and commodities alike, we
traditional safe-haven investment option,         increasing its market capitalisation by a      have analysed the growth of the Deloitte
has been left languishing as the global           staggering 2,722%                              WA Index against the Deloitte CleanTech
economy recovers and confidence levels          • Vulcan Energy Limited – increasing             Index (DACT).
grow on successful vaccine rollouts and           its market capitalisation by an
reducing infection numbers.                                                                      The DACT Index consists of 90 Australian
                                                  impressive 2,653%
                                                                                                 companies who are identified as those
Interestingly, traditional energy               • Eagle Mountain Mining Limited –                whose output positively enhances the
commodities such as LNG, oil and thermal          increasing its market capitalisation           communities and ecologies in which they
coal have done very well, as the need for         by 993%.                                       reside. The CleanTech Index covers several
energy intensified quickly amid supply                                                           sub-sectors, including solar, wind, water,
                                                Congratulations to our winners!
constraints following the blocking of the                                                        energy storage and fuels cells, sustainable
Suez Canal, and import controls on coal         This year marks the 30th anniversary of
                                                                                                 minerals, and many more.
into China.                                     the Diggers & Dealers Conference. Deloitte
                                                has a proud association with Diggers &
Iron ore had an exceptional year, up 112%       Dealers over much of this time and on this
to US$216/t. This certainly helped our          30th anniversary we have looked back             Dave Andrews
largest WA Index participant, Fortescue         over the current WA Index participant list
                                                                                                 Partner – Audit & Assurance
Metals Group in achieving its 68.5%             at the longevity of WA based companies
growth in market capitalisation over the        whom continue to stand the test of time.
same period.
                                                                                                                                                 5
Deloitte WA Index 2021 | Diggers & Dealers Special Edition

                                 Deloitte WA Index
                                 Top Movers 2021
                                 At Diggers & Dealers we traditionally acknowledge WA
                                 resource companies that have delivered exceptional
                                 growth in market capitalisation during the year.

                                 Sustainable Minerals were in focus this year – with lithium,
                                 nickel, copper, zinc, among others, being pivotal to this
                                 year’s top mover’s success.

6
Deloitte WA Index 2021 | Diggers & Dealers Special Edition

Top movers of the Top 20

Piedmont Lithium Limited

Piedmont Lithium Limited (‘Piedmont’) increased its market capitalisation by a staggering 1,732% during
the year ended 30 June 2021, moving up to rank 16 in the WA Index, leaping from 103 in the previous year.

     This Year           Last Year               ASX                                           30 June 2021                30 June 2020                     $Change                      %Change

         16                  103                 PLL                                                 1,614                           88                            1,526                        1,732%

Background                                       Going forward
Piedmont is a lithium producer that prides       During the year Piedmont raised A$159
itself on its ability to produce high-quality,   million, with funds intended for completion
low-cost lithium hydroxide. Piedmont’s           of a definitive feasibility study, further
premier lithium project is located in the        drilling and test work, and other highly
renowned North Carolina Tin-Spodumene            prospective activities. Piedmont recently
Belt, which once supplied most of the            implemented a scheme to give effect
Western world’s lithium.                         to the re-domiciliation from Australia to
                                                 the United States of America, although
Operational review                               the company remains on the ASX at 30
In late September 2020, Piedmont’s               June 2021 and holds its registered office
share price rose sharply off the back of         in Perth. Piedmont has also recently
the signing of a sales agreement with            communicated to the market its long-term
Tesla, the world’s largest electric vehicle      goal to achieve net zero emissions by
manufacturer. This sales agreement               2030.
boasted a five-year (with the option to
extend) fixed-price commitment for                                            1,800
roughly 160,000 tonnes per annum of
                                                                              1,600
spodumene concentrate. This agreement
guaranteed the sale of approximately one-
                                                                              1,400
third of Piedmont’s planned spodumene
concentrate output.
                                                 Market capitalisation ($m)

                                                                              1,200

January 2021 saw Piedmont announce its
                                                                              1,000
decision to become a strategic investor
and major offtake partner in Sayona
                                                                               800
Mining (ASX: SYA). The offtake aspect of
the partnership secures Piedmont with an
                                                                               600
additional 60,000 tonnes of spodumene
concentrate per annum.                                                         400

                                                                               200

                                                                                 0
                                                                                                                                                 Dec 20

                                                                                                                                                                                                  May 21
                                                                                                         Aug 20

                                                                                                                                                                                       Apr 21
                                                                                                                            Oct 20
                                                                                                Jul 20

                                                                                                                  Sep 20
                                                                                      Jun 20

                                                                                                                                                                                                           Jun 21
                                                                                                                                                                              Mar 21
                                                                                                                                                                     Feb 21
                                                                                                                                        Nov 20

                                                                                                                                                          Jan 21

                                                                                                                                                                                                                7
Deloitte WA Index 2021 | Diggers & Dealers Special Edition

Top movers of the Top 20

Liontown Resources Limited

Liontown Resources Limited (‘Liontown’) upgraded its market capitalisation by an impressive 761% during
the year ended 30 June 2021, jumping to 18th spot in the WA Index at 30 June 2021.

     This Year             Last Year                 ASX                                           30 June 2021                30 June 2020                    $Change                      %Change

         18                    65                    LTR                                                1,546                            180                          1,367                        761%

Background                                           Going forward
Liontown is a Lithium-Tantalum                       Liontown leaps into the new financial year
exploration and development company,                 with a viable lithium project and exciting
with its flagship discovery located in the           exploratory Gold-Copper-PGE and Nickel
Kathleen Valley, Western Australia. The              projects that shows significant upside
Kathleen Valley Project is considered to             potential. The company aims to complete a
be a globally significant lithium deposit.           Definitive Feasibility Study for the Kathleen
Further strengthening Liontown’s portfolio           Valley Project during the fourth quarter of
is their Gold-Copper-PGE-Nickel Joint                2021. Furthermore, Liontown announced
Venture Projects – Moora and Koojan.                 its commitment to achieve net zero
                                                     emissions by 2050.
Operational review
Liontown’s market capitalisation rose                                             1,800
steadily over the period to April 2021
                                                                                  1,600
on the back of encouraging results from
their Kathleen Valley Project. In October                                         1,400
2020, Liontown released an updated pre-
                                                     Market capitalisation ($m)

feasibility study for their Kathleen Valley                                       1,200
project, which outlined the increase of
the mine life to roughly 40 years with a                                          1,000
two million tonne per annum processing
rate.                                                                              800

                                                                                   600
The company’s market capitalisation then
spiked in early June 2021, due to a highly
                                                                                   400
exciting investor presentation regarding
the Moora and Koojan Joint Ventures.                                               200
This also detailed Liontown’s proposed
demerger and IPO of the Moora and                                                    0
                                                                                                    Jul 20

                                                                                                                      Sep 20

Koojan Joint Venture Projects. Along with
                                                                                          Jun 20

                                                                                                                                                                                                              Jun 21
                                                                                                                                                                                 Mar 21
                                                                                                                                                                        Feb 21
                                                                                                                                           Nov 20

                                                                                                                                                             Jan 21
                                                                                                                                                    Dec 20

                                                                                                                                                                                                     May 21
                                                                                                             Aug 20

                                                                                                                                                                                          Apr 21
                                                                                                                                Oct 20

this proposal, the presentation outlined
the highly prospective nature of the Moora
and Koojan projects as the company
stated its intentions to complete follow up
drilling and drill test for new targets.

8
Deloitte WA Index 2021 | Diggers & Dealers Special Edition

Top movers of the Top 20

Chalice Mining Limited

Chalice Mining Limited (‘Chalice’) delivered a 752% increase in market capitalisation during the year ended
30 June 2021, placing the company in 12th position within the WA Index rankings.

    This Year            Last Year              ASX                                           30 June 2021                 30 June 2020                   $Change                    %Change

        12                   48                 CHN                                               2,574                              302                      2,272                          752%

Background                                      Going forward
Chalice is an Australian operated               Recently, Chalice announced its intentions
exploration specialist with an impressive       to demerge its gold assets to deliver a
portfolio that includes both precious and       standalone, ASX listed gold company,
base metals. Chalice’s flagship project is      stating that this would maximise value for
the Julimar Project in Western Australia        shareholders. It also allows Chalice to be
that contains high quality Platinum Group       acutely positioned for battery minerals
Element (PGE)-Nickel-Copper-Cobalt-             markets and has the potential for further
Gold.                                           growth considering the commencement of
                                                electromagnetic exploration at ‘Venture’s
Operational review                              South West Nickel-Copper-PGE project’ as
In September of 2020 the company made           well as their continued exploration out of
significant findings at their Julimar Project   Julimar.
including the announcement of positive
                                                                             3,500
preliminary metallurgical results as well
as the finding of large electro-magnetic
anomalies, highlighting the potential of the                                 3,000
Julimar Project. Since then, the company
has taken aggressive steps to increase                                       2,500
                                                Market capitalisation ($m)

resources and prove up reserves within
the aforementioned project. These actions
                                                                             2,000
have resulted in consistently positive
announcements regarding high-grade
zone extensions, drilling results and                                        1,500
metallurgical test work.

                                                                             1,000
The share price surge from March
2021 is explained by a series of exciting
occurrences such as: Nickel-Copper                                            500
soil anomalies reported at Julimar, the
acquisition of four private properties                                          0
in Julimar, positive drilling results at
                                                                                                                            Oct 20
                                                                                                Jul 20

                                                                                                                  Sep 20
                                                                                     Jun 20

                                                                                                                                                                                                        Jun 21
                                                                                                                                                                           Mar 21
                                                                                                                                                                  Feb 21
                                                                                                                                       Nov 20

                                                                                                                                                         Jan 21
                                                                                                                                                Dec 20

                                                                                                                                                                                               May 21
                                                                                                         Aug 20

                                                                                                                                                                                    Apr 21

Julimar and the commencement of
electromagnetic exploration on a ‘Julimar
lookalike target’. The acquisitions of
property (which increased their land share
by 723 hectares), was complimented by
additional strong drilling results from the
area, thus firming up the scale and future
of the project.

                                                                                                                                                                                                            9
Deloitte WA Index 2021 | Diggers & Dealers Special Edition

Top movers of the Top 100

Venturex Resources Limited

Venturex Resources Limited (‘Venturex’) accomplished a staggering 2,722% increase in its market
capitalisation during the year ended 30 June 2021. This launched Venturex Resources up the WA Index
ranking from 334 to 49.

     This Year             Last Year                 ASX                                         30 June 2021                  30 June 2020                    $Change                     %Change

         49                    334                   VXR                                                   466                           17                          449                         2,722%

Background                                           Going forward
Venturex is a base metals mining                     Funds raised through the recapitalisation
company based in Western Australia.                  project will be used for development
Its cornerstone project is the Sulphur               activities for the Sulphur Springs
Springs Copper and Zinc Project in the               project. These activities include infill
Port Hedland region of WA. Initial drilling          drilling, regional exploration, front end
at the Sulphur Springs Project identified            engineering design study and verification
six advanced targets that all returned               of their designed tailings storage facility.
intersections of commercial grade copper             Venturex plans to progress swiftly to a
and zinc.                                            final investment decision and commence
                                                     construction of the Project. To enable
Operational review                                   this the company is on a critical work
In February of 2021, Venturex announced              path which needs to occur before the wet
that highly regarded mining executive Bill           season in November 2021.
Beament will lead a recapitalisation of the
Company. The announced recapitalisation                                           500
is designed to enable the company to                                              450
grow and become a dominant supplier of
                                                     Market capitalisation ($m)

new-generation energy and technology                                              400
materials. Mr Beament has since been
                                                                                  350
appointed Executive Director effective 1
July 2021.                                                                        300

The share price experienced another                                               250
sharp rise in April 2021 when Venturex
                                                                                  200
delivered a progress report on Pre-
Development activities at its flagship                                            150
project. This announcement delivered
news of the Department of Mines,                                                  100
Industry Regulation and Safety (DMIRS)                                            50
approval of the company’s Project
Management Plan.                                                                   0
                                                                                                  Jul 20

                                                                                                                      Sep 20
                                                                                        Jun 20

                                                                                                                                                                                                            Jun 21
                                                                                                                                                                               Mar 21
                                                                                                                                                                      Feb 21
                                                                                                                                          Nov 20

                                                                                                                                                            Jan 21
                                                                                                                                                   Dec 20

                                                                                                                                                                                                   May 21
                                                                                                             Aug 20

                                                                                                                                                                                        Apr 21
                                                                                                                                Oct 20

10
Deloitte WA Index 2021 | Diggers & Dealers Special Edition
Top movers of the Top 100
Vulcan Energy Resources Limited
Vulcan Energy Resources Limited (‘Vulcan’) has achieved an impressive 2,653% increase in its market
capitalisation during the year ended 30 June 2021. This pushed Vulcan up the WA Index rankings to 28th.
This Year Last Year ASX 30 June 2021 30 June 2020 $Change %Change
28 240 VUL 835 30 805 2,653%
Background Going forward
Vulcan is shaking up the lithium producing Having recently being admitted into
industry through its commitment to the Global Battery Alliance, Vulcan can
become the world’s first zero carbon continue to positively shape the lithium
lithium producer. Vulcan’s lithium project production industry towards more
is located in the Upper Rhine Valley of environmentally friendly practices. Vulcan
Germany and is estimated to be Europe’s will be looking to progress to Definitive
largest lithium resource. The company Feasibility Study going forward.
aims to produce lithium through drawing
upon naturally occurring, renewable 1,000
geothermal energy to power the projects
900
lithium extraction process, resulting in no
fossil fuel impacts. 800
Market capitalisation ($m)
Operational review 700
The impressive rise in Vulcan’s market 600
capitalisation is due to the release of
500
their Pre-Feasibility Study in mid-January.
This study boasted increased indicated 400
resource estimates, excellent recoveries
from lithium extraction work and securing 300
a European Union support package for the
200
zero-carbon lithium project.
100
Vulcan has continued to make great
0
strides in improving its Project capabilities
Aug 20
Apr 21
Oct 20
Jul 20
Sep 20
Jun 20
Jun 21
Mar 21
Feb 21
Nov 20
Jan 21
Dec 20
May 21
to provide lithium with no fossil fuel
impacts. One major effort to increase the
company’s lithium projects capability was
the acquisition of ‘Global Engineering and
Consulting’, a firm that is widely considered
as a world leading mining engineering
firm with vast experience in geothermal
projects.
11Deloitte WA Index 2021 | Diggers & Dealers Special Edition
Top movers of the Top 100
Eagle Mountain Mining Limited
Eagle Mountain Mining Limited (‘Eagle Mountain Mining’) delivered an impressive 993% increase in its
market capitalisation from $19m to $203m during the year ended 30 June 2021. This placing Eagle Mining
at 97th in the WA Index.
This Year Last Year ASX 30 June 2021 30 June 2020 $Change %Change
97 316 EM2 $203m $19m $184 993%
Background Going forward
Eagle Mountain Mining is a copper- Eagle Mountain Mining is primed to
gold explorer with both advanced and further expand the Mineral Resource at
greenfield projects in Arizona. The their ever-so impressive Oracle Ridge
company currently operates two projects, Project with two rigs drilling full-time
those being the Silver Mountain copper providing a threefold increase in
Project and the Oracle Ridge copper mine. drilling rates.
Currently, the majority of the company’s
value lays within the Oracle ridge mine, Environmentally, Eagle Mountain Mining
which has undergone numerous resource has committed to complete a ‘future
expansion exploration efforts and mining study’ aimed at minimising
comprises of an existing underground emissions and improving efficiencies.
mine.
250
Operational review
During the year, the company’s market
capitalisation steadily rose off the back 200
of successful capital raises and positive
Market capitalisation ($m)
drilling results. Moreover, Eagle Mountain
Mining’s completed a $11m placement in 150
late February, which funded the company’s
aggressive drilling at Oracle Ridge and laid
the foundation for phenomenal drilling 100
results that were announced at the end of
March 2021.
50
The company’s drilling results reported
exceptional high-grade results containing
gold, silver and copper from outside 0
the existing Mineral Resource Estimate
Jun 20
Jul 20
Aug 20
Sep 20
Oct 20
Nov 20
Dec 20
Jan 21
Feb 21
Mar 21
Apr 21
May 21
Jun 21
at Oracle Ride. This news excited
shareholders as it enlarged and enhanced
the Oracle Ridge Mineral Resource.
12Deloitte WA Index 2021 | Diggers & Dealers Special Edition
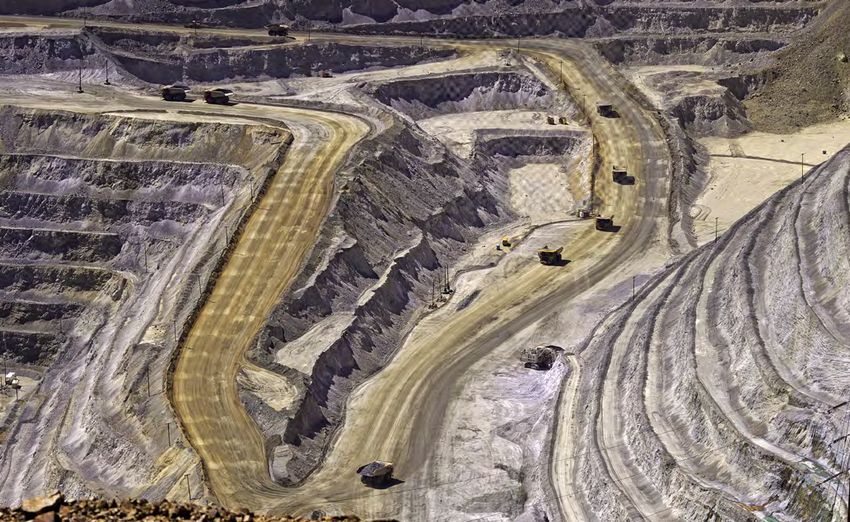
Commodity review
A detailed review of commodity price movements
for the year.
Commodity prices rallied this year; a stark contrast
compared to the lows experienced last year due to the
onset of the COVID-19 pandemic.
13Deloitte WA Index 2021 | Diggers & Dealers Special Edition
Commodity prices rallied this year; a The most notable winner this year is iron year flat, as economies resume industrial
stark contrast compared to the lows ore, reaching its highest recorded price in activity in a bid to return to normality.
experienced last year due to the onset May 2021 and closing the year at
of the COVID-19 pandemic. As industrial US$216/t – a 112% increase on last year. Recall, gold only recently achieved all time
activity across the globe accelerates price highs and the fact it has held its
back to pre COVID-19 levels, demand for Gold, unsurprisingly, was left out from the ground this year remains an outstanding
base metal commodities, and bulks, has upward trends in price experienced across result in its own right.
skyrocketed, while in many cases, supply the board. Often referred to as the go to
continues to lag as a result of production ‘safe haven investment’ choice in times of An overview of movements across our
shutdowns inflicted by the pandemic. economic uncertainty, gold finished the commodity portfolio is provided below.
Bulk Commodities
250
200
150
100
50
Jun 20 Jul 20 Aug 20 Sep 20 Oct 20 Nov 20 Dec 20 Jan 21 Feb 21 Mar 21 Apr 21 May 21 Jun 21
Iron Ore Thermal Coal Coking Coal
Iron Ore Thermal Coal Coking Coal
Iron ore prices saw strong growth over the After a 2-year downward trend, closing at The price of China Prime Coking Coal
course of the 2021 financial year as Australia USD $64/tonne last 30 June 2020, thermal remained steady for most of the year,
and indeed the world, dealt with the effects coal prices have rallied closing at USD gradually working its way back to pre-
of the COVID-19 pandemic. Annually, iron $129/tonne as of 30 June 2021, a 10-year COVID-19 levels. This was driven by demand
ore prices grew by 112%, rising to USD $216/ high to the previous USD $180/tonne in for the essential steel making commodity,
tonne at 30 June 2021. Two months brought July 2008. Despite the effort to transition which improved as economic growth in
high volatility to the price, but the overall to more renewable energy sources, coal China began to pick itself up following
trend was not shaken by these periods. remains a growing industry in Asia. The the initial wave of COVID-19. In April 2021,
December 2020 saw a USD $44/tonne increase in price was primarily driven strict safety and environmental checks
jump in price, spurred by high demand from by the increase in energy consumption saw the suspension of production at four
China, who notably left iron ore agreements in Asia. This demand is attributed to a mines within the Shanxi province placing
untouched by tariffs and trade barriers combination of factors including a strong stress on local supply. With Australian
during this period of heightened tensions economic recovery from the pandemic, coal imports unofficially banned, and a
between the nations. Environmental issues global shortage of supply and import reduction in Mongolian imports because of
with competing producers like Brazil’s Vale controls. Chinas demand for coal has border crossing restrictions to try and limit
also contributed to this strong finish to the also continued to grow, despite bans the spread of COVID-19, the price of local
calendar year. The steep drop later in the on Australian coal imports. This has coking coal rallied to close out the year at
month was caused by pressure from China cornered the country to rely on locally USD $209/tonne.
as it scrambled to slow down the steep rise produced coal, although supply levels
of many of its largest imports. Overall, the have not been able to fulfill demand. This
iron ore price across the past financial year is particularly true for the last quarter of
has been characterised by strong growth in the year, where seasonal changes in China
spite of rising geopolitical tensions, shifting have significantly increased demand.
market players and the ongoing impacts of Additionally, a suite of mine disruptions
the COVID-19 pandemic. across the globe contributed to a global
shortage of supply, driven by mines in
Indonesia which experienced flooding,
unrest in Colombia, maintenance of
rail systems in South Africa and safety
inspections in China.
14Deloitte WA Index 2021 | Diggers & Dealers Special Edition
Precious Metals
200
150
100
50
Jun 20 Jul 20 Aug 20 Sep 20 Oct 20 Nov 20 Dec 20 Jan 21 Feb 21 Mar 21 Apr 21 May 21 Jun 21
Silver Palladium Platinum Gold
Silver Platinum Gold
Silver’s historic volatility was once again The price of the industrial metal achieved The price of gold rallied in the first
the hallmark of its movement over the strong growth during the year, closing 30% quarter of the year, reaching a high
financial year. Silver saw a 42% increase, higher at USD $1,059/oz. Like many other of USD $2,067/oz in August 2020 as
from USD $18/troy oz to USD $26/troy oz commodities in its class, the price has demand for safe-haven investments
at 30 June 2021. July and August of 2020 continued to climb as global economies increased, stemming from continued
saw a historic surge in the silver prices, to rebound and governments pour more global economic disruption because of the
an almost-4-year-high and then pushing resources into infrastructure development COVID-19 pandemic. As COVID-19 vaccines
further, tipping the price over USD $28/troy post the COVID-19 downturn. These factors began to be administered towards the
oz. This growth was attributed to strong have kept the market in a supply deficit, back end of 2020, investor concerns
gold performance, increased demand for with production only now starting to ramp over the pandemic began to ease, which
silver in industrial applications, particularly back up to pre COVID-19 levels in South diminished the desire for investors to hold
in solar energy. Silver’s retraction in Africa and Russia, who are the dominate onto gold as a safety proposition, resulting
September 2020, was on account of the producers of the metal. Given Platinum’s use in a steady decline in the price of gold
strengthening of the US dollar. in the automotive industry as a catalyst to into early 2021. As some countries, most
reduce carbon emissions, the future price notably India, experienced the second
Palladium of the commodity is expected to bode well, wave of COVID-19, the price was again
as government’s continue to crack down on bolstered in April to May of 2021. The
The price of palladium climbed to its
emissions in order to try and limit the effects price then declining back down to USD
all-time recorded high during the period
of climate change. $1,763/oz to close out the year relatively
and closed 42% higher at USD $2,707/
flat, on the back of the US Federal Reserve
oz. The price continues to be influenced
indicating that it may increase interest
by an increase in demand from the
rates earlier than first expected, signalling
automotive sector, due to the tightening
that economic activity is on the rise, both
of emissions legislation in Europe and
in the US and on a global scale.
China. As automotive manufacturing rates
continue to improve post the onset of
COVID-19 imposed lockdowns, demand for
palladium is expected to remain high, as
manufacturers continue to restock.
15Deloitte WA Index 2021 | Diggers & Dealers Special Edition
Base Metals
200
150
100
50
Jun 20 Jul 20 Aug 20 Sep 20 Oct 20 Nov 20 Dec 20 Jan 21 Feb 21 Mar 21 Apr 21 May 21 Jun 21
Nickel Cobalt Lead Aluminium Tin Copper Zinc Lithium
Nickel Cobalt USD $1,994/tonne by mid-August 2020,
Nickel saw 43% increase over the Cobalt experienced a tumultuous year. signalling a stronger recovery than initially
financial year from an opening price of August 2020 saw a steep rise due to expected. Further factors driving this
USD $12,757/tonne to USD $18,212/ supply restrictions in the face of China’s growth were supply woes as COVID-19
tonne at 30 June 2021. The metal saw growing demand. COVID-19 lockdowns related mine disruptions, especially across
a steady upwards trend for the first across African nations saw transport African producers, were felt across the
half of the financial year, before a week delays and bottlenecks impacting Zambia market. Slumps in the price were caused
of record movements in late February and the Democratic Republic of Congo by lead’s heavy reliance on secondary
and early March 2021. January 2021 (DRC), which accounts for 70% of global feeds and the impact of COVID-19 related
was a strong month for the commodity cobalt supply. In January 2021, increased lockdowns and production delays on such
with environmental issues including interest in electric vehicles (EV) saw the processes.
earthquakes in Indonesia driving the cobalt price soar to highs of USD $53,000/
price higher in a knee jerk reaction to tonne as the market anticipated supply Aluminium
envisioned supply shortages. A month shortages due to lingering effects of Aluminium rose 57% across the 2021
later, nickel reached a seven-year-high transport delays and China’s stockpiling of financial year from USD $1,601/tonne
of USD $20,110/tonne by the end of the metal. Cobalt prices retreated in April to a finish of USD $2,509/tonne at 30
February, only to drop by 7.6% a week and May of 2021 as interest in alternative June 2021. The metal benefited with
later, the biggest one-day loss since 2016. batteries grew, easing demand on NCM announcements from the likes of Tesla
This was a sharp market response to (nickel, cobalt, manganese) batteries demonstrating the role of aluminium
several production and demand factors, and their components. Soaring EV sales in new technologies and industries. As
including the announcement by major have ensured an overall upward trend a lighter, greener alternative to steel,
Chinese producer Tsingshan Holdings in cobalt prices, with commodity trading aluminium is set to be a major component
Group that it would provide 100,000 house Trafigura’s head of nickel and cobalt in the electric vehicle industry, but this is
tonnes of nickel matte to the market for announcing supply must double by 2030 not the only application for the metal that
the booming technology industry. Further to meet such rising demand, with Glencore has pushed the price steadily higher over
drivers of volatility were production issues announcing plans to reopen one of the the 2021 financial year. Ever-increasing
plaguing major suppliers across the globe, world’s largest cobalt mines, and the demand from China, concerns about
from Brazil’s Vale undergoing maintenance Mutanda Project in DRC to be ready for supply shortages as nations pivot to less
and dealing with environmental issues, production in 2022. Cobalt finished the energy-intensive metals, trade tariffs
and Russia’s Norilsk, closing production at financial year at USD $49,600/tonne. and international tensions associated
two mines due to flooding. Despite these with the sale of aluminium all played a
disruptions, the nickel price is carving an Lead part in keeping the market wary and as a
upwards path as production stabilises and Lead saw a true-to-form high movement result, buoyed the price across the year.
clean technology applications of the metal year, starting at USD $1,763/tonne to a This steady growth has been a welcome
heighten demand. finish at USD $2,265/tonne – a 28% annual change for the market after a volatile
increase. Lead saw pricing challenges in performance over the previous year.
the first half of the 2020 financial year but
lead’s essential role in industrial batteries
saw its demand stay strong pushing
the price up during the latter half of the
year. The metal reached a price high of
16Deloitte WA Index 2021 | Diggers & Dealers Special Edition
Tin Copper Lithium
The demand for tin continued to climb The price of copper increased strongly over Lithium remained flat over the first half of
for its use as solder in the electronics the year, closing at USD $9,352/tonne, a the year, with a low point of USD $6.20/kg.
industry. This has had a profound impact 53% increase on last year’s closing price. The second half of the year saw the price
on the price of the commodity, which has As supply continued to be constrained step up, with an overall increase of 39%
effectively doubled during the year, closing from Chile and Peru, two of the leading over the year and a closing price of USD
at USD $32,920/tonne. The increased copper producers who continue to struggle $9.00/kg. The price increase was driven by
demand stems from a sustained demand to overcome the COVID-19 pandemic, the high demand of the commodity in the
for consumer electronic across the globe increased demand from China and the production of lithium batteries, used in the
amidst the COVID-19 pandemic due anticipated rebound of the global economy production of electric cars. Concurrently,
to more home working and schooling and industrial activity post COVID-19 is supply has not been able to keep up with
arrangements. Supply disruptions flagging a significant supply deficit. demand, with lithium producer Albemarle
have also driven the price up as several announcing that it had already sold its
smelters in Asia and South America have Zinc lithium supply for the rest of the year.
struggled to produce at their maximum Zinc achieved 46% growth over the year, In order to meet demand, the Company
capacity due to the COVID-19 pandemic, closing at USD $2,967/tonne. The metal, looked to bring its Wodgina mine in
causing the market to reside in a supply which is heavily used in the construction Western Australia back online, but had
deficit position. of bridges, roads, utilities, and railroads struggled in the face of labour shortages
by a process of galvanisation, surged in in the state. Production response
price as a result of the strong demand challenges from several lithium producers
for the metal in China, the largest has created a tighter market than initially
consumer of industrial metals in the world. expected which bodes well for sustained
China’s strong economic recovery, and lithium price growth.
strong fiscal stimulus aimed at building
infrastructure across the country has
resulted in the price of industrial metals,
including zinc and iron, to soar in the
past year.
Oil and Gas
700
600
500
400
300
200
100
0
Jun 20 Jul 20 Aug 20 Sep 20 Oct 20 Nov 20 Dec 20 Jan 21 Feb 21 Mar 21 Apr 21 May 21 Jun 21
Crude Oil LNG
Crude Oil low relative to previous years, demand contributing to the price spike, as well as
The price of crude oil saw an increase of has still shown a slight increase with disruptions in LNG production in Western
84% from USD $41/BBL up to a closing increased economic activity. Additionally, Australia and freight setbacks in the
price of USD $75/BBL as of June 2021. a steady rise in US inflation rates has also Suez Canal. The price of LNG maintained
This upward trend was maintained by the contributed to the increase in oil prices. an upward trend into June 2021, driven
gradual decline in U.S. shale production by strong economic activity in Asia
and inventories, and the controlled supply LNG throughout the year. Further, the scarcity
of oil by OPEC+. Crude Oil prices have been LNG prices have had a rollercoaster year, of utilities in Japan, the world’s top LNG
positively impacted by the swift response with an overall upward trend. The price importer, and Korea has seen an increase
of governments to implement the COVID of LNG saw an increase of 510% from in demand for the gas.
vaccines, as restrictions ease up, market USD $2.00/mmbtu to a closing price of
confidence has risen and the demand for USD $13.11/mmbtu. During the year, the Largely, the price increase was driven by
oil for transport and manufacturing has commodity rallied as high as USD $19.70/ seasonality and the fuel increasingly used
increased. While demand for oil remains mmbtu in January 2021 with winter together with renewables.
temperatures in the northern hemisphere
1718
0
5
10
15
20
25
30
40
50
60
70
80
50
70
90
110
130
150
100
150
200
250
Jun 20 Jun 20 Jun 20
15,000
20,000
25,000
30,000
35,000
Jul 20
Jun 20
Jul 20 Jul 20 Jul 20
Aug 20
Jul 20
Aug 20 Aug 20 Aug 20
Sep 20
Aug 20
Sep 20 Sep 20 Sep 20
Sep 20 Oct 20
Oct 20 Oct 20 Oct 20
Oct 20 Nov 20
Nov 20 Nov 20 Nov 20
Nov 20 Dec 20
Dec 20 Dec 20 Dec 20
Dec 20 Jan 21
Tin US$/tonne
Coal US$/tonne
Jan 21 Jan 21 Jan 21
LNG US$/mmbtu
Jan 21 Feb 21
Iron Ore US$/tonne
Crude Oil US$/barrel
Feb 21 Feb 21 Feb 21 Feb 21
Mar 21
Mar 21 Mar 21 Mar 21
Deloitte WA Index 2021 | Diggers & Dealers Special Edition
Mar 21 Apr 21
Apr 21 Apr 21 Apr 21 Apr 21
May 21
May 21 May 21 May 21 May 21
June 21
Jun 21 Jun 21 Jun 21 June 21
17
22
27
32
1,500
1,700
1,900
2,100
2,300
2,500
2,700
1,800
2,000
2,200
2,400
2,600
2,800
3,000
3,200
Jun 20
5,000
6,000
7,000
8,000
9,000
10,000
11,000
28,000
33,000
38,000
43,000
48,000
53,000
58,000
Jun 20 Jun 20 Jun 20
Jul 20 Jun 20
Jul 20 Jul 20 Jul 20
Aug 20 Jul 20
Aug 20 Aug 20 Aug 20
Aug 20
Sep 20
Sep 20 Sep 20 Sep 20
Sep 20
Oct 20
Oct 20 Oct 20 Oct 20 Oct 20
Nov 20
Nov 20 Nov 20 Nov 20 Nov 20
Dec 20
Dec 20 Dec 20 Dec 20 Dec 20
Zinc US$/tonne
Jan 21
Copper US$/tonne
Cobalt US$/tonne
Silver US$/troy oz
Jan 21 Jan 21 Jan 21 Jan 21
Aluminium US$/tonne
Feb 21 Feb 21 Feb 21
Feb 21 Feb 21
Mar 21 Mar 21 Mar 21 Mar 21 Mar 21
Apr 21 Apr 21 Apr 21 Apr 21 Apr 21
May 21 May 21 May 21 May 21 May 21
Jun 21 Jun 21 Jun 21 Jun 21 Jun 215
6
7
8
9
10
700
800
900
1,000
1,100
1,200
1,300
1,400
1,600
2,100
2,600
3,100
Jun 20
1,700
1,900
2,100
2,300
2,500
12,500
14,500
16,500
18,500
20,500
Jun 20 Jun 20 Jun 20
Jul 20 Jun 20
Jul 20 Jul 20 Jul 20
Aug 20 Jul 20
Aug 20 Aug 20 Aug 20
Sep 20 Aug 20
Sep 20 Sep 20 Sep 20
Sep 20
Oct 20
Oct 20 Oct 20 Oct 20
Oct 20
Nov 20
Nov 20 Nov 20 Nov 20 Nov 20
Dec 20
Dec 20 Dec 20 Dec 20 Dec 20
Jan 21
Lead US$/tonne
Nickel US$/tonne
Jan 21 Jan 21
Lithium US$/tonne
Jan 21 Jan 21
Platinum US$/ounce
Palladium US$/ounce
Feb 21 Feb 21 Feb 21
Feb 21 Feb 21
Mar 21 Mar 21 Mar 21 Mar 21 Mar 21
Apr 21 Apr 21 Apr 21 Apr 21 Apr 21
May 21 May 21 May 21 May 21 May 21
Jun 21 Jun 21 Jun 21 Jun 21 Jun 21
24
26
28
30
32
34
150
160
170
180
190
200
210
220
Jun 20
1,500
1,600
1,700
1,800
1,900
2,000
2,100
Jun 20
Jun 20
Jul 20 Jul 20
Jul 20
Aug 20 Aug 20
Aug 20
Sep 20 Sep 20
Sep 20
Oct 20 Oct 20
Oct 20
Nov 20 Nov 20
Nov 20
Dec 20 Dec 20
Dec 20
Coal US$/tonne
Jan 21
Gold US$/ounce
Jan 21
Uranium US$/ LB
Jan 21
Feb 21 Feb 21 Feb 21
Mar 21 Mar 21 Mar 21
Apr 21 Apr 21 Apr 21
May 21 May 21 May 21
Jun 21 Jun 21 Jun 21
19
Deloitte WA Index 2021 | Diggers & Dealers Special EditionDeloitte WA Index 2021 | Diggers & Dealers Special Edition 20
Deloitte WA Index 2021 | Diggers & Dealers Special Edition

Celebrating 30 years –
Congratulations to
Diggers & Dealers
This year marks the 30th anniversary           Longevity in the energy and resources           The companies have been selected
of the Diggers and Dealers Mining              industry can be a rarity as investors and       from the Deloitte WA Index Top 100
Conference in Kalgoorlie. This conference,     management teams alike are often quick          as at 30 June 2021, being the top 5
like many of mining companies it               to capitalise on news from the drill bit in     longest surviving organisations based
represents, has seen a fair share of           favour of paving the roads to production.       on official listing date on the Australian
cyclical ups and downs over the past three     Similarly, when you are onto a good thing,      Securities Exchange and in the energy and
decades. What a remarkable achievement         offence quickly turns to defence as the         resources industry. Congratulations to
and representation of the resilience and       M&A eagles start to circle.                     the companies that have been recognised
commitment of many industry stalwarts                                                          for their outstanding success and
over the years to keep this institution        To mark the 30th anniversary of Diggers &       contribution to the WA market over the
thriving!                                      Dealers we have analysed longevity of WA        past 30 years.
                                               Index participants.
Top 5 longest survivors

 Rank       ASX      Constituent name                    Sector            Official listing date         Mkt Cap 30 June 2021 (AU$m)

   1        ILU      Iluka Resources Ltd.                Materials              30/06/1962                              3,867

   2        ALK      Alkane Resources Limited            Materials               1/05/1969                                685

   3        WPL      Woodside Petroleum Ltd.             Energy                 18/11/1971                             21,401

   4        MGX      Mount Gibson Iron Limited           Materials              12/02/1976                              1,020

   5        RSG      Resolute Mining Limited             Materials              11/01/1979                                557

Iluka Resources Limited                        Iluka is ranked 10 in the Deloitte WA Index,    During Alkane’s formative years, they
Iluka Resources Limited (Iluka) listed on      with a market capitalisation of AU$3.867        operated on an international basis with
the ASX 59 years ago in 1962, not as Iluka     billion at 30 June 2021.                        gold assets in Indonesia, New Zealand
as we know it now, but as Westralian Oil                                                       and Australia, however in recent years
Limited. During the 1990’s the company         Alkane Resources Limited                        they have taken an Australian based asset
operated under the name ‘Westralian            Alkane Resources Limited (Alkane) is a gold     approach with operations primarily based
Sands Ltd.’, and during this time the          production company that has now been            out of New South Wales.
company operated mineral sands projects        an ASX listed company for 52 years, listing
with the aim of extracting titanium bearing    in 1969. Alkane’s two current projects
minerals to be used in high technology         are located in the central western region
products. Fast forward to current day, Iluka   of New South Wales, more specifically
is still primarily involved in mineral sands   the Tomingley Gold Project southwest
exploration and related development,           of Dubbo and the Northern Molong
operations, and marketing, with historic       Porphyry Project directly east of Dubbo.
projects in the south west of Western          Alkane’s main focus has always been gold;
Australia and today, operations across the     that being said, their operational approach
world, from the world’s largest zircon mine    has changed over the years.
at Jacinth-Ambrosia in South Australia to
leading rutile mines in Sierra Leone.

                                                                                                                                              21
Deloitte WA Index 2021 | Diggers & Dealers Special Edition Woodside Petroleum Ltd. Mount Gibson Iron Limited Resolute Mining Limited Woodside Petroleum Ltd. (Woodside) listed Mount Gibson Iron Limited (‘Mount Resolute Mining Limited (Resolute) was on the ASX in 1971 and is involved in the Gibson’) listed on the ASX in 1976 making listed on the ASX in 1979 and has been exploration, development and production this its 45th year as a listed entity. Mount involved in the exploration, development of a number of hydrocarbon plants across Gibson Iron is an Australian producer and operation of gold mines across the the globe. Woodside’s hydrocarbon of high-quality iron ore products, with African continent. Resolute is ranked 44 business has recently taken focus on LNG, projects based out of the Kimberly and the on the Deloitte WA Index with a market which is a lower-emission alternative to Mid-West regions of Western Australia. In capitalisation of AU$557.47 million at 30 traditional petroleum and natural gas. 2002, Mount Gibson undertook a reverse June 2021. Although Resolute’s company Currently, Woodside operate projects in acquisition of Whittakers Ltd., a prominent name has changed four times since being Western Australia including Pluto LNG and West Australian timber miller. Mount listed in 1979, the company’s modus the North West Shelf Projects and global Gibson kept Whittakers Pty under their operandi has remained largely the same, operations in Timor-Leste, Woodside has corporate structure as a subsidiary until with a focus on gold assets in Africa. long been a WA industry leader. Woodside 2010, when they restructured the Mount is ranked 3 on the Deloitte WA Index, with Gibson consolidated entity. market capitalisation of AU$21.4 billion at 30 June 2021. 22
Deloitte WA Index 2021 | Diggers & Dealers Special Edition

Lithium and the shift to
renewables and electric vehicles
For more than a century, the world has                      in five years and that supply will serve                  chain while other countries (i.e., Australia
largely relied on fossil fuels to feed the                  only 50% of projected demand by 2030,                     and Chile) that have large reserves of
engines of industry and commerce. In                        corresponding to a 20% increase in price                  the metal own less of the downstream
doing so, these conventional energy                         for the metal.5                                           value chain.
resources have increased global
prosperity and created the conditions for                   These lithium demand trends are unlikely                  Four countries enjoy an oligopoly position
the development of increasingly innovative                  to abate and could even accelerate. United                in the lithium market: Argentina, Australia,
and revolutionary technologies. However,                    States President Biden’s election and the                 Chile, and China. Although China has
this energy legacy has also resulted                        subsequent recommitment by the US to                      the lowest reserves, it arguably has a
in environmental and climatological                         the Paris Climate Agreement, and pledge                   more dominant market position given its
                                                            to achieve net-zero emissions by 2050,                    strategic investments in lithium mines
externalities.1 Recognising these
                                                                                                                      abroad and its control of many segments
challenges, many countries and industry                     could galvanize allies and other signatories
                                                                                                                      of the value chain.
leaders have committed to pursuing a                        to take similarly bold climate actions.
cleaner energy future through increasing
                                                                                                                      China’s influence over global lithium
the integration of renewable energy (RE)                    Shaping markets for a green future
                                                                                                                      and other minerals supply is driven
into power grids and the utilisation of                     Given the existing demand, and the likely                 by its infrastructure investment effort
electric vehicles (EV). This global shift to                global re-commitment to clean energy,                     to expand influence abroad and the
clean energy has been stark – from 2010                     governments must be proactive in their                    strength of the Chinese battery market,
to 2019, RE power generation capacity                       lithium policymaking to avoid national                    which may require 800,000 tonnes of
nearly doubled.2 RE, as a portion of                        budget stresses and ensure continuity                     lithium per year by 2025 to keep pace
global power production, increased from                     of supply for domestic industries that                    with global EV manufacturing demand.6,7,8
approximately 20% in 2010 to 28% in 2018                    rely on this critical resource. To do so,                 The ability to absorb as much lithium as a
and many believe this number will reach                     governments must create policies to                       mineral jurisdiction can produce creates
50% by 2050.3 At the same time, there                       address the three primary constraints to                  an investment climate where Chinese
has been immense growth in the global                       lithium access:                                           companies are among the first, and best-
adoption of EVs. From 2010 to 2019, EVs                                                                               positioned, market entrants in countries
rose from 0% to over 2.5% of global vehicle                 1. The geopolitics of lithium
                                                                                                                      with large lithium reserves.
sales; by 2030 they are forecasted to claim                 Countries that are in a high net-import
32% of market share.4                                       position in terms of their lithium demand                 2. The environmental risks of
                                                            – e.g., the United States and the European                   extracting and processing lithium
The sheer growth in RE and EVs, which                       Union (EU) – must consider multilateral or                Environmental, social, and governance
have historically relied on lithium ion                     complementary policy approaches that                      (ESG) standards have become increasingly
batteries, has driven the global demand                     provide political, technical, or economic                 important for mining executives. This
for lithium such that governments and                       support to lithium-rich, market-friendly                  is partly due to the liability exposure of
industries have become increasingly                         economies with the goal of improving                      damage and part the disruption to mine
concerned about a supply shortfall within                   competitive global market access to                       operations that can financially doom a
the coming decade. The financial firm                       these resources. Although already a key                   project. A mine’s exposure to ESG risk is
UBS forecasts that global demand will                       lithium supplier, China has also begun to                 frequently a cause of such disruption and
outstrip all new lithium project production                 concentrate much of the lithium value                     an even greater catastrophe.

1
    International Renewable Energy Agency, “The True Cost of Fossil Fuels: Saving on the Externalities of Air Pollution and Climate Change,” International Renewable
    Energy Agency, May 2016
2
    International Renewable Energy Agency, “Renewable Energy Statistics 2020,” International Renewable Energy Agency, July 2020
3
    US Energy Information Administration, “How much of world energy consumption and production is from renewable energy?,” US Energy Information
    Administration, accessed February 5, 2021
4
    Michael Woodward, Dr. Bryn Walton, and Dr. Jamie Hamilton, et. al., “Electric vehicles: setting a course for 2030,” Deloitte, July 28, 2020
5
    Dan Runkevicius, “As Tesla Booms, Lithium Is Running Out,” Forbes, December 7, 2020
6
    Andrew Chatzky and James McBride, “China’s Massive Belt and Road Initiative,” Council on Foreign Relations, January 28, 2020
7
    Liu Yukun, “BRI brings gains for mineral firms,” China Daily, October 20, 2018
8
    Daniel Ramos, “Bolivia picks Chinese partner for $2.3 billion lithium projects,” Reuters, February 6, 2019

                                                                                                                                                                    23
Deloitte WA Index 2021 | Diggers & Dealers Special Edition
The 2019 collapse of Vale’s tailings To combat the increasing geopolitical, The lithium industry in Australia has a
dam in Brumadinho, Brazil underscores environmental, and demand-driven clear opportunity to leverage the
this notion.9 constraints, lithium-dependent countries globally-aligned policies:
will increasingly flex their policy levers to
Adopting a global leading position
Corporate ESG attention is also due to promote competitive, ESG-based, lithium
global consumers’ increasing demands market development and avoid the fiscal Despite China’s increasingly dominant
around the provenance of their EVs, and economic ramifications of a supply- market share and control throughout the
batteries, and battery components. constrained world. value chain, the majority of un-extracted
Spurred by shareholders and lithium reserves fall outside China;13 net
environmentally conscious customers, Australia’s opportunity to respond lithium exporting countries like Australia
companies like BMW10 have become to demand must do everything within their power
increasingly aware of the environmental to incentivise bringing these reserves to
Australia’s Critical Minerals Strategy
cost of the lithium required to market. For example, 54% of global lithium
(including lithium) outlines three target
manufacture new, desirable EVs. Just reserves are concentrated in Australia and
actions of the government’s policy
last year, BMW entered into a five-year the “lithium triangle” of Argentina, Bolivia,
framework for our critical minerals market:
€540 million agreement for lithium that is and Chile.14 Bringing these resources to
• promoting investment in Australia’s market with urgency will embed Australia’s
“extracted and processed under ethically
critical minerals sector and downstream position and influence and global supply
responsible conditions.”11
processing chain.
• providing incentives for innovation
Lithium projects can be developed
to lower costs and increase Leverage ESG for a seat and the table
through brine or hard-rock extraction.
competitiveness There is an important overarching market
Brine extraction is water intensive and
is common in South America, especially • connecting critical minerals projects with advantage linked to the credibility of
from the expansive salt flats. In Australia, infrastructure development domestic ESG project reporting and
energy intensive hard-rock extraction is compliance. This is a key factor as our
These steps aim to position Australia
the primary production method. Both project developers look to engage with
as a world leader in the exploration,
methods present unique environmental extraction, production and processing markets such as North America where
risks. Source: Deloitte Analysis. of critical minerals. The goal of the governments and end users researching
strategy is to enable the development for supply. Two very important questions
3. Lack of alternatives and promoting of Australia’s critical minerals sector, exist that will have direct impact on
innovative alternatives including downstream processing and Australian projects searching for offtake
Current technological trends point to manufacturing opportunities, by attracting supply contracts – “Will we see a premium
very few viable lithium-substitutes for investment, supporting innovation paid for high ESG compliance, or will that
the batteries that power the new energy and connecting opportunities with be a requirement to get a seat at the
technologies. Governments must provide infrastructure12. negotiation table, and therefore a cost
incentives to broaden the supply base to be absorbed?” and “How long will it
through innovative approaches. Australia has a world leading endowment be before jurisdictions that have a lower
of natural lithium resources measured cost of production to Australia are able
The drive for increasing RE and EV by volume and quality. The industry is to credibly report on ESG and therefore
penetration is only likely to intensify, at crucial juncture right now as projects influence global product supply?”
especially given the results of the latest US search for the opportunity to attract Producers should be assessing where they
election, thereby further accelerating the capital, build supply chain operating sit on this spectrum and ensure the best
global demand for lithium. models and adopt leading technology to leverage/cost/value position is secured for
exploit these resources. offtake agreements.
9
Reuters, “Vale dam-break trauma raises level of ESG funds in Brazil” by Sabrina Valle, https://www.reuters.com/article/us-vale-sa-esg-brazil-focus/vale-dam-
break-trauma-raises-level-of-esg-funds-in-brazil-idUSKBN27C0R5 accessed February 5, 2021
10
Kai Zoebelein, “BMW Group commissions study on sustainable lithium extraction,” BMW Group, December 16, 2020
11
Saskia Essbauer, “Securing raw material supplies for battery cells: BMW Group signs supply contract with Ganfeng for sustainable lithium from mines in Australia,” BMW Group,
December 11, 2019
12
Critical Minerals Facilitation Office, https://www.industry.gov.au/data-and-publications/australias-critical-minerals-strategy, March 2019
13
United States Geological Survey, “Lithium,” United States Geological Survey, accessed February 5, 2021
14
Economist, “The white gold rush: A battle for supremacy in the lithium triangle,” Economist, June 17, 2017
24Deloitte WA Index 2021 | Diggers & Dealers Special Edition
Governments can adopt policies for One option is for governments to provide Mark Upton
hard-rock extraction, which is typically R&D investment to explore recycling Partner – Global Investment and
powered by heavy fuel oil, that encourage methods to extend lithium’s shelf-life. The Innovation Incentives (Gi3)
a transition to RE, such as the official US Department of Energy is attacking both
sanctioning of corporate power purchase the supply and demand sides of recycling. Sri Sekar
agreements and subsidies (e.g., feed-in US agencies are exploring methods Senior Manager – Consulting
tariffs). Strategic encouragement by way to reconfigure battery packs to make
of RE financing and funding support for lithium more extractable while ensuring
value-add processing investment will the recycled lithium meets EV industry
support the local market. standards.15
Invest in technology and supply chain Technology investment applies to both
Policymakers confronting an impending aspects of extraction techniques, be
lithium shortage must be able to “walk it for a specific facility or downstream
and chew gum.” They must develop processing. Governments also have
approaches to expand their access a clear opportunity to incentivise the
to ethically-extracted lithium while development of shared user facilities,
simultaneously devising near-term center of excellence hubs and supporting
solutions to maximise existing supply. infrastructure to facilitate product
movements through supply chain.
15
US Department of Energy, “Research Plan to Reduce, Recycle, and Recover Critical Materials in Lithium-Ion Batteries,” US Department of Energy, June 2019
25You can also read