COVID-19 strengthens real estate market trends - Credit Suisse
←
→
Page content transcription
If your browser does not render page correctly, please read the page content below

Investment Solutions & Products
         Swiss Economics

         COVID-19 strengthens
         real estate market trends
         Real Estate Monitor Switzerland | October 2020

Housing market                         Housing market     Office property
COVID-19 slows demand                  What if…           Revolution or evolution?

Page 9                                 Page 13            Page 15
Imprint

Publisher: Credit Suisse AG, Investment Solutions & Products
Nannette Hechler-Fayd’herbe
Head of Global Economics & Research
+41 44 333 17 06
nannette.hechler-fayd'herbe@credit-suisse.com

Fredy Hasenmaile
Head of Real Estate Economics
Tel. +41 44 333 89 17
fredy.hasenmaile@credit-suisse.com

Copy deadline
October 5, 2020

Publication series
Swiss Issues Immobilien

Visit our website at
www.credit-suisse.com/immobilien

Copyright
The publication may be quoted providing that it is cited as the source.
Copyright © 2020 Credit Suisse Group AG and/or its
affiliated companies. All rights reserved.

Authors

Fredy Hasenmaile, +41 44 333 89 17, fredy.hasenmaile@credit-suisse.com
Alexander Lohse, +41 44 333 73 14, alexander.lohse@credit-suisse.com
Thomas Rieder, +41 332 09 72, thomas.rieder@credit-suisse.com
Dr. Fabian Waltert, +41 44 333 25 57, fabian.waltert@credit-suisse.com

Contributor

Miriam Kappeler
Sinem Wiederkehr

2           Real Estate Monitor | Q3 2020
Editorial

            Dear readers

            Coronavirus continues to dominate the headlines, influencing both our lives and our work. The
            pandemic has led to the greatest economic collapse since the 1970s oil crisis, and to considerable
            uncertainty over developments going forward. For that reason, many economists are attempting to
            obtain more information on current developments through the use of high-frequency data. For the
            real estate market, however, such data is less relevant. Ultimately, whether lost rental income as a
            result of business closures or rent waivers amounts to two, three, or even five percent this year
            will have precious little impact on the valuation of a property. Much more decisive is the long-term
            picture, to which greater attention needs to be paid in the case of real estate due to its long life
            cycle. In particular, the low interest environment, which is now set to become even more pro-
            longed due to coronavirus, increases the significance of cash flows in a property’s later years. At
            very low discount rates, cash flows from the tenth year onward determine around four-fifths of a
            property's value.

            For investors, it is therefore much more important to know what structural changes will result from
            coronavirus over the longer term. This is even more true since very little is changing in the short
            term in the most important market of all – the housing market. Shrugging off the impact of
            COVID-19, property prices rose in the second quarter of 2020 too. In the rental apartment mar-
            ket, by contrast, it is only reasonable to anticipate lower demand. However, this will be more the
            result of reticent domestic demand rather than lower immigration: Despite temporary restrictions
            on entry into Switzerland and declining employment development, net immigration in 2020 is likely
            to be only marginally lower than last year: the reasons for that are visible in our highly detailed
            analysis of immigration on page 9.

            Construction activity in the rental apartment segment also appears to be little affected by corona-
            virus. Although we saw a number of building site closures and a sharp decline in construction ap-
            provals in the first quarter, the volume of building permits issued for rental apartments has since
            made up almost all of the lost ground. We are anticipating a continuation of existing trends, which
            continue to paint a picture of (overly) high construction activity in the rental apartment segment at
            the cost of owner-occupied housing construction (page 7). Thus, it is less astonishing that rental
            apartment vacancy rates have experienced an increase this year again. You can find our detailed
            analysis in this respect on page 5.

            By contrast, COVID-19 will leave visible scars on the office property market. This much is clear
            from the evident wariness of investors in respect of exposure to investment vehicles focusing on
            business premises. Presently, it is not just analysts, but also companies themselves that are very
            divided when it comes to how greatly the work from home trend will impact on demand for space
            in the future. Will we see a revolution or an evolution? Read our appraisal on page 15.

            In the event of coronavirus sticking around for longer, long-term changes are quite conceivable in
            the residential market too. Find out where this journey might lead by engaging with our thought
            experiment on page 13.

            On behalf of the authors, I hope you find our publication informative and inspiring.

            Fredy Hasenmaile
            Head of Real Estate Economics

                                                                          Real Estate Monitor | Q3 2020         3
Contents Housing market 5 The annual regards of the vacancy rate The apartment vacancy rate has risen again in 2020, reaching 1.72%. COVID-19 can be expected to further increase the imbalance in the rental apartment market. Housing market 7 Many new rental apartments in pipeline – despite COVID-19 Construction activity in the rental apartment segment remains high, despite the COVID-19 crisis and the resulting lower demand for apartments. By contrast, owner-occupied housing construction activity continues to decline due to the ongoing negative interest rate environment. Rental apartments 9 COVID-19 slows demand Thanks to high immigration in the first quarter and a decline in the number of people emigrating, net migration in Switzerland should decline only slightly in 2020, despite the coronavirus crisis. Nonetheless, the pandemic is likely to leave a tangible mark on demand for apartments. Housing market 13 What if… ... COVID-19 were to affect our working lives and leisure time for even longer? Let’s assume that the coronavirus restrictions remain with us for a further four to five years. On the basis of this hypothesis, we explore the structural consequences that such a scenario could entail for the Swiss housing market. Owner-occupied housing 14 Office property 15 Revolution or evolution? Home working initially offers the prospect of greater productivity, but the office is likely to be a better environment for innovation. Commercial real estate 16 Real estate investments 17 4 Real Estate Monitor | Q3 2020
Housing market
The annual regards of the
vacancy rate
The apartment vacancy rate has risen again in 2020, reaching 1.72%. COVID-19 can be
expected to further increase the imbalance in the rental apartment market.
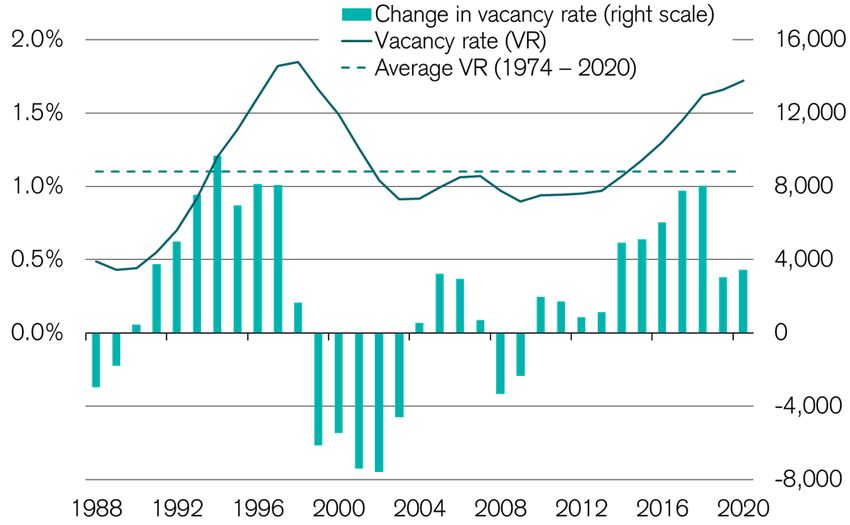
Apartment vacancy The number of vacant apartments in Switzerland as recorded by the Swiss Federal Statistical Of-
rate reaches a high fice (SFSO) has risen once again in the current year – for the 11th year in succession (Fig. 1). As
1.72% at June 1, 2020, 78,832 apartments lay vacant across Switzerland. This equates to an apartment
vacancy rate of 1.72% – a figure not exceeded since 1998. At 3,449, the increase in the number
of vacant apartments has been relatively modest this year when measured against the strong rises
recorded in the years 2014 to 2018, just as it was in 2019.
Coronavirus effects The coronavirus crisis, which should weaken demand for apartments noticeably, had not left much
have not yet unfurled of a mark on the market as per June 1. In the months leading up to the pandemic, the apartment
fully market was still enjoying a boost thanks to the healthy economic situation of the two previous
years. For example, net immigration between June 2019 and May 2020 worked out some 3.9%
higher than in the prior-year period. At the same time, analysis of building permits during this pe-
riod shows that an estimated 3,000 fewer apartments are likely to have been built than in the
prior-year period.
2020 reference date It is also possible that a number of technical survey-specific factors caused the rise in the number
not so of vacant apartments to be underestimated in some municipalities. In many cases, the marketing
representative? of apartments was either interrupted or deferred during the lockdown period. At the end of May
2020, the number of apartments advertised on online platforms was 15% lower than it had been
at the end of February. According to the definition applied by the SFSO, however, only unoccu-
pied apartments offered for rent or sale as per the reference date of June 1 were counted in the
vacancy statistics. The question that arises here is how municipalities have dealt with this unusual
data situation.
2.75% of all rental As in the previous year, the rise in the vacancy rate is wholly attributable to the rental apartment
apartments vacant segment. In total, 66,320 rental apartments stood vacant as per June 1, 2020, which equates to
a vacancy rate of 2.75% (Fig. 2). In recent years we have seen evidence of a structural oversup-
ply building up in parts of the rental apartment market, a situation that is being fueled by the
dearth of investments offering any real return (due to the negative interest environment). A combi-
nation of the quest for yield and the paucity of building land available has led some investors to
turn their attention to agglomeration communities outside of the main urban and rural regions, in-
cluding those where potential demand is limited. As a consequence, the number of vacant apart-
ments has more than doubled within the space of seven years.
Fig. 1: Highest apartment vacancy rate since 1998 Fig. 2: Vacancies primarily a rental apartment phenomenon
Apartment vacancy rate (LHS) and growth in vacant homes (RHS) Vacancy rate by segment, as % of respective housing stock
Rental apartments Condominiums
Single-family homes (for sale) Overall vacancy rate
3.0%
2.5%
2.0%
1.5%
1.0%
0.5%
0.0%
2003 2005 2007 2009 2011 2013 2015 2017 2019
Source: Swiss Federal Statistical Office, Credit Suisse Last data point: 01.06.2020 Source: Swiss Federal Statistical Office, Credit Suisse Last data point: 01.06.2020
Real Estate Monitor | Q3 2020 5Owner-occupied The situation in the owner-occupied housing segment could not be more different. A slight rise in
housing proves stable the number of vacant condominiums (0.55%) faces a simultaneous decline in the number of va-
cant single-family homes (0.61%); hence, the vacancy rate has remained stable overall at 0.58%
(Fig. 2). This stable development is explained by the fact that construction activity in this segment
has consistently been scaled back in recent years. At most, the coronavirus crisis can be expected
only to have prevented greater scarcity of supply.
Oversupply problem From a regional perspective, there is continuing evidence of four clusters with heightened vacancy
worsens in the south rates: northeastern Switzerland, northwestern Switzerland (particularly Aargau and Solothurn), and
and southwest the cantons of Valais and Ticino (Fig. 3). In a number of these regions, the vacancy rate has risen
to above 4%. One striking aspect is that it is above all the cantons of Vaud, Valais, and Ticino that
have been particularly affected by the recent rises. As a general trend, the vacancy rate rises have
been particularly pronounced in the south and west of the country in recent years. Whereas the
cantons of French-speaking and Italian-speaking Switzerland accounted for 26.6% of all vacan-
cies back in 2015, the equivalent figure as per June 1, 2020 stood at 33.0%. In the current year,
only 35 of Switzerland’s 110 economic regions recorded a decline in their vacancy rate. Many of
these regions are to be found in eastern Switzerland.
Supply remains Oversupply is still largely an alien phenomenon in the major urban centers. As per June 1, the va-
scarce in urban cancy rate for Switzerland’s five largest cities was virtually unchanged at 0.47% (remainder of
centers Switzerland: 1.91%). As a consequence, the gap in the Swiss housing market between city and
countryside continues to widen. The lowest vacancy rate of all continues to be reported by the City
of Zurich (0.15%), followed by Lausanne (0.48%), Bern (0.56%), Geneva (0.61%), and Basel
(0.95%).
No trend reversal in The pace at which vacancies are rising in the rental apartment market has slowed recently. None-
sight theless, we are not anticipating an improvement in the oversupply situation anytime soon. The
economic effects of the COVID-19 pandemic, which are only gradually becoming clear, are likely
to weigh on rental apartment demand in the coming year too (p. 9). At the same time, there is no
reason to anticipate a further decline in construction activity for the time being (p. 7). Accordingly,
the trend of rising apartment vacancy rates could even accelerate for a certain period of time. The
anticipated decline in immigration could periodically also bring some relief to the scarcity of supply
in the major urban centers. Only a significant economic recovery that also encompasses the labor
market can be expected to further slow the rise in the vacancy rate. As long as the key structural
driver of the oversupply situation – negative interest rates – remains in place, vacant apartment
numbers are likely to remain stubbornly high. The current recession and the absence of any real
inflationary pressure are both arguments against any rapid change in the direction of monetary
policy. As such, the eleventh annual rise in succession is unlikely to be the last.
Fig. 3: Strongest rise in vacancies in French-speaking Switzerland and Ticino
Vacancy rate as per June 1, 2020, arrow: year-on-year change
> 3.0%
2.5 – 3.0%
2.0 – 2.5%
1.5 – 2.0%
1.25 – 1.5%
1.0 – 1.25%
0.75 – 1.0%
< 0.75%
Sharp increase
Slight increase
Sideways movement
Slight decrease
Sharp decrease
Source: Swiss Federal Statistical Office, Credit Suisse, Geostat Last data point: 01.06.2020
6 Real Estate Monitor | Q3 2020Housing market
Many new rental apartments in
pipeline – despite COVID-19
Construction activity in the rental apartment segment remains high, despite the COVID-
19 crisis and the resulting lower demand for apartments. By contrast, owner-occupied
housing construction activity continues to decline due to the ongoing negative interest
rate environment.
Decline in planned As a direct consequence of the COVID-19 crisis and the lockdown, the number of both planning
construction activity applications and issued building permits declined sharply in March and April. As an additional fac-
exaggerated tor, the relevant authorities in the cantons of Geneva, Fribourg, Neuchâtel, Vaud, and Ticino
ceased publishing information on projected building activity at the peak of the pandemic. As a re-
sult, the decline in the volume of planning applications and building permits was initially heavily ex-
aggerated. All cantons are now once again supplying information on planned construction activity,
and the data for the whole of the second quarter allow for the repercussions of COVID-19 for res-
idential construction activity to be analyzed in greater detail.
Planned construction In the rental apartment market, COVID-19 has only had a short-term impact on construction per-
activity remains high mits. While there was a 21% decline across Switzerland as a whole in the first quarter of 2020 as
in rental apartment compared to the previous quarter, much of this decline was then reversed during the second quar-
segment ter, with a recorded rise of 15% (Fig. 4). Indeed, when looking at the moving average over four
quarters, the dip in the first quarter is almost invisible. What emerges instead is an increase in the
volume of building permits issued for rental apartments (+12%) since the second quarter of 2019.
Large-scale projects The resurgence in construction permits is also a consequence of the many large-scale projects
as driver applied for at the end of 2018 and throughout 2019, for which building permits have only recently
been issued. Overall, we are expecting the total supply of rental apartment stock to increase by
1.1% over the next 6 to 18 months. By way of comparison, the equivalent figure a year ago stood
at 1.0%. Aside from a number of slight delays on building sites back in spring, COVID-19 is
therefore likely to bear only little consequence for the expected growth of the apartment inventory.
Planning activity on By contrast, submitted planning applications declined again in the second quarter. This is mainly
the rise once again due to subdued activity in April, when applications for fewer than 1,600 rental apartments were
submitted. This equates to just 64% of the monthly average since the start of 2012. The number
of planning applications has risen back above this level since May, however (Fig. 5). In other
words, neither project developers nor investors are panicking about a pandemic-related demand
Fig. 4: Rise in building permit issuance in rental apartment segment Fig. 5: Rental apartment construction applications already back
above average
Number of approved residential units by segment, per quarter Building permits, in number of residential units per month; average 2012 – 2019
SFH: quarterly figures Rental ap.: quarterly figures SFH applications Rental ap. applications Cond. applications
Cond.: quarterly figures SFH: 4Q moving average SFH average Rental ap. average Cond. average
Rental ap.: 4Q moving average Cond.: 4Q moving average 4,500
8,000
4,000
7,000
3,500
6,000
3,000
5,000
2,500
4,000
2,000
3,000 1,500
2,000 1,000
1,000 500
0 0
2003 2005 2007 2009 2011 2013 2015 2017 2019 2012 2013 2014 2015 2016 2017 2018 2019 2020
Source: Baublatt, Credit Suisse Last data point: Q2/2020 Source: Baublatt, Credit Suisse Last data point: 07/2020
Real Estate Monitor | Q3 2020 7shock, as the negative interest environment should remain in place for some time. Given this
backdrop, rental apartment investments remain attractive from an investor’s perspective despite
the further increases in vacancy rates.
Focus of construction In 2021, the expected expansion in rental apartment supply is likely to be particularly pronounced
activity in Zurich, Zug, in the Zurich, Zug, and Lucerne regions (Fig. 6). Production is set to remain at a high level in
and Lucerne large parts of the cantons of Aargau, Solothurn, and Schaffhausen as well. Furthermore, the ex-
pected supply expansion in most of these regions is greater than it was a year ago. By contrast, in
French-speaking Switzerland – with the exception of the Lake Geneva hinterlands in the cantons
of Fribourg and Vaud, rental apartment construction activity is likely to be pronounced in only a
few regions. In the canton of Ticino, meanwhile, where there was evidence of significant oversup-
ply even before the onset of COVID-19, a large number of new rental apartments is planned
solely for the Bellinzona region. On the other hand, there are only a few new projects in the pipe-
line in many rural and Alpine regions.
Persistent decline in owner-occupied housing construction activity
Negative interest Contrary to the rental apartment market, it seems reasonable to expect a decline in construction
environment holds activity for condominiums and single-family homes (SFH) over the next one to two years. Indeed,
back construction of the moving four-quarter average for building permits has reached a new low (Fig. 4). Over the last
owner-occupied 12 months, only around 11,800 condominiums and 5,750 single-family homes were approved. In
housing other words, the anticipated expansion in the supply of owner-occupied housing is just 0.8% over
the coming 6 to 18 months. The latest figures for planning applications in this segment also do
not suggest a trend reversal (Fig. 5). As long as the negative interest environment persists and
demand for residential investment properties remains strong, construction activity in many regions
is more likely to focus on rental as opposed to owner-occupied apartments, as the former are eas-
ier for developers to build.
Owner-occupied Unlike the rental apartment market, the current level of activity in the ownership segment is too
housing: Demand low. For example, the number of approved residential units is now 46% lower than it was in 2008,
outstrips supply even though the parameters affecting demand for residential property remain hugely positive.
Mortgage interest rates are not far off historic lows, and the prolongation of the negative interest
rate environment is unlikely to see mortgage interest rates rise from their current lows any time
soon. Accordingly, the desire to purchase residential property remains strong. This is also clear
from the price growth evident in the residential property segment, which has so far been immune
to the repercussions of COVID-19 (page 14). The only restraining factor – both with regard to de-
mand and price growth – is the high bar set by the affordability restrictions that lenders have to im-
plement.
Fig. 6: Expected expansion of regional rental apartment stock
Expected expansion of rental apartment supply as percentage of existing stock
Expected expansion
> 1.2%
1.0% – 1.2%
0.8% – 1.0%
0.6% – 0.8%
0.4% – 0.6%
0.2% – 0.4%
< 0.2%
Change versus previous year
Strong rise
Slight rise
Sideways movement
Slight decline
Strong decline
Source: Baublatt, Credit Suisse, Geostat Last data point: 06/2020
8 Real Estate Monitor | Q3 2020Rental apartments
COVID-19 slows demand
Thanks to high immigration in the first quarter and a decline in the number of people
emigrating, net migration in Switzerland should decline only slightly in 2020, despite the
coronavirus crisis. Nonetheless, the pandemic is likely to leave a tangible mark on
demand for apartments.
Entry restrictions as Just like in other countries, COVID-19 led to far-reaching restrictions in public life in Switzerland.
part of coronavirus On March 16, 2020, the Federal Council declared an extraordinary situation as per the Epidemics
measures Act. As a consequence, not only were schools, shops, and restaurants temporarily closed, but
travel into Switzerland was also heavily restricted. Borders were partially closed from March 25 to
June 8, 2020. For their part, Switzerland’s neighboring countries likewise sealed themselves off
almost entirely.
High immigration at The coronavirus crisis exploded at a time when net immigration into Switzerland had started to rise
start of year... again after two years of stagnation (Fig. 7). Net immigration of the permanent foreign residential
population in the first quarter of 2020 was 30% up on the previous year's equivalent. The main
reasons for this increase are likely to have been robust employment growth over the two previous
years and the removal of the safeguard clause with respect to Romania and Bulgaria.
... followed by a However, the border entry restrictions then were clearly reflected in immigration figures in the sec-
slump during ond quarter (Fig. 8). During this period, 6,600 fewer moves to Switzerland were recorded than in
lockdown the previous year, equivalent to a decline of 22%. The fact that any immigration took place at all in
April and May 2020 is explained by the exemption rules: In particular, workers from the European
Union (EU) whose activity related to the supply of essential goods and services (e.g. healthcare,
food, IT infrastructure) retained their right of entry.
Emigration also down However, the pandemic-related imposition of restrictions to the cross-border movement of people
significantly did not just affect immigration into Switzerland. It is also true that much fewer people left Switzer-
land than usual. Finding a job abroad, looking for accommodation, and actually relocating were all
complicated by the pandemic, thwarting many a plan to emigrate abroad. As an additional factor,
short-time working and the social security net continued to offer a certain degree of security and
stability, for example in face of the threat of losing one’s job in Switzerland. Overall, the number of
foreign nationals turning their back on Switzerland in the second quarter of 2020 was 20% down
compared to the prior-year period (Fig. 8).
Fig. 7: Declining trend in immigration Fig. 8: COVID-19 slows both immigration and emigration
Net immigration: permanent residential population, including CH citizens, excluding Migration movements of permanent foreign residential population; 2020 change
register corrections (LHS) and employment growth (full-time equivalents) compared to same month in prior year
Net immigration (LHS) Immigration Emigration Net immigration excl.
100,000 Net immigration forecast (LHS) 5% (moving to CH) (leaving CH) register corrections
Employment growth (full-time equivalents) 2,000
80,000 4%
1,000
60,000 3%
0
40,000 2% -1,000
20,000 1% -2,000
0 0% -3,000
-20,000 -1% -4,000
2002 2004 2006 2008 2010 2012 2014 2016 2018 2020 Jan. Feb. March April May June July Aug.
Source: State Secretariat for Migration (SEM), Swiss Federal Statistical Office, Source: SEM, Credit Suisse
Credit Suisse
Last data point: 2019 Last data point: 08/2020
Real Estate Monitor | Q3 2020 9Halving of net Overall, net migration (excluding register corrections) declined by 25% in the second quarter of
immigration in Q2 2020 compared to the prior-year period. If transfers between the temporary and permanent resi-
dential population (“changes of status”) are excluded and only the actual migration movements
across the Swiss border are observed, the decline amounted to as much as 50%. This is despite
a countermovement already becoming apparent in June and net migration once again rising
(Fig. 8). Although entry restrictions were further loosened on July 6, with the entry of workers
from third countries also permitted from this point onward, the number of people moving to Swit-
zerland fell short of the prior-year level in the first two months of the third quarter too. At the same
time, numerous people who had intended to emigrate appear to have put their plans on hold for
the time being, either as a result of pandemic-related uncertainties or in view of the challenges
confronting the labor market in their intended country of residence.
Recession likely to In the wake of the phased lifting of restrictions on entry into Switzerland, the economy will once
slow immigration again become the key driver of immigration. Despite clear indications of recovery, it is likely that
further the pandemic will weigh on growth both in Europe and worldwide in the medium term. For Swit-
zerland, we are anticipating an overall decline in gross domestic product of 4.0% in 2020 (Fig. 9).
Thanks to the relatively benign development of the pandemic so far, combined with government
support measures in the form of short-time working compensation and loans to affected compa-
nies, the recession should prove less severe in Switzerland than in the Eurozone, where the econ-
omy is likely to shrink by 8.0% this year. However, Swiss demand for foreign labor can be ex-
pected to remain low for the time being, given that we are expecting a 0.5% decline in employ-
ment in 2020 (Fig. 9). In 2021 too, employment is likely to only barely recover (+0.3%), while un-
employment is likely to rise further to 3.9%, which would be the highest level for 15 years. The
slow recovery of the labor market should therefore impede any rapid resurgence in immigration.
Forecast for 2020: Overall, we are expecting net migration of the permanent residential population to amount to
net migration of around 50,000 in 2020 (previous year (prior year: 53,000, Fig. 7). There are three reasons why
+50,000 the decline will not be more accentuated, despite the coronavirus crisis: First, as explained above,
immigration was still extremely strong in the first quarter. Second, the pandemic led not only to a
decline in immigration, but also to a significant reduction in the number of people leaving Switzer-
land. The number of Swiss moving abroad is also likely to have declined sharply. Third, a propor-
tion of the effective decline in the number of immigrants only feeds through into the immigration
figures of the permanent foreign residential population with a certain time lag.
Slump in number of According to the definition applied by the State Secretariat for Migration, the non-permanent resi-
short-term dential population and persons seeking asylum do not form part of the permanent residential pop-
residents ... ulation – which means they are not included in the above forecast of net migration of 50,000 for
2020. The non-permanent residential population comprises persons who reside less than a year in
Switzerland and hold a short-term resident’s permit. For COVID-19-related reasons, the number
of short-term residents has declined even more dramatically than the permanent foreign residential
population. Overall, the former’s net migration balance over the last 12 months amounted to
10,700 (Fig. 10).
Fig. 9: Slump in economic output likely to be lower in Switzerland Fig. 10: Effective decline in immigration stronger than implied by
than elsewhere in Europe permanent residential population
Economy and labor market in Switzerland and Eurozone; 2020/2021: forecasts Overall picture of immigration in foreigner and asylum seekers area, 12-month totals
as per month of June
Eurozone GDP growth Swiss GDP growth Permanent foreign residential population
Eurozone unemployment rate Swiss unemployment rate Non-permanent foreign residential population
12% Asylum process net change
90,000 Total
9% 80,000
70,000
6% 60,000
3% 50,000
40,000
0% 30,000
20,000
-3%
10,000
-6% 0
-10,000
-9% -20,000
2002 2004 2006 2008 2010 2012 2014 2016 2018 2020 2010 2011 2012 2013 2014 2015 2016 2017 2018 2019 2020
Source: SECO, OECD, Credit Suisse Last data point: 2019 Source: SEM, Credit Suisse Last data point: 08/2020
10 Real Estate Monitor | Q3 2020However, a proportion of these immigrants (typically around a quarter) will end up staying in Swit-
zerland in the longer term, and will receive the corresponding resident’s permit after a certain pe-
riod of time. In other words, these immigrants undergo a change of status as they switch from the
non-permanent to the permanent residential population. The latest decline in the number of short-
term residents will therefore feed through into the numbers of the permanent residential popula-
tion after a delay of a few quarters.
... and in number of Furthermore, the statistics on foreigners in Switzerland only capture recognized refugees, but not
asylum seekers persons seeking asylum or temporarily admitted persons. The number of asylum seekers, which
had already been in decline since the European refugee crisis of 2015/2016, has reached a new
low as a result of the COVID-19 pandemic. Indeed, in the second quarter of 2020, the equivalent
figure was 60% below that of the prior-year period. Accordingly, the number of persons undergo-
ing the asylum-seeking process is also declining (Fig. 10). This decline can likewise be expected
to feed through negatively into immigration figures (foreigner statistics) with a few quarters’ delay.
Forecast for 2021: Some of the direct repercussions of the COVID-19 pandemic will therefore not become apparent
net migration of in the “official” immigration numbers until after a certain time lag. As an additional factor, even in
+45,000 the event of a favorable development of the pandemic, the labor market is likely to recover from
the crisis only very sluggishly. Accordingly, we are anticipating a further decline in net immigration
to a level of around 45,000 persons for 2021. This would bring net migration below the 50,000
mark for the first time since the introduction of the full freedom of movement for workers in 2007.
Decline in rental Although the decline in immigration is expected to be fairly modest this year, the rental market is
apartment demand of nonetheless likely to be confronted by a sharp decline in demand. We are expecting the market to
5,000 expected absorb around 20,000 apartments over the course of 2020 – 5,000 fewer than in the previous
year (Fig. 11). Demand can then be expected to recover slightly in 2021 (+500), although it
should still remain far below the level reported in 2019.
Demand from abroad The magnitude of the expected decline in demand is attributable on one hand to the decline in im-
is slowing... migration. Here, the sharp decline in the number of short-term residents and persons seeking
asylum should also have some effect. Although some of these people stay in company or asylum
accommodation, a number of them are also housed in normal rental apartments (rented directly by
the occupant or by companies or the local municipality). The immigration-related decline in de-
mand is therefore likely to be rather more pronounced in 2020 than the decline in net immigration
(from 53,000 to 50,000) would suggest.
... but so too is On the other hand, a large proportion of the expected slump in demand is explained by weaker
domestic demand domestic demand. Although the July survey of consumer confidence painted a clear picture of re-
covery compared to April, fears over job security appeared to be even more pronounced (Fig. 12).
The increased uncertainty can be expected to prompt young adults to postpone their flight from
the parental nest, and thereby temporarily reduce the number of new households being created.
Fig. 11: A heavy weight on demand for rental apartments Fig. 12: Collapse in perceived job security
Annual change in absorption of rental apartments and employment growth (full-time Index of consumer confidence and job security subcomponent
equivalents), 2019: estimate, 2020/2021: forecast
12,000 Employment growth (RHS) 4% Consumer confidence index Job security
Change in absorption, observed Average since 1972 Average since 1972
Change in absorption, modeled 20
9,000 3%
Forecast 0
6,000 2%
-20
3,000 1% -40
0 0% -60
-80
-3,000 -1%
-100
-6,000 -2%
-120
-9,000 -3% -140
2004 2006 2008 2010 2012 2014 2016 2018 2020 2005 2007 2009 2011 2013 2015 2017 2019
Source: Swiss Federal Statistical Office, Credit Suisse Last data point: 2019 Source: SECO, Credit Suisse Last data point: 07/2020
Real Estate Monitor | Q3 2020 11Tenants have the Outside of the main centers, the Swiss rental apartment market is set to remain a tenant market
upper hand for the next few years, with rising vacancy rates (p. 5) and declining offered rents. Flagging de-
mand is coming up against persistently high construction activity, which is set to increase even fur-
ther over the next year (p. 7). Relaxation, to some extent, is temporarily expected in the large ur-
ban conurbations as well, where the resurgence of immigration is likely to be most keenly felt.
Only labor market The development of rental apartment demand beyond 2021 will depend on the further develop-
recovery will bring ment of the pandemic and the nature of the economic recovery. In the event of very hesitant de-
about trend reversal velopment with a continued rise in unemployment, a stronger decline in immigration cannot be
ruled out. On the other hand, until labor markets elsewhere in Europe recover, the number of for-
eign workers in Switzerland returning to their home countries is also likely to be subdued, thereby
limiting the decline of net migration.
Immigrants replace Net immigration is also affected by the demography-related decline in employment activity. The
baby boomers approaching retirement wave on part of the high birth rate cohorts of the baby boomer generation
will leave a major gap in the labor market. At the end of the 2020s, a net total of up to 10,000
persons or more is likely to exit the labor market every year. These workers are at least partly likely
to be replaced by workers recruited abroad, thereby supporting immigration. In the event of eco-
nomic development in keeping with potential growth, we believe the most likely overall scenario for
the coming years is average net migration of just over 50,000 persons. Thus, rental apartment
demand can be expected to benefit greatly from immigration in the future too.
Home working as Still largely unanswered is the question of whether – and how – the coronavirus crisis might
long-term drag on change the rental apartment market in the longer term. Given our expectation that the trend to-
demand? ward home working will continue at least to some extent (p. 15), this factor could act as a nega-
tive influence on rental accommodation demand. Workers who now only have to be in the office
two or three times a week are less likely to tolerate the costs of a “pied-à-terre”, and the tempta-
tion to give that up will be considerable. Couples who have previously lived apart due to different
work locations could decide to move in together. And those who have long dreamed of owning
their own four walls, but have not been able to afford such a step due to commuting distances,
could be prompted to buy their own home in a rural area. Quite what influence such effects will
have can hardly be gauged from today’s standpoint, however.
12 Real Estate Monitor | Q3 2020Housing market
What if…
... COVID-19 were to affect our working lives and leisure time for even longer? Let’s
assume that the coronavirus restrictions remain with us for a further four to five years.
On the basis of this hypothesis, we explore the structural consequences that such a
scenario could entail for the Swiss housing market.
Coronavirus – the In our extreme scenario, repeated waves of the pandemic would assail Switzerland and other
extreme scenario countries with great frequency. Periods of relief would prove only temporary, coinciding with infec-
tion numbers falling back again. Due to the confused nature of the situation worldwide, travels
would be reduced to the minimum. By necessity, home working would establish itself as standard
working practice, and only a third of a company’s workforce would be operating at most – and on
a rotating basis – at a centrally located office.
Idyllic micro locations In such a scenario, attractive micro locations would become much more important when choosing
would gain in a place to live. The much more intensive use of the home would increase occupants’ need for nat-
importance ural light, tranquility, proximity to local recreational areas, views, and existing infrastructure. By
contrast, proximity to public transport connections – the most important factor over the last two
decades – would be just one criterion among many. Consequently, the gap in prices within munici-
palities would become one of the new factors driving demand.
Outside space and The trend toward smaller but more centrally located apartments has been evident for many years,
floorplan quality as but this preference would become less pronounced. Thanks to cost savings on commuting, on
key factors eating and drinking out, and on wardrobe requirements, extra funds would be available for more
spacious accommodation, particularly as prices are in any case lower on urban peripheries. Exter-
nal space such as that afforded by balconies, terraces, and gardens has always been important,
but would become an overriding priority in a world dominated by coronavirus. Apartments with no
suitable outside space would suffer significant price falls. Floorplan qualities would likewise acquire
greater significance, particularly the ability to seal off working areas. Also sought after would be
commonly used (external) areas in order to combat the deficit in social contact.
Peripheral and low- With the lapsing of the general requirement to be present in the office, time spent commuting
tax locations would would on average fall to between one and two days a week. As a result, criteria other than proxim-
benefit ity to work or to a train station would become decisive when choosing the ideal place to live. De-
mand for accommodation would rise particularly strongly in rural and low-tax municipalities and
cantons, due to the lower living costs and tax advantages. Whereas previously a longer commute
would deter workers from moving away from the predominantly high-tax central locations close to
their place of work, this disadvantage would now become much less obvious. By contrast, house-
holds on middle and low incomes or with a preference for urban living would increasingly consider
locations from where work could be easily reached by e-bike, conventional bike, or scooter so as
to avoid using public transport.
Run on owner- Residential property in peripheral locations would likewise become much more sought after, as its
occupied housing on poorer accessibility would no longer be perceived as such a problem. Despite the existing financial
the periphery hurdles, there would be an increased shift to owner-occupied housing, as residential property
prices for average households are still fairly affordable on the periphery, and persistently low mort-
gage interest rates offer considerable cost savings. For households that nonetheless prefer an ur-
ban environment, mid-sized centers would be a good compromise, and a way of escaping the high
prices of Switzerland’s major centers. With cars increasingly being preferred to public transport
due to the much lower risk of infection, residential locations on less congested routes would be
coveted. Second homes or “pieds-à-terre” in municipalities close to the office would lose their ap-
peal due to the flexibility offered by home working, whereas holiday homes could well become
more popular.
Price trends would As a consequence of the reduced pressure on major urban locations, the price gap between city
reflect new and country would narrow. Rents in the mid-sized centers would rise, and the price of owner-oc-
preferences cupied housing on the periphery in particular would surge.
Real Estate Monitor | Q3 2020 13Owner-occupied housing
Mortgage interest rates remain at very low levels Fig. 13: Mortgage interest rates for different terms
Interest rates for new mortgages in %
The Swiss National Bank is highly unlikely to increase its key 6% LIBOR mortgage (3M-LIBOR)
Fixed mortgage 5 years
interest rate before the end of 2021. The interest rates on Fixed mortgage 10 years
LIBOR and SARON mortgages are therefore likely to remain 5%
Fixed mortgage 15 years
at, or close to, their lows for the next 12 months. By con-
4%
trast, interest rates for fixed mortgages rose briefly as a di-
rect consequence of the coronavirus crisis, before then fall- 3%
ing back in the summer when the flight to liquidity subsided.
Due to the considerable economic uncertainty, the develop- 2%
ment of fixed mortgage rates has been volatile. As long as
1%
the economic recovery continues, we are expecting these
mortgage rates to trend slightly higher over the coming 12 0%
months. 2008 2009 2010 2011 2012 2013 2014 2015 2016 2017 2018 2019 2020
Source: Credit Suisse Last data point: 03.09.2020
Mortgage demand barely affected by COVID-19 Fig. 14: Growth in private household mortgage volumes
Nominal growth
7%
Demand for residential property was hit only briefly – for the Private households, nominal
Average for private households 1986 – 2019, nominal
period directly after the lockdown – by COVID-19. The mar- 6%
ket gradually recovered from mid-May onward. Accordingly,
growth in the volume of mortgages held by private house- 5%
holds declined only slightly between the end of 2019 and
4%
May 2020, namely from 2.75% to 2.6%. The decline was
halted in June, and growth has since picked up again slightly 3%
to 2.66%. Over the next few months, demand for residential
2%
property should gradually get back to its pre-crisis level.
However, the potential for a further growth spurt is likely to 1%
be very limited given the high equity and theoretical afforda-
bility requirements that continue to apply. 0%
2000 2002 2004 2006 2008 2010 2012 2014 2016 2018 2020
Source: Swiss National Bank, Credit Suisse Last data point: 06/2020
Residential property price growth still positive Fig. 15: Price growth for residential property of medium segment
Annual growth rates; dotted lines: average 2000 – 2019
Recent price development remains unaffected by the 10%
Annual growth, single-family homes
COVID-19 crisis. The latest price increases, which were Annual growth, condominiums
8%
more pronounced than expected, appear to have been
driven by a combination of a further decline in construction 6%
activity and very low mortgage interest rates. Indeed, the 4%
prices of single-family homes and condominiums recorded
2%
year-on-year rises of 3.3% and 1.9% respectively in the
second quarter. We are expecting the current price momen- 0%
tum to weaken as the year draws to a close due to the per- -2%
sistently difficult economic situation. That said, given the on- -4%
going scarcity of supply we are expecting property purchase
-6%
prices to rise over the year as a whole. 2011 2012 2013 2014 2015 2016 2017 2018 2019 2020
Source: Wüest Partner Last data point: Q2/2020
14 Real Estate Monitor | Q3 2020Office property
Revolution or evolution?
Home working initially offers the prospect of greater productivity, but the office is likely
to be a better environment for innovation.
Return to office Following the COVID-related requirement to work at home, employees in Switzerland are returning
proceeding only to their offices only slowly. At Credit Suisse, office staffing levels are still only 40% of the figures
sluggishly recorded at the start of the year. A similar picture is painted at other large companies by the num-
ber of transactions recorded in staff restaurants of two nationwide canteen service providers (Fig.
16).
Companies divided However, we are still in an exceptional situation. Key here are the long-term repercussions of this
on merits of home abrupt change: Many companies want to retain home working to a significant degree, in order to
working save on expensive office premises and improve employee quality of life. Prominent examples here
include Twitter, Facebook, Siemens, and Novartis. By contrast, companies such as Microsoft,
Stadler, and Ems have adopted a more or less hostile stance to the idea of permanent home
working, as they value personal collaboration at the office. Many other companies have yet to
make up their minds.
Initial productivity Key in the decision to encourage home working is productivity. Surveys show that productivity has
boost from working risen during the recent phase of home working. In a Deloitte survey of 1,500 Swiss in April 2020,
alone at home, ... 41% reported a rise in productivity from home working, while 31% reported no change and just
25% sensed a decline. This cannot be explained solely by leisure activity restrictions during lock-
down, as a study drawn up by Stanford Professor Nicholas Bloom in 2015 showed that productiv-
ity is boosted by 13% by home working due to an increase in desk time and fewer distractions.
... but human However, productivity increases as a result of innovations play a major role at many Swiss compa-
interaction in the nies. And this is where the drawbacks of home working become apparent. A number of studies,
office is better for such as one by T. D. Allen (2015), reveal that home working can lead to isolation and reduction in
innovation knowledge exchange.1 After all, ideas are frequently the product of spontaneous interaction be-
tween specialists from different company areas. It is no coincidence that the highest value creation
is to be found in regional clusters (e.g. Silicon Valley, Crypto Valley in Zug, Basel’s pharma clus-
ter). For that reason, companies such as IBM and Yahoo, which once introduced home working,
have abandoned this model due to its perceived limitations in respect of creativity and innovation.
Hybrid forms of Given the arguments both for and against home working, we believe hybrid forms of office and
home/office working home working will emerge. In our main scenario, we estimate the resulting long-term decline in
demand for office space (ceteris paribus) to be around 15% (Fig. 17). On the other hand, this de-
cline will be offset by other developments such as economic growth and tertiarization, which is
why we anticipate only a stagnation in demand for office space in the long term.
Fig. 16: Employees return to office only gradually Fig. 17: Home working likely to weigh on demand for office space
Building admittances at Credit Suisse and transactions at two major Swiss-wide can- Scenarios for long-term change in demand for office space (ceteris paribus) due to
teen service providers, indices (highest figure = 100) home working (10-year horizon)
100 0%
Credit Suisse building admittances
90
80 Transactions of Swiss canteen providers
70 -5%
60
50 -10%
40
30 -15%
20
10
0 -20%
06/01 - 12/01
20/01 - 26/01
03/02 - 09/02
17/02 - 23/02
02/03 - 08/03
16/03 - 22/03
30/03 - 05/04
13/04 - 19/04
27/04 - 03/05
11/05 - 17/05
25/05 - 31/05
08/06 - 14/06
22/06 - 28/06
06/07 - 12/07
20/07 - 26/07
03/08 - 09/08
17/08 - 23/08
-25%
-30%
Return scenario Main scenario Game changer scenario
Source: Two Swiss canteen service providers, CS Last data point: 30.08.2020 Source: Credit Suisse Last data point: 09/2020
1
See: Bloom (2015): «Does Working From Home Work?» and Allen (2015): «How Effective Is Telecommuting?»
Real Estate Monitor | Q3 2020 15Commercial real estate
COVID-19 leaves its mark on the labor market Fig. 18: Overall employment by business sector
Annual change in the number of employees (full-time equivalents), in %
Industry Construction Trading
Employment growth slid into negative territory in the second Transportation Hotels and catering IT/communication
quarter of 2020, namely -0.2% compared to the prior year. Financial services Business services Health/public services
As expected, hotels & catering (-0.5%) is the most badly af- Rest Total
fected sector due to limited tourism. However, the slump 3%
has been mitigated by the instrument of short-time working.
2%
By contrast, typical office sectors such as financial services
(+0.01%) were less affected by a decline in employment. 1%
On the other hand, there were redundancies in connection
0%
with temporary workers and business services, which is an
important sector for office space demand. The highest -1%
growth in employment was recorded in the healthcare/public
-2%
services area. 2005 2007 2009 2011 2013 2015 2017 2019
Source: Swiss Federal Statistical Office, Credit Suisse Last data point: Q2/2020
Building permits for offices likely to recede again in the medium Fig. 19: Planned expansion of office space
term
Building permits and planning applications, moving 12-month total, in CHF mn
After a comparatively low volume of building permits were is- New construction permits New construction applications
New construction permits, average
sued in 2019, a significant rise in both office planning appli- 4,000
cations and the corresponding approvals has been recorded 3,500
since the start of this year. The volume of planning applica- 3,000
tions submitted over the last 12 months is 23% higher than
2,500
for the prior-year period. This is the result of growing de-
mand for office space in recent years (prior to COVID-19). 2,000
In view of these current structural changes, such as a pro- 1,500
nounced shift toward home working and the corresponding 1,000
threat of lower demand for additional office space, planning
500
activity can be expected to fall back very soon.
0
1995 1997 1999 2001 2003 2005 2007 2009 2011 2013 2015 2017 2019
Source: Baublatt, Credit Suisse Last data point: 07/2020
Strong retail sales but with major discrepancies Fig. 20: Development of retail sales
Nominal growth of retail sales in year-on-year comparison*
15%
Over the first seven months of this year, retail sales provided 2016 2017 2018 2019 2020
10%
a positive surprise by rising 5.5% compared to the prior-year 5%
period. However, the lion’s share of this growth is attributa- 0%
ble to the online trading boom and not to bricks-and-mortar -5%
retailing, which is why retail premises are likely to remain un- -10%
-15%
der pressure. In particular, the food, home electronics, and -20%
Non-Food
garden/auto accessories areas recorded strong sales -25%
growth. As a result of the pandemic, more was also spent
Non-food
Personal care and
Total
Food/near-food
Household and lifestyle
DIY/gardening/car
Apparel and shoes
Leisure
Consumer electronics
accessories
healthcare
on hygiene and healthcare products. By contrast, demand
declined above all for apparel/shoes, household products,
and immovable items (e.g. furniture).
*Seasonally and number-of-sales-days adjusted, 2016–2019: Jan.–Dec.; 2020:
Jan.–Jul.
Source: GfK, Credit Suisse Last data point: 31.07.2020
16 Real Estate Monitor | Q3 2020Real estate investments
Neither financial nor coronavirus crisis capable of halting cycle Fig. 21: Investment property transaction price index
Residential and mixed-use investment properties (index: Q1/1989 = 100)
Real GDP YoY change (RHS)
The prices of investment properties have been rising for IAZI investment property price index, nominal
140 8%
more than 15 years. Indeed, direct investments came IAZI investment property price index, real
through the financial crisis of 2008 and the franc shock of
120 4%
2015 almost unscathed, as they benefited from the persis-
tent trend of declining interest rates. However, the real price
100 0%
level is still below that recorded just prior to the real estate
crisis in the 1990s, which almost led to a halving of real
80 -4%
prices. The coronavirus crisis is unlikely to trigger any cor- Corona Crisis
rection of this kind, as there is no expectation of either sig- 2020
60 -8%
nificant rises in interest rates or a wave of selling. That said,
the capital growth return, which has amounted to 3.8% 1990's Real
Estate Crisis
Dotcom Bubble
2000
Financial Crisis
2008
Swiss Franc
Shock 2015
40 -12%
(nominal) on average over the last 10 years, is likely to be 1989 1992 1995 1998 2001 2004 2007 2010 2013 2016 2019
lower initially for commercial properties.
Historical performance data and financial market scenarios are no reliable indicators
of future results.
Source: IAZI, SECO, FSO, Credit Suisse Last data point: Q2/2020
Swiss real estate shares relatively resilient Fig. 22: Total performance of indirect real estate investments
Indices: 01.01.2015 = 100, in local currency
Listed Swiss real estate funds have recovered from the pan- 220 Performance
2020 (YTD)
demic-induced slump, and are now exhibiting a slightly posi- 200
tive overall return of 1.7% since the start of the year. By 180
contrast, the overall return of listed Swiss real estate shares -10.5%
160
still lies deep in negative territory (-10.5%). Only a strong -0.2%
start to the year prevented a greater loss. At a global level, 140
+1.7%
real estate shares have declined by 10.4% over the year to 120 -10.4%
date. Investments shunned by investors include the shares 100
-25.7%
of office REITs (-25.7%), hotel REITs (-38.1%), and retail 80
REITs (-40.1%). By contrast, REITs specializing in manufac- SXI Real Estate Funds SXI Real Estate Shares
-40.1%
60 Swiss Performance Index MSCI World Real Estate
turing and logistics premises have in some cases benefited MSCI World: Office REIT MSCI World: Retail REIT
40
from the crisis (+19.9%). 01/2015 01/2016 01/2017 01/2018 01/2019 01/2020
Historical performance data and financial market scenarios are no reliable indicators
of future results.
Source: Datastream, Credit Suisse Last data point: 02.10.2020
Real estate funds have largely recovered from the slump Fig. 23: Performance of Swiss real estate investments in the coro-
navirus era
Magnitude of correction and recovery (overall performance of listed investments)
Listed Swiss real estate securities likewise did not escape 19.02.-17.03.2020 (correction phase) 17.03.-02.10.2020 (recovery phase)
the financial market turbulence at the start of the corona- 19.02.-02.10.2020 (total period)
virus crisis – at times, they recorded negative overall perfor- All real estate funds
mance of up to -20% before the recovery took hold. Inves-
tors continue to view commercial real estate funds and real Residential funds
estate investment companies with skepticism. By contrast,
the prices of real estate funds that focus on residential prop- Commercial funds
erty have recovered. Overall, real estate funds are once
again exhibiting a high average premium of 31.9%. On the Real estate equities
other hand, this masks considerable performance discrepan-
SPI
cies: Whereas some funds are trading premiums of up to
50%, others – such as vehicles that primarily focus on com- -25% -15% -5% 5% 15% 25%
mercial premises – are actually trading at a discount.
Historical performance data and financial market scenarios are no reliable indicators
of future results.
Source: Datastream, Credit Suisse Last data point: 02.10.2020
Real Estate Monitor | Q3 2020 17Important Information generally involve a significant degree of financial and/or business risk. Invest-
ments in PEfunds are not principal-protected nor guaranteed. Investors will be
required to meet capital calls of investments over an extended period of time.
This report represents the views of the Investment Strategy Department of CS Failure to do so may traditionally result in the forfeiture of a portion or the
and has not been prepared in accordance with the legal requirements de- entirety of the capital account, forego any future income or gains on invest-
signed to promote the independence of investment research. It is not a prod- ments made prior to such default and among other things, lose any rights to
uct of the Credit Suisse Research Department even if it references published participate in future investments or forced to sell their investments at a very
research recommendations. CS has policies in place to manage conflicts of low price, much lower than secondary market valuations. Companies or funds
interest including policies relating to dealing ahead of the dissemination of may be highly leveraged and therefore may be more sensitive to adverse busi-
investment research. These policies do not apply to the views of Investment ness and/or financial developments or economic factors. Such investments
Strategists contained in this report. may face intense competition, changing business or economic conditions or
other developments that may adversely affect their performance.
Risk Warning Interest rate and credit risks
The retention of value of a bond is dependent on the creditworthiness of the
Every investment involves risk, especially with regard to fluctuations in value Issuer and/or Guarantor (as applicable), which may change over the term of
and return. If an investment is denominated in a currency other than your base the bond. In the event of default by the Issuer and/or Guarantor of the bond,
currency, changes in the rate of exchange may have an adverse effect on the bond or any income derived from it is not guaranteed and you may get
value, price or income. back none of, or less than, what was originally invested.
This document may include information on investments that involve special
risks. You should seek the advice of your independent financial advisor prior
Investment Strategy Department
to taking any investment decisions based on this document or for any neces-
sary explanation of its contents. Further information is also available in the Investment Strategists are responsible for multi-asset class strategy formation
information brochure “Risks Involved in Trading Financial Instruments” availa- and subsequent implementation in CS’s discretionary and advisory busi-
ble from the Swiss Bankers Association. nesses. If shown, Model Portfolios are provided for illustrative purposes only.
Your asset allocation, portfolio weightings and performance may look signifi-
Past performance is not an indicator of future performance. Perfor- cantly different based on your particular circumstances and risk tolerance.
mance can be affected by commissions, fees or other charges as well Opinions and views of Investment Strategists may be different from those ex-
as exchange rate fluctuations. pressed by other Departments at CS. Investment Strategist views may change
at any time without notice and with no obligation to update. CS is under no
Financial market risks obligation to ensure that such updates are brought to your attention.
Historical returns and financial market scenarios are no reliable indicators of
future performance. The price and value of investments mentioned and any From time to time, Investment Strategists may reference previously published
income that might accrue could fall or rise or fluctuate. You should consult Research articles, including recommendations and rating changes collated in
with such advisor(s) as you consider necessary to assist you in making these the form of lists. The recommendations contained herein are extracts and/or
determinations. references to previously published recommendations by Credit Suisse Re-
search. For equities, this relates to the respective Company Note or Company
Investments may have no public market or only a restricted secondary market. Summary of the issuer. Recommendations for bonds can be found within the
Where a secondary market exists, it is not possible to predict the price at respective Research Alert (bonds) publication or Institutional Research
which investments will trade in the market or whether such market will be liquid Flash/Alert – Credit Update Switzerland. These items are available on request
or illiquid. or from https://investment.credit-suisse.com. Disclosures are available from
www.credit-suisse.com/disclosure.
Emerging markets
Where this document relates to emerging markets, you should be aware that
there are uncertainties and risks associated with investments and transactions
Global disclaimer/Important Information
in various types of investments of, or related or linked to, issuers and obligors
The information provided herein constitutes marketing material; it is not invest-
incorporated, based or principally engaged in business in emerging markets
ment research.
countries. Investments related to emerging markets countries may be consid-
ered speculative, and their prices will be much more volatile than those in the
This document is not directed to, or intended for distribution to or use by, any
more developed countries of the world. Investments in emerging markets in-
person or entity who is a citizen or resident of or located in any locality, state,
vestments should be made only by sophisticated investors or experienced pro-
country or other jurisdiction where such distribution, publication, availability or use
fessionals who have independent knowledge of the relevant markets, are able
would be contrary to law or regulation or which would subject CS to any regis-
to consider and weigh the various risks presented by such investments, and
tration or licensing requirement within such jurisdiction.
have the financial resources necessary to bear the substantial risk of loss of
investment in such investments. It is your responsibility to manage the risks
References in this document to CS include Credit Suisse AG, the Swiss bank,
which arise as a result of investing in emerging markets investments and the
its subsidiaries and affiliates. For more information on our structure, please use
allocation of assets in your portfolio. You should seek advice from your own
the following link: http://www.credit-suisse.com
advisers with regard to the various risks and factors to be considered when
investing in an emerging markets investment.
NO DISTRIBUTION, SOLICITATION, OR ADVICE: This document is provided
for information and illustrative purposes and is intended for your use only. It is
Alternative investments
not a solicitation, offer or recommendation to buy or sell any security or other
Hedge funds are not subject to the numerous investor protection regulations
financial instrument. Any information including facts, opinions or quotations, may
that apply to regulated authorized collective investments and hedge fund man-
be condensed or summarized and is expressed as of the date of writing. The
agers are largely unregulated. Hedge funds are not limited to any particular
information contained in this document has been provided as a general market
investment discipline or trading strategy, and seek to profit in all kinds of mar-
commentary only and does not constitute any form of regulated investment re-
kets by using leverage, derivatives, and complex speculative investment strat-
search financial advice, legal, tax or other regulated service. It does not take into
egies that may increase the risk of investment loss.
account the financial objectives, situation or needs of any persons, which are
necessary considerations before making any investment decision. You should
Commodity transactions carry a high degree of risk, including the loss of the
seek the advice of your independent financial advisor prior to taking any invest-
entire investment, and may not be suitable for many private investors. The
ment decisions based on this document or for any necessary explanation of its
performance of such investments depends on unpredictable factors such as
contents. This document is intended only to provide observations and views of
natural catastrophes, climate influences, hauling capacities, political unrest,
CS at the date of writing, regardless of the date on which you receive or access
seasonal fluctuations and strong influences of rolling-forward, particularly in
the information. Observations and views contained in this document may be dif-
futures and indices.
ferent from those expressed by other Departments at CS and may change at
any time without notice and with no obligation to update. CS is under no obliga-
Investors in real estate are exposed to liquidity, foreign currency and other
tion to ensure that such updates are brought to your attention. FORECASTS &
risks, including cyclical risk, rental and local market risk as well as environ-
ESTIMATES: Past performance should not be taken as an indication or guar-
mental risk, and changes to the legal situation.
antee of future performance, and no representation or warranty, express or im-
plied, is made regarding future performance. To the extent that this document
Private Equity
contains statements about future performance, such statements are forward
Private Equity (hereafter “PE”) means private equity capital investment in com-
looking and subject to a number of risks and uncertainties. Unless indicated to
panies that are not traded publicly (i.e. are not listed on a stock exchange),
the contrary, all figures are unaudited. All valuations mentioned herein are subject
they are complex, usually illiquid and long-lasting. Investments in a PE fund
18 Real Estate Monitor | Q3 2020You can also read