Sustainable Urban Adaptation and Resilience - Recreate
←
→
Page content transcription
If your browser does not render page correctly, please read the page content below
D4.6 Evidence-Based
           Narratives
Sustainable Urban Adaptation and Resilience
                                            April 2018

Document Title:                  D4.6 Evidence-Based Narratives: Sustainable Urban Adaptation
                                 and Resilience
Reference:                       Deliverable report
Nature:                          R
Dissemination level:             PU
Version:                         Final
Status:
Date:                            April 23, 2018
Author(s):                       Linda Krummenauer, Jürgen Kropp
Changes:                         2nd version after draft presentation in June 2017
Reason for change:
Authorised:

                  This project has received funding from the
                  European Union’s Seventh Framework Programme
                  for research, technological development and demonstration under grant agreement No. 603860.
Revision history
Version   Date        Modified by      Comments
          23.4.18     L. Krummenauer
                      and J.P. Kropp

                                                  Page 2 of 33
General Information

Authors

Linda Krummenauer
Jürgen P. Kropp

WP Partners

1.   DTU
2.   PIK
3.   Tecnalia
4.   TNO
5.   VTT
6.   Wuppertal Institute

Contact

WP lead

Susanne Fischer
susanne.fischer@wupperinst.org

Wuppertal Institute for Climate, Environment and Energy
Döppersberg 19
42103 Wuppertal
Germany

                                                          Page 3 of 33
About this Document
           B ACKGROUND INFORMATION

RECREATE (Research network for forward looking activities and assessment of research and innovation
prospects in the fields of climate, resource efficiency and raw materials) is a coordination and support
action supported by the European Union’s Seventh Framework Programme under grant agreement
No. 603860.

Referring to the Impact Assessment Work Package of the RECREATE project, DG Research and Innovation
has asked for the development of evidence-based narratives for funding and policy activities in the Horizon
2020 societal challenge 5-area with respect to the following DG flagship objectives:
   I. Positioning Europe as the continent that realizes a circular economy through a systemic approach to
      Eco-Innovation
  II. Making Europe a world leader in nature-based solutions, which use renewable natural resources
      and / or ecosystems to address societal challenges, yielding economic, social and environmental
      benefits.
 III. Creating a market for climate information services that enables economic actors to seize climate
      opportunities, governments to take climate-smart mitigation and adaptation decisions and citizens
      to optimise quality of life in the face of climate change.

In this respect, evidence-based narratives (EBNs) serve the purpose of assessing potential benefits of
investment into innovation. The main focus is on those innovations that—once scaled up—offer
favourable effects on the European socio-economic and environmental systems.

The document at hands is a part of a new series of six new evidence-based narratives (EBNs). All of them
are related to the topic of sustainable cities. The present document contains one EBN:
     1. Risk Appraisal Toolbox Based on Climate and Weather Data for Urban Areas

 Evidence-based narrative                                                                  Document page

     2.   Risk Appraisal Toolbox Based on Climate and Weather Data for Urban Areas         10

                                                                                         Page 4 of 33
T HE N ARRATIVE B LUEPRINT
In order to ensure easy reading and comparability between the narratives, a blueprint has been developed
and used for the construction and refinement of each of the narratives. It is to a large part comparable
with the blueprint used for the first narrative versions, however contains slight changes that may help the
reader grasp narrative findings easier. According to this blueprint, the structure of each of the narratives
comprises the following parts:
1. Each Narrative starts with an overview of authors and changes that have been implemented due
to the European Commission requests of how to refine the first versions of narratives. Moreover it
is shown how the narrative is linked with the innovation subsystems of the RECREATE Scoreboard.
2. The first part, “The Narrative”, is a one-pager overview of the narrative and summarizes the most
relevant findings. It assists the reader in capturing logic and content of the following parts.
3. The part on “Understanding the Innovation System” establishes an understanding of the current
state of the analysed innovation. It explains the actual object of innovation and describes how its
current market diffusion looks like.
4. Within the “Estimation of the Investment Case” the amount of effects that can be expected when
the considered innovation is up scaled to the European level is described. This comprises an
outlook on possible investments and investment types needed in order to push the innovation’s
diffusion. Furthermore qualitative assessments and indicators considered in that estimation
include future market sizes, effects on employment and environmental and social benefits.
5. The part of the “Innovation System Functioning” is based on an analysis of seven different
functions of the respective innovation system. In doing so, the transition management analysis
tool of a technology innovation system framework is used, (see below). The fulfilment of the
innovation’s functions is represented in a spider graph, which is amended by a summarizing
discussion of drivers and barriers of the innovation system.
6. The part on “Further Evidence on the Innovation System” is an optional one. It includes findings
considered relevant by the narrative authors, however, referring to comparability of the cases,
could not be easily integrated into other narrative parts.
7. Based on the innovation system function analysis being done beforehand, the part about
“Policy Recommendations” depicts a couple of possible actions, DG Research and Innovation
could implement in order to push the further diffusion of the innovation.
Page 5 of 33T HE M ETHODOLOGICAL F RAMEWORK
The methodology is inspired by the technology innovation system (TIS) framework (Hekkert et al., 2007)1,
which is based on the central idea that the analysis of the targeted dynamic innovation diffusion should
focus on systematically mapping the activities that usually take place in innovation systems and finally
resulting in the innovation diffusion. Those activities are considered to be functions of innovation systems.
As the name implies, the TIS framework concentrates on technological change. The analysed cases
comprise as well technological innovations but also non-technological innovations. Since non-technological
innovation is related to larger innovation systems, which also include technologies, we have used the TIS
framework as a methodological approach for the analyses of all cases both technological and non-
technological.
According to Hekkert et al. an innovation system analysis is based on seven functions:
1. “Entrepreneurial Activities” maps the level of concrete actions taken by new entrants or
incumbent companies generating and taking advantage of new business opportunities. Possible
indicators may comprise the number of new entrants, diversification activities of incumbent
actors.
2. “Knowledge Development” maps the system’s ability to learn, either by searching (research) or by
doing (development). Possible indicators may comprise the number of R&D projects, patents or
technology learning curves.
3. “Knowledge Diffusion through networks” maps the flow of information exchange within
knowledge networks. Possible indicators may comprise number of workshops and conferences
devoted to the specific innovation and other network activities.
4. “Guidance of the Search” maps the selection from the results of the knowledge developing
activities. Since financial resources are limited, strategic decisions by industry and government set
foci guiding future investments and influencing the direction of change. Possible indicators may
comprise targets set by industry or government and number of journal articles related to the
specific innovation.
5. “Market Formation” maps the competition process with the embedded solution the innovation
aims to replace or to change. Possible indicators may comprise the number of introduced niche
markets, specific tax regimes and new environmental standards.
6. “Resource Mobilization” maps the financial and human capital resources that are needed for all
the activities within the innovation system. A possible indicator may comprise funds made
available for long-term R&D programs.
7. “Creation of Legitimacy” maps the process of how the specific innovation becomes part of an
incumbent regime or even overthrows it. This process is guided by advocacy coalitions, parties
with vested interests in the “creative destruction”. A possible indicator may comprise the rise and
growth of interest groups and their lobby actions.
1
Hekkert, M.P., Suurs, R.A.A., Negro, S.O., Kuhlmann, S., and Smits, R.E.H.M. (2007). Functions of innovation systems: A new
approach for analysing technological change. Technological Forecasting and Social Change 74, 413–432.
Page 6 of 33Table of Content
Research Programming of the Sustainable City .................................................................................. 9
1 Risk Appraisal Toolbox Based on Climate and Weather Data for Urban Areas .......................................... 10
1.1 The Narrative ........................................................................................................................................ 11
1.2 Understanding the Innovation System .............................................................................................. 12
1.3 Estimation of the Investment Case .................................................................................................... 23
1.4 Innovation System Functioning ........................................................................................................ 26
1.5 Policy Implications ............................................................................................................................. 30
References ................................................................................................................................................... 32Evidence-Based Narratives: Sustainable Urban Adaptation and Resilience
List of Figures
Figure 1: The RECREATE topical areas that are tangential to the here studied Risk Appraisal Toolboxes ...... 10
Figure 2: The modular structure of Risk Appraisal Toolboxes and the segments attached to each module. 18
Figure 3: Business Canvas regarding RATs climate services. ............................................................................ 20
Figure 4: Distribution of climate change adaptation and mitigation plans across European cities, their
respective national strategies. Pictograms indicate the location of cities surveyed and the existence of an
urban mitigation plan or a mitigation and adaptation plan, if any (there was no city with an adaptation plan,
only) (Reckien u. a., 2015b). ................................................................................................................................. 22
Figure 5: Approximately 7400 communities within the EU area that have between 5000 and 100 000
inhabitants (as of 2000) and could be possible customers of RATs. ................................................................24
Figure 6: Fulfilment of Innovation System Functions: Risk Appraisal Toolboxes (RATs) ............................... 30
Page 8 of 33Evidence-Based Narratives: Sustainable Urban Adaptation and Resilience Research Programming of the Sustainable City Research Programming of the Sustainable City Page 9 of 33
Evidence-Based Narratives: Sustainable Urban Adaptation and Resilience

1 Risk Appraisal Toolbox Based on
Climate and Weather Data for Urban
Areas
Author(s):
Linda Krummenauer (PIK)
Jürgen P. Kropp (PIK)

Links with other RECREATE work

Figure 1: The RECREATE topical areas that are tangential to the here studied Risk Appraisal Toolboxes

The Risk Appraisal Toolboxes on damage appraisal at the city-scale are strongly linked and even embedded
within the WP 5 Factor Deep Dive on the Factor “sustainable cities”. Risk Appraisal Toolboxes contribute to
the sustainability aspect in cities in a way that they help to precisely adapt communities and sectors to
unavoidable climate change and offer mitigation options for more ambitious climate protection. As several
recent conferences and workshops have shown that an extensive demand exists for urban adaptation.2
Stakeholder clearly requested more and concise knowledge of risk and methods to estimate expected
future losses and damages as well as response options to avoid these support the purposeful use of
financial resources towards a sustainable future of cities.

2
    To mention a few:
        •   Requirement and conditions for Regional Climate Information, German Climate Service Center, Hamburg, 6. July 2016
        •   Innovating Cities Hearing - Cities as Actors, European Commission Brussels, 28.6.2018
        •   IPCC Cities Conference, Edmonton, Canada, citiesipcc.org, 4.3.-8.3.18

1 Risk Appraisal Toolboxes Based on Climate and Weather Data for Urban Areas                               Page 10 of 33
Evidence-Based Narratives: Sustainable Urban Adaptation and Resilience 1.1 The Narrative Crucial information on climate, natural hazards and other societal challenges related to climate- and weather-related extremes are considered a necessity within the European Commission (DG R&I, 2015; European Commission, 2015, 2016, 2017b). This information contributes to making our communities, our European societies and economies climate-proof, an issue particularly addressed by Societal Challenge 5 of the H2020 program and efforts related to Climate Action. Such information will also be beneficial for the European Disaster Risk Reduction (DRR) strategy, as it will strengthen risk prevention, enhance overall preparedness and contribute to the ability to respond immediately. The DRR is increasingly being included in key EU policy areas, such as the Climate Change Adaptation policies (European Commission, 2017a, 2018). High levels of eco-innovation, of a technological, economic, organizational and societal nature are required for an enhanced ability to adapt to climate change and become more resilient (European Commission, 2017b). The latter has received much more attention in recent years. Recent projects have been shown that European climate protection targets would be easily achievable, if only 5% of European citizens would be active in so-called Community Based Initiatives (cf. TESS Project – Towards European Societal Sustainability, FP7 Grant Agreement No. 603705, http://www.tess-transition.eu/). However, apart from individuals local stakeholders as environment experts and planners, particularly cities, are relevant multipliers of knowledge, but in terms of climate and its impacts rarely fully informed. Responses from Stakeholders: One interviewee even stated that city governments often are reluctant to search for efficient solutions to assess risks. A lack of interest in the most optimal and most efficient damage aversion mechanisms at city level but also at a higher administrative level was mentioned. The cost factor as a barrier for small cities to engage in risk appraisal was confirmed by another interviewee. In addition these actors increasingly need to respond to demands from civil societies, but particularly in small and medium-sized cities and villages they are often not prepared. This gap is addressed by the "Risk Appraisal Toolbox innovation", short “RATs”, which consists of 4 components: i) early warning, ii) climate stress test for communities, iii) rapid risk appraisal, and iv) consultancy for adaptation planning. Villages and cities have similar needs to cope with climate and weather related risk, but often do not have skills and/or capacities to i) perform risk assessments, ii) take action to prepare against concrete risk, and iii) ask different institutions for sector specific inputs and hints. RATs therefore are a concept consisting of modules and different steps of detail addressing exactly the needs of villages and cities. That this is a market which needs further innovation is shown by the fact that certain competitors are already active in this branch, but mainly addressing large cities and with a reduced portfolio (cf. box below: Business Example). This innovation relates to the RECRATE Scoreboard via the “Climate Adaptation” innovation system. Relatively high public R&D spending in some European countries in the environment sector within the indicator “Resource Mobilization” is beneficial to the implementation of RATs in Europe because a scientific background is still needed to provide information to RATs. Additionally, high numbers of publications on adaptation in the section “Knowledge Development and Diffusion” serves as indicator for a large knowledge base on scientific output in this field which is needed to establish and maintain RATs. The “Environmental concern” aspect in the “Legitimation of Technologies” section shows that some European countries are very much environmentally aware and in these countries such a climate service innovation as the RATs are likely going to be relatively easily accepted among society. This innovation also relates to the innovation system “Water and Waste Water” since fresh water resources are also threatened by climate change and RATs might also help to conserve or even preserve them. The evaluation of market opportunities, particularly the one, dealing with cities' information needs in the 1 Risk Appraisal Toolboxes Based on Climate and Weather Data for Urban Areas Page 11 of 33
Evidence-Based Narratives: Sustainable Urban Adaptation and Resilience

fields of extremes and associated damage and adaptation costs is based on an evidence-based and case-
based reasoning approach (Aamodt & Plaza, 1994; Wang, Yang, & Xu, 2006). Several city stakeholders and
experts have been interviewed in terms of their most important requirements and substantiate it with
adequate evidence:

      1.   A qualitative discourse analysis on the 2016 European flood events for the purpose of this study
           has revealed that people in small and medium-sized cities dealing with weather and climate-
           related hazards have deficits. A lack of reliable and local climate information, a lack of local risk
           appraisal as well as often timely lagged or disrupted dissemination of warnings has been identifies
           as their major problem.

      2.   In interviews it was claimed that an assessment of the economic valuing of expected damages and
           necessary adaptation measure overstretches the communities’ capacities. Nevertheless, economic
           numbers are very important for policy and decision making.

      3.   Evidence obtained from stakeholders from England, the Netherlands and Germany has shown that
           stakeholders are not aware of the temporal scales regarding adaptation, i.e. how future climate
           change may shape adaptation opportunities, e.g. via the creation of reverse effect. Neither data
           provision service portals, nor guidance and consultancy portals address these problems.

      4.   Stakeholders also not desire one solution, but a portfolio of solutions which are ranked in terms of
           potential (economic) trade-offs and benefits. The latter is mandatory for local stakeholder to
           estimate potential economic growth and job creation as a consequence of implemented
           adaptation measures.

Summing up there is a missing link between the provision of information and the capability of the users to
handle and interpret this information adequately. In order to address the needs of small- and medium sized
communities that do not have the capacity to establish an own climate change adaptation department
within their city administration and protect in parallel administrative flexibility and financial resources the
innovation is composed as a selective toolbox, with certain risk appraisal components, i.e. the user decides
what he likes to know and only will pay for this what he got. While in terms of early warning capabilities the
RATs will cooperate with weather services, two components are new. First a “Rapid Risk Appraisal” is
offered which is a kind of “stripped-down” version of the second offer, but which simply addresses the
risk assessment and identifies the most urgent need. This is provided as the basis of a standardized risk
appraisal algorithm and highly automatized. Thus, this product is scalable and less cost-intensive for the
customer. Second, the so-called “Climate Stress Test” will provide a more detailed and location specific risk
and vulnerability analysis which allows for tangible services in interpretation support and guidance towards
adaptation planning, i.e. makes suggestions for interventions. Even this approach is based on standardized
risk, damage, and cost models. The third component will be a detailed consultancy, the “Adaptation
Navigator”, which guides communities through concrete action and its implementation. Overall RATs can
be easily made happen, as accelerating digitalization and big data will provide more information than ever
before. To make use of the hidden information it needs experts and specialist which cooperate with city
stakeholders.

1.2        Understanding the Innovation System
The Innovation
To understand the innovation system, a breakdown of the innovative process is required and an analysis of

1 Risk Appraisal Toolboxes Based on Climate and Weather Data for Urban Areas                 Page 12 of 33
Evidence-Based Narratives: Sustainable Urban Adaptation and Resilience
each component to understand where the competitive advantages lie. In particular this needs to be done
for the problem identification, the idea generation, advocacy and screening, experimentation, and
commercialization phase. By doing so for the underlying RATs example the following key-issues could be
identified:
The problem
As of 2016, the majority, namely 75% of Europe’s total population, lives in urban areas (The World Bank,
2017). Globally, for approximately 750 mln new urban residents new infrastructure need to be built per
decade until 2050 (in comparison 440 mln residents per decade between 1950 and 2015 (own calculations).
Most of this infrastructure will be provided by small and medium sized cities. Consequently, a foresighted
climate and risks resilient planning would have tremendous economic effects for this new infrastructure.
However, as mentioned above also existing cities suffer from deficits in environmental planning in a
twofold manner (Reckien, Flacke, Olazabal, & Heidrich, 2015b): Firstly, they have to deal with slowly by
slowly developing changes which needs a planning which goes beyond actual planning horizons. Secondly,
many cities are still lacking a climate change adaptation strategy, even though in many European counties
a national adaptation strategy exists. These national adaptation strategies do not include explicit plans or
measures for the city-level. While large and prosperous cities do address climate change in own climate
change plans, it is mostly the small- or medium-sized cities and those at high risk that are still without a
climate change strategy. (Reckien, Flacke, Olazabal, & Heidrich, 2015a)
A Business Example:
While the world of climate services is quite diverse, only a few players in the market provide support in
particular for small and medium sized cities. The global acting management consultancy McKinsey &
Company is active in this field as well. It is globally acting with more than 100 offices worldwide and
their main clients are from the industry sector. Activities in the policy advice and cities sectors are
increasing. Their self-defined ambitions "[...] (to) help [...] clients (to) make significant and lasting
improvements to their performance and realize their most important goals3". Their provided service
covers solutions, and expertise about most of industry practices and business functions. Thus, climate
change and associated services are not in their core business, but if, then the company is originally
rooted in particular field of carbon reduction for industry and in production cycles, carbon markets and
green growth, they have now discovered the issue of sustainable cities as well. McKinsey "work with
mayors, urban planners, foundations, non-profits, utilities, and businesses to help create sustainable
cities” (Medri, Banos de Guisasola, & Gualdi, 2012). This includes, sustainability measures which may
deliver multiple benefits (in transport logistics, for example, increase traffic speeds and reduce
greenhouse gas emissions)4. Their city-related work is quite diverse and topic-specific, e.g. cities' cyber
resilience, energy efficiency of buildings, efficient infrastructure. Cities as centers of wealth and
economic activities have a prominent role in McKinsey's business model, but (except carbon reduction
challenges) climate change adaptation is not brought forward as an overarching topic. If the global
discussion will accelerate it can be expected that this might change. However, overall the company
provides consultancy services for particular cities (third step of the value chain, cf. below).
Deficits:
Although this appreciated in terms of climate services a systematic and affordable assessment of
climate risks (data and derived impact information on small scales as requested by several interview
partners (cf. text)) and potential solutions informing about trade-offs and synergies of concrete action
and for smaller cities is lacking. The European Union particularly highlights that “climate services have
the potential to become the intelligence behind the transition to a climate-resilient and low carbon
society”. For the European Union, the development of such a market requires sustained research and
innovation, and calls for a demonstration of the benefits that climate services can generate through an
engagement of stakeholders (Brasseur & Gallardo 2016). Although M. Friedman argues that "business is
business" and climate change do play a role in their companies only in so far to limit the potential
3
https://www.mckinsey.com/about-us/overview
4
https://www.mckinsey.com/business-functions/sustainability-and-resource-productivity/how-we-help-clients/sustainable-cities
1 Risk Appraisal Toolboxes Based on Climate and Weather Data for Urban Areas Page 13 of 33Evidence-Based Narratives: Sustainable Urban Adaptation and Resilience
disruptive effects of climate change for their business, this development opens the road toward a
changed thinking, even in companies (Brasseur & Gallardo 2016). For cities it is different as they are
public entities, i.e. they have to deal with general interests and they are therefore demander for such
services (cf. market discussions below).
Staff and revenues:
McKinsey employs a broad range of consultancy experts. Globally they have approx 14,000 (2016)
employees and who create a revenue of approx 8.8bn US$ (2016). In comparison to 2008 (revenues
approx. 6bn US$, employees 17,000) their performance have considerably improved. As McKinsey is
moving toward more environmentally relevant topics it can be assumed that the market is still large for
climate related services.
While in terms of early warning systems (e.g. fire risk, heat burden) a lot of mechanism are properly
working this does not hold for several other consequences of global warming. In particular this holds for:
• Heavy rain • Severe wind gusts
• Fluvial and pluvial flooding • Coastal flooding
• Avalanches • Tornados
• Heat waves and cold spells • Droughts
• Snow and hail storms
The lack of information on climate- and weather-related risks, projections and forecasts was fatal in this
case. Certainly, besides flooding, there is a broad range of climate- and weather-related hazards that have
the potential to impact European communities already today and even more severely and more frequently
in the future.
Responses for stakeholders:
Many officials even on state level were “surprised” of the intensity of the extreme precipitation event
that resulted in severe flooding. Many city administrations experience the current sources for
information on climate change still as scattered, inaccessible, too complicated, too expensive, and too
data-oriented as well as not oriented towards day-to-day decision-making at the city scale.
The actual problem for city stakeholders is further supported by a qualitative discourse analysis of
statements made by experts on weather and climate-related hazards and/or meteorology. The core topics
of this discourse analysis are categorized and presented below:
Every actor has to contribute to avoiding damage and fatalities. Principal actors in the case of climate- and
weather-related hazards are meteorologists, local authorities and administrations as well as the media
(ZEIT Online, 2016). In case of the 2016 flooding, the media, in charge of disseminating the warning through
their channels in case of disaster (Kachelmann, 2016, Gasteiger, Simon, & Weiß, 2016), failed to do its share.
The German TV program ARD had issued a very general warning for thunderstorms (Bojanowski, 2016a).
The dissemination of warnings via the media is crucial because in case of disaster, internet connections
might be lost and warning apps for smartphones might not be working any longer and an analogous
system via sirens was de-built (Bojanowski, 2016b; Kachelmann, 2016).
Problems in communication flow. Not only the population was surprised by heavy precipitation and
flooding, but also Bavaria’s Minister of the Interior was surprised how quickly the gauges of the local rivers
can rise (Bojanowski, 2016a; Breeden & Johannsen, 2016). This hints at a general disruption of information
flows from actors concerned with data analysis and forecasting to the local authorities and via the media
to the population (Bojanowski, 2016b). Regional branches of the public TV should have reacted quickly and
changed their programme in order to warn the population (Bojanowski, 2016a). ARD admits that there
should be new concepts how to warn population better with more short-notice warnings (Bojanowski,
1 Risk Appraisal Toolboxes Based on Climate and Weather Data for Urban Areas Page 14 of 33Evidence-Based Narratives: Sustainable Urban Adaptation and Resilience 2016a). There is also evidence for a communication problem overlapping even with the legal framework, consequently hampering the information of the public: The German Weather Service’s weather warning application for smartphones and desktop use was prohibited to be offered free of charge by court order of the Landgericht Bonn (Aktenzeichen 16 O 21/16). This was the result of a company offering similar commercialized versions of weather warnings claiming to be competitively disadvantaged (DWD, 2017). Authorities failed and misjudgement of the situation. Failure can also be ascribed to the local or state authorities in charge of flood and flood risk management for not having issued warnings and information timely enough (Gasteiger u. a., 2016). The information flow from meteorology service to those responsible at the local level in case of disaster is too long and needs to be optimized (Bojanowski, 2016b). A competent assessment between measurement and population in order to avoid false alarm leading to de sensitization of population is lacking (Bojanowski, 2016b; Gasteiger u. a., 2016). Moreover, the situation by the flood authorities was misjudged: For Rottal-Inn in Bavaria, experts had issued a warning only of level 1, which is relatively harmless (Bojanowski, 2016c). Uncertainty in forecasting and risk appraisal. Warnings are not local and not specific enough, the resolution of information is too rough (Bojanowski, 2015). Warnings obtained from apps are not specific enough. In Germany, this is due to the forecast spots for warning apps being 28 km distant from each other (Bojanowski, 2016b; Gasteiger u. a., 2016). Moreover, the temporal scale is a crucial matter: Only short-notice forecasts are possible, usually only about one to three hours to a few minutes in advance, the extent and exact location of storms can be identified (Bojanowski, 2016a; ZEIT Online, 2016). It is challenging to predict heavy precipitation, storms are easier (Bojanowski, 2015). However, there is lots of uncertainty and other factors that cannot really be accounted for (Bojanowski, 2016c). Generally, forecast and prediction for open vast land is easier than for mountainous regions (Bojanowski, 2015). To predict flooding, usually only gauges at larger rivers are taken into account. A new system is being tested by scientists, that also includes gauges of small rivers (Bojanowski, 2016a). The Idea Generation Consequently, for a concise risk appraisal at community-level, a very fine resolution and spatially comprehensive data is required, experience in loss and damage modelling as well as the development of new downscaling methods for a local risk and damage assessments is needed. And this is required for very diverse sectors and regions. Up to now only scientific institutions are in a position to fulfil such a portfolio, i.e. to provide standardised and comparable analyses. However, this is not their duty, as technologies are repeatedly applied. Responses from stakeholders: Potential clients, involved in work at municipalities, provinces, consultancies, development institutions, spatial planning businesses and water boards from England, the Netherlands and Germany revealed what is demanded of climate and adaptation services. What is needed is exactly the local consultancy comprising risk appraisal strategies coupled with adaptation guidance to increase resilience. There is a need for tertiary climate information, i.e. simple climate services are not sufficient. City officials and other stakeholders want to identify their vulnerabilities to climate change and how to prepare. The survey shows that the use of primary climate data is limited for these stakeholders because they lack the knowledge of how to interpret this information and how to translate it into action. An all-encompassing and very much innovative strategy to appraise risk from such extreme phenomena must be developed to help these cities cope with climate change. Moreover, for those cities which are not well-informed yet, it should provide strong support in terms of awareness rising and solution provision. Thus, the risk analysis should be preventive and precautionary instead of in the aftermath of an extreme event. The developed innovation therefore clearly takes into account the scattered expertise in climate 1 Risk Appraisal Toolboxes Based on Climate and Weather Data for Urban Areas Page 15 of 33
Evidence-Based Narratives: Sustainable Urban Adaptation and Resilience

impact research, but is able to integrate it in a modular way under the rooftop of RATs:

What are Risk Appraisal Toolboxes (RATs)
Risk Appraisal Toolboxes (RATs) provide highly flexible services and assessments in terms of different
climate- and weather-related risks and adaptation. RATs are based on a modular system, which is required
to allow for flexibility, overcome the conventional fragmentation of services and to act on a very local
level. The modular structure of RATs allows responding to the very specific customer needs. This leaves the
option for customers to complement their own competences, e.g. by having conducted own analysis in any
of the modules covered by RATs, or by engaging other consultancies, which can complement results
provided by RATs, with any of the services offered within the modular system. RATs act as an umbrella
comprising service modules that might be under the responsibility of completely different actors such as
(1) Data analysis, (2) Knowledge of risk, (3) Monitoring, (4) Warning, (5) Response, and (6) Loss evaluation,
which are key elements of risk appraisal strategies (ISDR, 2006).
Moreover, the toolbox contains three service tools (to be distinguished by the red, the blue-shaded and
the blue areas in Figure 2) that can be selected according to the customers’ needs and budget. The
“Adaptation Navigator” (cf. blue area Figure2) and the “Climate Stress Test” (cf. blue shaded area Figure 2)
are the more comprehensive and tailor-made services including interpretation of results and adaptation
guidance, whereas the “Rapid Risk Assessment” (cf. red area Figure 2) gives basic guidance about risk
appraisal for cities in an automatized way and provides the means for own capacity building through
connecting cities.

        Early Warning Services
        This service aims at the timely provision of early warnings. It is integrated into the RATs but carried
        out externally in cooperation with national/transnational weather services (see Figure 2, purple
        area) and downscaled to small spatial scales. It is desired to keep a handling time of 2 hrs minimum
        in case of a concrete threat.

        The “Rapid Risk Appraisal”
        The RATSs service provides a “Rapid Risk Appraisal”, which is a standardized risk and vulnerability
        analysis for user selected modules. It is less location-specific and does not require too much
        detailed data input. This service is limited to an introductory guidance process that helps to raise
        awareness with the city administration and eventually make use of this information themselves.
        Therefore, the Rapid Risk Assessment refers only to the basic modules as presented in the red
        area in Figure 2 but does not include the adjacent segments. This service is portal-driven and
        characterized by highly automatized processes: the outflow of scientific data from the research
        base and the updated runs of risk and damage models, as well as the output generation. This
        means that detailed interpretation support and adaptation guidance are not included, but can still
        be upgraded to a full Climate Stress Test (cf. Figure 2) if desired. Customers will receive (based on
        subscription fees) updates twice a year. Customers are informed about most recent changes in
        risk and vulnerability for their subscribed modules. This service also includes a “climate network”,
        a platform for cities to connect, which is an effective support mechanism in terms of mitigation
        and adaptation foster the exchange of city officials in these issues (Reckien, Flacke, Olazabal, &
        Heidrich, 2015b).

        The “Climate Stress Test”
        This service tool offers a tailor-made, detailed and location-specific full risk and vulnerability
        analysis at the city-scale. As the service is modular and highly automatized the service is scalable
        and keeps costs as low as possible while offering best service quality. An interpretation of the
        results and guidance towards establishing an adaptation strategy is provided. However, policy
        implications are not given. The objective of the Climate Stress Test is to cover the full risk
        assessment chain if needed, as covered by the blue-shaded area in Figure 2: data analysis to risk

1 Risk Appraisal Toolboxes Based on Climate and Weather Data for Urban Areas               Page 16 of 33
Evidence-Based Narratives: Sustainable Urban Adaptation and Resilience
and vulnerability assessments for today and the future, via monitoring, warning and response
support to a detailed loss evaluation. Both, modules as well as the segments they contain may be
purchased just according to the customer needs and may be complementary to possibly already
existing information or assessments. It is possible to choose from the following modules and
segments as shown in Figure 2.
(1) Projections and forecast services for the local level are the key to the data analysis. (2) The
module on knowledge of risk comprises local assessments of risk and vulnerabilities as well as the
projection of risk and vulnerability in the future. (3) The monitoring module aims at constantly
updating data, linkages, knowledge and processes on climate change and other relevant data e.g.
demography, insurance values. This module requires the active participation of stakeholders by
providing their data (e.g. insurance data, asset values, demographic data etc.) that cannot be
obtained other than by the stakeholder themselves. (4) The warning module majorly comprises
the dissemination strategy in case of a sudden upcoming hazard and also the awareness-raising
aspect. (5) The module aiming at hazard response contains an adaptation strategy and action plan
for entire communities but also for all sorts of economic sectors. (6) The damage (direct costs)
and loss (indirect costs) evaluation (over a certain time span, not of singular events) for
communities and offers evaluation tools for insurances. This enables the counterbalancing with
potential investments, which may lead towards a higher acceptance amongst decision-makers.
The Adaptation Navigator (Consultancy Service)
The forth component is the most encompassing but also time demanding (cf. Figure 2). Possibly it
is also the costliest component, as it provides a solution for concrete adaptation action in a
supervision of its implementation. City planners will – in dependence of the requirements of the
city – implement solution option for climate related adaptation measures. The consultancy service
will estimate trade-offs and benefits, e.g. in terms of job creation or economic costs.
RATs could possibly be realized by or as spin-offs from research institutions having experience and
expertise in the field of climate change risk appraisal, loss and damage evaluation and adaptation
strategies, which was also confirmed by our expert on this field. Further, insurances or re-insurances could
offer such risk appraisal services. Many insurances, re-insurances and consultancy companies (cf. business
example above), maintain departments on risk evaluation already today. Yet the service rarely covers the
full range of services provided by RATs. An extension of their portfolio would profit from selling risk
appraisal to the communities and save financial resources when it comes to recovery services and
insurance sums. Another option would be to associate RATs with start-up businesses around smart
innovation.
1 Risk Appraisal Toolboxes Based on Climate and Weather Data for Urban Areas Page 17 of 33Evidence-Based Narratives: Sustainable Urban Adaptation and Resilience Figure 2: The modular structure of Risk Appraisal Toolboxes and the segments attached to each module. Whom do RATs aim at? In principal, RATs aim at small and medium sized municipalities and/or administrative units therein, e.g. fire brigades, water services, etc., that until now are experiencing barriers in their uptake of climate services. Compared to larger cities which have own administrative units to address climate services within the city (which does not necessarily mean they are functioning well) small and medium sized municipalities often lack the financial resources to establish such a unit. RATs make climate services better accessible and affordable for even these small and medium sized municipalities and assist them in translating the information into concrete implementation actions. RATs offer services that are highly attuned to user needs and at the same time do not require high investment or commitment to large-scale consultancy agreements which again speeds up the procurement processes. The modules will facilitate communication between policy makers, technical staff, citizens and local engineering bureaus that is necessary in the implementation process. Furthermore, more profound assessment is enabled partly based on local information, physical and socio-economic city structure, on present and future climate, on climate change impacts, and, as far as is available, also information on exposure and sensitivity to such impacts, on coping capacity, and on exemplary adaptation and cost. Business model The choice of a suitable RATs tool at different cost schemes is perfectly responding to the customers’ needs and budget. It is especially the communal level customers, who think in the long run and in terms of what will pay off in the end. Responses from Stakeholders: 1 Risk Appraisal Toolboxes Based on Climate and Weather Data for Urban Areas Page 18 of 33
Evidence-Based Narratives: Sustainable Urban Adaptation and Resilience

Customers will likely be willing to pay for “tailor made” solutions.

 The flexible structure of RATs allows the customer to bridge their knowledge gaps in terms of climate
change information services between already existing segments, but also not yet established ones. The
option to 'mix and match' the different services according to their specific needs is complemented with
seamless integration of available information and know-how on: process guidance methodologies,
communication methods, best practices, peer cities with similar characteristics, climate, direct and indirect
impacts, socio-economic vulnerability, adaptation options, and their cost-benefit assessments and
prioritisation, implemented examples, risk assessments. The cost for the full risk appraisal, the Stress Test,
can be realized at a product price of 15 000.00 Euros, while costs for a consultancy and monitoring of
concrete climate stress related adaptation measures will be a matter of negotiations and depend on
duration and extend. The costs for a Rapid Risk Appraisal are estimated at approximately 10.000 Euro per
city.

   Responses from Stakeholders:
   One of our interviewees mentioned the option of introducing a graduated pricing policy linked e.g. to
   the community’s number of inhabitants, city size, or location, e.g. in a high risk or low risk area.

It allows local level practitioners to circumvent a lengthy 'learning by error' process by providing a focused
service, based on best-practice experiences EU-wide and integrating state-of-the art tools available in the
market. The modular approach of the service product proposed will furthermore allow the deployment of
the climate services by local governments at their own pace in line with their progression along the
adaptation policy planning and development cycle. The modules will be based upon the current internal
capacity within the city and know-how gaps that are impeding the progress of implementation of a risk
appraisal strategy.

The innovative business idea is briefly summarized regarding various business indicators in the canvas
presented in Figure 3.

1 Risk Appraisal Toolboxes Based on Climate and Weather Data for Urban Areas               Page 19 of 33
Evidence-Based Narratives: Sustainable Urban Adaptation and Resilience

Figure 3: Business Canvas regarding RATs climate services.

   Responses from Stakeholders:
   Stakeholder interviews made clear that services which go clearly beyond traditional services are highly
   appreciated and would fit much more to their needs.

RATs could be transformed into a business in three possible ways: (1) as spin-offs from research
institutions. This is advantageous because due to the proximity to research institutions that already have
expertise in climate change risk appraisal, the evaluation of loss and damage as well as in adaptation
strategies, spin-offs would always have access to most recent methodologies and scientific support. (2)
Some insurances and re-insurances already have their own risk appraisal departments established. Instead
of only consulting the insurance company as such, they could sell such service and even reduce payments
in an insurance case. Knowledge and expertise would already be existent. (3) The start-up scene could
possibly engage in establishing RATs services. In this case, experts would have to be recruited but the
advantage is that venture capital could be made available more easily.

Added value to the end-users
The added-value nature of the proposed innovation lies in the expert analysis of risk, estimation of future
risk and the interpretation of climate data and its impacts. This kind of provision for tailor made
consultancy, new and smart instruments for coping with risks, e.g. for the insurance sector, and
information in user-friendly compacts formats fitted to the local level adaptation practitioners needs for
their decision-making processes. It does so by uniting impact, vulnerability and measure knowledge.
Furthermore, the adaptation process assistance is directly targeted at helping cities translating the data

1 Risk Appraisal Toolboxes Based on Climate and Weather Data for Urban Areas             Page 20 of 33
Evidence-Based Narratives: Sustainable Urban Adaptation and Resilience

and information in concrete adaptation policy and implementation actions. Alternatively, the climate
network provides capacity building options as an added value. This is beneficial to those cities with a rather
small budget due to a high level of automatization and average licence fees.

Current Market
The current market for climate services is not yet considered mature. RATs tries to solve problems with
climate services as they are often too specific, have a too broad context and do not allow for a rapid
assessment. RATs clearly close gaps between existing services and user needs. Several user workshops
have shown that a simple data delivery and/or data interpretation often overstretches the resources of
actors in small and medium sized cities. In addition it was mention again and again that climate data and
vulnerability maps do not explain what city stakeholders really need. As of today, climate services primarily
comprise firstly data and information on climate change science, such as projections from models and
scenarios and observations of historic data and secondly, products based upon those scientific data and
results. This information is not yet satisfactorily integrated with information from other areas or sectors,
moreover local, regional or sector-specific data is lacking (UKCIP, 2015). Frankly speaking proposals for
solutions are wanted and these should be related to actual or upcoming climate and weather related risk in
the respective cities. The RATs approach is therefore a newly developed idea, taking up market surveys
and the responses from stakeholder interviews. That this market exists is also shown by running projects
(cf. OASIS framework).

   Project dealing with modular Loss Modeling and Climate Services.
   The Loss Modelling Framework OASIS, supported by the EU Project “H2020_Insurance” is currently
   making efforts to solve this (OASIS Loss Modelling Framework Ltd, 2017). It aims at combining climate
   services with damage and loss information and providing a standardized risk assessment process. This
   risk assessment may be utilized to assess potential losses, areas most at risk and quantify financial
   losses of modelled scenarios (European Commission, 2017c). Finally, the integration of all sectors into
   the models and services developed is the objective, just as to operationalize an open eMarket place and
   “matchmaking facility” for climate data, models, tools and services, where evidence-based risk
   assessment and adaptation planning for the stakeholder communities are transparently and
   comparably on display (European Commission, 2017c). The global insurance sector is a co-design
   partner of the OASIS Framework as they are major key players in provision of loss and damage
   evaluations as well as in recovery from extreme events. However, this is still in the making and still
   rather on project-level than a product or service on the market. But still, efforts are just pointing in the
   direction as proposed here and therefore provide evidence for the need and the objective to realize a
   climate information service stylized according to the here proposed RATs.

Concerning economic indicators on the current market, the information is sparse. According to the
Environmental Business International Inc., (2014), that is taking into account a so-called entire Climate
Change Adaptation market or a Climate Change Industry, for which the worldwide estimate for 2012 is
about 2 billion US dollars. This value is broken down into several market segments, of which “Climate
Change Adaptation Services” seems to be the most relevant for the purpose of this case study. Within this
market segment, the value for the worldwide “Risk Assessment and Analysis” market for 2012 is 273 Mio
US dollars (208 Mio Euro) and for “Climate Change Adaptation Planning”, the 2012 estimate is 235 Mio US
dollars (179 Mio Euro). The global adaptation industry as such was valued 1.7 billion US dollars (1.3 Mio
Euro) in 2012, and the growth of the same year was calculated 14%. It can be assumed that this market has
been growing ever since 2012. Future projections expect the global Climate Change Adaptation industry to
reach 6 billion US dollars (4.6 Mio Euro) to 7 billion US dollars (5.3 Mio Euro) by 2020 (Environmental
Business International Inc., 2014). According to The Government of the United Kingdom, (n.d.) the
estimate for a global market for commercial weather and climate services is 26.6 billion pounds sterling

1 Risk Appraisal Toolboxes Based on Climate and Weather Data for Urban Areas               Page 21 of 33
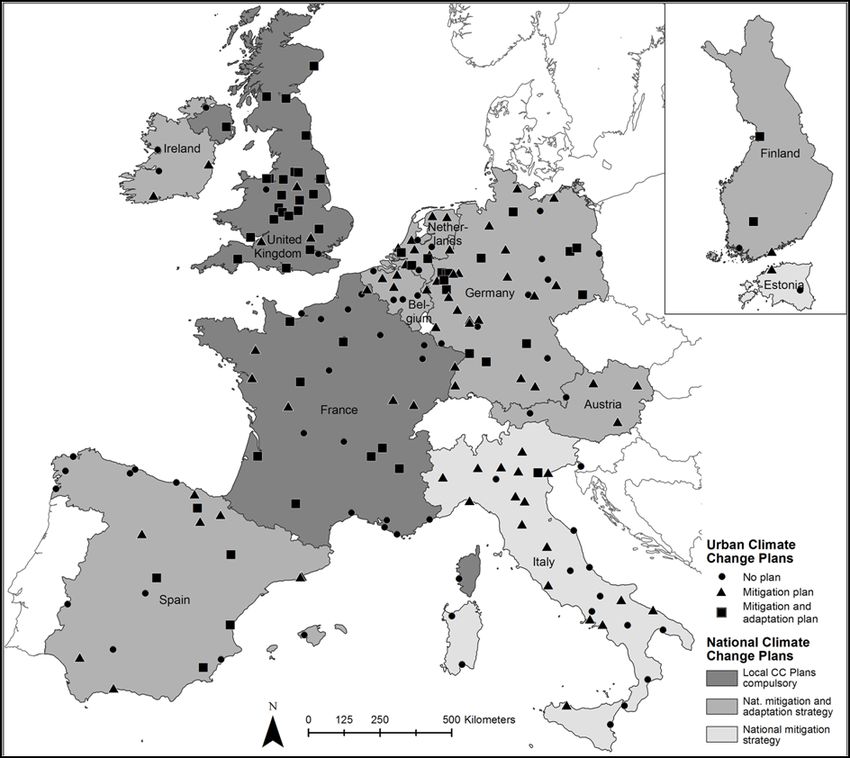
Evidence-Based Narratives: Sustainable Urban Adaptation and Resilience

(31.3 billion Euro as of 2010) for 2010/2011 of which 12.3 billion pounds sterling (14.5 billion Euros (2010) or
46%) account only for climate services. By 2015, the overall market for commercial weather and climate
services is projected to be 35.5 billion pounds sterling (42 billion Euros as of 2010). Historical data shows
consistent strong market growth and published forecasts project that this will continue. Significant sectors
responsible for a major share of transactions within this climate service market as shown by this study are
Legal and Financial Services (2.8 billion pounds sterling (3.3 billion Euro), 10% of transactions), Renewable
Energy (2.4 billion pounds sterling (2.4 billion Euro), 9% of transactions) as well as News and Publishing (1.2
billion pounds sterling (1.4 billion Euro), 5% of transactions) (The Government of the United Kingdom, o. J.).
Certainly, sectors, including water, energy, food, natural resources and infrastructure development, are
important potential users.

According to Brooks, (2013) a gap, called “Valley of Death”, can be identified between a new idea related
to climate services, or a dataset on the “research side” and the derived products in the market. This gap is
usually attributed to a lack of structure or institutional, financial, or skilled resources. The example of
OASIS shows that the European Union has taken responsibility here and provides funds as stimuli and in
order to foster the leakage of new ideas into the market. Whilst common climate services have seen little
market diffusion in recent decades, it can be expected that this may change for RATs. In particular a
regional embedding would accelerate adaptation planning and will ensure a better visibility and
accessibility of services for cities.

This concept will be beneficial to the 35% of European large and medium-sized cities that are still lacking a
climate change mitigation plan and 72% have not yet developed an adaptation plan (Reckien u. a., 2015b).
Small- and medium-sized cities and at those with high vulnerability towards climate change having lots of
potential to become future customers of RATs, as it is predominantly the large and economically
prosperous cities that have already started to engage in mitigation and adaptation planning (Reckien u. a.,
2015b).

Figure 4: Distribution of climate change adaptation and mitigation plans across European cities, their
respective national strategies. Pictograms indicate the location of cities surveyed and the existence of an
urban mitigation plan or a mitigation and adaptation plan, if any (there was no city with an adaptation
plan, only) (Reckien u. a., 2015b).

1 Risk Appraisal Toolboxes Based on Climate and Weather Data for Urban Areas                Page 22 of 33
Evidence-Based Narratives: Sustainable Urban Adaptation and Resilience

The sum of the numbers stated above only give a slight hint at what market volume a RAT would have. This
does not mean that any of the modules need to be in one hand. To some extend insurance companies are
entering into this gap already, as they have a strong interest in advanced risk appraisal methodologies. For
successful business ideas, spin-offs of these branches are working together with scientific institutions at
the forefront of development of risk appraisal methodologies. Moreover bodies like the Association of
Cities could be part of such an undertaking. To summarize, the proposed business model would also call for
cooperation between partners having complementing expertise. This enables to create further synergies.

1.3          Estimation of the Investment Case
Investment Strategy
Investments into new business idea need to be taken wisely to drive growth and stay ahead of potential
marketplace disruption. Recent scientific results clearly show that investments into adaptation can avoid
future damages (Prahl, Boettle, Costa, Kropp, & Rybski, 2018; Rybski, Dawson, & Kropp, 2018). However,
the world of climate services is still large, indeed scattered and often too topic related (Brasseur &
Gallardo, 2016; Medri u. a., 2012). Today investors and the companies themselves often make blind bets on
new and emerging technologies after they have entered the market. It is a reality that the sheer volume of
new ideas is contributing too much to distractions. This makes it difficult for executives and investors to
objectively evaluate whether an emerging idea in fact, could boost their business idea. Consequently, the
business case and related supply chains, company goals have to be evaluated very carefully. In a market
which is still not mature and as it holds for climate service related business ideas clear development
strategies are mandatory to create pay offs. In terms of RATs it is first worth to understand the type of
innovator, e.g. creator, fast follower, solution provider, leverager, defender or expander5. As climate
service related ideas are not new the RATs example can be subsumed under solution provider and
leverager. Taking into account the interviews and market analyses (cf. Figure 3) RATs is a solution provider,
as it focuses on the excellence of customer insights and a leverager, as it innovates the core business to
drive ongoing advantage (i.e. transferring expertise and staff continuity). In terms of potential investments
the latter is of relevance as solution builders create loyalty by understanding specific market segments and
meeting their needs, while leveragers create a sound business model and then capitalize on it to sustain a
position of market leadership. For comparison, expanders achieve rapid share growth by moving into
adjacent markets, while creators take a high investment risk, but can also achieve dramatic success.

However, having identified to nature of business, the following investment opportunities exist (the ones
relevant for RATs are marked with “***”):

       •     Crowdfunding platform (investor guided/private): early-stage investment opportunities***
       •     Venture capital: devoted to companies taking a high risk capital
       •     Private capital: private investments, e.g. from insurance companies or cities into companies in
             return for equity***
       •     Public Grants: as market stimulator from public bodies or as an investment into new
             technologies***
       •     Public Tax Sources: e.g. utilising money from carbon taxes***
       •     Community Development Finance Institutions (CDFIs): CDFI lend to underserved markets and to
             those who have been unable to obtain finance from mainstream sources***

Those being market by three stars could be of interest could be potential investors in the business case.
The RATs idea will create several positive effects. Utilising und development of early warning facilities will
simply protect individuals and assets against weather extremes. Thus, the loss will be reduced. Using the

5
    cf. https://www.bcg.com/publications/2017/innovation-strategy-product-development-model-right-for-you.aspx, 2017

1 Risk Appraisal Toolboxes Based on Climate and Weather Data for Urban Areas                                Page 23 of 33
You can also read