ARGENTINA CLIMATE RISK COUNTRY PROFILE
←
→
Page content transcription
If your browser does not render page correctly, please read the page content below
CLIMATE RISK COUNTRY PROFILE

       ARGENTINA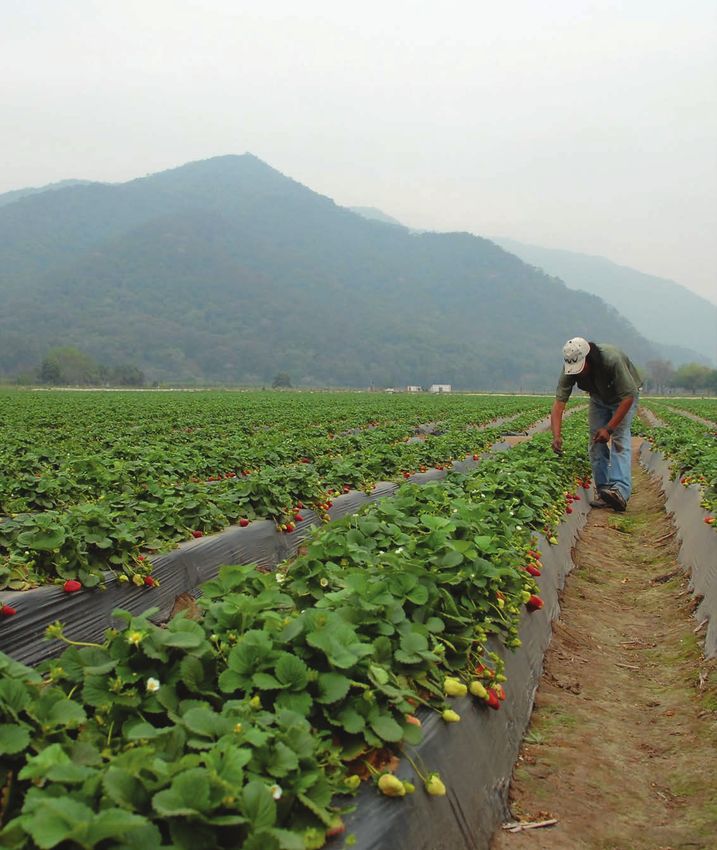
COPYRIGHT
© 2021 by the World Bank Group
1818 H Street NW, Washington, DC 20433
Telephone: 202-473-1000; Internet: www.worldbank.org

This work is a product of the staff of the World Bank Group (WBG) and with external contributions. The opinions, findings,
interpretations, and conclusions expressed in this work are those of the authors and do not necessarily reflect the views or the
official policy or position of the WBG, its Board of Executive Directors, or the governments it represents.

The WBG does not guarantee the accuracy of the data included in this work and do not make any warranty, express or implied,
nor assume any liability or responsibility for any consequence of their use. This publication follows the WBG’s practice in
references to member designations, borders, and maps. The boundaries, colors, denominations, and other information shown
on any map in this work, or the use of the term “country” do not imply any judgment on the part of the WBG, its Boards, or the
governments it represents, concerning the legal status of any territory or geographic area or the endorsement or acceptance
of such boundaries.

The mention of any specific companies or products of manufacturers does not imply that they are endorsed or recommended
by the WBG in preference to others of a similar nature that are not mentioned.

RIGHTS AND PERMISSIONS
The material in this work is subject to copyright. Because the WBG encourages dissemination of its knowledge, this work may
be reproduced, in whole or in part, for noncommercial purposes as long as full attribution to this work is given.

Please cite the work as follows: Climate Risk Profile: Argentina (2021): The World Bank Group.

Any queries on rights and licenses, including subsidiary rights, should be addressed to World Bank Publications, The World Bank
Group, 1818 H Street NW, Washington, DC 20433, USA; fax: 202-522-2625; e-mail: pubrights@worldbank.org.

Cover Photos: © Nahuel Berger/World Bank, “Agriculture workers on a strawberry farm” September 12, 2007 via Flickr, Creative
Commons CC BY-NC-ND 2.0. © Robert Davis/World Bank “Young boy walking through biodiverse terrain” August 18, 2018
via Flickr, Creative Commons CC BY-NC-ND 2.0.

Graphic Design: Circle Graphics, Reisterstown, MD.

CLIMATE RISK COUNTRY PROFILE: ARGENTINA                                                                                       ii
ACKNOWLEDGEMENTS
This profile is part of a series of Climate Risk Country Profiles developed by the World Bank Group (WBG). The country profile
synthesizes most relevant data and information on climate change, disaster risk reduction, and adaptation actions and policies
at the country level. The country profile series are designed as a quick reference source for development practitioners to better
integrate climate resilience in development planning and policy making. This effort is managed and led by Veronique Morin
(Senior Climate Change Specialist, WBG) and Ana E. Bucher (Senior Climate Change Specialist, WBG).

This profile was written by MacKenzie Dove (Senior Climate Change Consultant, WBG). Additional support was provided by
Jason Johnston (Operations Analyst, WBG) and Yunziyi Lang (Climate Change Analyst, WBG).

Climate and climate-related information is largely drawn from the Climate Change Knowledge Portal (CCKP), a WBG online
platform with available global climate data and analysis based on the latest Intergovernmental Panel on Climate Change (IPCC)
reports and datasets. The team is grateful for all comments and suggestions received from the sector, regional, and country
development specialists, as well as climate research scientists and institutions for their advice and guidance on use of climate
related datasets.

CLIMATE RISK COUNTRY PROFILE: ARGENTINA                                                                                       iii
CONTENTS

FOREWORD  .  .  .  .  .  .  .  .  .  .  .  .  .  .  .  .  .  .  .  .  .  .  .  .  .  .  .  .  .  .  .  .  .  .  .  . 1

COUNTRY OVERVIEW .   .   .   .   .   .   .   .   .   .   .   .   .   .   .   .   .   .   .   .   .   .   .   .   .   .   .   .   .   .   .  2

CLIMATOLOGY  .   .   .   .   .   .   .   .   .   .   .   .   .   .   .   .   .   .   .   .   .   .   .   .   .   .   .   .   .   .   .   .   .   .   4
   Climate Baseline .  .  .  .  .  .  .  .  .  .  .  .  .  .  .  .  .  .  .  .  .  .  .  .  .  .  .  .  .  .  .  .  .  .  .  .  .  .  .  . 4
      Overview  .  .  .  .  .  .  .  .  .  .  .  .  .  .  .  .  .  .  .  .  .  .  .  .  .  .  .  .  .  .  .  .  .  .  .  .  .  .  .  .  .  . 4
      Key Trends .  .  .  .  .  .  .  .  .  .  .  .  .  .  .  .  .  .  .  .  .  .  .  .  .  .  .  .  .  .  .  .  .  .  .  .  .  .  .  .  . 7
   Climate Future .  .  .  .  .  .  .  .  .  .  .  .  .  .  .  .  .  .  .  .  .  .  .  .  .  .  .  .  .  .  .  .  .  .  .  .  .  .  .  .  . 8
      Overview  .  .  .  .  .  .  .  .  .  .  .  .  .  .  .  .  .  .  .  .  .  .  .  .  .  .  .  .  .  .  .  .  .  .  .  .  .  .  .  .  .  . 8
      Key Trends .  .  .  .  .  .  .  .  .  .  .  .  .  .  .  .  .  .  .  .  .  .  .  .  .  .  .  .  .  .  .  .  .  .  .  .  .  .  .  .  . 10

CLIMATE RELATED NATURAL HAZARDS .   .   .   .   .   .   .   .   .   .   .   .   .   .   .   .   .   .   .   .   .   . 11
   Overview .  .  .  .  .  .  .  .  .  .  .  .  .  .  .  .  .  .  .  .  .  .  .  .  .  .  .  .  .  .  .  .  .  .  .  .  .  .  .  .  .  .  . 11
   Key Trends .  .  .  .  .  .  .  .  .  .  .  .  .  .  .  .  .  .  .  .  .  .  .  .  .  .  .  .  .  .  .  .  .  .  .  .  .  .  .  .  .  . 13
   Implications for DRM .  .  .  .  .  .  .  .  .  .  .  .  .  .  .  .  .  .  .  .  .  .  .  .  .  .  .  .  .  .  .  .  .  .  .  .  .  . 15

CLIMATE CHANGE IMPACTS TO KEY SECTORS .   .   .   .   .   .   .   .   .   .   .   .   .   .   .   .   .   .   . 16
   Agriculture  .  .  .  .  .  .  .  .  .  .  .  .  .  .  .  .  .  .  .  .  .  .  .  .  .  .  .  .  .  .  .  .  .  .  .  .  .  .  .  .  .  . 16
   Coastal Zones and Sea Level Rise  .  .  .  .  .  .  .  .  .  .  .  .  .  .  .  .  .  .  .  .  .  .  .  .  .  .  .  .  .  .  .  . 19
   Energy  .  .  .  .  .  .  .  .  .  .  .  .  .  .  .  .  .  .  .  .  .  .  .  .  .  .  .  .  .  .  .  .  .  .  .  .  .  .  .  .  .  .  .  . 21
   Health .  .  .  .  .  .  .  .  .  .  .  .  .  .  .  .  .  .  .  .  .  .  .  .  .  .  .  .  .  .  .  .  .  .  .  .  .  .  .  .  .  .  .  . 24
   Transport .  .  .  .  .  .  .  .  .  .  .  .  .  .  .  .  .  .  .  .  .  .  .  .  .  .  .  .  .  .  .  .  .  .  .  .  .  .  .  .  .  . 26
   Water  .  .  .  .  .  .  .  .  .  .  .  .  .  .  .  .  .  .  .  .  .  .  .  .  .  .  .  .  .  .  .  .  .  .  .  .  .  .  .  .  .  .  .  . 27

ADAPTATION .   .   .   .   .   .   .   .   .   .   .   .   .   .   .   .   .   .   .   .   .   .   .   .   .   .   .   .   .   .   .   .   .   .   . 31
   Institutional Framework for Adaptation .  .  .  .  .  .  .  .  .  .  .  .  .  .  .  .  .  .  .  .  .  .  .  .  .  .  .  .  . 31
   Policy Framework for Adaptation  .  .  .  .  .  .  .  .  .  .  .  .  .  .  .  .  .  .  .  .  .  .  .  .  .  .  .  .  .  .  .  . 31
   Recommendations .  .  .  .  .  .  .  .  .  .  .  .  .  .  .  .  .  .  .  .  .  .  .  .  .  .  .  .  .  .  .  .  .  .  .  .  .  . 32
      Research Gaps .  .  .  .  .  .  .  .  .  .  .  .  .  .  .  .  .  .  .  .  .  .  .  .  .  .  .  .  .  .  .  .  .  .  .  .  .  .  . 32
      Data and Information Gaps .  .  .  .  .  .  .  .  .  .  .  .  .  .  .  .  .  .  .  .  .  .  .  .  .  .  .  .  .  .  .  .  . 33
      Institutional Gaps  .  .  .  .  .  .  .  .  .  .  .  .  .  .  .  .  .  .  .  .  .  .  .  .  .  .  .  .  .  .  .  .  .  .  .  .  . 33

CLIMATE RISK COUNTRY PROFILE: ARGENTINA                                                                                                              iv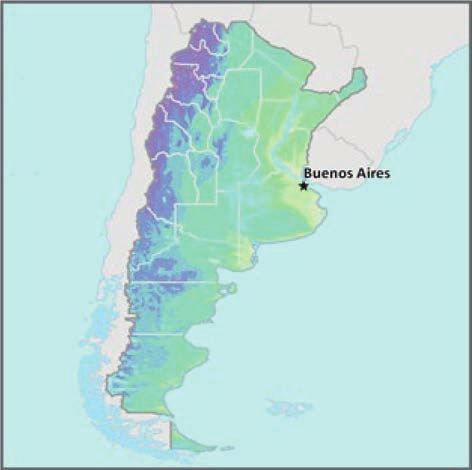
FOREWORD

Climate change is a major risk to good development outcomes, and the World Bank Group is committed to playing
an important role in helping countries integrate climate action into their core development agendas. The World
Bank Group is committed to supporting client countries to invest in and build a low-carbon, climate-resilient future,
helping them to be better prepared to adapt to current and future climate impacts.

The World Bank Group is investing in incorporating and systematically managing climate risks in development
operations through its individual corporate commitments.

A key aspect of the World Bank Group’s Action Plan on Adaptation and Resilience (2019) is to help countries
shift from addressing adaptation as an incremental cost and isolated investment to systematically incorporating
climate risks and opportunities at every phase of policy planning, investment design, implementation and evaluation
of development outcomes. For all IDA and IBRD operations, climate and disaster risk screening is one of the
mandatory corporate climate commitments. This is supported by the Bank Group’s Climate and Disaster Risk
Screening Tool which enables all Bank staff to assess short- and long-term climate and disaster risks in operations
and national or sectoral planning processes. This screening tool draws up-to-date and relevant information from
the World Bank’s Climate Change Knowledge Portal, a comprehensive online ‘one-stop shop’ for global, regional,
and country data related to climate change and development.

Recognizing the value of consistent, easy-to-use technical resources for client countries as well as to support
respective internal climate risk assessment and adaptation planning processes, the World Bank Group’s Climate
Change Group has developed this content. Standardizing and pooling expertise facilitates the World Bank Group in
conducting initial assessments of climate risks and opportunities across sectors within a country, within institutional
portfolios across regions, and acts as a global resource for development practitioners.

For developing countries, the climate risk profiles are intended to serve as public goods to facilitate upstream
country diagnostics, policy dialogue, and strategic planning by providing comprehensive overviews of trends
and projected changes in key climate parameters, sector-specific implications, relevant policies and programs,
adaptation priorities and opportunities for further actions.

It is my hope that these efforts will spur deepening of long-term risk management in developing countries and our
engagement in supporting climate change adaptation planning at operational levels.

Bernice Van Bronkhorst
Global Director
Climate Change Group (CCG)
The World Bank Group (WBG)

CLIMATE RISK COUNTRY PROFILE: ARGENTINA                                                                              1
COUNTRY OVERVIEW

A
          rgentina, the second largest country in South America after Brazil, covers an area of over 2.8 million square
          kilometers (km2). It extends over the southern are of the South American continent and shares borders with
          Chile to the west, Bolivia and Paraguay to the north, and Uruguay to the north east. Argentina’s eastern coast
line stretches for over 4,700 meters (m) along the South Atlantic Ocean. Continental Argentina extends between 20°
and 60° latitude in the Southern Hemisphere, and
the country has regions of sub-tropical climates and
                                                                 FIGURE 1.  Topography of Argentina2
mid-latitudes, as well as extreme thermal conditions,
which vary from hot in the north to very cold in the
extreme south and at the heights of the Sierras
and the Andes Mountains. It has humid lowlands in
eastern Argentina, especially along the rivers of the
Rio de la Plata system. In the north lie the savannas
and swamps of the Chaco region. The humid pampa
(plain) in the west gives way to rangeland and finally
to desert that is broken only by irrigated oases,
with the Andes Mountains marking the end of the
western plains (Figure 1). Argentina has a diverse
geophysical landscape range from tropical climates in
the north to tundra in the far south; Cerro Aconcagua
is the Western Hemisphere’s tallest mountain, while
Laguna del Carbon is the lowest point in the Western
Hemisphere. Argentina is endowed with natural
resources, a significant amount of biodiversity and
a vast range of vegetation.1

Argentina is one of the largest economies in Latin America and is endowed with extraordinary fertile lands, gas
and lithium reserves, and has great potential for renewable energy. It is a leading food producer with large-scale
agricultural and livestock industries. In addition, Argentina has significant opportunities in some manufacturing
subsectors, and innovative services in high tech industries. However, the historical volatility of economic growth and
the accumulation of institutional obstacles have impeded the country’s development and urban poverty remains
high.3 While Argentina had seen improved economic growth and poverty records,4 the COVID-19 pandemic has
worsened the country’s poverty and economic growth. Urban poverty remains high, reaching 42% of population
in the second semester of 2020, with 10.5% resulting in extreme poverty and 57.7% of children experiencing
poverty in 2020.5 In addition to the country’s current economic challenges, deforestation has become a major

1
    Argentina (2015). Third National Communication to the United Nations Framework Convention on Climate Change. URL: https://
    unfccc.int/sites/default/files/resource/Argnc3.pdf
2
    World Bank Group (2019). Climate Migration Profile – Argentina.
3
    World Bank (2021). Argentina – Overview. URL: https://www.worldbank.org/en/country/argentina/overview
4
    World Bank Group (2016): Argentina, Country Environmental Analysis. URL: https://openknowledge.worldbank.org/bitstream/handle/
    10986/25775/109527-ENGLISH-PUBLIC-ARG-CEA-Country-Environmental-Analysis-English.pdf?sequence=1&isAllowed=y
5
    World Bank (2021). Argentina – Overview. URL: https://www.worldbank.org/en/country/argentina/overview

CLIMATE RISK COUNTRY PROFILE: ARGENTINA                                                                                          2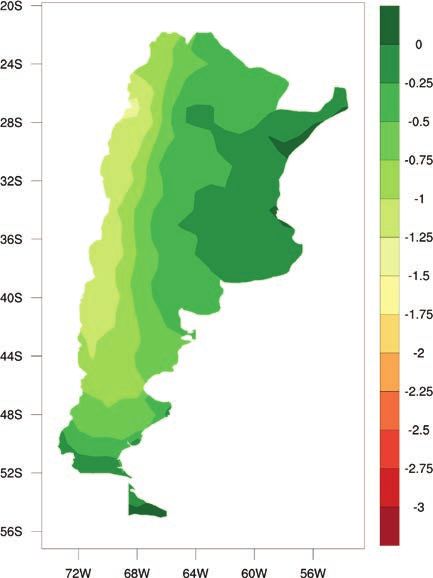
environmental issue, especially in the north of the country, and with flooding events affecting thousands across the
country, per year. Air pollution, waste management and water pollution are becoming serious problems especially
in the growing urban centers of Argentina, but these remain only partially addressed.6

Argentina has an estimated 44.94 million people in 20197 with projections suggesting the country’s population could
reach nearly 49.2 and 54.9 million people by 2030 and 2050, respectively. The majority of Argentinians live in urban
areas and a projected 93% and 95% will do so in 2030 and 2050, respectively.8 The country has a Gross Domestic
Product (GDP) of approximately $445.5 billion in 2019, with an annual growth rate of −2.1% (2019) (Table 1).9

TABLE 1.  Data snapshot: Key development indicators10

     Indicator
     Life Expectancy at Birth, Total (Years) (2019)                                                 76.7
     Population Density (People per sq. km Land Area) (2018)                                        16.3
     % of Population With Access to Electricity (2018)                                          100%
     GDP per Capita (Current US$) (2019)                                                    $9,912.30

The ND-GAIN Index11 ranks 181 countries using
a score which calculates a country’s vulnerability to                     FIGURE 2. ND-GAIN Index for Argentina
climate change and other global challenges as well                               55

as their readiness to improve resilience. This Index                             54

aims to help businesses and the public sector better
                                                                                 53
identify vulnerability and readiness in order to better
                                                                                 52
prioritize investment for more efficient responses to
                                                                         Score

global challenges. Due to a combination of political,                            51

geographic, and social factors, Argentina is recognized                          50

as vulnerable to climate change impacts, ranked
                                                                                 49
84th out of 181 countries in the 2020 ND-GAIN
                                                                                 48
Index. The more vulnerable a country is the higher their                              1995 1997 1999 2001 2003 2005 2007 2009 2011 2013
score, while the more ready a country is to improve its                                 Argentina

resilience the lower it will be. Norway has the highest
score and is ranked 1st. Figure 2 is a time-series plot
of the ND-GAIN Index showing Argentina’s progress

6
      World Bank Group (2016): Argentina, Country Environmental Analysis. URL: https://openknowledge.worldbank.org/bitstream/handle/
      10986/25775/109527-ENGLISH-PUBLIC-ARG-CEA-Country-Environmental-Analysis-English.pdf?sequence=1&isAllowed=y
7
      World Bank Open Data, Data Retrieved April 2021. Data Bank: Population Estimates and Projections, Argentina. URL: https://databank.
      worldbank.org/data/reports.aspx?source=health-nutrition-and-population-statistics:-population-estimates-and-projections
8
      World Bank Open Data, Data Retrieved April 2021. Data Bank: Population Estimates and Projections, Argentina. URL: https://databank.
      worldbank.org/data/reports.aspx?source=health-nutrition-and-population-statistics:-population-estimates-and-projections
9
      World Bank (2021). DataBank – World Development Indicators. URL: https://databank.worldbank.org/source/world-development-
      indicators [accessed 19 April, 2021]
10
      World Bank (2021). DataBank – World Development Indicators. URL: https://databank.worldbank.org/source/world-development-
      indicators [accessed 19 April, 2021]
11
      University of Notre Dame (2021). Notre Dame Global Adaptation Initiative. URL: https://gain.nd.edu/our-work/country-index/

CLIMATE RISK COUNTRY PROFILE: ARGENTINA                                                                                                   3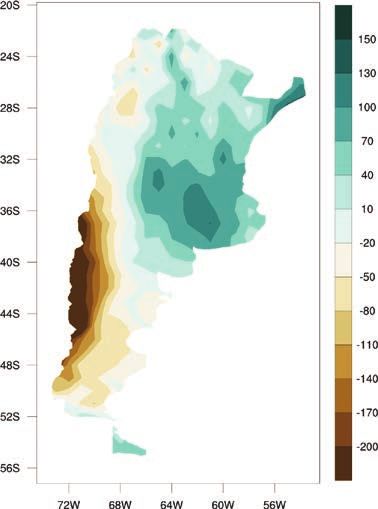
Argentina submitted its Second Nationally-Determined Contributions to the UNFCCC in 2020 and its Third National
Communication (NC3) in 2015, in support of efforts to reduce the country’s vulnerability to climate variability
and change. The country is additionally vulnerable given its high degrees of agricultural activity and the sector’s
prominence for the country’s economy and continued economic development. Argentina has committed improving
adaptation actions such as widening monitoring networks and strengthening early warning systems; instituting
economic quantification of the climate change impacts and adaptation measures; creating multidisciplinary teams
to support climate-related initiatives, and strengthening of initiatives that support the recovery and rehabilitation of
lands, including the adaptation based in ecosystems, among others.12

Green, Inclusive and Resilient Recovery
The coronavirus disease (COVID-19) pandemic has led to unprecedented adverse social and economic impacts.
Further, the pandemic has demonstrated the compounding impacts of adding yet another shock on top of
the multiple challenges that vulnerable populations already face in day-to-day life, with the potential to create
devastating health, social, economic and environmental crises that can leave a deep, long-lasting mark. However,
as governments take urgent action and lay the foundations for their financial, economic, and social recovery, they
have a unique opportunity to create economies that are more sustainable, inclusive and resilient. Short and long-
term recovery efforts should prioritize investments that boost jobs and economic activity; have positive impacts on
human, social and natural capital; protect biodiversity and ecosystems services; boost resilience; and advance the
decarbonization of economies.

CLIMATOLOGY

Climate Baseline
Overview
The majority of Argentina’s climate is subtropical The Patagonian provinces: Neuquén, Río Negro, Chubut, Santa
Cruz and Tierra del Fuego, experience low rainfall, except in the strip adjacent to the Andes Mountains as well
as in the southern end of the provinces of Santa Cruz and Tierra del Fuego. The contiguous strip of the Andes
Mountains has abundant forests, glaciers and permanent snows, North of 40°S, the climate is subtropical with hot
summers. At the eastern end of this region there is abundant rainfall, which decreases towards the west and desert
areas with very scarce vegetation, where cities and agriculture exist in the oases of the rivers fed by rainfall in the
Cordillera; including provinces of San Juan, La Rioja, Catamarca and part of Mendoza. In the east, covering part of
the provinces of Entre Rios, Buenos Aires, Santa Fe, Córdoba, La Pampa and San Luis, due to the humid conditions,

12
     Argentina (2020). Second Nationally-Determined Contributions of the Argentine Republic. Ministry of Environment and Sustainable
     Development, Argentine Republic. URL: https://www4.unfccc.int/sites/ndcstaging/PublishedDocuments/Argentina%20Second/
     Argentina_Segunda%20Contribución%20Nacional.pdf

CLIMATE RISK COUNTRY PROFILE: ARGENTINA                                                                                           4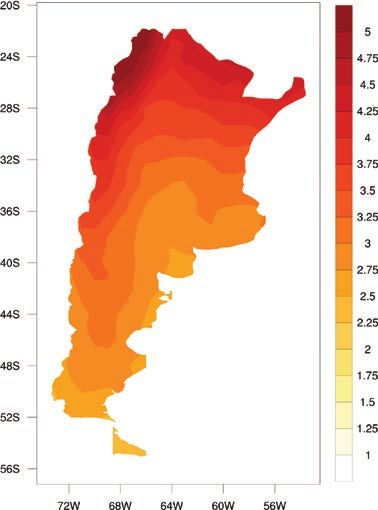
rain-fed agriculture and cattle raising is extensive. Apart from the north of this region, the original vegetation has
been almost totally replaced. The region between the humid east and the west arid is semi-arid, whose vegetation,
originally from the mountains, was modified by cattle breeding. In this region, the precipitation occurs almost entirely
during the summer period. In the north of the country, in the province of Misiones and on the eastern slopes of
the Tucumán, Salta and Jujuy, the high temperatures and abundant rainfall results in tropical forests. In Misiones,
part of the original forest was replaced by commercial forestry, primarily pine. Commercial forestation of pines and
eucalyptus also extends to the provinces of Corrientes and Entre Rios. The provinces of Chaco and Formosa, east
of Salta and north of Santiago del Estero are in the region of the Chaco characterized by arboreal vegetation in the
form of a park, where it is also develops extensive cattle raising and, increasingly, dry farming.13
Given the country’s extensive territory, its climate features and seasonality are influenced by the presence of Los
Andes Mountain extending along the west of the country as well as the El Niño-Southern Oscillation (ENSO) and
the Indian Dipole. Sea surface temperature anomalies also influence Argentina’s weather. Additionally, warm (cold)
phase of El Niño and a positive (negative) phase of Indian Dipole are all related to increased (decreased) spring and
autumn precipitation in northeastern Argentina and Central Andes and the signal decreases in summer and winter.14
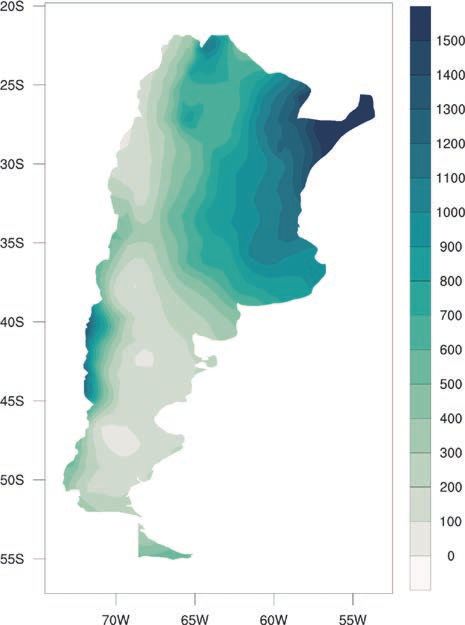
Analysis of data from the World Bank Group’s Climate Change Knowledge Portal (CCKP) (Table 2) shows historical
climate information for the period 1901–2020. Mean annual temperature for Argentina is 14.3°C, with average
monthly temperatures ranging between 7°C (July) and 17°C (January). Mean annual precipitation is 541 millimeters
(mm), with year-round rainfall and highest rainfall occurring October to April for the latest climatology, 1991–2020
(Figure 3).15 Figure 4 presents the spatial variation of observed average annual precipitation and temperature.
FIGURE 3. Average monthly temperature and rainfall of Argentina for 1991–202016
24 90
Temperature (°C)
18 60
Rainfall (mm)
12 30
6 0
Jan Feb Mar Apr May Jun Jul Aug Sep Oct Nov Dec
Rainfall Temperature
13
Argentina (2017). Second Biennial Update Report of The Argentine Republic to The United Nations Framework Convention On
Climate Change. URL: https://unfccc.int/documents/180598
14
Garbarini, E. et al. (2016). ENSO Influence over Precipitation in Argentina. Advance in Environmental Research. 52(2016). URL: https://
www.researchgate.net/publication/319184288_ENSO_Influence_over_Precipitation_in_Argentina
15
WBG Climate Change Knowledge Portal (CCKP, 2021). Argentina Historical Data. URL: https://climateknowledgeportal.worldbank.
org/country/argentina/climate-data-historical
16
WBG Climate Change Knowledge Portal (CCKP, 2021). Argentina Historical Data. URL: https://climateknowledgeportal.worldbank.org/
country/argentina/climate-data-historical
CLIMATE RISK COUNTRY PROFILE: ARGENTINA 5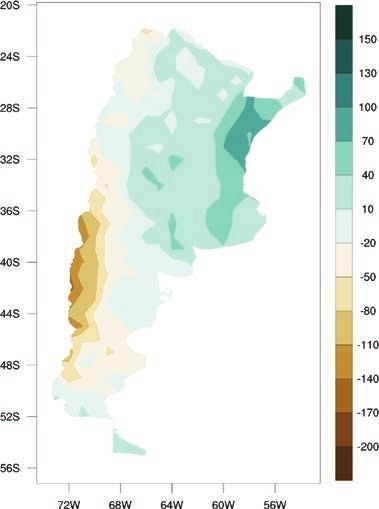
TABLE 2. Data snapshot: Country-level summary statistics
Climate Variables 1901–2020
Mean Annual Temperature (°C) 14.3°C
Mean Annual Precipitation (mm) 541.0 mm
Mean Maximum Annual Temperature (°C) 20.9°C
Mean Minimum Annual Temperature (°C) 7.8°C
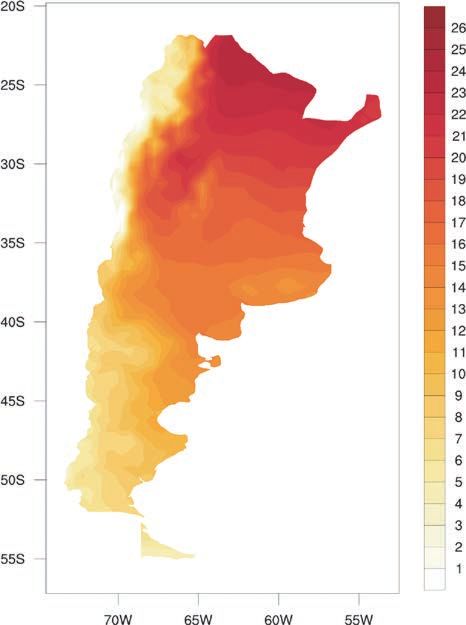
FIGURE 4. Map of average annual temperature (°C) (left); annual precipitation (mm) (right) for
Argentina, 1991–202017
17
WBG Climate Change Knowledge Portal (CCKP, 2021). Argentina Historical Data. URL: https://climateknowledgeportal.worldbank.org/
country/Argentina/climate-data-historical
CLIMATE RISK COUNTRY PROFILE: ARGENTINA 6Key Trends
Temperature
Argentina has experienced temperature increase since the 1960s (Figure 5), although warming trends are below
global averages. In the majority of non-Patagonia areas of Argentina, temperature increases were observed at
an average of 0.5°C between 1960–2010; smaller increases were observed in the center of the country. In the
Patagonia region, observed temperature increase was greater than in the rest of the country; with increases
exceeding 1°C. Extreme temperatures in the east and north of the country were also observed to increase, as well
as the occurrence of more frequent heat waves and a reduction in frosts.18 While average temperature increases
were below global mean increase, strong trends were observed for increases in extreme temperatures as well as
heat waves over the past decades.19
FIGURE 5. Observed temperature for Argentina, 1901–202020
15.5
15
Temperature (°C)
14.5
14
13.5
13
1901 1911 1921 1931 1941 1951 1961 1971 1981 1991 2001 2011 2020
Annual Mean 5 Year Smoothing
Precipitation
In Argentina, precipitation trends are highly variable and affected by interannual and interdecadal variations.
However, between 1960 and 2010, mean annual precipitation was observed to increase. Largest observed
changes (some in excess of 200 mm of rainfall) occurred in the east of the country as well as in semi-arid areas
in the south. Significant increases in precipitation were observed over much of subtropical Argentina, since 1960.
This has been favorable to agriculture yields and the extension of crop lands into the country’s semi-arid regions.
However, these increases derived from more frequent heavy rainfalls and consequent flooding of rural and urban
areas. Since the early 1970s, the primary rivers of the Plata Basin have increased their mean flows, this was due
not only to increased precipitation, but also to land use changes. In contrast, over the Andes Mountains, reduced
rainfall and increased temperature has led to glaciers receding and reduced river flows.21 In the Patagonian Andes,
18
Argentina (2015). Third National Communication to the United Nations Framework Convention on Climate Change. URL: https://
unfccc.int/sites/default/files/resource/Argnc3.pdf
19
Barros, V. et al. (2014). Climate change in Argentina: trends, projections, impacts and adaptation. WIREs Clim Change (2014).
DOI: https://doi.org/10.1002/wcc.316
20
WB Climate Change Knowledge Portal (CCKP, 2021). Argentina URL: https://climateknowledgeportal.worldbank.org/country/
argentina/climate-data-historical
21
Barros, V. et al. (2014). Climate change in Argentina: trends, projections, impacts and adaptation. WIREs Clim Change (2014).
DOI: https://doi.org/10.1002/wcc.316
CLIMATE RISK COUNTRY PROFILE: ARGENTINA 7precipitation had a negative change in the period 1960–2010 and the rivers in northern Mendoza and San Juan
seem to indicate reductions in precipitation (and water availability) in their upper basins over the Cordillera. Also
observed was the shift of more frequent and intense rainfall events in much of the country, which resulted in more
frequent flooding. In the west and most notably in the north, the winter dry periods have become longer and drier,
which has generated problems in the availability of water for some populations.22
Climate Future
Overview
The main data source for the World Bank Group’s Climate Change Knowledge Portal (CCKP) is the CMIP5
(Coupled Inter-comparison Project No.5) data ensemble, which builds the database for the global climate change
projections presented in the Fifth Assessment Report (AR5) of the Intergovernmental Panel on Climate Change
(IPCC). Four Representative Concentration Pathways (i.e. RCP2.6, RCP4.5, RCP6.0, and RCP8.5) were selected
and defined by their total radiative forcing (cumulative measure of GHG emissions from all sources) pathway
and level by 2100. The RCP2.6 for example represents a very strong mitigation scenario, whereas the RCP8.5
assumes business-as-usual scenario. For more information, please refer to the RCP Database. For simplification,
these scenarios are referred to as a low (RCP2.6); a medium (RCP4.5) and a high (RCP8.5) emission scenario
in this profile. Table 3 provides CMIP5 projections for essential climate variables under high emission scenario
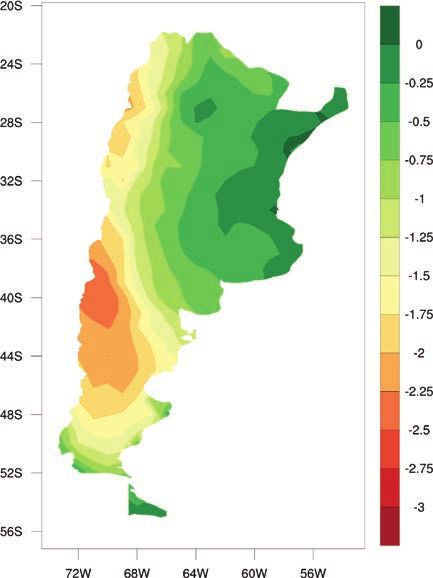
(RCP 8.5) over 4 different time horizons. Figure 6 presents the multi-model (CMIP5) ensemble of 32 Global
Circulation Models (GCMs) showing the projected changes in annual precipitation and temperature for the periods
2040–2059 and 2080–2099.
TABLE 3. Data snapshot: CMIP5 ensemble projection
Cmip5 Ensemble Projection 2020–2039 2040–2059 2060–2079 2080–2099
Annual Temperature Anomaly (°C) +0.2 to +1.6 +0.6 to +2.4 +1.2 to +3.6 +1.6 to +4.9
(+0.9°C) (+1.6°C) (+2.4°C) (+3.3°C)
Annual Precipitation Anomaly (mm) -13.6 to +14.0 -14.9 to +16.9 -16.0 to +19.8 -17.4 to +24.4
(−0.40 mm) (−0.18 mm) (+0.1 mm) (+1.1 mm)
Note: The table shows CMIP5 ensemble projection under RCP8.5. Bold value is the range (10th–90th Percentile) and values in parentheses
show the median (or 50th Percentile).
22
Argentina (2015). Third National Communication to the United Nations Framework Convention on Climate Change. URL: https://
unfccc.int/sites/default/files/resource/Argnc3.pdf
CLIMATE RISK COUNTRY PROFILE: ARGENTINA 8FIGURE 6. CMIP5 multi-model ensemble projected change (32 GCMs) in annual temperature (top)
and precipitation (bottom) by 2040–2059 (left) and by 2080–2099 (right), relative to 1986–2005
baseline under RCP8.523
23
WBG Climate Change Knowledge Portal (CCKP, 2021). Argentina Projected Future Climate. URL: https://climateknowledgeportal.
worldbank.org/country/Argentina/climate-data-projections
CLIMATE RISK COUNTRY PROFILE: ARGENTINA 9Key Trends
Temperature
While Argentina has a highly diverse topography and climates, the country is, overall, expected to experience
increased temperatures. Temperatures across Argentina are projected to continue rising, with mean median annual
temperatures projected to rise by +1.6°C by the 2050s and by 3.3°C by the end of the century under a high-
emissions scenario (RCP 8.5). The Patagonian region is expected to see some of the most significant increases.
The Andean glaciers will continue to experience increased temperatures, which is continuing to impact glacier
recession. Semi-arid regions will continue to experience temperature spikes over summer months, with the greatest
warming expected to occur in the northwest regions.24
Across all emissions scenarios, temperatures are projected to continue to rise in Argentina, through the end of the
century. As seen in Figure 7, under a high-emissions scenario (RCP 8.5), average temperatures are projected to
rise rapidly after the 2060s. High temperatures, analyzed in terms of the number of days above 25 degrees, are
expected to rise significantly across the seasonal cycle, with the most pronounced changes occurring during March
and April and September to December (Figure 8). Rising temperatures and extreme heat conditions will result in
significant implications for human and animal health, agriculture, water resources, as well as biodiversity.
FIGURE 7. Historical and projected average FIGURE 8. Projected change in Summer Days
temperature for Argentina from 1986 to 2099 (Tmax >25°C) (RCP8.5, Reference Period,
(RCP8.5, Reference Period, 1986–2005)25 1986–2005)26
20 9
8
19
7
Temperature (°C)
18 6
5
Days
17 4
3
16
2
15 1
0
14
–1
1980 2000 2020 2040 2060 2080 2100
Jan Feb Mar Apr May Jun Jul Aug Sep Oct Nov Dec
Year
Historical RCP 2.6 RCP 4.5 RCP 6.0 RCP 8.5
24
Argentina (2015). Third National Communication to the United Nations Framework Convention on Climate Change. URL: https://
unfccc.int/sites/default/files/resource/Argnc3.pdf
25
WBG Climate Change Knowledge Portal (CCKP, 2021). Interactive Climate Indicator Dashboard – Agriculture. Argentina. URL https://
climatedata.worldbank.org/CRMePortal/web/agriculture/crops-and-land-management?country=ARG&period=2080-2099
26
WBG Climate Change Knowledge Portal (CCKP, 2021). Interactive Climate Indicator Dashboard – Agriculture. Argentina. URL https://
climatedata.worldbank.org/CRMePortal/web/agriculture/crops-and-land-management?country=ARG&period=2080-2099
CLIMATE RISK COUNTRY PROFILE: ARGENTINA 10Precipitation
Precipitation trends are highly variable across Argentina,
however projected changes are not expected to be FIGURE 9. Annual average precipitation
significant. Under a high-emission scenario, RCP8.5, in Argentina for 1986 to 2099 (Reference
a decrease of 10% to 205 is expected by the end Period, 1986–2005)30
of the century over the western Patagonia region 1000
and mountainous areas of Mendoza. 27 Increased 900
Precipitation (mm)
precipitation is expected in the center and eastern 800
parts of the country. Extreme precipitation events, such 700
as extreme rainfall are also expected to increase in 600
frequency and intensity.28 As shown in Figure 9 below, 500
there is uncertainty on the future of rainfall patterns
400
for Argentina29 with most scenarios pointing to an 1980 2000 2020 2040 2060 2080 2100
Year
average projected decrease in annual precipitation is Historical RCP 2.6 RCP 4.5 RCP 6.0 RCP 8.5
by the of the century under a high emissions scenario
for Argentina as a whole (RCP8.5).
CLIMATE RELATED NATURAL HAZARDS
Overview
Argentina’s diverse landscapes and climates as well as its geographic location results in the country being at high
risk to national hazards. Over the past two decades, Argentina has experienced extreme events and widespread
droughts across multiple regions, including core agricultural areas. The most devastating recent events occurred in
2006, 2009 and 2011, reportedly resulted in losses of more than US$4 billion dollars and more than one million
people either directly or indirectly affected. During the spring of 2006, drought events peaked in the northeast of
Argentina. 2009 precipitation deficits indicated a drought epicenter in the central Argentinian plains. In 2011, the
northern Patagonia region experienced a combination of natural disasters due to severe drought conditions and a
devastating volcanic eruption.31
27
Pérez, S. et al. (2015). Changes in Average Annual Precipitation in Argentina’s Pampa Region and Their Possible Causes. MDPI.
Climate. 3(1), 150–167. DOI: https://doi.org/10.3390/cli3010150
28
Argentina (2015). Third National Communication to the United Nations Framework Convention on Climate Change. URL: https://
unfccc.int/sites/default/files/resource/Argnc3.pdf
29
WBG Climate Change Knowledge Portal (CCKP, 2021). Argentina Water Dashboard. Data Description. URL: https://climateknowledgeportal.
worldbank.org/country/argentina/climate-sector-water
30
WBG Climate Change Knowledge Portal (CCKP, 2021). Climate Data-Projections. Argentina. URL: https://climatedata.worldbank.org/
CRMePortal/web/agriculture/crops-and-land-management?country=ARG&period=2080-2099
31
Naumann, G. et al (2019). Dynamics of Socioeconomic Exposure, Vulnerability and Impacts of Recent Droughts in Argentina.
Geosciences. 9(1), 39. DOI: https://doi.org/10.3390/geosciences9010039
CLIMATE RISK COUNTRY PROFILE: ARGENTINA 11Floods are expected to cause at least US$700 million in economic losses every year and one-in-three Argentinians
live in a flood-prone area; approximately 14.2 million people. The majority of the population living in flood prone
areas are concentrated in Greater Buenos Aires, Pampas and Gran Chaco regions, which together account for
65% of highly exposed population. The Greater Buenos Aries region accounts for almost 35% of this annual
expected loss. The Pampas region and Gran Chaco follow, account for 18% and 12% of the annual expected loss
respectively. 15 of the top 25 industrial parks in Argentina are located in flood-prone areas.32 The coastal city of
Buenos Aires is highly exposed due to flooding. Intense rainfall and exceptionally high tides in the La Plata River
are the primary contributors. Increasing rainfall intensities, combined with low slopes and rapid urbanization of the
area, which have modified natural drainage networks, thereby diminishing the capacity of soil to absorb potential
flood waters, continue to pose significant challenges for flood risk management in the city.33
Data from the Emergency Event Database: EM-Dat database,34 presented in Table 4, shows the country has
endured various natural hazards, including floods, landslides, epidemic diseases, storms, earthquakes and droughts,
costing lives, and economic damage.
TABLE 4. Natural disasters in Argentina, 1900–2020
Natural Hazard Events Total Total Damage
1900–2020 Subtype Count Deaths Total Affected (’000 USD)
Drought Drought 4 8 35,032 3,520,000
Bacterial Disease 1 67 3,883 0
Epidemic
Viral Disease 1 6 13,366
Riverine Flood 32 248 7,143,411 6,192,210
Flood
Flash Flood 3 45 4,420 250,000
Earthquake Ground Movement 5 10,476 241,065 180,000
Landslide Landslide 4 103 35,030 15,000
Storm Convective Storm 12 298 145,148 106,200
Volcanic Activity Ash Fall 4 0 56,964 1,000,000
Extreme Heat Wave 1 100 66,000 104,000
Temperatures Cold Wave 7 85 28,500
Forest Fire 4 8 152,752 100,000
Wildfire Land Fire (Brush, 24 0 0 0
Bush, Pasture)
32
Swiss Re (2015). Staying afloat, Flood Risk in Argentina. URL: https://media.swissre.com/documents/Swiss_Re_Argentina_Flood_
Risk_Publ_long.PDF
33
World Bank Group (2020). A Data-Driven Framework to address Gender Issues in Managing Flood Risks – Flood Risk Management
Support Project for the City of Buenos Aires, Argentina. Water Guidance Note. Global Water Security and Sanitation Partnership.
URL: https://openknowledge.worldbank.org/handle/10986/34375
34
EM-DAT: The Emergency Events Database – Universite catholique de Louvain (UCL) – CRED, D. Guha-Sapir, Brussels, Belgium.
http://emdat.be/emdat_db/
CLIMATE RISK COUNTRY PROFILE: ARGENTINA 12Key Trends
As the climate changes, weather related disasters and long-term hazard trends are likely to continue, exacerbating
existing vulnerabilities in Argentina. An estimated 60% of natural disasters in Argentina are floods, which have
resulted in 95% of economic losses for affected populations. The majority of regional flooding has been linked
with warm phases of the El Niño-Southern Oscillation (ENSO) phenomenon. Additionally, heavy rainfall results
in overflow of major rivers in the La Plata Region (Paraná, Bermejo, Pilcomayo, Uruguay, Paraguay and their
tributaries). Flooding has also occurred following severe storms which have increased flows of mountain rivers,
resulting in downstream, low-land flood events.35 Heavy rainfall has also resulted in landslides and mudslides.
Argentina has also been adversely affected by increased aridity and drought events. The regions most exposed to
adverse drought impacts are mainly located in concordance with the core crop and livestock areas located in central
Argentina (Buenos Aires, Córdoba, La Pampa, Santa Fe and Entre Ríos provinces). Recently Argentina has suffered
through intense drought periods in 2006–2007, 2008–2009, and 2011–2012, which significantly impacted the
country’s agriculture and livestock sectors.36
The Andes Mountains (borders between Argentina and Chile) has some of the highest tectonic activity in the world,
with frequent earthquakes and volcanic eruptions. The Andean magmatic arc that develops along the Argentine-
Chilean border includes approximately 120 known active volcanoes, of which 38 are entirely or partially located
in Argentine territory. While the majority of the volcanoes considered active are located in Chilean territory or on
the international border, in the case of eruption, ash dispersion can occur mostly over Argentine territory due to
the effect of atmospheric circulation. Although this dispersion does not generate direct loss of human lives, it does
produce harmful socio-economic consequences on the affected communities.37
As temperatures rise, these will likely (i) exacerbate existing tensions for water between agricultural and livestock
needs as well as human populations needs, especially during the dry seasons; (ii) alter water quality from available
surface sources; and (iii) increase pressures on urban zones as urbanization rates grow. Small-scale farmers are
particularly vulnerable to the effects of climate change due to their dependency on rainfed agriculture for food
production and income generation, as well as their limited capacity to adapt. Extreme weather events such as
droughts negatively impact agro-pastoralists’ livelihoods due to the loss of productive assets, severely affecting
their food security. Figure 10 shows current risk from river floods, earthquakes, landslides and water scarcity.
35
Argentina (2018). Plan nacional para la reducción del riesgo de desastres 2018–2023 (PNRRD). URL: https://www.preventionweb.net/
files/60547_pnrrd201820233.pdf
36
Naumann, G. et al (2019). Dynamics of Socioeconomic Exposure, Vulnerability and Impacts of Recent Droughts in Argentina.
Geosciences. 9(1), 39. DOI: https://doi.org/10.3390/geosciences9010039
37
Argentina (2018). Plan nacional para la reducción del riesgo de desastres 2018–2023 (PNRRD). URL: https://www.preventionweb.net/
files/60547_pnrrd201820233.pdf
CLIMATE RISK COUNTRY PROFILE: ARGENTINA 13FIGURE 10. Risk of riverine flood (upper left), risk of earthquakes (upper right);
risk of landslides (lower left); and risk of water scarcity (lower right)38
38
ThinkHazard! (2020). Argentina. URL: https://www.thinkhazard.org/en/report/12-argentina
CLIMATE RISK COUNTRY PROFILE: ARGENTINA 14Gender
An increasing body of research has shown that climate-related disasters have impacted human populations in
many areas including agricultural production, food security, water management and public health. The level of
impacts and coping strategies of populations depends heavily on their socio-economic status, socio-cultural
norms, access to resources, poverty as well as gender. Research has also provided more evidence that the effects
are not gender neutral, as women and children are among the highest risk groups. Key factors that account
for the differences between women’s and men’s vulnerability to climate change risks include: gender-based
differences in time use; access to assets and credit, treatment by formal institutions, which can constrain women’s
opportunities, limited access to policy discussions and decision making, and a lack of sex-disaggregated data for
policy change.39
Implications for DRM
The Argentinian government is committed to strengthening its capacity to manage and reduce disaster risks and
to continue to increase awareness and adaptive capacity amongst at-risk populations. The country’s disaster risk
management (DRM) approach includes broad communication and risk-management practices as well as direct
support to promote the integration of provinces, municipalities and communities as well as non-governmental
organizations and civil society throughout the whole cycle of the country’s Disaster Risk Management strategies.
The country’s National Plan for Disaster Risk Reduction 2018–2023 focuses on information dissemination and
training to raise awareness of the hazards and identify vulnerabilities to improve safety conditions and increase
communities’ resilience capacity.40 Disaster risk management in Argentina recognizes the need to integrate
environmental, climate change, and land use and water resource management into DRM process. Specific projects,
such as the ‘Flood Risk Management Support for the City of Buenos Aires’ (approved in 2016), are aimed at
supporting greater efficiency in addressing flood risk management for critical infrastructure, economic zones and
human settlements, while also addressing the different risks and impacts experienced for both men and women.41
39
World Bank Group (2016). Gender Equality, Poverty Reduction, and Inclusive Growth. URL: http://documents1.worldbank.org/
curated/en/820851467992505410/pdf/102114-REVISED-PUBLIC-WBG-Gender-Strategy.pdf
40
Argentina (2018). Plan nacional para la reducción del riesgo de desastres 2018–2023 (PNRRD). URL: https://www.preventionweb.net/
files/60547_pnrrd201820233.pdf
41
World Bank Group (2020). A Data-Driven Framework to address Gender Issues in Managing Flood Risks – Flood Risk Management
Support Project for the City of Buenos Aires, Argentina. Water Guidance Note. Global Water Security and Sanitation Partnership.
URL: https://openknowledge.worldbank.org/handle/10986/34375
CLIMATE RISK COUNTRY PROFILE: ARGENTINA 15CLIMATE CHANGE IMPACTS TO KEY SECTORS
Agriculture
Overview
Agriculture is a critical source of export earnings and food security in Argentina. The sector still accounts for 6%
of the country’s GDP; rainfed agriculture is responsible for 87% of the sector’s value.42 Approximately 75% of
Argentina’s farms are ‘family farms; and they account for roughly 18% of the agricultural land and 27% of total
agricultural output.43 The country is known for having highly fertile plains, with two-thirds of the country having arid
or semi-arid land. The majority of the country’s agriculture occurs in the fertile plains in the east and in the highly
irrigated valleys at the foot of the Andes Mountains. Argentina has a diversified industry; agriculture and its direct
manufactures contribute up to 55% of the country’s export revenue.44 The country is dominated by small-scale
producers, but also has medium and large-scale commercial operations. Given Argentina’s diverse topographies
and climates, the country’s farming systems have developed for their specific regions.45 The temperate mixed
(Pampa) farming system in Eastern and Central Argentina occupies almost 36% of the country’s total land area.
This area is known for its very fertile soils, which allow for extensive and intensive livestock and crop (primarily
maize, soybean, and wheat) production, especially in the provinces of Buenos Aires, Córdoba, and Santa Fe.
The area is dominated the use of mechanization in the Pampas prairies.46 In Southern Argentina (Patagonia),
pastoral farming extends across more than 20% of the country. The climate is drier and cooler than in the Pampa
region and, given the scarce reported irrigation resources for crop production, sheep and cattle ranching is the
main agricultural activity. Irrigation is estimated to benefit just 5% of Argentina’s agricultural area.47 The irrigated
farming systems in the West have allowed for the intensification of agriculture in the region, which has generally
been commercially oriented (grapevines). The cereal-livestock (Campos) farming system in Northeastern provinces
(Misiones, Corrientes, and Entre Ríos) is a relatively new agricultural region. The area is oriented towards livestock
production but also produces tea, mate leaves, citrus, rice, and, to a lesser extent, maize, sunflower, sorghum, and
wheat. The high-altitude areas have mixed (Central Andes) farming systems in the Northwestern provinces (Jujuy,
Salta, Catamarca, la Rioja, San Juan) and is mainly dedicated to the production of sugarcane, tobacco, horticulture,
and tropical fruit. Extensive dry land, mixed (Gran Chaco) farming system in the Northern provinces (Formosa,
Chaco, Santiago del Estereo) is considered less suitable for crop production.48 However, significant potential exists
to expand irrigation, as well as increase efficiency in existing irrigation infrastructure to complement rainfed crops
and improve agricultural opportunity in water stressed and arid agricultural areas.49
42
World Bank Group (2021). Argentina Water Security Assessment – Valuing Water. (Unpublished)
43
FAO (2021). Argentina. World Agricultural Watch. URL: http://www.fao.org/world-agriculture-watch/our-program/arg/en/
44
Barros, V. et al. (2014). Climate change in Argentina: trends, projections, impacts and adaptation. WIREs Clim Change (2014).
DOI: 10.1002/wcc.316
45
OECD (2019). Agricultural Policies in Argentina. Trade and Agricultural Directorate Committee for Agriculture. TAD/CA(2018)9/
FINAL. URL: https://www.oecd.org/officialdocuments/publicdisplaydocumentpdf/?cote=TAD/CA(2018)9/FINAL&docLanguage=En
46
OECD (2019). Agricultural Policies in Argentina. Trade and Agricultural Directorate Committee for Agriculture. TAD/CA(2018)9/
FINAL. URL: https://www.oecd.org/officialdocuments/publicdisplaydocumentpdf/?cote=TAD/CA(2018)9/FINAL&docLanguage=En
47
World Bank Group (2021). Argentina Water Security Assessment – Valuing Water. (Unpublished)
48
World Bank; CIAT; CATIE (2014). Supplementary material to Climate-Smart Agriculture in Argentina. CSA Country Profiles
for Latin America Series. Washington D.C.: The World Bank Group. URL: https://assets.publishing.service.gov.uk/media/
57a089dce5274a27b20002d5/Supplementary-material_Argentina.pdf
49
World Bank Group (2021). Argentina Water Security Assessment – Valuing Water. (Unpublished)
CLIMATE RISK COUNTRY PROFILE: ARGENTINA 16Land use changes in Argentina have been largely related to the expansion of its agricultural area into pastures
and forests in marginal areas (Northeast and Northwest) and the replacement of cereals with oil-seeds, among
others. Cropland area has increased significantly and crop production has increased fivefold in the past three to
four decades, trends driven by the increased value of crops relative to livestock. More crops are now produced and
higher yields obtained, while livestock activities have been replaced or shifted to marginal areas less suitable for
agricultural activities such as the semiarid areas of San Luis, Mendoza, the Northwest, (Salta, Tucuman, Santiago del
Estereo), and the Northeast (Chaco, Formosa, Corrientes). Maize production has increased almost four times, and
wheat production has doubled. Since 2004, production dramatically decreased following agricultural policies such
as high export taxes that discouraged producers from exporting wheat.50 Soybeans, a crop introduced to Argentina
in the early 1970s, gained popularity rapidly due to the increased international demand; current production is
dominated by multinational corporations. Land used for soybean has seen the largest change, from 2 million
hectares in 1980 to 20 million hectares in 2017.51
Climate Change Impacts
Argentina’s agriculture sector is considered to be at high-risk to climate variability and change given the wide
range of extreme events that the country regularly experiences, including floods and droughts, as well as rising
temperatures and desertification (in some areas, exacerbated by deforestation and poor land use practices).
However, in certain areas, agricultural opportunity is expected to increase. In the majority of the country’s humid
pampas, and increase in rainfall as well as extreme rainfall events is expected in both quantity and intensity, leading
to an expected increase in flood risks. Appropriate water management can reduce those risks, while also increasing
water availability for the region, boosting production. The government has projected the amount of water available
for soybeans, maize, wheat, sunflower and cotton, the main crops, which in most of the country are produced without
irrigation, to be maintained until the 2040s. However, increasing drought is likely for key livestock zones.52
It is estimated that soybean and corn yields may increase considerably, with wheat production reducing slightly.
This is due to the anticipated increase in summer rainfall (December to February), which favors soybean and crop
production in the Pampean region. While a reduction of spring rainfall and a prolonged dry winter period will impact
wheat produced in the central zones of the country.53 In northern Patagonia, fruit and vegetable growing could
be negatively affected in the future because of a reduction in the available water for irrigation from rivers as well
as expanded temperature variability and freezing temperatures occurring during growing seasons.54 Increases in
water demand due to population growth, and reduction of river stream flows, changes to glacial melt and increasing
demand on primary water sources, are likely to lead to additional necessity and use of ground water for irrigation,
potentially increasing costs for irrigation costs.55
50
Sly, M. (2017). The Argentine portion of the soybean commodity chain. Nature, Palgrave Communications. 3:17095. DOI: 10.1057/
palcomms.2017.95
51
OECD (2019). Agricultural Policies in Argentina. Trade and Agricultural Directorate Committee for Agriculture. TAD/CA(2018)9/
FINAL. URL: https://www.oecd.org/officialdocuments/publicdisplaydocumentpdf/?cote=TAD/CA(2018)9/FINAL&docLanguage=En
52
Gutman, D. (2019). Does Climate Change Offer New Opportunities for Agriculture in Argentina? IPS New Agency. [February 25, 2019].
URL: http://www.ipsnews.net/2019/02/climate-change-offer-new-opportunities-agriculture-argentina/
53
Argentina (2015). Third National Communication to the United Nations Framework Convention on Climate Change. URL: https://
unfccc.int/sites/default/files/resource/Argnc3.pdf
54
Barrio, R. et al., (2021). Climate change impacts on agriculture’s southern frontier-Perspectives for farming in North Patagonia.
International Journal of Climatology. DOI: https://doi.org/10.1002/joc.6649
55
World Bank Group (2021). Argentina Water Security Assessment – Valuing Water. (Unpublished)
CLIMATE RISK COUNTRY PROFILE: ARGENTINA 17Livestock, mainly cattle, is expected to reduce in productivity in the northern and central regions, with potential
to increase in the west. This is largely associated with the reduction of foraging opportunities due to projected
increase in direness in the regions. Livestock displacement is also considered likely and a high-risk, given the
increases in temperatures in the eastern regions.56
Increasing temperatures and the projected increase in evapotranspiration is of concern for the country’s farming
region, particularly the Central Andes and the central region of the typically humid-Pampas. Most significant changes
in temperature are expected to be experienced in the north and northwest of the country.57 Rising temperatures,
particularly daily maximum temperatures, pose an
increased risk of heat stress for livestock and could
significantly reduce critical crop yields for agricultural
FIGURE 11. Average daily max temperature
communities. Under present climate conditions, heat
for Argentina (RCP8.5, Reference Period,
stress already poses challenges for heat dissipation
1986–2005)58
7
in livestock populations, rendering them vulnerable to
6
heat stress during certain periods of the year. Heat
5
Temperature (°C)
stress can reduce milk production and reproduction,
4
particularly for cattle. As heat increases, so does the
3
likelihood of altered growing seasons. Figure 11
2
shows the projected change in average daily maximum
1
temperatures for Argentina across the seasonal cycle.
0
What is clear is that higher maximum temperatures are Jan Feb Mar Apr May Jun Jul Aug Sep Oct Nov Dec
expected throughout the year.
Adaptation Options
Argentina is committed to increasing awareness of climate change impacts throughout its agricultural communities
and increasing the provision of quantified information and adaptation options. This includes improved monitoring of
water resources and economic evaluations. Technical assistance and training may be provided for specific regions
where changing crop type production maybe advised to adapt to long-term climate change trends.59 Additional
adaptation strategies can include varietal changes to certain crops or aligning planting dates with evolving rainfall
patterns. Irrigation systems to supplement water supplies during dry periods could help to reduce the risk from
droughts to key crops, especially areas impacted by rivers flows and changes to glacial melt. Increased investment,
insurance and credit options should be implemented to promote investments in climate impact assessments,
funding smallholder adaptation pilots, financing and expanding national extension mechanisms to achieve an
56
Argentina (2015). Third National Communication to the United Nations Framework Convention on Climate Change. URL: https://
unfccc.int/sites/default/files/resource/Argnc3.pdf
57
World Bank Group (2021). Argentina Water Security Assessment – Valuing Water. (Unpublished)
58
WBG Climate Change Knowledge Portal (CCKP, 2021). Argentina Agriculture. Dashboard URL: https://climatedata.worldbank.org/
CRMePortal/web/agriculture/crops-and-land-management?country=ARG&period=2080-2099
59
Argentina (2020). Second Nationally-Determined Contributions of the Argentine Republic. Ministry of Environment and Sustainable
Development, Argentine Republic. URL: https://www4.unfccc.int/sites/ndcstaging/PublishedDocuments/Argentina%20Second/
Argentina_Segunda%20Contribución%20Nacional.pdf
CLIMATE RISK COUNTRY PROFILE: ARGENTINA 18adequate level of technology transfer to rural producers, and establishing agricultural insurance mechanisms for
smallholder farmers, especially in response to increasing risks form natural disasters such as floods and droughts.
While Argentina’s agricultural risk management system has significant strengths, expanded access and opportunity
with co-operative structures can further support diverse and broad agricultural value chains.60
Coastal Zones and Sea Level Rise
Overview
Argentina’s coast (4,989 km) support numerous important economic activities for the country, including commercial
activities, ports, fishing, hydrocarbon extraction as well as providing important tourists destination and activities. The
coasts of Argentina are dominated by high cliffs or stepped terrain near the shore. For that reason, although the
situation of these coasts under the projected 21st century scenarios of sea-level rise (SLR) have not been studied
in detail, it is not expected that significant loss of land would result from permanent flooding. However, low-lying
cities and ports are expected to be impacted, such as, tidal islands south of the city of Bahía Blanca in the extreme
south of the Province of Buenos Aires.61
Climate Change Impacts
Projected climate change trends could affect key maritime activities in Argentina due to increasing water
temperatures, changes in the circulation of ocean currents and the rise in mean sea level. Fishing opportunities
are expected to benefit through a moderate warming scenario. The majority of maritime coasts in Argentina are
not expected to suffer permeant floods in the 21st century, the tidal flats on the coast south and Bahía Blanca
and the enclaves of Bahía Anegada and San Blas are likely to experience significant coastal flooding. Beaches
surrounded by cliffs or sand dunes are expected to gradually lose their extension; reducing productivity for the
tourism industry. In some environments, such as coastal wetlands, salt marshes, and other ecosystem services are
likely to be affected. The Coastal lagoon of Mar Chiquita and the coastal sector between Bahía Blanca and Bahía
San Blas in the province of Buenos Aires, and the northern coast of Golfo San Matías. Coastal erosion is also a
concern, especially for the beaches along Buenos Aries coastline, coasts north of the Río Negro, south of Chubut
and north of Santa Cruz.62
While the Argentine coast is not very high, in a scenario of increasing mean sea level of 0.50 m, very likely in this
century, only a narrow strip one or two kilometers from the southern coast of Samborombón Bay would be flooded
permanently. In this area, the nature of the soil is not very firm, which can speed up the process of retreating the
coast. With the exception of this area, in the rest of the Argentine coast, the rise in sea level will manifest itself with
60
OECD (2019). Agricultural Policies in Argentina. Trade and Agricultural Directorate Committee for Agriculture. TAD/CA(2018)9/
FINAL. URL: https://www.oecd.org/officialdocuments/publicdisplaydocumentpdf/?cote=TAD/CA(2018)9/FINAL&docLanguage=En
61
Barros, V. et al. (2014). Climate change in Argentina: trends, projections, impacts and adaptation. WIREs Clim Change (2014).
DOI: 10.1002/wcc.316
62
Argentina (2015). Third National Communication to the United Nations Framework Convention on Climate Change. URL: https://
unfccc.int/sites/default/files/resource/Argnc3.pdf
CLIMATE RISK COUNTRY PROFILE: ARGENTINA 19You can also read