THE ELECTORAL PARTICIPATION OF MOBILE EUROPEAN UNION CITIZENS IN EUROPEAN PARLIAMENT AND MUNICIPAL ELECTIONS
←
→
Page content transcription
If your browser does not render page correctly, please read the page content below
THE ELECTORAL
APRIL
        PARTICIPATION OF
2021
        MOBILE EUROPEAN
        UNION CITIZENS IN
        EUROPEAN PARLIAMENT
        AND MUNICIPAL
        ELECTIONS
        AUTHORED BY              This report was funded by the Eu-
                                 ropean Union’s Rights, Equality and
        DEREK S. HUTCHESON AND
                                 Citizenship Programme (2014-2020)
        LUANA RUSSO
© Derek S. Hutcheson and Luana Russo, 2021
This text may be downloaded only for personal research purposes. Additional reproduction for other
purposes, whether in hard copies or electronically, requires the consent of the authors. If cited or quoted,
reference should be made to the full name of the author(s), editor(s), the title, the year and the publisher.
Requests should be addressed to GlobalCit@eui.eu.
Views expressed in this publication reflect the opinion of individual authors and not those of the
European University Institute.

Global Citizenship Observatory (GLOBALCIT)
Robert Schuman Centre for Advanced Studies
in collaboration with
Edinburgh University Law School

The Electoral Participation of Mobile European Union Citizens in European Parliament and
Municipal Elections
RSCAS/GLOBALCIT-PP 2021/2
April 2021

© Derek S. Hutcheson and Luana Russo, 2021
Printed in Italy
European University Institute
Badia Fiesolana
I – 50014 San Domenico di Fiesole (FI)

www.eui.eu/RSCAS/Publications/
cadmus.eui.eu
Robert Schuman Centre for Advanced Studies
The Robert Schuman Centre for Advanced Studies, created in 1992 and currently directed by Professor
Brigid Laffan, aims to develop inter-disciplinary and comparative research on the major issues facing
the process of European integration, European societies and Europe’s place in 21st century global
politics.
The Centre is home to a large post-doctoral programme and hosts major research programmes, projects
and data sets, in addition to a range of working groups and ad hoc initiatives. The research agenda is
organised around a set of core themes and is continuously evolving, reflecting the changing agenda of
European integration, the expanding membership of the European Union, developments in Europe’s
neighbourhood and the wider world. For more information: http://eui.eu/rscas
The EUI and the Robert Schuman Centre are not responsible for the opinions expressed by the author(s).

GLOBALCIT
The Global Citizenship Observatory (GLOBALCIT) is an online observatory and research network
committed to fact-based and non-partisan analysis of citizenship laws and electoral rights around the
globe. GLOBALCIT addresses the need to understand the varieties of citizenship laws and policies in a
globalised world. It provides reliable and comparative data on the content, causes and consequences of
the laws that govern the acquisition and loss of citizenship and the franchise. It enables scholars, policy-
makers, and the general public to critically analyse how citizenship connects people across international
borders.
GLOBALCIT publishes databases, analyses, indicators and debates on citizenship status and electoral
rights. It relies on a large international network of country experts Its user-friendly interactive tools
enable the comparison of data across countries and over time.
GLOBALCIT studies political participation in the context of the project Fostering Awareness, Inclusion
and Recognition of EU mobile citizens’ Political Rights (FAIR EU).
This report was funded by the European Union’s Rights, Equality and Citizenship Programme (2014-
2020).
The content of this report represents the views of the author only and is his/her sole responsibility. The
European Commission does not accept any responsibility for use that may be made of the information
it contains.
For more information see: www.globalcit.eu
The Electoral Participation of Mobile European Union Citizens in
                European Parliament and Municipal Elections

                              Derek S. Hutcheson and Luana Russo

1. Introduction

Democracy is one of the fundamental values of the European Union (EU).1 The starting point
of democracy is that it represents ‘rule of the people’. But which people should be represented?
In this report, we put a particular focus on the representation of ‘mobile EU citizens’ – people
holding the citizenship of one Member State who have used their freedom of movement rights
to live or work in another.
       Since the Maastricht Treaty, national citizens of European Union (EU) Member States
(MS) have been vested with a derivative citizenship of the Union. Such citizenship gives them
not only the right to move and reside freely within the EU, but also the ‘to vote and to stand as
candidates in elections to the European Parliament (EP) and in municipal elections in their
Member State of residence, under the same conditions as nationals of that State’.2
        Prior to the United Kingdom’s (UK) departure from the EU, there were approximately
14.3 million people of voting age (including British citizens and EU citizens in the UK) who
lived in an EU country other than their own: collectively a group that was larger than the
individual electorates of 21 of the then 28 Member States. This number was diminished
somewhat by the UK’s exit, but though they are a small proportion of the overall EU population,
and dispersed across the continent, they represent a sizeable proportion of potential voters in
some locations due to residential concentration. (An obvious example is Brussels itself.) If they
cannot fully access their democratic rights, the result may be a ‘representation gap’, in which
the views of mobile EU citizens are systematically less represented than those of other EU
citizens. In other words, taking up EU rights to mobility potentially can lead to a diminution of
democratic rights for EU citizens who move between countries.
         The Treaty provisions on electoral rights, and the Directives that give them substance –
93/109/EC (EP elections) and 94/80/EC (municipal elections) – are designed to address the
misalignment of national citizenship and electoral territories. They resolve it only partially.
First, they concern only EP and municipal elections – leaving electoral rights in national-level
elections subject to Member States’ own rules. Not all EU states allow their own citizens to
vote from abroad, and no EU states grant other EU citizens the right to vote in their national-
level elections (with the partial exception – prior to Brexit – of the UK and Ireland; but this was
related to reciprocal agreements, rather than EU status).3 Thus it is entirely possible for a

1
  Treaty on European Union (Consolidated Version), Art. 2. Official Journal of the European Union (OJ), C326,
26.10.2012.
2
  Treaty on the Functioning of the European Union (Consolidated Version), Art. 20 (2)(a) and (b). Official
Journal of the European Union, 26 October 2012, Vol. 55, C326.
3
  The United Kingdom and Ireland give reciprocal rights to each other’s citizens in national parliamentary
elections (but not in referenda or presidential elections, in Ireland’s case). The UK also gives voting rights to

RSCAS/GLOBALCIT-PP 2021/2 - © 2021 Author(s)
                                                                                                                1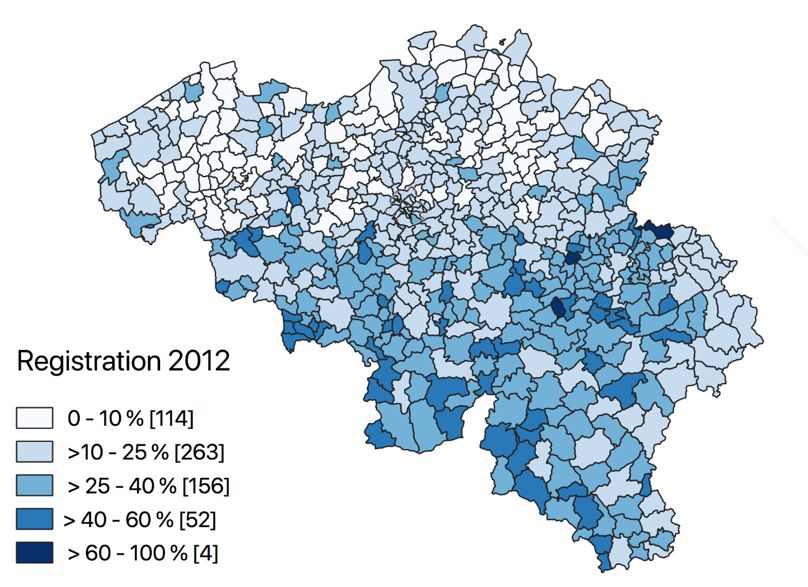
Derek S. Hutcheson and Luana Russo

mobile EU citizen to end up with very limited or no voting rights in any national parliament
election. Second, Directive 93/109/EC concerns only EP voting rights of Union citizens in the
country in which they live, but not relative to their country of origin. Third, even where the
Directives imply an automatic right to vote in municipal elections, there is wide disparity in the
ease with which mobile EU citizens can access these rights, the exact residence requirements
necessary to obtain the relevant status, and the administrative powers of the local government
units to which they apply (as will be discussed below).
         The Directives have been in place for more than a quarter of a century, but we still have
remarkably little knowledge of the extent to which mobile EU voters actually use their electoral
rights. It is this gap that this working paper addresses. First, it looks at the scope and enactment
of Directives 93/109/EC (EP elections) and 94/80/EC (municipal elections). Thereafter, it
examines systematically the available information on registration and turnout rates amongst
mobile EU voters, in the most recent municipal elections and EP elections prior to 2019 in each
Member State (and in selected cases, more recent elections).
        Finally, it examines the available registration and turnout data of mobile EU voters in a
selection of key countries. Based on these three levels of analysis, conclusions are drawn about
the participation rates of mobile EU citizens in EP and municipal elections across the EU, and
policy suggestions are made based on them.

Note:
An earlier version of this report was published under the auspices of the EU-funded project
‘Fostering Awareness, Inclusion and Recognition of EU Mobile Citizens’ Political Rights’
(FAIR EU, 1 January 2018-30 June 2019). The earlier paper was published under the title:
    •   Derek S. Hutcheson and Luana Russo (2019), FAIR EU Analytical Report: Turnout and
        Registration of Mobile European Union Citizens in European Parliament and
        Municipal Elections, v.1.0 (Brussels: FAIREU) [Deliverable D3.7].
       The 2019 report, published on the project website, was based on data collected for the
FAIREU project on the 2009 and 2014 European Parliament elections, and on the most recent
municipal elections in each country prior to 1 January 2019. It was also written before the
United Kingdom (UK) left the European Union on 31 January 2020.
         This working paper is to a large extent based on the same material as the earlier report,
but contains a number of updates. First, all links to official sources have been updated to ensure
their validity as of March 2021. Second, although the comparative discussion in part 4 is are
still based on the base of material collected for the FAIREU project – the most recent municipal
elections prior to 1 January 2019 and pre-2019 European Parliament elections – new material
has been incorporated into the country case studies in section 5 that was not available at the
time of the original report. This relates to selected municipal elections of 2018-20, and – where
available – the 2019 European Parliament elections in certain countries.
        Finally, the effect of Brexit – the UK’s departure from the EU – has been taken account
of in various places within the report. The UK remained a Member State until its de jure exit
on 31 January 2020 (and certain provisions regarding citizens’ rights continued to apply for a
transitional period until the end of 2020). Generally the baseline used throughout the report is
with reference to the 28 Member States (EU28) that were members throughout the period that

Commonwealth citizens, which coincidentally encompasses Maltese and Cypriot nationals. Both arrangements
continue after Brexit, as these rights were not related to EU membership.

                                                                 RSCAS/GLOBALCIT-PP 2021/2 © 2021 Author(s)
2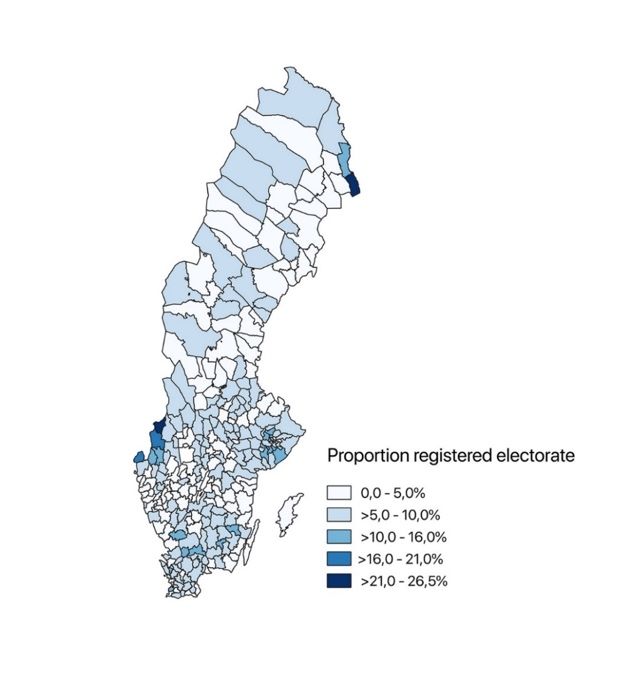
The Electoral Participation of Mobile European Union Citizens in European Parliament and Municipal Elections

is under study. Thus the UK is generally included as an EU member in the discussions about
elections that took place prior to 2020. This counts UK citizens among the mobile EU citizens
in other EU countries, and also applies to EU citizens resident in the UK at the time of the
elections. To retrospectively separate out the UK’s citizens and electorates from those of other
EU citizens – when they were often not differentiated at the time – is a task that is beyond the
scope of this report.
        It should of course be noted that the UK has now exited the EU, and hence any
comparisons of the voting behaviour of mobile EU citizens in future elections should be based
on the remaining EU27. As a result, the baseline number of EU citizens living in other EU
states, by definition, will have changed: EU citizens and UK citizens are now third country
citizens relative to each other, rather than counting as mobile EU citizens in each other’s
countries.

2. Scope of Directives 93/109/EC and 94/80/EC

Directive 93/109/EC (as amended) lays down detailed arrangements for mobile EU citizens to
vote and stand as candidates in EP elections in their states of residence.4 In essence, the key
provision is that mobile EU citizens should have voting and candidacy rights in their country
of residence, unless deprived of their electoral rights in their home countries, if they fulfil the
same criteria as the Member State ‘imposes by law on its own nationals’ (Art. 3).
         This formulation is important insofar as it does not create a universal electoral standard
across the Union. Voting and candidacy rights are accorded in line with national specificities.
For example, the minimum voting age in Austria (and Malta, from 2019) is 16 years, two years
lower than in other EU states. The minimum age for candidacy varies from 18 to 25 years across
the EU. Each Member State has different provisions on disenfranchisement based on criminal
convictions and mental incapacity.5 Some states also impose residency and registration
restrictions, such as a requirement for permanent as opposed to temporary residency; minimum
periods of prior residency; or different procedures for registration between EU and national
citizens. In Belgium, Cyprus, Greece and Luxembourg, voting is also compulsory once
registered (at least formally). In other states, it is voluntary.6
       Electoral rights of mobile EU citizens as external citizens in their home countries also
vary widely. Directive 93/109/EC acknowledges a mobile EU citizen’s right to ‘vote and to
stand as a candidate in the Member State of which the citizen is a national’ and ‘to choose the
Member State in which to take part in European elections’. But it does not make this a
requirement, stating explicitly that these arrangements do not impinge on the prerogative of
Member States to determine their own external voting and candidacy rules. De facto, therefore,
some mobile EU voters have a choice of whether to vote or stand for election to the European

4
  Council Directive 93/109/EC of 6 December 1993, OJ L329, 30.12.1993 (p. 34), as amended by Council
Directive 2013/1/EU of 20 December 2012, OJ L26/27 26.1.2013.
5
  For detailed summaries of these differences, see the Global Citizenship Observatory (2017), Conditions for
Electoral Rights Database (Florence: EUI), http://globalcit.eu/conditions-for-electoral-rights/, accessed 23
March 2021).
6
  Cyprus abolished this obligation in 2017 and the other three countries do not, in practice, enforce any sanctions
for failure to vote. For a summary of the registration-related obstacles, see Ostling, A. (2019), FAIR EU
Synthesis Report: Electoral Rights for Mobile EU Citizens - Challenges and Facilitators of Implementation
(Florence: RSCAS). Available online: http://cadmus.eui.eu/handle/1814/60991, accessed 23 March 2021.

RSCAS/GLOBALCIT-PP 2021/2 - © 2021 Author(s)
                                                                                                                      3
Derek S. Hutcheson and Luana Russo
Parliament in their country of origin or of residence (with the caveat that double voting is
prohibited), while others do not.
A similar formulation features in Directive 94/80/EC (as amended),7 in respect of
mobile EU citizens’ voting and candidacy rights in municipal elections. Once again, the key
point is that states may impose the same restrictions as they do on their own nationals (Art. 3),
meaning that different rules on minimum ages, registration requirements, etc. apply from
country to country.
There are two further specificities in municipal elections. The first is that the
fundamental definition of ‘basic local government unit’ differs from state to state. The
applicable entities vary in administrative importance and size. For example, mobile EU voters
in France may vote only in elections to their local commune (low-level territorial divisions with
on average fewer than 2,000 inhabitants), but not to larger subnational territorial units such as
the 13 régions or 101 départements. At the other end of the spectrum, EU voters may vote in
the highest-level territorial subdivisions in Denmark (5 regioner), Croatia (20 županija),
Sweden (21 län) and Slovakia (8 samosprávny kraj), each of which can encompass several
hundred thousand voters.
Second, the Directive permits (but does not require) Member States to restrict certain
municipal executive offices (‘elected head, deputy or member of the governing college of the
executive of a basic local government’ – Art. 5.3) to their own nationals. Thus, even if it is
possible for mobile EU citizens to vote and to be elected as municipal deputies, it is not always
possible for them to exercise executive responsibility.
Successive implementation reports have indicated that there have been several obstacles
to the practical application of Directive 94/80/EC, such as arbitrary minimum residence periods
and failure to count time spent in other EU Member States in lieu.8 Over the last few years,
most of these formal legal inconsistencies have been removed,9 but in practice there remain
significant de facto obstacles to mobile EU citizens who wish to exercise their democratic rights
in municipal and EP elections.10
Even if EU citizens have the right to vote in local and EP elections, it is unclear that
anything close to a majority of them can and will. There are several ‘filters’ on participation.
The first group of obstacles concerns eligibility and registration. Whereas registration on the
electoral roll is automatic in most countries for native citizens, in more than half the Member
States mobile EU voters are required to register themselves separately on the electoral register,
even if they are already living in the country. For local elections, this is the case in 15 of the 28
EU Member States, and for EP elections, in no fewer than 25 of them.11 Moreover, the
definition of residency differs from state to state and in some countries requires a minimum
7
Council Directive 94/80/EC of 19 December 1994, OJ L 368, 31.12.1994, p.38, as adapted in Council Directive
2013/19/EU, OJ 10.6.2013 L158/201.
8
European Commission (2012), ‘Report from the Commission to the European Parliament and the Council on
the application of Directive 94/80/EC on the right to vote and to stand as a candidate in municipal elections by
citizens of the Union residing in a Member State of which they are not nationals’, COM(2012)99 final, 9 March
2012, p.8. Available online: https://eur-
lex.europa.eu/LexUriServ/LexUriServ.do?uri=COM:2012:0099:FIN:EN:PDF, accessed 23 March 2021.
9
European Commission (2018), ‘Report from the Commission to the European Parliament, the Council, the
European Economic and Social Committee and the Committee of the Regions on the application of Directive
94/80/EC on the right to vote and to stand as a candidate in municipal elections’, COM(2018)44 final, 25
January 2018. Available online: https://eur-lex.europa.eu/legal-
content/EN/TXT/PDF/?uri=CELEX:52018DC0044&from=en, accessed 23 March 2021.
10
Ostling, A. (2019), FAIREU Synthesis Report.
11
Ostling, A. (2019), FAIREU Synthesis Report.
RSCAS/GLOBALCIT-PP 2021/2 © 2021 Author(s)
4The Electoral Participation of Mobile European Union Citizens in European Parliament and Municipal Elections
number of months’ or years’ prior residence. In EP elections, as noted above, a majority of
mobile EU citizens (but not all, depending on their country of origin) may also have the option
of voting in their home country, which means that registration rates in countries of residence
should be considered alongside those in countries of origin.
Second, even where voters are registered, turnout amongst non-citizens may also be
lower than among native citizens. Unfamiliarity with the local political landscapes or language
barriers may act as a disincentive to participation, as well as specific national rules (such as
compulsory voting). The reason for a voter’s mobility may also affect his or her propensity to
participate: those whose main reason for mobility is a short-term work opportunity or other
temporary situation such as study may feel less commitment to vote in their country of residence
than long-term mobile EU citizens who plan a long-term future there. This also draws attention
to the fact that, even where the body of mobile EU citizens remains stable in size, there may be
turnover in the people who comprise it from one election to the next.
We have hitherto had remarkably little empirical information on the extent to which
mobile EU citizens actually do participate in local and European elections. Eurobarometer
studies have suggested that general awareness of EU mobile voting rights in local and European
elections has been falling in recent years – but these awareness figures are measured among the
general population, not mobile EU citizens themselves.12 The Commission’s own reports on
the implementation of Directive 94/80/EC have indicated that registration and turnout rates that
are much below those for native citizens – but the depth of the studies has been hampered by
poor response rates from national authorities, and limited data.13
The current report seeks to add to the foundational work done by these reports through
the compilation of a comprehensive database of registration and electoral results across EU
Member States in the 2009 and 2014 EP elections and the most recent municipal elections prior
to 2019. It allows us to build a more comprehensive picture of registration and turnout rates
amongst mobile EU citizens across Europe in local and European Parliament elections. The
overall picture is that turnout rates are universally much lower than those of national citizens in
each state. But there is wide variation, and also an interaction between low registration rates
and low turnout rates.
Two further caveats are in order before continuing. First, there are many categories of
foreign-born or foreign-background voters, but the current report has a narrow focus primarily
on ‘mobile EU citizens’ – people who hold the citizenship of an EU state other than the one
they live in, but do not hold the citizenship of their state of residence. Some foreign-born people
may be citizens of their country of residence (e.g., through naturalisation or derivatively from
birth) – but in electoral statistics such foreign-born people are usually counted as part of the
resident citizenry, rather than as mobile EU citizens. Relevant distinctions should therefore be
made between ‘foreign-born’, ‘foreign citizen’ and ‘non-citizen’. There may also be other
electoral levels apart from EP and basic municipal elections in which non-national EU citizens
or non-EU citizens have voting rights – but these are afforded by national-specific legislation.
Our focus in this report is primarily on those whose voting rights in municipal and EP elections
derive directly from their status as EU citizens from another EU country, through the
application of EU law.
12
Eurobarometer (2016), ‘European Union Citizenship’ (Brussels). Available online:
https://ec.europa.eu/info/sites/info/files/2016-flash-eurobarometer-430-citizenship_en.pdf, accessed 23 March
2021.
13
European Commission (2018), ‘Report on The Application of Directive 94/80/EC’, COM(2018)44 final.
RSCAS/GLOBALCIT-PP 2021/2 - © 2021 Author(s)
5Derek S. Hutcheson and Luana Russo
Second, the report focuses on active electoral rights – the uptake of the right to vote.
This is not to deny the importance of passive electoral rights for mobile EU citizens (the right
to stand as a candidate), which are covered elsewhere.14 But this report primarily focuses on
registration and turnout rates among mobile EU voters in EP and municipal elections across the
Union.
3. The FAIREU database on turnout
3.1 Methodology
In order to assess the participation of mobile EU citizens in municipal and EP elections, a
database was constructed for the most recent municipal elections prior to 1 January 2019 to
which Directive 94/80/EC applied, and also to the two most recent EP elections prior to the
May 2019 contest (2009 and 2014, except in Croatia where the first EP election took place in
2013). The 2019 EP election is not systematically included in the database, as not all states had
officially finalised and published their definitive results and/or deep-level breakdowns of
registration and turnout, at the time the data collection was completed under the FAIREU
project. Where relevant details are known, they are included in the country reports in section 5.
Whereas the Commission’s reports on participation rates focus on self-reported
questionnaire returns from national authorities,15 the database used for the current report is
based mainly on publicly-available official sources of electoral information, supplemented with
other reliable and verifiable data.
For each election, the following sources of information were sought in order of priority.
First, registration and turnout figures for the election in general were identified. Thereafter,
specific registration and turnout data for mobile EU citizens were sought. The unavailability of
data through one source of information led to the continuation of the search through the next
level of enquiry:
• official data in the public domain (e.g., official results from electoral commissions and
parliamentary documents);
• Publicly available research data from reputable academic studies;16
14
See Ostling, A. (2019), FAIREU Synthesis Report; Arrighi, J-Th., Bauböck, R., Collyer, M., Hutcheson, D.,
Moraru, M., Khadar, L. and Shaw, J. (2013), Franchise And Electoral Participation of Third Country Citizens
Residing the European Union and of EU Citizens Residing in Third Countries (Brussels: European
Parliament/Directorate General for Internal Policies), Study 474.411. (Available online:
http://www.europarl.europa.eu/RegData/etudes/etudes/join/2013/474441/IPOL-
AFCO_ET(2013)474441_EN.pdf, accessed 23 March 2021).
15
Centre for Strategy and Evaluation Services/European Commission (2015), Study on the Conduct of the 2014
Elections to the European Parliament (Brussels: European Commission), pp.72-73. Available online:
https://ec.europa.eu/info/sites/info/files/final_report_2014_ep_elections_study_cses_10_march_2015_en.pdf,
accessed 16 June 2019); European Commission (2018), ‘Report on the Application of Directive 94/80/EC’,
COM(2018)44 final.
16
For example, the data on Denmark published by Copenhagen University and based on detailed electoral
register data is much more comprehensive than the official figures available on electoral commission websites.
[Hansen, K.M. (2018), Valgdeltagelsen ved kommunal- og regionsvalget 2017 (Copenhagen: Copenhagen
University/CVAP). Available online: https://samf.ku.dk/nyheder/ny-analyse-vi-er-paa-vej-mod-et-demokratisk-
a-og-b-hold/KV_RV17_valgdeltagelse.pdf, accessed 23 March 2021).
RSCAS/GLOBALCIT-PP 2021/2 © 2021 Author(s)
6The Electoral Participation of Mobile European Union Citizens in European Parliament and Municipal Elections
• Links to official figures from reputable secondary sources (e.g., European Commission
implementation report summaries, press releases and newspaper articles based on
official data which itself is no longer available);17
• Approaches via FAIREU country experts to national authorities, with formal freedom
of information requests;
• Direct approaches from the current authors to national authorities, with informal
freedom of information requests or requests for clarifications.
• Gaps in data are filled in from the findings of the FAIREU country experts as presented
in the project’s country reports.18
The data utilised are listed in a separate database available on the FAIREU website and via the
European University Institute’s Global Citizenship Observatory.19
3.2 Scope of Inventory
The data cover the 2009 and 2014 European Parliament election in all EU Member States and
the most recent municipal elections prior to 1 January 2019. Our focus is on voting rather than
on candidacy. For both EP and municipal elections, the criteria for inclusion were:
• Legislative elections
• Mobile EU citizens entitled to vote in the election in their country of residence, under
the provisions of Directives 93/109/EC (EP elections) or 94/80/EC (municipal
elections)
• Participation in voting (active electoral rights).
For maximum comparability, the focus in the database is on municipal legislative elections, as
such bodies exist in every EU Member State, and mobile EU citizens are granted the franchise
to them through Directive 94/80/EC. In some countries, mobile EU citizens can also vote in
other forms of local government elections – for example, mayoral contests. Such electoral rights
vary from country to country and also reflect differences in local government structures, but are
not universal across the EU.
In some countries, national legislation on voting rights goes beyond the inclusiveness
requirements of Directive 94/80/EC. Twelve EU states (Belgium, Denmark, Estonia, Finland,
Ireland, Luxembourg, the Netherlands, Slovakia, and Sweden; plus Spain, Portugal and – prior
to its departure – the UK for selected nationalities) give voting rights to third-country citizens
(TCCs) as well as EU citizens in municipal elections, albeit typically after much longer waiting
periods or only by reciprocity. In the database, our focus has been on mobile EU citizens only,
except where no distinction is made in the registration data between different categories of non-
17
An example is the summary of electoral registration of EU citizens in Bulgaria in 2011 (248 mobile EU
citizens), which was given in a press release: Ministry of Regional Development and Public Works (2011) ‘Във
връзка с приключилия етап от дейностите на МРРБ, ГД “ГРАО”, свързани с подготовката и
провеждането на изборите в страната на 23.10.2011 г., Ви уведомяваме следното: [Regarding the
completed stage of the activities of the Ministry of Regional Development and Public Works, DG GRAO,
related to the preparation and holding of the elections in the country on 23.10.2011, we inform you of the
following:]’. Available online: https://www.mrrb.bg/bg/vuv-vruzka-s-priklyuchiliya-etap-ot-dejnostite-na-mrrb-
gd-grao-svurzani-s-podgotovkata-i-provejdaneto-na-izborite-v-stranata-na-23-10-2011-g-vi-uvedomyavame-
slednoto/, accessed 23 March 2021.
18
See https://faireu.ecas.org/reports/.
19
Hutcheson, D. and Russo, L. (2019), FAIREU Data Inventory on Electoral Registration and Turnout in Most
Recent Municipal Elections prior to 1 January 2019, v.1.0 (Brussels: FAIREU). Available online.
RSCAS/GLOBALCIT-PP 2021/2 - © 2021 Author(s)
7Derek S. Hutcheson and Luana Russo
national voters (such as in Sweden, which simply records the number of ‘non-Swedish’ voters
without geographical breakdown of nationality).
Data were assembled or calculated for each election in respect of the following
parameters, where available:
• Registration:
o absolute number of mobile EU voters registered.
o proportion of registered EU electorate relative to the overall electorate (share of
electorate).
o proportion of registered EU electorate relative to mobile EU citizens of voting
age (registration rate).
• Turnout
o Absolute number of mobile EU citizens actually voting.
o Proportion of EU voters relative to the number of registered mobile EU citizens
(turnout as % of registered EU voters).
o Proportion of EU voters relative to the total number of EU citizens of voting age
(registered and non-registered) (turnout as % of eligible EU voters).
As explained further in section 2.3, not all countries had equally comprehensive data, and in
some cases it was not possible to ascertain with accuracy the registration or turnout rates.
As a methodological point, ‘turnout’ is not defined identically in each country’s
electoral legislation. For the purposes of comparison, it has generally been calculated as the
number of ballot papers given out (if this is different from the number of ballot papers in urns),
relative to the registered electorate. In this definition, invalid ballot papers are included (on the
basis that these are still cast by people who have turned out to vote, even if they are discounted
from final results). This may lead to minor deviations between official turnout rates calculated
according to national specificities, and this uniform measure. ‘Registration rates’ are defined
according to the denominator of eligible people who could in principle register – which
sometimes involves a degree of estimation where it concerns populations of non-citizens in
decentralised countries (see sections 2.3 and 3.1).
The database comprises turnout data on the 2009 and 2014 European Parliament
elections for each available country, and the most recent municipal elections to which Directive
94/80/EC applied, held prior to 1 January 2019. The list of elections included is given in table
1.
Table 1: List of most recent municipal elections to which Directive 94/80/EC applied, prior to
1 January 2019
Code Country name Election date Local government level
AT Austria Various Gemeinden
BE Belgium 14/10/2018 Commune/Gemeente/Gemeinde
BG Bulgaria 25/10/2015 Obshtina
BG Bulgaria 01/11/2015 Obshtina (2nd round)
CY Cyprus 18/12/2016 Δήμοι (Dimoi) – Municipalities
CZ Czech Republic 05/10/2018 Obec
DE Germany Various Gemeinde
DE Germany Various Kreise/Kreisfreie Städte/Gemeinde
RSCAS/GLOBALCIT-PP 2021/2 © 2021 Author(s)
8The Electoral Participation of Mobile European Union Citizens in European Parliament and Municipal Elections
DK Denmark 21/11/2017 Kommuner
DK Denmark 21/11/2017 Regioner
EE Estonia 15/10/2017 Linnad/vallad
EL Greece 18/05/2014 Δήμοι (Dimoi) – Municipalities
ES Spain 24/05/2015 Municipio
FI Finland 09/04/2017 Kuntaa/kommuner
FR France 23/03/2014 Commune
FR France 30/03/2014 Commune (2nd round)
HR Croatia 21/05/2017 Općina/grad
HR Croatia 21/05/2017 Županija (counties)
HR Croatia 04/06/2017 Općina/grad (2nd round)
HR Croatia 04/06/2017 Županija (counties) (2nd round)
HU Hungary 12/10/2014 Települések (communities)
IE Ireland 23/05/2014 County (26), city (3) + city & county (2)
IT Italy 25/05/2014 Comune (selected regions)
IT Italy 30/05/2015 Comune (selected regions)
IT Italy 05/06/2016 Comune (selected regions)
IT Italy 11/06/2017 Comune (selected regions)
IT Italy 10/06/2018 Comune (selected regions)
LT Lithuania 01/03/2015 Savivaldybė
LT Lithuania 15/03/2015 Savivaldybė (2nd round)
LU Luxembourg 08/10/2017 Commune
Novadi (municipalities) (110) + republikas pilsētas
LV Latvia 03/06/2017
(republican cities) (9)
MT Malta 11/04/2015 Kunsill lokali
NL Netherlands 21/03/2018 Gemeente
PL Poland 21/10/2018 Gmina
PL Poland 04/11/2018 Gmina (2nd round)
PT Portugal 01/10/2017 Assembleia de Freguesia
PT Portugal 01/10/2017 Assembleia Municipal
PT Portugal 01/10/2017 Câmara Municipal
RO Romania 05/06/2016 Comune/oraşe
RO Romania 19/06/2016 Comune/oraşe (2nd round)
SE Sweden 09/09/2018 Kommun
SE Sweden 09/09/2018 Län
SI Slovenia 18/11/2018 Občine
SI Slovenia 02/12/2018 Občine (2nd round)
SK Slovakia 04/11/2017 Samosprávny kraj
SK Slovakia 10/11/2018 Obec; mesto; mestská časť
RSCAS/GLOBALCIT-PP 2021/2 - © 2021 Author(s)
9Derek S. Hutcheson and Luana Russo
counties in England;
counties, county boroughs and communities in Wales;
regions and Islands in Scotland;
districts in England, Scotland and Northern Ireland;
UK United Kingdom Various
London boroughs;
parishes in England;
the City of London in relation to ward elections for
common councilmen.
Key: ISO/EU country codes.
In the majority of Member States, elections to municipal authorities are held
simultaneously across the whole country on the same day, at regular intervals. In some cases
(for example, Austria, Germany and the United Kingdom (UK)), municipal elections are held
on different cycles in different parts of the country. In Germany, there have been several
exceptions made to these term limits to create a gradual convergence in the majority of the
federal states between municipal and European Parliament electoral cycles.
3.3 Brief Observations on Data Quality
Although this study arguably represents the most systematic attempt hitherto to map electoral
registration and turnout rates among mobile EU citizens in municipal and European Parliament
elections, it is still not completely exhaustive. There are a number of reasons for this.
First, electoral commissions often do not publish more than a general summary of
registration and turnout numbers for the whole electorate. It is generally possible to ascertain
overall registration and turnout statistics – but relatively rare for published registration and
turnout figures to be disaggregated further by citizenship, gender, age or other demographic
factors.
Second, the availability of registration/turnout data specifically on mobile EU citizens
is particularly patchy. When a breakdown by citizenship status does exist, it is more usually to
be found for registration figures than turnout data, for reasons explained below.
Only in a few cases (e.g., Bulgaria, Belgium, Denmark, Finland, Poland, Spain,
Sweden) are official registration rates published with a clear differentiation between national
and non-national citizens, particularly in municipal elections. Even then, the figures are
sometimes only published at polling station level (e.g., in Bulgaria and Poland) rather than
collated nationally; and they do not always distinguish EU and non-EU ‘foreign voters’ in
general.
Even when EU citizens are demarcated from national citizens in electoral registers, it is
unusual for published figures to give a breakdown of these voters by nationality. Only for a
handful of countries (Belgium, Cyprus, Denmark, France, Luxembourg, and Spain) were such
data available in respect of municipal elections; plus Austria, Estonia and Romania for
European Parliament elections. Even then, generally the numbers were found only in longer
analytical reports (rather than tabular electoral results), through secondary analysis (e.g.,
register-based academic studies in Denmark, Luxembourg, Spain) or through data available
from freedom of information requests (e.g., Belgium and Cyprus). In the main, however, we
know very little about the individual countries from which mobile voters EU hail.
RSCAS/GLOBALCIT-PP 2021/2 © 2021 Author(s)
10The Electoral Participation of Mobile European Union Citizens in European Parliament and Municipal Elections
For countries where external voting is possible in European Parliament elections, the
breakdown of resident and non-resident voters is not always made clear in each country’s
electoral statistics, nor the countries in which people voted.
A final problem is that in some cases different official documents (e.g., final official
certified documents with signatures and stamps, and official online databases of electoral
commissions) contain slightly different information. This means that a value judgement
sometimes has to be taken as to which of two different ‘official’ figures is the more accurate.
In the case of turnout and registration data, generally the more detailed of the two has been used
– unless it clearly predates the less detailed one, or the latter is more legally definitive.
Having identified some of the drawbacks of available data, we can briefly note the most
common causes of them:
• Registration procedures. Voter registration is often administered at municipal or
district level, which causes difficulties of data aggregation, particularly for external
voters (who are dispersed across the whole country’s electoral registers). In highly
decentralised states (such as the federal countries of Austria and Germany, and the UK),
it is particularly difficult to keep track of mobile EU voter turnout and external voting.20
• Lack of public data. In several countries, registration rates for mobile EU voters are
not published. For some, such as the UK, the data are simply not available.21 Other
countries aggregate data privately, but do not publicly release it except by request or to
official bodies. Formal or informal freedom of information requests by the current
authors or the network of FAIREU country experts obtained aggregate-level figures for
Belgium, Bulgaria, Czech Republic and Cyprus that were not otherwise in the public
domain.
• A particular lack of turnout data availability:
o In some cases, once the qualification to enter the list of eligible voters for a
particular election has been established, no further distinction is maintained on
the electoral list between different categories of voter, on the basis that all are
equally entitled to vote – making it impossible to differentiate their turnout rates.
o In other countries (such as the UK), turnout is recorded on voter lists manually.
Theoretically it would be possible to go through the marked registers and make
a manual count by type of voter, but it would require an army of researchers to
20
The United Kingdom has no unified national electoral register, but separate rolls maintained by 380 Electoral
Registration Officers in Great Britain, plus one in Northern Ireland [The Electoral Commission (2017), Electoral
registration at the June 2017 UK general election. Report on the UK Parliamentary general election held on 8
June 2017 (London: The Electoral Commission), p.3. Available online:
https://www.electoralcommission.org.uk/sites/default/files/pdf_file/Electoral-registration-report-July-2017.pdf,
accessed 20 June 2019]. Moreover, there are wildly differing estimates of how many UK citizens live overseas,
and how many of them would qualify to vote (enfranchisement is limited to those who have resided in the UK
over the previous 15 years, though the Conservative government quietly announced a plan in its March 2021
budget to change this).
21
Aside from the difficulty of compiling the information, no details of citizenship are recorded in the UK
electoral registers, and hence the statistics on mobile EU voters are not held by the Office of National Statistics
[Office for National Statistics (2018), ‘EU citizens registered to vote’,
https://www.ons.gov.uk/aboutus/transparencyandgovernance/freedomofinformationfoi/eucitizensregisteredtovot
e, accessed 23 March 2021].
RSCAS/GLOBALCIT-PP 2021/2 - © 2021 Author(s)
11Derek S. Hutcheson and Luana Russo
examine each page of each marked paper register for every municipality – an
impossible logistical task.22
o Different national electoral requirements on how to record/report official
election results mean that the distinction between EU and national citizens is
reported in some countries, but not in others.
4. Comparative Rate of Participation: An Overview
In this section, we summarise the available information on registration and turnout rates in the
most recent municipal elections prior to 2019, and in the 2009 and 2014 European Parliament
elections.
As the literature has widely debated, European Parliament elections are not quite
comparable with municipal (and national) ones for several theoretical reasons.23 We know from
academic literature that turnout levels vary substantially according to the type of election, and
normally European countries show higher turnout rates in national elections rather than in local
and European elections.24 Although both local and municipal elections are considered to be
‘second-order’ to national contests, local elections generally have higher levels of turnout than
European Parliament ones.25 The 2019 European Parliament election was the first ever to
record an increase in the average turnout rate compared with the preceding one.26
Despite this empirical limitation, investigation of EU citizens’ registration and turnout
rates is crucial. In fact, as shown by Gaus and Seubert, “low turnout is related to social
inequality of voting. Socially weak EU-citizens are overrepresented in the group of non-
voters”.27 Whilst the lack of individual-level data in the present study means that our focus is
primarily on analysing turnout comparatively rather than on engaging in causal investigation,
it is worth bearing in mind that the under-representation of mobile EU citizens is potentially a
democratic problem if their interests and concerns differ from those of other voters.
22
A pilot study along these lines was conducted in the UK in 2011, but was able to cover only a handful of
municipalities. See Collard, S. (2013), ‘Evaluating European Citizenship through Participation of Non-National
European Citizens in Local Elections: Case Studies of France and the UK’, Cuadernos Europeos de Deusto, No.
48, pp.135-73.
23
Carrubba, C., & Timpone, R. J. (2005), ‘Explaining Vote Switching across First-and Second-Order Elections:
Evidence from Europe’, Comparative Political Studies, 38(3), pp.260-281; Reif, K., & Schmitt, H. (1980), ‘Nine
Second-Order National Elections – A Conceptual Framework for the Analysis of European Election Results’,
European Journal of Political Research, 8(1), pp.3-44.
24
Franklin, M. N., & Hobolt, S. B. (2011), ‘The Legacy of Lethargy: How Elections to the European Parliament
Depress Turnout’, Electoral Studies 30(1), pp.67–76.
25
Golder, S.N., Lago, I., Blais, A., Gidengil, E., and Gschwend, T. (2017), Multi-Level Electoral Politics:
Beyond the Second-Order Election Model (Oxford: Oxford University Press); Lefevere, J., & Van Aelst, P.
(2014), ‘First-Order, Second-Order or Third-Rate? A Comparison of Turnout in European, Local and National
Elections in the Netherlands’, Electoral Studies, 35, pp.159-70.
26
Nord, L. (2019), ‘Second Thoughts on Second-Order Elections’, in DEMICOM rapport Euroflections (Mid
Sweden University, DEMICOM), p.47. Available online:
https://euroflections.se/globalassets/ovrigt/euroflections/euroflections_v3.pdf, accessed 23 March 2021.
27
Gaus, D., & Seubert, S. (2016), ‘Report on Voter Turnout for the European Parliament and Political Equality
in the EU’, bEUcitizen Project Deliverable, 8.6. Available online: https://www.uu.nl/sites/default/files/voter-
turnout-for-the-european-parliament-political-equality-in-the-eu.pdf, accessed 23 March 2021.
RSCAS/GLOBALCIT-PP 2021/2 © 2021 Author(s)
12The Electoral Participation of Mobile European Union Citizens in European Parliament and Municipal Elections
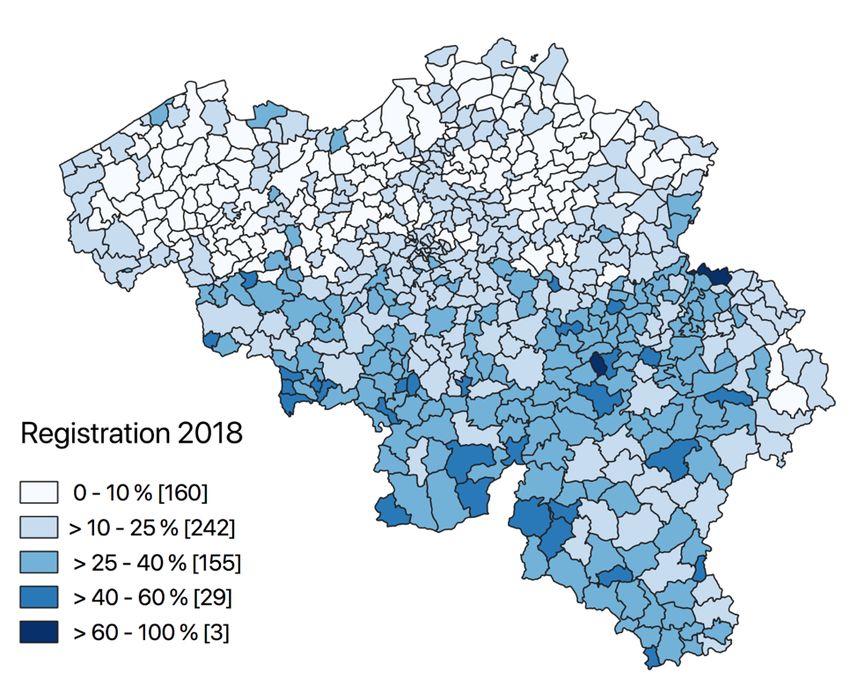
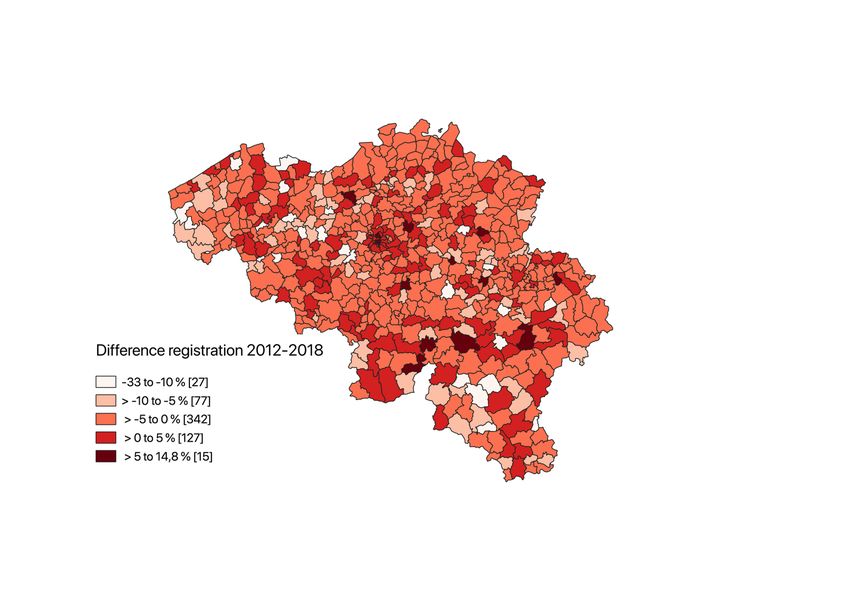
4.1 Municipal Elections 2014-18
As noted above, the data have been combined from numerous official sources and represent the
best estimates available. The number of EU citizens of voting age (from which registration rates
are calculated) is estimated from Eurostat data, except in a few cases where other figures are
verifiably more accurate.28
Table 2 shows headline registration rates for the most recent municipal elections in each
EU country prior to 2019. It is arranged in order of registration rates, as a proportion of those
eligible.
In the countries with automatic registration, registration is at or close to 100 per cent of
the eligible population of mobile EU voters. This is in sharp contrast to countries where
registration is voluntary, where the highest registration rate (in Spain) is only 26 per cent.
Registration rates are particularly low in the Czech Republic (where only 2 per cent of voting-
age mobile EU citizens are registered to vote), Bulgaria, Poland and Greece. Bulgaria also has
the smallest cohort of EU citizens on the electoral register, with only 414 individuals across the
entire country able to vote in its 2015 local elections. In some countries consolidated
registration data are not available, due to the decentralised nature of registration.
Unfortunately, we cannot follow the behaviour of all 14.3 million mobile EU citizens
in municipal elections, since some of the countries for which detailed data on mobile EU
registration figures are lacking are also those with some of the largest populations of non-native
mobile EU citizens (particularly Germany and the UK). But focusing on the 21 countries for
which registration data are available, the official figures allow us to find electoral registrations
in their countries of residence for 2.2 million mobile EU citizens, out of around 6.8 million who
could potentially be eligible in these countries.
Table 2: Registration rates amongst mobile EU citizens, most recent municipal elections
(2014-18)
Estimated mobile EU Registered EU Registered as % of mobile EU
Country population of voting age voters voting age population
LV Latvia 5,386 15,053 279.5%
HU Hungary 74,184 108,994 146.9%
SI Slovenia 17,579 20,510 116.7%
FI Finland 81,051 81,051 100.0%
28
Eurostat data were used as to approximate the number of potential EU voters, unless a verifiably more
accurate number was available from the Member State itself (e.g., Ireland in 2009, when the Eurostat figure for
the number of non-Irish citizens was almost three times lower than the national census records indicated).
Eurostat data on resident non-national EU citizens in each country were utilised (dataset migr_pop1ctz:
Available online http://appsso.eurostat.ec.europa.eu/nui/show.do?dataset=migr_pop1ctz&lang=en). Eurostat data
are classified in 5-year bands, which means that the closest approximation to a voting-age population (aged 18
and over, and 16 and over in Austria) can be obtained by taking the number of EU citizens over the age of 15
and subtracting the 15 to 17 year-olds (15 year-olds only in Austria). As a proxy measure, this was assumed to
be 3/5 (and 1/5 in Austria) of the number of 15-19 year-olds. This methodology comes with three caveats: (1) It
assumes a uniform distribution of people across the 15-20 year-old age band; (2) Eurostat data are based on
returns on 1 January of the year of the election, not on election day; and (3) it does not take account of additional
restrictions (e.g., on minimum length of residence) that may disqualify some of the voting-age EU population
from electoral rights. Notwithstanding these limitations, in the few cases that it is possible to cross-reference the
population estimate with actual election registers in automatic registration systems, the figures are very close.
RSCAS/GLOBALCIT-PP 2021/2 - © 2021 Author(s)
13Derek S. Hutcheson and Luana Russo
MT Malta 14,021 14,021 100.0%
RO Romania 40,846 40,846 100.0%
SE Sweden 535,857 535,857* 100.0%
SK Slovakia 67,768 67,768* 100.0%
LT Lithuania 4,870 4,524 92.9%
DK Denmark*** 173,480 157,879 91.0%
ES Spain 1,703,466 442,127 26.0%
FR France 1,250,364 278,000 22.2%
CY Cyprus 92,962 16,740 18.0%
BE Belgium 748,267 130,559 17.4%
LU Luxembourg 192,603 31,288 16.2%
IT Italy** 1,246,321 182,337 14.6%
PT Portugal 106,819 12,992 12.2%
EL Greece 163,855 19,102 11.7%
PL Poland 27,464 1,845 6.7%
BG Bulgaria 11,779 414 3.5%
CZ Czech Republic 202,222 4,038 2.0%
AT Austria 542,968 n.a n.a
DE Germany 3,484,779 n.a n.a
EE Estonia 14,944 n.a n.a
HR Croatia 13,760 n.a n.a
IE Ireland 342,722 n.a n.a
NL Netherlands 420,842 n.a n.a
UK United Kingdom 2,921,319 n.a n.a
Source: Multiple official sources29
Notes:
*Figures refer to all non-national electorate, not just EU voters
**Figures for Italy reflect registration details from 2016 – not a particular municipal election
***Figures for Denmark are for 91 out of 98 municipalities.
29
For a full list of sources, see the FAIREU turnout database (https://faireu.ecas.org/). ‘Estimated EU population
of voting age’ reflects the number of resident EU citizens over the age of 18 (16 in Austria), calculated from
Eurostat data, unless verifiably more accurate national data are available. This indicator does not take account of
other restrictions that may prevent some people over 18 from eligibility (such as minimum residence
requirements). Where registration rates exceed 100 per cent, this is presumably due to inaccurate
(underestimated) data by national authorities on the number of mobile EU citizens present in the country. It is
assumed that electoral authorities could not register somebody unless they exist, so the number of resident
mobile EU citizens could not logically be lower than the number registered to vote. In countries where automatic
registration means that the entire population of eligible citizens is registered, this is recorded as the denominator
instead of the Eurostat estimates. No data are included for Germany, Austria and the UK since their local
elections take place on a rolling basis and there is no definitive census date which can be used, nor centralised
data on turnout.
RSCAS/GLOBALCIT-PP 2021/2 © 2021 Author(s)
14The Electoral Participation of Mobile European Union Citizens in European Parliament and Municipal Elections
Table 3: Electoral weight of mobile EU voters (registered and potential), municipal elections
2014-18
Difference: EU citizens’
Total EU citizens as proportion of population
population % of Registered EU >18 years and of
>18 years population >18 voters as % of registered electorate (as
Country (millions) years all voters % of pop.)
LU Luxembourg 0.5 40.6% 10.97% -29.6%
CY Cyprus 0.7 13.7% - -
IE Ireland 3.5 9.9% - -
BE Belgium 9.1 8.2% 1.60% -6.6%
AT Austria 7.4 7.3% - -
SE Sweden* 8.0 6.7% 7.15% 0.4%
UK United Kingdom 51.9 5.6% - -
DE Germany 69.0 5.1% - -
ES Spain 38.1 4.5% 1.26% -3.2%
MT Malta 0.4 3.9% 7.09% 3.2%
DK Denmark 4.6 3.8% 3.47% -0.3%
NL Netherlands 13.8 3.1% - -
IT Italy** 50.7 2.5% - -
FR France 51.4 2.4% 0.61% -1.8%
CZ Czech Republic 8.7 2.3% 0.05% -2.3%
HU Hungary 3.5 2.1% 1.33% -0.8%
FI Finland 4.4 1.8% 1.85% 0.0%
EL Greece 9.0 1.8% 0.19% -1.6%
SK Slovakia* 4.4 1.5% 1.51% 0.0%
EE Estonia 1.1 1.4% - -
PT Portugal 8.5 1.3% 0.14% -1.1%
SI Slovenia 1.7 1.0% 1.21% 0.2%
HR Croatia 3.4 0.4% - -
LV Latvia 1.6 0.3% 1.04% 0.7%
RO Romania 16.0 0.3% 0.22% 0.0%
LT Lithuania 2.4 0.2% 0.23% 0.0%
BG Bulgaria 6.0 0.2% 0.01% -0.2%
PL Poland 31.1 0.1% 0.01% -0.1%
Sources/key: as table 2
What is the ‘electoral weight’ of mobile EU citizens in each country? Table 3 – arranged
in order of the voting-age mobile EU population – casts light on this. Looking at the registered
voters of all types, mobile EU citizens have least influence in Poland, Bulgaria, the Czech
Republic, Portugal and Greece, where they accounted for less than 0.2 per cent of all people on
the electoral rolls in the most recent municipal elections prior to 2019. At the other end of the
scale, Luxembourg not unexpectedly has the highest proportion of mobile EU citizens amongst
RSCAS/GLOBALCIT-PP 2021/2 - © 2021 Author(s)
15Derek S. Hutcheson and Luana Russo
its electorate, accounting for around 11 per cent of all registered voters, followed by Sweden,
Malta and Denmark, where they comprised 3 to 7 per cent of the registered electorate.30
The number of mobile EU voters can be compared with population statistics to indicate
in which countries they are over- and under-represented in the electoral process. In a few
countries – Hungary, Romania, Denmark, Slovakia, Finland, Sweden, Lithuania and Slovenia
– the proportion of mobile EU voters as a share of the electorate is approximately in line with
their share of the population, with some small variations. At the other end of the scale, mobile
EU voters are statistically under-weighted in the countries with very low registration rates such
as the Bulgaria and Poland (which have relatively few mobile EU citizens in the first place) and
the Czech Republic, Greece and Portugal (which have more resident EU citizens but relatively
few who are registered to vote). Of particular interest are the states with relatively large foreign
populations, but fairly low registration rates – which means that the interests of the mobile EU
voters are particularly under-represented in determining municipal affairs. In Luxembourg, the
combination of a 5-year residence restriction (see section 4.1.2 below) and low rates of
voluntary registration mean that mobile EU voters, even though they comprise 11 per cent of
the registered electorate, are still substantially under-represented compared with the 40 per cent
of the population that they comprise. A similar situation exists in Belgium, where mobile EU
citizens are 8.6 per cent of the population but only 1.6 per cent of the electorate, underweighting
them by a factor of five. In France, mobile EU citizens comprise 2.4 per cent of the population
but only 0.6 per cent of the electorate.
Table 4: Turnout rates of EU mobile voters, municipal elections 2014-18
Overall election
Registered EU EU Turnout as % of Turnout as %
Countries turnout (all
voters turnout EU registered of EU eligible
voters)
CY Cyprus 16,740 10,977 65.6% 11.8% -
DK Denmark 157,879 41,295 26.2% 23.8% 70.8%
FI Finland 81,051 14,252 17.6% 17.6% 58.9%
PL Poland 1,845 1,381 74.9% 5.0% 55.2%
RO Romania 40,846 1,713 4.2% 4.2% 48.2%
Sources: Multiple official sources
Data on actual turnout rates (as opposed to registration rates) are less common, for the
reasons outlined in section 2. Table 4 presents the turnout figures for a selection of countries
where turnout by citizenship is recorded separately. Where registration is voluntary and requires
bureaucratic hurdles to be overcome, the majority of voters who enter the electoral roll then go
on to vote. In the three countries in table 4 that have automatic registration, the turnout rates
amongst registered voters are much lower.
To take account of the different methods of registration and the self-selection involved,
the registration rate relative to the voting-age population of mobile citizens can be used as a
comparable indicator. Table 4 shows that the overall turnout rates as a proportion of those who
could potentially have voted were higher in Denmark and Finland (which had automatic
registration) than in Cyprus and Malta (which had active registration) – but that the reverse was
30
With the caveat that the Swedish figure includes all registered non-Swedish voters. EU citizens probably
account for about a third of that total, but the exact number is not recorded separately. See Hutcheson, D.S. and
Bevelander, P. (2018), FAIREU Key Country Report: Electoral Participation in Sweden (Florence: European
University Institute/RSCAS), p.10. Available online: http://cadmus.eui.eu/handle/1814/59567, accessed 23
March 2021.
RSCAS/GLOBALCIT-PP 2021/2 © 2021 Author(s)
16You can also read