FY 2021 Site Sustainability Plan - BROOKHAVEN NATIONAL LABORATORY - Office of Science - Brookhaven National ...
←
→
Page content transcription
If your browser does not render page correctly, please read the page content below
BROOKHAVEN NATIONAL LABORATORY

               FY 2021 Site
              Sustainability
                      Plan

Office of
Science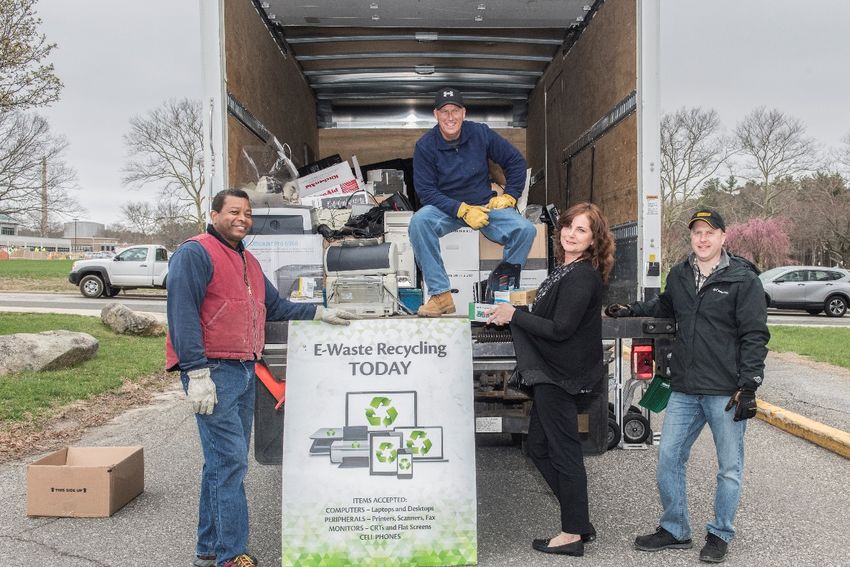
This page is intentionally blank.
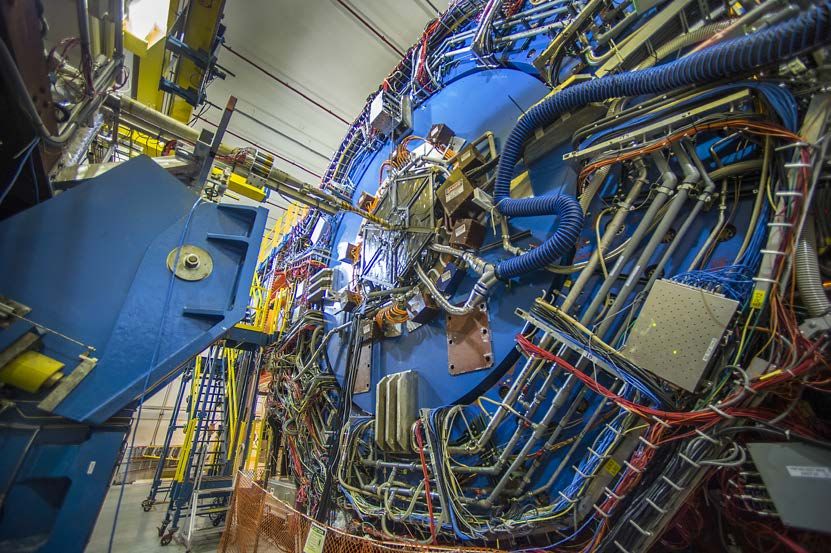
Table of Contents

LIST OF TABLES AND FIGURES ................................................................................................... III

I. EXECUTIVE SUMMARY AND EXECUTIVE SUMMARY TABLE .....................................................1

II. MISSION CHANGE .................................................................................................................11

II. PERFORMANCE REVIEW AND PLAN NARRATIVE ..................................................................13
   Energy Management ......................................................................................................................... 13
   Water Management .......................................................................................................................... 21
   Waste Management .......................................................................................................................... 26
   Fleet Management ............................................................................................................................ 29
   Renewable Energy ............................................................................................................................. 32
   Sustainable Buildings ......................................................................................................................... 34
   Acquisitions & Procurement .............................................................................................................. 37
   Measures, Funding, & Training .......................................................................................................... 39
   Travel & Commute............................................................................................................................. 41
   Fugitives & Refrigerants..................................................................................................................... 44
   Electronic Stewardship ...................................................................................................................... 46
   Resilience .......................................................................................................................................... 50

APPENDIX A: DASHBOARD DATA ACCURACY SELF-CERTIFICATION ..........................................53

APPENDIX B: EXCLUDED BUILDINGS SELF-CERTIFICATION PROCESS ........................................54

APPENDIX C: COMPREHENSIVE SCORECARD ............................................................................55

APPENDIX D: LIST OF ACRONYMS & ABBREVIATIONS ..............................................................64

                                                                            ii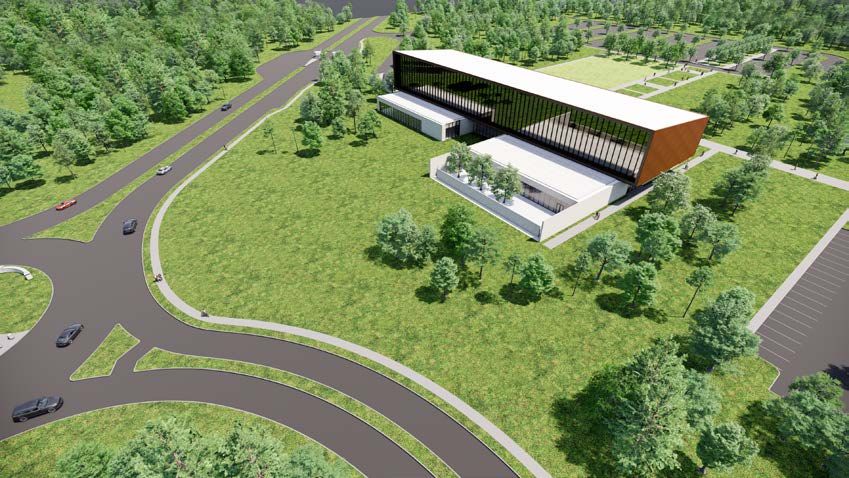
List of Tables and Figures

                                                              List of Tables

Table 1: Annual Change Gal/GSF Water Use (1999-2020)....................................................................... 22
Table 2: Guiding Principle Compliant Buildings and GSF ......................................................................... 34
Table 3: Sustainability Funding .............................................................................................................. 40
Table 4: Fugitive GHG Emissions ............................................................................................................ 44
Table 5: Emergency Management Five-Year Assessment Plan................................................................ 52
Table 6: Emergency Management Drill and Exercise Five-Year Plan ....................................................... 52

                                                              List of Figures

Figure 1: EUI for Non-Excluded Buildings ............................................................................................... 14
Figure 2: BNL Historical and Projected Electricity ................................................................................... 18
Figure 3: Electricity and REC Cost – Actual and Projected....................................................................... 19
Figure 4: Fuel Usage – Actual and Projected .......................................................................................... 20
Figure 5: Annual Potable Water Use (1999-2020) .................................................................................. 21
Figure 6: 2020 Potable Water Utilization ............................................................................................... 23
Figure 7: BNL’s Recycling Rate ............................................................................................................... 26
Figure 8: Tons of Municipal Solid Waste Disposed ................................................................................. 27
Figure 9: Total Greenhouse Gas Emissions............................................................................................. 29
Figure 10: Vehicle Inventory Breakdown ............................................................................................... 30
Figure 11: Fleet Fuel Usage.................................................................................................................... 30
Figure 12: NSERC Solar Array Output ..................................................................................................... 32
Figure 13: Scope 3 GHG Emissions ......................................................................................................... 41
Figure 14: Annual Tons of Electronics Collected for Recycling ................................................................ 47

                                                                       iii
I. Executive Summary and Executive Summary Table

Brookhaven Science Associates (BSA) is pleased to submit this annual Site Sustainability Plan for
Brookhaven National Laboratory (BNL). Effectively managing such a large, diverse portfolio of programs
takes many committed individuals working towards a common goal. This document is the work of a large
cross-functional team of BSA employees both within the science directorates as well as the support or
operations directorates.

BNL is operated and managed for the Department of Energy Office of Science (DOE-SC) by BSA, a
partnership formed by Stony Brook University (SBU) and Battelle Memorial Institute. BNL is staffed by
over 2,600 research and support employees and hosts an even greater number of facility users, guest
researchers, and scientists annually. The Laboratory operates from an extensive campus located in Upton,
New York, on 5,320 acres with approximately 4.9 million gross square feet (gsf) of space in over 300
buildings.

BNL conceptualizes, designs, builds, and operates major scientific facilities and makes them available to
university, industry, and government researchers in support of the SC mission. The sustainability vision
for BNL leverages this unique combination of access to diverse research talent, stewardship for a
significant national research infrastructure, and a location in the energy intensive northeastern United
States.

As a result, BNL is well established as a northeastern regional resource for sustainability expertise and is
effectively utilizing its physical infrastructure to demonstrate sustainability technology. This approach to
development and deployment of technology, combining the unique resources of both research and
operations, is the vision of the BNL Site Sustainability Plan (SSP) to help ensure a successful future for our
nation.

The Laboratory’s efforts in sustainability have been consistent over the last several years and they focus
on four broad principles:

    1. Striving to be climate neutral through reducing energy use and effective energy management;
    2. Lowering the environmental impact of the campus through sustainable infrastructure;
    3. Leveraging research in conjunction with our operations and in support of the northeastern region;
       and
    4. Fostering a culture of sustainability with our employees and our community.

Fiscal Year 2020 presented unique challenges as we faced the global COVID-19 pandemic, which caused
BNL to declare a Continuity of Operations Plan (COOP) Event. We successfully transitioned into Minimum
Safe (Min-Safe) operations, diligently planned recovery operations, maintained critical infrastructure
throughout, and implemented the Resumption of Operations Plan (ROOP). Throughout the COVID-19
pandemic, all facilities remained operational and we were able to successfully support all essential
operations.

Despite the global challenge, the Laboratory remains strongly committed to supporting and achieving the
targets in the DOE Strategic Sustainability Performance Plan (SSPP). Leadership in sustainability is
demonstrated through the Laboratory’s management practices, stewardship of the BNL campus, as well

                                                      1
as our research and education programs. The efforts in sustainability are communicated widely across the
Laboratory, and the Senior Leadership team remains actively engaged.
BNL’s energy management program continues to be the centerpiece of our Sustainability program. We
continue to maintain solid relationships with local utility providers ensuring cost effective power rates for
operating the energy intensive user facilities and general infrastructure. BNL collaborates with the local
utilities to leverage purchasing power and assist in renewable energy production to jointly support the
goals of BNL and the New York region.
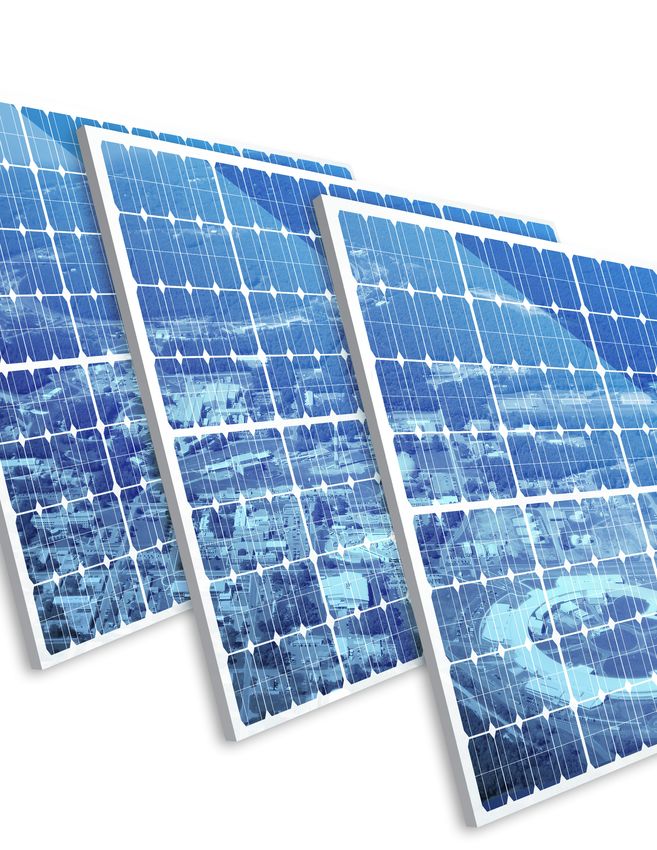
BNL continues to host the Long Island Solar Farm (LISF), a solar photovoltaic (PV) power plant, developed
through a collaboration that included BP Solar, the Long Island Power Authority (LIPA), and DOE. The LISF,
located on the BNL site, began delivering power to the LIPA grid in November 2011. The LISF is made up
of 164,312 PV panels and can produce up to 32 MW of electricity.
Additionally, the Laboratory has developed the Northeast Solar Energy Research Center (NSERC) on its
campus that serves as a solar energy research and test facility for the solar industry. The mission of the
NSERC is to support the expansion of solar power by providing high-quality data, field-testing, analyses,
and solar energy expertise to address technical, economic, environmental, and policy issues facing solar
power deployment in northeastern climates. The NSERC will be a proving ground for BNL and our
industrial partners to test new solar technologies, including electrical inverters, storage devices, and solar
modules, which effectively adds solar energy research to the user facility portfolio of BNL.
These projects demonstrate how BNL is continuing to collaborate with many organizations both internally
and externally to enhance research at the Laboratory with the sustainability goals in mind. Staff members
from the BNL Environment, Biology, Nuclear Science, and Nonproliferation (EBNN) Directorate, Facilities
& Operations (F&O) Directorate, Information Technology Division (ITD), and the DOE Brookhaven Site
Office (BHSO) have been instrumental in preparing our research agenda and developing a plan to bring it
to fruition.
The Comprehensive Scorecard illustrates the areas we’ve been extremely successful, and they include
compliance with the Guiding Principles (GPs) of High Performance Sustainable Buildings (HPSB),
construction and demolition recycling, fleet management, and sustainable purchasing.
The Laboratory has made significant progress this year in meeting the goals of the SSPP. We have
challenges that we are working on creative solutions to overcome. This coming year we will be maintaining
focus on those areas that are preforming well and will be concentrating on making improvements in those
areas that are not on track to meeting the requirements, including evaluating zero emission buildings,
GHG emissions, as well as data center efficiencies.
Sustainability remains an important focus for BNL. BSA and BHSO work collaboratively on these efforts.
We continue with our quarterly meetings to ensure that we are on track to meet the goals as well as to
discuss challenges in meeting these goals. This is a marathon, not a sprint and requires a strong team
effort to ensure that we continue to press forward in doing our part to protect the environment. We are
on a very good path.
A copy of the Executive Summary Table is provided below, highlighting plans for anticipated performance
towards DOE targets as a guide.
2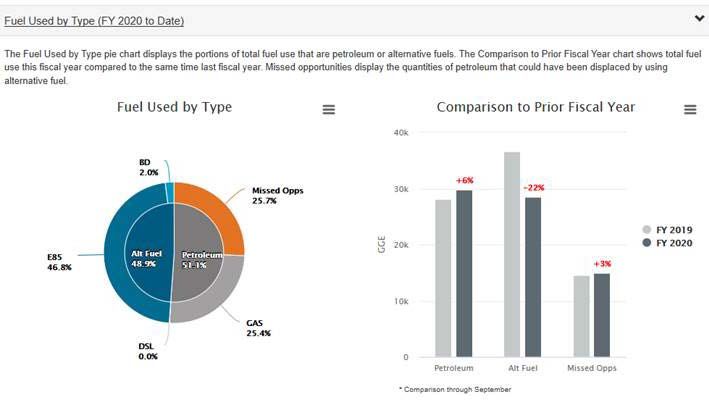
Overall Risk of
                              Current Performance                  Planned Actions &
Prior DOE Goal                                                                                      Non-
                              Status                                 Contributions
                                                                                                 Attainment
Energy Management
30% energy intensity (Btu FY20 energy intensity was          A second Utility Energy Service       Medium
per gross square foot)    28.1% below FY03, 3%               Contract (UESC) II (or self-
reduction in goal-subject below 2015.                        funded effort) effort focusing
buildings by FY 2015 from                                    on Building HVAC controls,
a FY 2003 baseline                                           temperature set-back, re-heat
and 1.0% Year-over-year                                      minimization and lighting is
(YOY) thereafter.                                            planned. Continue emphasis
                                                             on Temperature Set-back
                                                             policy.
Energy Independence and       83 Buildings covering          Continue audits meeting the 4-          Low
Security Act (EISA) Section   706,859 sq. ft. were           year cycle.
432 continuous (4-year        audited in FY20.
cycle) energy and
water evaluations.
Meter all individual          Eight new smart meters         Continue maintaining and                Low
buildings for electricity,    were added in FY20.            expanding metering
natural gas, steam, and       Current status is 99% of       installations, with an emphasis
water, where cost-            electricity, 100% of natural   on potable water make-up for
effective and appropriate.    gas, +90% of steam are         cooling towers. This process has
                              metered. Most potable          already started.
                              water is used for cooling
                              tower make-up. We are
                              currently metering ~25% of
                              cooling tower make-up and
                              adding meters regularly.
Water Management
20% potable water             Potable-water usage fell       Completion of Well No. 12 in          Low to
intensity (Gal per gross      from 931 million               FY21.                                 Medium
square foot) reduction by     gallons/year in FY 1999
FY 2015 from a FY 2007        (average of 2.55 million       BNL will continue to implement
baseline and 0.5%             gallons per day) to about      BNL’s Water Management Plan
YOY thereafter.               389 million gallons/year in    and reduce water usage by
                              FY 2020 (average of 1.07       implementing best-
                              million gallons per day), a    management practices.
                              reduction of 62.0%. BNL’s
                              annual water use intensity     BNL will continue to utilize
                              has decreased from 101         water-efficient processes and
                              gallons per square foot to     plumbing fixtures to conserve
                              80.9 gallons per square        water in new construction
                              foot, a 20.1% water usage      buildings and renovations.
                              reduction since base-year
                              2007.

                                                      3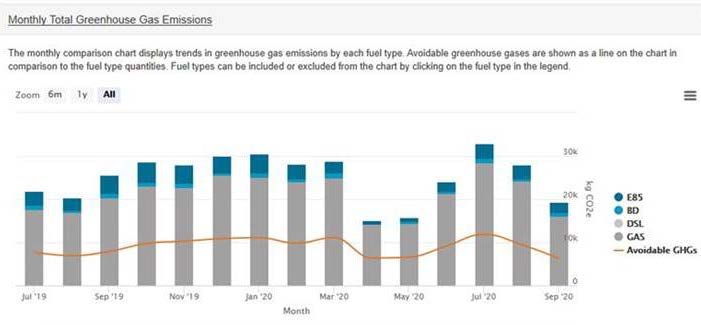
Overall Risk of
                              Current Performance                Planned Actions &
Prior DOE Goal                                                                                     Non-
                              Status                               Contributions
                                                                                                Attainment
Non-potable freshwater        N/A                          N/A                                      N/A
consumption (Gal)
reduction of industrial,
landscaping, and
agricultural (ILA). YOY
reduction; no set target.
Waste Management
Reduce at least 50% of       BNL’s recycling rate          • Continue to recycle >50%               Low
non- hazardous solid         counting only day-to-day      • Fund Pollution Prevention
waste, excluding             activities is 53% and jumps     Opportunities
construction and             to 83.9% if composting of     • Determine relationship
demolition debris, sent to site trees and brush for          between working-at-home
treatment and disposal       landscaping needs is            and recycling rates.
facilities.                  included.
Reduce construction and Construction & Demolition          Use FY21 to collect all C&D              Low
demolition materials and Debris (C&D) generation           data in order to establish a
debris sent to treatment rates have been increasing        baseline for YOY reduction
and disposal facilities. YOY over the last several years   goals in future years.
reduction; no set target. because of site
                             improvement activities. As
                             site development
                             progresses, that trend can
                             be expected to continue
                             making it impossible to set
                             reduction goals.
Fleet Management
20% reduction in annual                                    41 new Telematics have been              Low
petroleum consumption                                      received and will be installed by
by FY 2015 relative to a FY                                the end of February in the
2005 baseline and 2.0 %                                    remaining vehicles that
YOY thereafter.                                            currently do not have units. Full
                                                           scope of usage on the entire
                                                           Fleet can be determined
                                                           including idling time. Quarterly
                                                           spot checks will be
                                                           implemented to ensure vehicles
                                                           are not running unattended,
                                                           operating efficiently and are
                                                           properly maintained.

                                                     4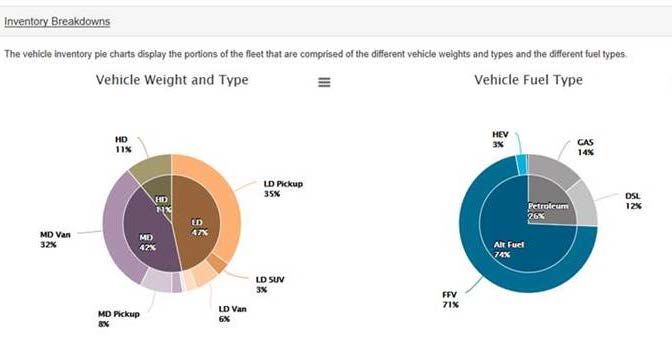
Overall Risk of
                               Current Performance               Planned Actions &
Prior DOE Goal                                                                                    Non-
                               Status                              Contributions
                                                                                               Attainment
10% increase in annual                                     E-85 fuel usage is expected to        Medium
alternative fuel                                           increase with the new vehicle
consumption by FY 2015                                     acquisitions due for 2021.
relative to a FY 2005
baseline; maintain 10%
increase thereafter.
75% of light duty vehicle                                  Fleet management will                 Medium
acquisitions must consist                                  continue to work with the
of alternative fuel vehicles                               General Services Administration
(AFV).                                                     (GSA) to order and utilize
                                                           alternative-fueled and newer,
                                                           more fuel-efficient vehicles
                                                           during every replacement cycle.

Clean & Renewable Energy
“Renewable Electric       BNL purchased 22,000,000         BNL will continue to operate            Low
Energy” requires that     kilowatt hours (kWh) of          the NSERC facility and provide
renewable electric energy RECs for 2020 to meet the        for further expansion when
account for not less than “Renewable Energy”               sufficient funds are identified.
7.5% of a total agency    requirement of 7.5%.             Renewable energy credit (REC)
electric consumption by BNL’s RECs have been and           purchases will continue in order
FY 2013 and each year     will continue to be              to meet applicable renewable
thereafter.               purchased through a              energy and clean energy goals.
                          competitive solicitation
                          process.                         Renewable energy systems,
                                                           especially solar hot water, are
                               In 2020 BNL’s 816 kW        considered in all new
                               Northeast Solar Energy      construction and major building
                               Research Center (NSERC) renovations. To date, it has
                               facility produced 977,967 been difficult to find cost
                               kWh that were consumed effective projects.
                               by BNL’s facilities. The
                               RECs are retained by BNL BNL continues to pursue
                               and are not sold. The total opportunities to implement a
                               of the REC’s and the NSERC microgrid on site and are
                               output was 8.2% of BNL’s continuing discussions with
                               electric consumption.       energy storage providers and
                                                           various governmental agencies
                                                           to explore options such as
                                                           hosting large utility scale
                                                           battery storage systems on site.

                                                       5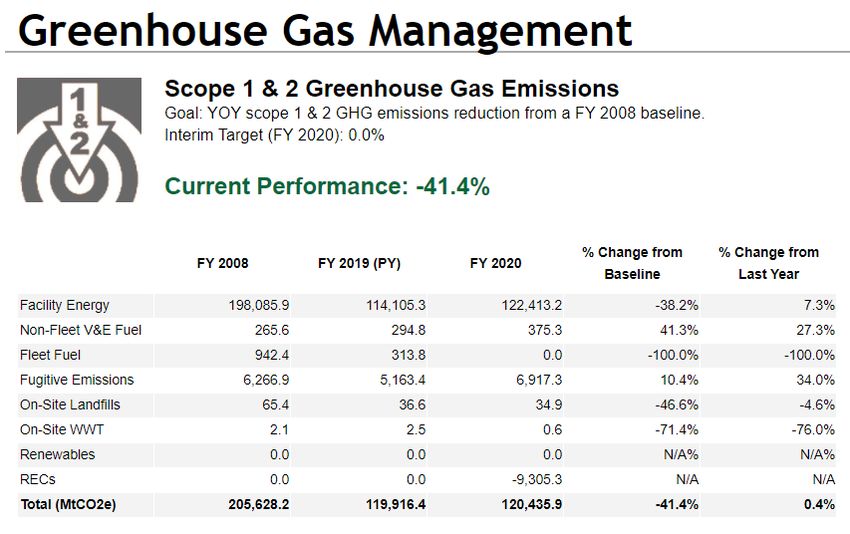
Overall Risk of
                             Current Performance                 Planned Actions &
Prior DOE Goal                                                                                   Non-
                             Status                                Contributions
                                                                                              Attainment
Continue to increase non-    A small residential solar     New facilities such as the SUSC        Low
electric thermal usage.      thermal space heating         are evaluated for solar thermal
YOY increase; no set         system was installed in       opportunities. To-date the
target but an indicator in   Building 30 as part of a      economics have not supported
the OMB                      research demonstration        new installations. BNL will
scorecard.                   project. The system has       continue to evaluate various
                             fallen into disrepair but     options such as solar domestic
                             there are plans to bring it   hot water heating and pre-
                             back into service.            heating, solar wall make-up air
                                                           pre-heating, and other options.
Green Buildings
At least 15% (by count) of  Currently 8 buildings have     Review underway to ensure              High
owned existing buildings    achieved 100% of the 2008      compliance with 2016 GO+P’s
to be compliant with the    GP’s and an additional 7
revised Guiding Principles  buildings are considered
(GP’s) for Sustainable      meeting them as they have
Buildings by FY 2021, with  achieved Leadership in
annual progress             Energy & Environmental
thereafter.                 Design (LEED) Gold or
                            higher status. This
                            represents 20% of non-
                            excluded buildings.
Acquisition & Procurement
Promote sustainable          • BNL has incorporated        •   BNL will perform an              Medium
acquisition and                  contract clauses              assessment of their
procurement to the               within its vendor             sustainability program in
maximum extent                   contracts that                order to identify
practicable, ensuring            designate                     conformance status and
BioPreferred and                 environmentally               areas for improvement.
biobased provisions and          preferred products        •   BNL will continue to
clauses are included in all      (EPP), services, and          establish Environmental
applicable                       equipment.                    Management System
contracts.                   • BNL continued to                (EMS) objectives to
                                 provide requisitioners        improve EPP purchasing
                                 EPP purchasing                performance for a wide-
                                 training.                     range of products including
                             • BNL successfully                bio-preferred.
                                 funded two Pollution      •   BNL will enact their
                                 Prevention projects           Pollution Prevention
                                 that involved                 Opportunity Program with
                                 replacement of                a focus on EPP conforming
                                 products with bio-            product replacements.
                                 preferred alternatives.

                                                      6
Overall Risk of
Current Performance Planned Actions &
Prior DOE Goal Non-
Status Contributions
Attainment
• BNL received the
“Green Electronics
Council’s 2020
Electronic Product
Environmental
Assessment Tool
(EPEAT) Purchaser
Award” at the Gold
Level; and the “2020
GreenBuy Prime”
award for winning the
GreenBuy Gold Award
three times.
• BNL’s weakness is the
ability to collect data
for reporting
purposes.
Measures, Funding, & Training
Site set annual targets for Internally funded energy BNL, like other DOE sites, has Low to Medium
sustainability investment conservation and been increasingly using third-
with appropriated funds sustainability related party financing options that
and/or financed contracts initiatives include a utilize cost savings to pay for
for implementation. continuation of best the projects. BNL has low
practices, with continued energy rates to operate its’
emphasis on temperature research programs, which
setback during unoccupied makes it difficult to find cost-
periods. Due to the impact effective projects.
of COVID-19, little
resources were able to be Due to marginal economics the
directed to internal energy 2nd UESC effort was put on hold
conservation efforts. while BNL evaluates options,
including self-funding or a
partnership with the New York
Power Authority (NYPA). We
expect to make a decision in
early FY21.
Training continues for various
staff members to maintain their
respective certifications for
energy, engineering,
environmental and other
related capabilities.
7Overall Risk of
Current Performance Planned Actions &
Prior DOE Goal Non-
Status Contributions
Attainment
Electronic Stewardship
End of Life: 100% of used • BNL’s equipment Continue the current high level Low
electronics are reused or tracking system allows of performance.
recycled using 100% collection of
environmentally sound tagged electronics for
disposition options each recycling through an
year. R2 Certified recycler.
• BNL held one home
electronics pick-up
day.
• BNL received the
“Green Electronics
Council’s 2020 EPEAT
Purchaser Award” at
the Gold Level.
Data Center Efficiency: Additional metering is in Meeting the PUE of 1.5 for the Low for the
Establish a power usage progress for 4 of the existing data centers will new data
effectiveness target for existing 8 data centers. require a significant center.
new and existing data investment. 4 of the 8 existing
centers; The new data center in data centers require the Medium for
discuss efforts to meet Building 725 is estimated installation of new metering, the existing
targets. to be in operation in June which is partially in progress. data centers.
of 2021 with a PUE ofOverall Risk of
Current Performance Planned Actions &
Prior DOE Goal Non-
Status Contributions
Attainment
Emergency at BNL if Complete five joint self- Low
necessary. assessments with BHSO and ten
• Emergency Operations partial self-assessments with
Center (EOC) is fully Office of Emergency
operational and kept in Management (OEM).
“warm mode” during Conduct beyond design basis Medium
normal business full scale exercise. Exercise will
hours” to respond to simulate a catastrophic
an operational emergency involving multiple
emergency within facilities onsite without any
thirty minutes of outside assistance.
declaration. Complete the All Hazard Survey Low
• All joint and partial triennial review and updates
assessments were Complete the Triennial review Low
completed in required for Building 735
compliance with DOE Emergency Preparedness
O 151.D. Hazard Assessment (EPHA).
• Continuity of Perform quarterly DOE Low
Operations Plan accountability drills on behalf of
(COOP) Continuity of the U.S. Office of Human
Emergency Response Capital.
Group (CERG) is fully Perform semi-annual CERG & Low
staffed. Ensuring all DERG trainings and meetings.
mission essential Perform annual COOP Low
functions are operating awareness briefing for BNL
without interruption. employees.
• Required building Continue to support COVID-19 Low
evacuations were response activities for BNL.
completed and local Continue to support Safeguards Low
emergency plans and Security with Hazardous
updated. materials analysis with respect
• Supported COVID-19 to the DBT.
response activities for
BNL.
• Supported Safeguards
and Security with
Hazardous materials
analysis with respect to
the Design Based
Threat (DBT)
9Overall Risk of
Current Performance Planned Actions &
Prior DOE Goal Non-
Status Contributions
Attainment
Multiple Categories
YOY scope 1 & 2 34% reduction comparing Continued efforts for Energy Medium
Greenhouse Gas (GHG) FY20 to FY08 baseline. Intensity Reductions through
emissions reduction from UESC’s, Energy Savings
a FY 2008 baseline. Performance Contracts (ESPC’s)
and other methods including
self-funding. Continued
hydropower allocation, REC
purchases and operation of the
NSERC Solar photovoltaic (PV)
array. Meeting the goal will be
difficult beyond 2030 due to
increased electrical load
associated with EIC and the
new data center.
YOY scope 3 GHG Currently 33% lower than Build and continue to learn Medium
emissions reduction from the FY08 baseline from experiences using virtual
a FY 2008 baseline. value. Large reduction meeting platforms (e.g.
over past year primarily
Microsoft Teams and Zoom)
due to decline in air travel
and commuting GHG due to COVID-19 to encourage
emissions as a result of the and improve teleworking and
COVID-19 pandemic. other collaborations that will
likely reduce commuting GHG
emissions and influence future
decisions on domestic and
foreign air travel.
Potential Yaphank/BNL
commuter rail station could
significantly reduce the number
of vehicles coming to BNL from
current values.
10II. Mission Change
This category discusses mission changes and program direction over the next five to ten years. It includes
potential impact on sustainability goals and provide projections. For major initiatives, it discusses the
site strategic vision and how sustainability goals will be influenced.
BNL has identified seven scientific initiatives that, when achieved, will help realize the vision for the Lab.
The major initiative areas for BNL are:
1) Nuclear Physics: RHIC, EIC—Exploit RHIC’s unique capabilities to learn about the matter that makes
up nearly all the visible universe and set the foundation to transition to an Electron-Ion Collider (EIC).
• The BNL EIC complex will likely add additional buildings and increase energy use.
2) Materials and Chemical Sciences—Integrate BNL’s expertise, ideas, and facilities to focus on select
timely goals in Materials and Chemical Sciences.
• The anticipated construction of additional beamlines will increase the utilization of the National
Synchrotron Light Source (NSLS)-II, Building 740, and increase its energy consumption.
• The construction for the NSLS-II laboratory office buildings (LOBs) applied the Guiding Principles
in their design to the extent possible based on the nature of the facilities.
3) Making Sense of Data at Exabyte-scale and Beyond—Create solutions for experiment-related
computing to enable near-real-time data analysis and experimental steering.
• New computing facilities are under construction in the existing Building 725. It is anticipated
that the new computing facilities will have a power utilization effectiveness (PUE) of 1.3 which
is within DOE guidelines.
4) High Energy Physics: Building for Discovery—Steward the participation of U.S. high energy physicists
in global particle physics experiments that explore the Standard Model and search for phenomena
that signal physics beyond the Standard Model.
• There are no foreseeable sustainability impacts anticipated by this research and its required
facilities.
5) Accelerator Science and Advanced Technology: From Innovations to Applications—Build on the
Lab’s unique combination of accelerator-based facilities and broad technical expertise to support
efforts in accelerator science and technology that range from innovations to applications.
• Support for the EIC upgrade could have sustainability impacts on the research and its required
facilities.
6) Quantitative Plant Science Initiative—Accelerate genome-to-function understanding to advance
fundamental discoveries in plant science relevant to the DOE mission in energy security.
11• A current capitol project will eliminate once-through waters systems previously used for cold
boxes.
7) Quantum Information Science and Technology Cross-cut—Leverage BNL’s expertise in materials,
instrumentation and networking, codes and algorithms to develop infrastructure that will enable
scalable, large, and effective quantum systems in partnership with leading quantum experts.
• There are no foreseeable sustainability impacts anticipated by this research and its required
facilities.
BNL’s scientific vision is structured around the achievement of these science initiatives, while additional
operational initiatives enable and ensure the delivery of the research mission.
1) Renewed Research Campus—The Lab’s strategy for mission readiness will provide a revitalized
physical plant to improve scientific productivity, promote the attraction and retention of the scientific
workforce, including the significant BNL user population, and assure the safe, reliable functioning of
BNL’s major scientific facilities. The resulting strategy consists of five major elements:
• Focus limited DOE investment in critical core buildings and infrastructure to enable the
scientific agenda. An example of this is the Core Facility Revitalization (CFR) Science
Laboratories Infrastructure (SLI) Line Item Project.
• Make research safe and cost effective by downsizing the campus and demolishing old
buildings. This is evidenced by BNL’s consolidation planning and right-sizing of its campus
footprint.
• Ensure scientific reliability through targeted investments in buildings and utility
infrastructure. The Critical Utility Rehabilitation Project (CURP) SLI line item project will start
to address this and is followed by a proposed SLI utility line item referred to as CURE. In
addition, the redesign of the current Well 11 and the future new Well 12 will be water saving
in that less water will be lost going through the water treatment plant.
• Support the growing population of scientific users through an innovative concept called
“Discovery Park”.
• Ensure renewed critical infrastructure and buildings are resilient against severe climate and
weather. Climate resiliency is being factored into all projects.
12II. Performance Review and Plan Narrative
Energy Management
This category focuses on all energy-related topics such as energy intensity, metering and benchmarking,
Energy Independence & Security Act (EISA) §432 evaluations, non-fleet fuel use, and associated
greenhouse gas (GHG) emissions.
Performance Status
Energy Intensity
In FY20 BNL and BHSO worked diligently to develop a second Utility Energy Service Contract (UESC)
project. The effort culminated in the preparation of nearly all required documents to issue a Task Order.
However, as has been the case with past energy conservation efforts BNL’s relatively low-cost of energy
combined with the high construction costs make it difficult to find cost-effective projects. The economics
of the 2nd UESC effort is marginal and will be re-evaluated in FY21.
Energy intensity for FY20 was 235,750 Btu/gsf which is 3% lower than the current base year of 2015. This
lower intensity level saved BNL nearly $181,000 in FY20 as compared to 2015. The previous reduction
goals of 30% (2015 vs. 2003) and the 30% reduction by 2003 as compared to 1985 make it increasingly
difficult to achieve the goals. However, BNL met those goals resulting in an estimated annual savings of
$4.6 million comparing 2020 and 1985 energy intensity.
Energy intensity is greatly affected by many factors, including several beyond a site’s ability to control.
The most significant factor at BNL is weather. The site is located in the Northeast and fuel for heating is
the most dominate energy source for buildings. Other factors affecting energy intensity include changing
outdoor air code requirements, increased density/occupancy of new facilities, and constantly changing
technologies including computers and related IT systems, lighting, and for FY20, the impact of COVID-19.
Best practices continue to be temperature set-back during unoccupied periods and appropriate building
maintenance.
Interestingly, BNL’s energy intensity for FY20 was only slightly lower (~0.3%) than FY19. The heating
degree-days were ~5% lower, but the cooling degree-days were ~18% higher. Given the limited building
occupancy resulting from the minimum-safe (Min-Safe) operating mode due to COVID-19, it was expected
that there would be a greater drop in energy intensity. To date, although a formal analysis has not been
conducted, it’s anticipated the fact that building spaces still needed to be maintained (in most cases with
additional outside air ventilation requirements from COVID-19 protocols), most or all of the energy savings
will likely be negated.
Figure 1 (below) depicts the energy use intensity (EUI) for non-excluded buildings (i.e., goal subject ones)
at BNL greater than 5,000 gsf with an EUI of 150 kBTU/GSF or above:
13Figure 1: EUI for Non-Excluded Buildings
FY20 was the fifth full year with the results of the Utility Energy Service Contract (UESC) Phase I project.
The energy savings were once again verified to be within a few percent of the original estimates. The UESC
has contributed to lowering BNL’s overall energy intensity value. A robust Measurement and Verification
(M&V) process is in place for the UESC.
As regularly discussed, the biggest factor affecting BNL’s ability to continue to reduce energy intensity is
the lower electricity rates and current low fuel prices. While the low rates/prices are excellent for
continuing research programs, they make it extremely difficult to find cost-effect projects, especially when
paired with high construction costs. Further, most of the most attractive projects have already been
completed. Regardless, BNL will continue to strive to reduce energy intensity.
EISA Section 432 Evaluations and Benchmarking
83 Buildings covering 706,859 sq. ft. were audited in FY20. Energy audits of heating, ventilation, and air-
conditioning systems (HVAC) systems, lighting, and office equipment continue to be used to identify
opportunities for energy conservation. The findings help to develop policies on operation and equipment
needs. These audits are being performed in conjunction with ongoing Facility Condition Assessment (FCA)
surveys in order to reduce additional costs and administrative oversight needs. All information has been
placed in Environmental Protection Agency’s (EPA’s) Portfolio Manager Program for benchmarking.
14Information from the energy and water audits was taken into consideration with the 2019 Investment
Grade Audit (IGA) being used to develop another potential UESC effort, or self-funded project.
To date, BNL has not capitalized on the capability of benchmarking with Portfolio Manager due to limited
resources.
Measurement and Verification (M&V)
Measurement and Verification (M&V) continues to be an important process to ensure performance of
energy and water conservation projects. BNL’s existing comprehensive metering and building automation
systems are a tremendous resource for our M&V efforts. The UESC Phase I projects Performance
Assurance Plan (PAP) continues to be used to verify project performance. For the five years that the
project has been in operation, energy savings have been within a few percent of the original projections.
The PAP includes all of the fundamental elements of a full M&V program.
Facility Metering
BNL continued its decades-long tradition of advanced metering efforts in FY20 and is meeting the
metering goals for electricity, natural gas, and chilled water. During FY20 six additional advanced electric
meters were installed.
There are nearly 280 advanced electric meters are currently installed and they capture over 99% of
consumed electricity. Of the 158 buildings greater than 4,000 square feet, 153 (97%) advanced meters are
installed.
Chilled water is metered at 100% with 43 advanced chilled water meters installed in 34 buildings or loads
with chilled water, and all three of BNL’s natural gas-supplied facilities have advanced meters installed.
Approximately 90% of the steam consumption is metered with advanced steam/condensate metering in
45 of the largest buildings. However, 23 buildings still have conventional steam meters that will be
upgraded as appropriate.
Due to BNL’s low cost of water (less than $0.43 per 1,000 gallons), the installation of water meters is not
economically justifiable. However, BNL’s major facilities with cooling towers, as well as new buildings and
major renovations include water metering. A substantial amount of the water used at BNL is utilized by
cooling towers, most of which are currently metered. BNL installed one new cooling tower meter in 2020
and plans to meter all cooling towers within the next few years. Currently approximately 25% of BNL’s
potable water consumption is metered at the main cooling towers and new buildings.
BNL has a long history of advanced metering dating back nearly 40 years. Energy data is utilized for
numerous purposes including the following:
• Verification of utility bills: Over the years there have been several occasions where utility billing
errors were captured, saving literally hundreds of thousands of dollars in cost.
• Internal utility cost re-distribution of all energy streams (electric, chilled water, steam) to various
departments and organizations.
• M&V for both third party and internal energy and water conservation projects: currently used for
the UESC effort.
15• Participation in electric load curtailment programs that allows BNL to reward individual
departments and organizations in direct relation to their contribution to the curtailment.
• Live monitoring of energy usage.
• Troubleshooting and evaluation of unusual loads and disturbances.
• Sizing of energy distribution systems.
• Energy use optimization when combined with the site-wide energy management control system.
• Detailed measurement of BNL’s ~1 MW Solar photovoltaic (PV) system.
• Assisting the BNL scientists and researchers in developing new projects and endeavors such as
Connected Communities, microgrid proposals, and more.
Plans and Projected Performance
Energy Intensity
Continued reductions in Energy Intensity had been and will continue to be the biggest energy related
challenge for BNL. Since the late 1970’s, BNL has implemented numerous energy conservation projects,
meeting two of the three previous energy intensity reduction goals of 30% (1985 vs. 1973), 30% (2003 vs.
1985), and 30% (2015 vs. 2003). BNL is currently at a 28% reduction vs. 2003 and 65% vs. 1973.
The previous efforts naturally targeted the most financially attractive projects first. Further, while BNL’s
construction costs continue to escalate, the energy rates and electricity, have not. In fact, BNL’s FY20
electric rate is lower than the rates of nearly four decades ago. This makes it very difficult to identify new
cost-effective projects.
As previously discussed BNL has begun a UESC Phase II effort in FY19. The effort was further developed in
FY20. Virtually all the documentation necessary to issue a task order was completed. Less than optimal
economics, however, put the project on hold. BNL may decide to move forward with some other method
such as self-funding in order to reduce the cost.
Heating, Ventilation, and Air Conditioning (HVAC) Setback
Temperature setback during unoccupied periods for HVAC systems continues to be implemented
throughout the BNL campus. The Facility Complex Managers (FCMs) and their staff regularly evaluate
systems to ensure that this function is operating as intended. Setback impact is captured by using the
Building Automation System. FCMs will communicate with building occupants about energy usage and
the benefits of HVAC setback and energy conservation.
The HVAC setback initiative will continue to be emphasized as part of BNL’s educational effort for the
facility managers. This is part of a larger site-wide effort to encourage active employee participation in
various conservation efforts.
Steam Charge-back
A steam cost charge-back program was developed for implementation several years ago. BNL has long
used direct charges to building occupants and departments for electricity and chilled water, which is one
16of the most effective methods to increase energy conservation. Unfortunately, there continued to be
concern from at least one department regarding a major financial disproportionate impact that would
result from direct billing of steam/fuel. BNL continues to work to develop a program that will minimize
the financial impacts to this Department occupants. It is estimated that this should provide energy savings
of approximately 62,000 mmBtu/year.
Lighting Upgrades
The natural migration to LED lighting from older technologies continues making BNL’s lighting more
efficient. Over time this natural cycle will eliminate more of the older, less efficient technologies. Further,
all new facilities include the most efficient lighting and automated controls where appropriate.
Metering
Additional meters will be installed as opportunities become available. Electric and steam meter
installations often require extensive coordination and shutdown of operations. BNL typically strives to
install at least five electric meters and at least one steam/condensate meter annually. The biggest issue
is limited funds and coordination of building operations if shutdowns are required. In FY20 the Lab was
able to meet the goal of installing the goal of eight advanced electric meters, four of which installed on
some major transformers are full power quality analyzers/meters.
17Electric Usage Projections
BNL Historical and Projected Electricity
450,000
BNL High Energy Mission Specific Facilities (HEMSF) :
CAD : Collider-Accelerator Department
400,000 NSLS: National Synchrotron Light Source I & II (i.e.Photon Sciences)
CFN: Center for Functional Nanmaterials
350,000
300,000
250,000
M
W
h CFN (HEMSF)
200,000
NSLS/Photon Sci. (HEMSF)
CAD and then EIC in 2030 (HEMSF)
150,000
Site Base and High Performance
Computing
100,000
50,000
0
2003 2004 2005 2006 2007 2008 2009 2010 2011 2012 2013 2014 2015 2016 2017 2018 2019 2020 2021 2022 2023 2024 2025 2026 2027 2028 2029 2030
CFN (HEMSF) 3,000 4,500 5,100 5,300 5,398 5,401 5,400 5,707 6,821 5,351 5,553 5,924 5,664 6,000 6,000 6,000 6,000 6,000 6,000 6,000 6,000 6,000 6,000
NSLS/Photon Sci. (HEMSF) 32,574 34,341 34,859 32,611 32,565 30,665 33,313 35,192 34,146 41,708 48,321 57,247 40,734 40,172 43,465 43,566 45,501 45,263 47,435 47,435 47,435 51,596 51,596 51,596 51,596 51,596 51,596 51,596
CAD and then EIC in 2030 (HEMSF) 160,93 148,90 159,33 118,45 108,15 107,07 129,24 136,68 136,62 133,56 119,56 132,69 142,34 131,68 126,65 119,47 128,11 143,58 134,60 132,60 57,600 117,60 132,60 122,60 42,600 42,600 42,600 199,18
Site Base and High Performance Computing 96,792 93,272 94,907 91,457 92,701 92,144 91,692 96,607 96,616 97,366 98,341 94,490 94,470 90,625 94,973 94,998 89,174 87,203 99,065 104,56 113,36 111,10 119,20 137,10 148,00 148,80 164,90 164,01
Figure 2: BNL Historical and Projected Electricity
18Electricity and REC Cost Projections
The chart below shows electricity and Renewable Energy Credit (REC) cost history and projections. BNL’s REC purchases to-date have been
relatively inexpensive, under $1/MWh for the last few years. However, in FY20 the rate went to $2/MWh. Given the increasing renewable and
clean energy requirements from New York State’s new Climate Leadership and Community Projection Act (CLCPA), BNL anticipates substantial
increases in REC and energy pricing as the years progress. The CLCPA requires 100% of all electricity generation to be renewable by 2040.
The table assumes that rates will increase to ~$5/MWh by 2027 and to ~$10/MWh by 2030. These assumptions are based on discussions with a
few REC providers as well as anticipation of the impact of the CLCPA. They will be updated in future Site Sustainability Plans (SSPs).
Electricity and REC Cost - Actual and Projected
Electric Cost (k$) REC (k$)
45,000 $350.0
40,000
$300.0
35,000
$250.0
30,000
$200.0
25,000
Electric k$
REC k$
20,000
$150.0
15,000
$100.0
10,000
$50.0
5,000
0 $0.0
FY03 FY04 FY05 FY06 FY07 FY08 FY09 FY10 FY11 FY12 FY13 FY14 FY15 FY16 FY17 FY18 FY19 FY20 FY21 FY22 FY23 FY24 FY25 FY26 FY27 FY28 FY29 FY30
Electric Cost (k$) $14,842 $14,426 $17,039 $15,107 $13,353 $15,469 $14,139 $14,977 $11,477 $14,570 $14,655 $17,168 $13,479 $9,891 $12,166 $11,220 $11,758 $11,477 $14,017 $14,923 $12,062 $16,324 $18,871 $20,715 $17,503 $18,979 $21,814 $39,855
REC (k$) $0 $0 $0 $0 $0 $0 $18 $44 $42 $15 $48 $53 $59 $42 $42 $42 $19 $44 $43 $55 $50 $75 $70 $95 $93 $112 $159 $316
Figure 3: Electricity and REC Cost – Actual and Projected
19Fuel
Over 95% of the fuel use at BNL is for the Central Steam Facility. Estimated fuel use going forward is estimated to slightly decline by ~0.5%/year,
mainly due to continued efficiency improvement projects and a reduction of older underutilized facilities. As previously discussed BNL is concerned
about our ability to meet the continued energy intensity reduction requirements.
Fuel Usage and Projection
mmBtu Degree-Days
800,000 7,000
700,000
6,000
600,000
5,000
500,000
4,000
400,000
3,000
300,000
2,000
200,000
1,000
100,000
0 0
FY03 FY04 FY05 FY06 FY07 FY08 FY09 FY10 FY11 FY12 FY13 FY14 FY15 FY16 FY17 FY18 FY19 FY20 FY21 FY22 FY23 FY24 FY25 FY26 FY27 FY28 FY29 FY30
mmBtu 629,80 573,10 565,00 549,30 580,00 635,00 662,34 634,48 630,36 613,88 633,67 695,00 675,07 561,50 584,47 653,35 598,79 617,32 636,80 633,61 630,44 627,29 624,15 621,03 617,93 614,84 611,76 608,71
Degree-Days 5,658 5,586 5,774 5,257 5,325 5,364 5,530 5,061 5,618 4,601 5,490 5,944 6,130 5,073 5,359 5,584 5,668 5,400
Figure 4: Fuel Usage – Actual and Projected
20Water Management
This category focuses on activities undertaken to reduce potable and non-potable water consumption,
comply with stormwater management requirements, and improve water efficiency, as well as
summarizes any issues or obstacles related to the implementation of reduction strategies or the
collection of water consumption data.
Performance Status
BNL obtains its potable, process cooling, and fire protection water from Long Island’s underground
aquifer. BNL runs its own NYS-regulated “community water system” which consists of five water wells, a
Water Treatment (Iron Removal/Filter) Plant, two elevated water storage tanks with a capacity of 1.3
million gallons, and an underground distribution system with about 45 miles of piping, valves, and
hydrants.
BNL has a long history of reducing water consumption – even though water on Long Island is plentiful and
inexpensive. BNL has conducted an effective water-reduction and conservation program for more than
20 years, illustrated in the figure below by the trend in annual potable (includes process) water usage.
Annual Potable Water Use
1,000,000 270.00
900,000
800,000 220.00
700,000
600,000 170.00
500,000
400,000 120.00
300,000
200,000 62% Decrease 70.00
FY1999 - FY2020
100,000
0 20.00
kGal G/GSF
Figure 5: Annual Potable Water Use (1999-2020)
Potable-water usage fell from 931 million gallons/year in FY99 (average of 2.55 million gallons per day) to
about 389 million gallons/year in FY20 (just over 1 million gallons per day), a reduction of 62.0%. When
normalized by site growth (building area in gross square feet), BNL’s annual water use intensity has
21decreased from 101 gallons per square foot to 8039 gallons per square foot, a 20.1% water usage
reduction since base-year 2007. The table below illustrates the change in site gross square footage.
Table 1: Annual Change Gal/GSF Water Use (1999-2020)
FY kGal GSF G/GSF
FY99 931,452 4,363,224 213.48
FY00 732,408 4,281,455 171.07
FY01 710,583 4,286,993 165.75
FY02 698,340 4,241,450 164.65
FY03 666,916 4,191,562 159.11
FY04 530,414 4,148,593 127.85
FY05 542,568 4,128,355 131.42
FY06 493,641 4,105,635 120.23
FY07 412,935 4,081,900 101.16
FY08 427,400 4,237,100 100.87
FY09 504,500 4,252,200 118.64
FY10 505,075 4,203,457 120.16
FY11 520,308 4,249,150 122.45
FY12 418,153 4,586,455 91.17
FY13 419,372 4,906,797 85.47
FY14 433,718 4,865,753 89.14
FY15 416,904 4,843,649 86.07
FY16 417,364 4,854,679 85.97
FY17 406,876 4,905,386 82.94
FY18 393,096 4,845,380 81.13
FY19 368,520 4,815,914 76.52
FY20 389,437 4,815,914 80.86
Water usage increased slightly from FY19 to FY20, even with the reduced site activity associated with
COVID-19 and Min-Safe. While BNL has not had time to fully analyze the data, there where several issues
that likely contributed to the increase usage, ironically due to COVID-19 response. These include increased
water main/service flushing and the delayed Collider-Accelerator Department (C-AD) run that caused the
machines to run during the summer with the resulting increase in cooling tower operation, blow-down,
evaporation, and cleaning.
Further, this summer was warmer and drier than last year, resulting in additional evaporation and blow-
down cycles.
22Atmospheric
CSF Losses and Evaporative and
Humidification Line Losses
4% 17%
Other Process
Cooling (Basin HS) STP Efflent to
16% Recharge Beds
24%
CAD/Site Cooling to
Recharge Basins
39%
Figure 6: 2020 Potable Water Utilization
In October 2014, BNL implemented groundwater recharge of treated wastewater at its Sewage Treatment
Plant. Currently, about 82% of water used at BNL is recharged (recycled) to groundwater via groundwater
recharge basins. The water recharged is near potable water quality.
We estimate that over two-thirds of BNL’s water production is attributable to High Energy Missions
Specific Facilities.
Plans and Projected Performance
Water Management Plan
BNL’s Water Management Plan describes how BNL designs and operates the Laboratory’s buildings and
facilities to be sustainable and water efficient. It outlines our efforts to continue to reduce water usage
by implementing best-management practices. The E.O. 13834 goals require that BNL reduce potable
water intensity (Gal per gross square foot) by 20% relative to FY07 by FY15 and 0.6% year after year
thereafter.
Presently, we are implementing best-management practices (BMPs) as detailed in Section 2.2 of our
Water Management Plan. Implementing water conservation is a significant economic challenge. Water is
plentiful and inexpensive at BNL. The variable cost of producing water currently is about $0.45 per
thousand gallons. Most water conservation measures are capital- and labor-intensive. We are always
evaluating the return on investment of implementing additional BMPs. These BMPs have the potential to
lower water consumption by more than 40 million gal/yr. Our ability to implement these capital-intensive
measures depends upon obtaining additional benefits (such as replacing obsolete equipment, extending
23equipment’s end-of-life, reduced maintenance costs, reducing waste water discharges to the sewage
treatment plant, and increasing energy savings) and upon obtaining capital funding to install them (aligned
with other priorities).
A carbon filtration system was renovated and returned to service for per- and polyfluoroalkyl substances
(PFAS) removal Well House No. 11 on site will reduce the need to use older wells therefore reducing the
Water Treatment Plant filter back-wash cycles by restoring the carbon filtration system.
Finally, we emphasize that over 80% of BNL’s water consumption is returned and recharged to
groundwater at potable water quality. We believe that BNL’s groundwater recharge fully meets the DOE’s
water management “recycling” or “non-consumptive” criteria (except for insignificant temperature
changes). To increase the rate of on-site recharge, BNL completed a project in 2014 to re-route the treated
effluent from the sewage treatment plant from a surface water discharge to a groundwater recharge
system. This project eliminates a potential source of trace metals contamination to the Peconic River and
improves the quality of the river down-stream of BNL. Review of analytical data for the Sewage Treatment
Plant effluent shows that the water quality meets all Federal and state groundwater quality standards.
This change resulted in an increase of over 100 million gallons per year recharged locally versus off-site
flow via the Peconic River.
The following paragraphs summarize BNL’s past and present (ongoing) efforts in water conservation (best
management practices); more details are available in BNL’s Water Management Plan.
• Public Information and Education Programs: BNL’s water-related public information and
education programs emphasize the excellent quality of BNL’s potable water supply and seek to
minimize employee’s use of expensive, environmentally unfriendly bottled water.
• Distribution System Audits/Metering: BNL periodically audits its water distribution system as part
of infrastructure planning and utility reviews (e.g., 10-year Master Plans). BNL’s utility engineers
understand BNL’s water system to be “tight” and relatively leak-free. Because of the plentiful
supply and low cost of water at BNL, water meters are not available at most buildings or major
process users. We bill one major process user for water.
• Water-efficient Landscaping: BNL’s minimal formal landscaping is compatible with the local
climate and rainfall. BNL does not routinely irrigate lawns and landscape.
• Toilets and Urinals: BNL currently specifies low consumption toilets and flushometers (1.6 gallons
per flush (gpf) for toilets, 1.0 gpf for urinals) for new constructions, renovations, and maintenance.
• Faucets and Showerheads: BNL specifies low-flow, WaterSense faucets and showerheads for new
constructions, renovations, and maintenance.
• Boiler/Steam Systems: BNL has a district steam-system and Central Steam Facility. Depending on
the season, 75-85% of the steam exported from the facility returns as condensate. (This is
excellent return for a large district steam-system and the condensate return conserves water and
energy).
24• Single-Pass Cooling Systems: BNL has reduced water flow through single-pass cooling systems that
discharge to the sanitary sewer system. The marked success of these efforts is reflected in the
55% water use intensity reduction.
• Cooling-tower Systems: To reduce water use in once-through cooling systems, BNL has 32 cooling
towers with a flow rate of over 300 gpm. To maximize cooling efficiency and minimize water use,
BNL controls the blowdown rates on the large towers to maintain the “cycles of concentration”
between 4 and 6.
• Water Reuse and Recycling: Over 80% of BNL’s water consumption (except evaporation and drift
at cooling towers) is recharged back to the ground (where the well water came from). All of BNL’s
process water (e.g., make-up and cooling) currently is obtained from the Laboratory’s potable-
water system and is accounted for in accordance with Executive Order 13834 “Efficient Federal
Operations”.
• Sewage Treatment Plant Effluent Recharge: A modification to convert BNL Sewage Treatment
Plant from surface water discharge (Peconic River) to groundwater recharge / recycling was
completed in September 2014. Purified wastewater (effluent) from BNL operations is currently
being recharged and recycled to groundwater.
All new construction and renovation at BNL will continue to utilize water-efficient processes and plumbing
fixtures to conserve water.
In FY16, the Laboratory funded engineering and design of a new Well House No. 12. Start of construction
of the new well house has begun and is expected to be completed in FY21. Total estimated cost (TEC) for
the project will be about $2.3 million. The new well house will replace the well house structure destroyed
in a propane explosion in October 2008.
Well No. 12 is located in an area of the BNL site with low-iron groundwater. Return of Well No. 12 to
operation will reduce the need operate BNL’s high-iron wells – Well Nos. 4, 6, and 7. This in turn will
reduce the duty on BNL ‘s Water Treatment (i.e., Iron Removal / Filter) Plant, and reduce the number of
backwash cycles and backwash wastewater.
We continue to expect that increased, “main-mission” science program activities, with their need for
accelerator cooling will tend to increase water consumption, due to cooling tower evaporation. This is not
as significant an issue at BNL as it is at DOE facilities located in arid locales. Groundwater recharge from
annual precipitation (almost all storm water is recharged on site) is orders of magnitude greater BNL’s
water usage that is “lost” due to evaporation (in evaporative cooling towers).
25You can also read