AFGHANISTAN CLIMATE RISK COUNTRY PROFILE - Asian ...
←
→
Page content transcription
If your browser does not render page correctly, please read the page content below
CLIMATE RISK COUNTRY PROFILE

     AFGHANISTAN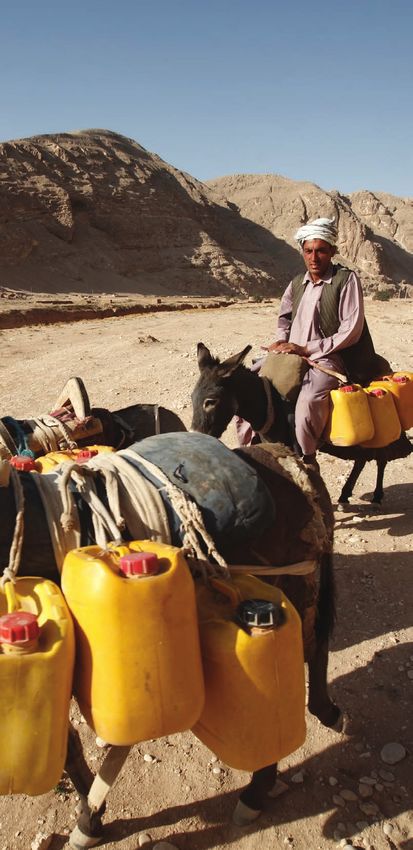
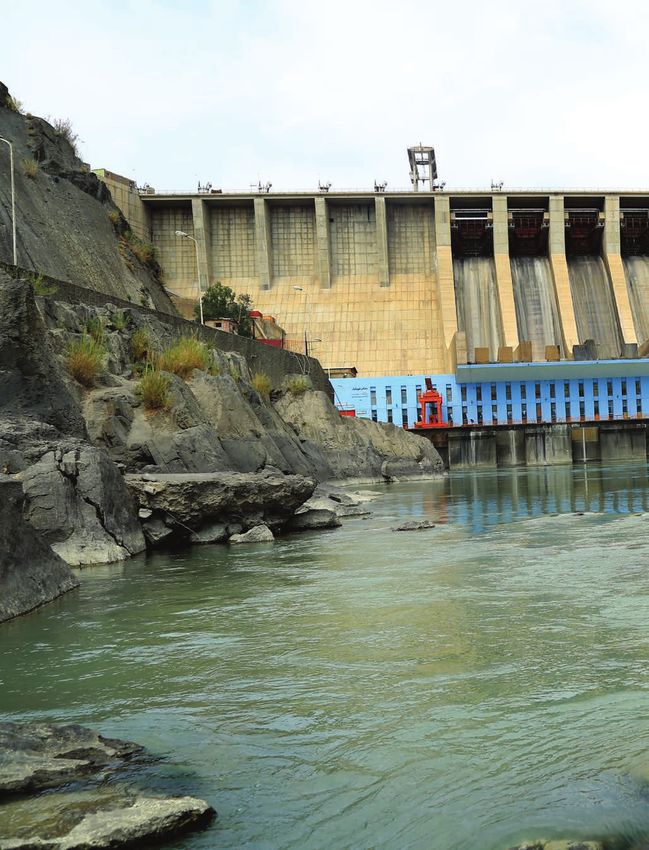
COPYRIGHT
© 2020 by the World Bank Group
1818 H Street NW, Washington, DC 20433
Telephone: 202-473-1000; Internet: www.worldbank.org

© Asian Development Bank
6 ADB Avenue, Mandaluyong City, 1550 Metro Manila, Philippines
Tel +63 2 8632 4444; Fax +63 2 8636 2444; www.adb.org

This work is a product of the staff of the World Bank Group (WBG) and the Asian Development Bank (ADB) and with external
contributions. The opinions, findings, interpretations, and conclusions expressed in this work are those of the authors’ and do not
necessarily reflect the views or the official policy or position of the WBG, its Board of Executive Directors, or the governments
it represents or of ADB, its Board of Governors, or the governments they represent.

The WBG and ADB do not guarantee the accuracy of the data included in this work and do not make any warranty, express or
implied, nor assume any liability or responsibility for any consequence of their use. This publication follows the WBG’s practice
in references to member designations, borders, and maps. ADB, however, recognizes “China” as the People’s Republic of China
and “Russia” as the Russian Federation. The boundaries, colors, denominations, and other information shown on any map in this
work, or the use of the term “country” do not imply any judgment on the part of the WBG or ADB, their respective Boards, or the
governments they represent, concerning the legal status of any territory or geographic area or the endorsement or acceptance
of such boundaries.

The mention of any specific companies or products of manufacturers does not imply that they are endorsed or recommended
by either the WBG or ADB in preference to others of a similar nature that are not mentioned.

RIGHTS AND PERMISSIONS
The material in this work is subject to copyright. Because the WB and ADB encourage dissemination of their knowledge, this
work may be reproduced, in whole or in part, for noncommercial purposes as long as full attribution to this work is given. This
work is licensed under the Creative Commons Attribution-NonCommercial 3.0 IGO License. To view a copy of this license, visit
http://creativecommons.org/licenses/by-nc/3.0/igo/ or send a letter to Creative Commons, PO Box 1866, Mountain View,
CA 94042, USA.

This CC license does not apply to WBG or non-ADB copyright materials in this publication. If the material is attributed to another
source, please contact the copyright owner or publisher of that source for permission to reproduce it. WBG or ADB cannot be
held liable for any claims that arise as a result of your use of the material.

Please cite the work as follows: Climate Risk Country Profile: Afghanistan (2020): The World Bank Group and the Asian
Development Bank.

Any queries on rights and licenses, including subsidiary rights, should be addressed to World Bank Publications, The World Bank
Group, 1818 H Street NW, Washington, DC 20433, USA; fax: 202-522-2625; e-mail: pubrights@worldbank.org.

Cover Photos: © Sofie Tesson/World Bank, “Residents get water” September 20, 2008 via Flickr, Creative Commons CC
BY-NC-ND 2.0. © Rumi Consultancy/World Bank, “Naghlu Hydropower station” March 19, 2018 via Flickr, Creative Commons
CC BY-NCND 2.0.

Graphic Design: Circle Graphics, Reisterstown, MD.

CLIMATE RISK COUNTRY PROFILE: AFGHANISTAN                                                                                        ii
ACKNOWLEDGEMENTS
This profile is part of a series of Climate Risk Country Profiles that are jointly developed by the World Bank Group (WBG) and the
Asian Development Bank (ADB). These profiles synthesize the most relevant data and information on climate change, disaster
risk reduction, and adaptation actions and policies at the country level. The profile is designed as a quick reference source for
development practitioners to better integrate climate resilience in development planning and policy making. This effort is co-led
by Ana E. Bucher (Senior Climate Change Specialist, WBG) and Arghya Sinha Roy (Senior Climate Change Specialist, ADB).

This profile was written by Alex Chapman (Consultant, ADB), William Davies (Consultant, ADB) and Ciaran Downey (Consultant).
Technical review of the profiles was undertaken by Robert L. Wilby (Loughborough University). Additional support was
provided by Yunziyi Lang (Climate Change Analyst, WBG), MacKenzie Dove (Senior Climate Change Consultant, WBG),
Adele Casorla-Castillo (Consultant, ADB), and Charles Rodgers (Consultant, ADB). This profile also benefitted from inputs of
WBG and ADB regional staffs.

Climate and climate-related information is largely drawn from the Climate Change Knowledge Portal (CCKP), a WBG online
platform with available global climate data and analysis based on the latest Intergovernmental Panel on Climate Change (IPCC)
reports and datasets. The team is grateful for all comments and suggestions received from the sector, regional, and country
development specialists, as well as climate research scientists and institutions for their advice and guidance on use of climate
related datasets.

CLIMATE RISK COUNTRY PROFILE: AFGHANISTAN                                                                                      iii
CONTENTS

FOREWORD  .  .  .  .  .  .  .  .  .  .  .  .  .  .  .  .  .  .  .  .  .  .  .  .  .  .  .  .  .  .  .  .  .  .  .  . 1

KEY MESSAGES .   .   .   .   .   .   .   .   .   .   .   .   .   .   .   .   .   .   .   .   .   .   .   .   .   .   .   .   .   .   .   .   .   .  2

COUNTRY OVERVIEW .   .   .   .   .   .   .   .   .   .   .   .   .   .   .   .   .   .   .   .   .   .   .   .   .   .   .   .   .   .   .  2

CLIMATOLOGY  .   .   .   .   .   .   .   .   .   .   .   .   .   .   .   .   .   .   .   .   .   .   .   .   .   .   .   .   .   .   .   .   .   .   4
   Climate Baseline .  .  .  .  .  .  .  .  .  .  .  .  .  .  .  .  .  .  .  .  .  .  .  .  .  .  .  .  .  .  .  .  .  .  .  .  .  .  .  .           4
      Overview  .  .  .  .  .  .  .  .  .  .  .  .  .  .  .  .  .  .  .  .  .  .  .  .  .  .  .  .  .  .  .  .  .  .  .  .  .  .  .  .  .  .         4
      Key Trends .  .  .  .  .  .  .  .  .  .  .  .  .  .  .  .  .  .  .  .  .  .  .  .  .  .  .  .  .  .  .  .  .  .  .  .  .  .  .  .  .           6
   Climate Future .  .  .  .  .  .  .  .  .  .  .  .  .  .  .  .  .  .  .  .  .  .  .  .  .  .  .  .  .  .  .  .  .  .  .  .  .  .  .  .  .          7
      Overview  .  .  .  .  .  .  .  .  .  .  .  .  .  .  .  .  .  .  .  .  .  .  .  .  .  .  .  .  .  .  .  .  .  .  .  .  .  .  .  .  .  .         7

CLIMATE-RELATED NATURAL HAZARDS .   .   .   .   .   .   .   .   .   .   .   .   .   .   .   .   .   .   .   .   .   . 11
       Heat Waves .  .  .  .  .  .  .  .  .  .  .  .  .  .  .  .  .  .  .  .  .  .  .  .  .  .  .  .  .  .  .  .  .  .  .  .  .  .  .  .  . 12
       Drought  .  .  .  .  .  .  .  .  .  .  .  .  .  .  .  .  .  .  .  .  .  .  .  .  .  .  .  .  .  .  .  .  .  .  .  .  .  .  .  .  .  . 12
       Flood .  .  .  .  .  .  .  .  .  .  .  .  .  .  .  .  .  .  .  .  .  .  .  .  .  .  .  .  .  .  .  .  .  .  .  .  .  .  .  .  .  .  .  . 13

CLIMATE CHANGE IMPACTS .   .   .   .   .   .   .   .   .   .   .   .   .   .   .   .   .   .   .   .   .   .   .   .   .   .   .   . 15
   Natural Resources  .  .  .  .  .  .  .  .  .  .  .  .  .  .  .  .  .  .  .  .  .  .  .  .  .  .  .  .  .  .  .  .  .  .  .  .  .  .  . 15
     Water .  .  .  .  .  .  .  .  .  .  .  .  .  .  .  .  .  .  .  .  .  .  .  .  .  .  .  .  .  .  .  .  .  .  .  .  .  .  .  .  .  .  . 15
     Land, Soil, and Biodiversity .  .  .  .  .  .  .  .  .  .  .  .  .  .  .  .  .  .  .  .  .  .  .  .  .  .  .  .  .  .  .  .  .  . 16
   Economic Sectors  .  .  .  .  .  .  .  .  .  .  .  .  .  .  .  .  .  .  .  .  .  .  .  .  .  .  .  .  .  .  .  .  .  .  .  .  .  .  . 16
     Agriculture .  .  .  .  .  .  .  .  .  .  .  .  .  .  .  .  .  .  .  .  .  .  .  .  .  .  .  .  .  .  .  .  .  .  .  .  .  .  .  .  . 16
     Urban and Energy  .  .  .  .  .  .  .  .  .  .  .  .  .  .  .  .  .  .  .  .  .  .  .  .  .  .  .  .  .  .  .  .  .  .  .  .  .  . 19
   Communities  .  .  .  .  .  .  .  .  .  .  .  .  .  .  .  .  .  .  .  .  .  .  .  .  .  .  .  .  .  .  .  .  .  .  .  .  .  .  .  .  . 20
     Poverty, Inequality, and Vulnerability .  .  .  .  .  .  .  .  .  .  .  .  .  .  .  .  .  .  .  .  .  .  .  .  .  .  .  .  . 20
     Human Health .  .  .  .  .  .  .  .  .  .  .  .  .  .  .  .  .  .  .  .  .  .  .  .  .  .  .  .  .  .  .  .  .  .  .  .  .  .  .  . 21

POLICIES AND PROGRAMS  .   .   .   .   .   .   .   .   .   .   .   .   .   .   .   .   .   .   .   .   .   .   .   .   .   .   .   . 23
   National Adaptation Policies and Strategies .  .  .  .  .  .  .  .  .  .  .  .  .  .  .  .  .  .  .  .  .  .  .  .  .  .  .                       23
   Climate Change Priorities of ADB and the WBG  .  .  .  .  .  .  .  .  .  .  .  .  .  .  .  .  .  .  .  .  .  .  .  .  .                           23
      ADB Country Partnership Strategy  .  .  .  .  .  .  .  .  .  .  .  .  .  .  .  .  .  .  .  .  .  .  .  .  .  .  .  .  .  .                     23
      WBG Country Partnership Framework .  .  .  .  .  .  .  .  .  .  .  .  .  .  .  .  .  .  .  .  .  .  .  .  .  .  .  .                           24

CLIMATE RISK COUNTRY PROFILE: AFGHANISTAN                                                                                                            iv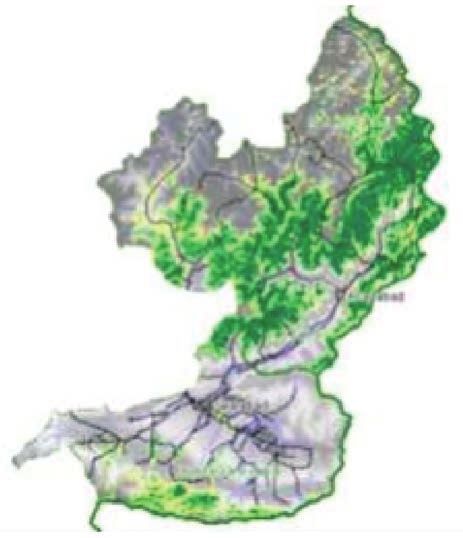
FOREWORD

Climate change is a major risk to good development outcomes, and the World Bank Group is committed to playing an important
role in helping countries integrate climate action into their core development agendas. The World Bank Group (WBG) and the
Asian Development Bank (ADB) are committed to supporting client countries to invest in and build a low-carbon, climate-
resilient future, helping them to be better prepared to adapt to current and future climate impacts.

Both institutions are investing in incorporating and systematically managing climate risks in development operations through
their individual corporate commitments.

For the World Bank Group: a key aspect of the World Bank Group’s Action Plan on Adaptation and Resilience (2019) is to help
countries shift from addressing adaptation as an incremental cost and isolated investment to systematically incorporating climate
risks and opportunities at every phase of policy planning, investment design, implementation and evaluation of development
outcomes. For all International Development Association and International Bank for Reconstruction and Development operations,
climate and disaster risk screening is one of the mandatory corporate climate commitments. This is supported by the World
Bank Group’s Climate and Disaster Risk Screening Tool which enables all Bank staff to assess short- and long-term climate
and disaster risks in operations and national or sectoral planning processes. This screening tool draws up-to-date and relevant
information from the World Bank’s Climate Change Knowledge Portal, a comprehensive online ‘one stop shop’ for global,
regional, and country data related to climate change and development.

For the Asian Development Bank: its Strategy 2030 identified “tackling climate change, building climate and disaster resilience,
and enhancing environmental sustainability” as one of its seven operational priorities. Its Climate Change Operational
Framework 2017–2030 identified mainstreaming climate considerations into corporate strategies and policies, sector and
thematic operational plans, country programming, and project design, implementation, monitoring, and evaluation of climate
change considerations as the foremost institutional measure to deliver its commitments under Strategy 2030. ADB’s climate
risk management framework requires all projects to undergo climate risk screening at the concept stage and full climate risk
and adaptation assessments for projects with medium to high risk.

Recognizing the value of consistent, easy-to-use technical resources for our common client countries as well as to support
respective internal climate risk assessment and adaptation planning processes, the World Bank Group’s Climate Change Group
and ADB’s Sustainable Development and Climate Change Department have worked together to develop this content. Standardizing
and pooling expertise facilitates each institution in conducting initial assessments of climate risks and opportunities across sectors
within a country, within institutional portfolios across regions, and acts as a global resource for development practitioners.

For common client countries, these profiles are intended to serve as public goods to facilitate upstream country diagnostics,
policy dialogue, and strategic planning by providing comprehensive overviews of trends and projected changes in key climate
parameters, sector-specific implications, relevant policies and programs, adaptation priorities and opportunities for further actions.

We hope that this combined effort from our institutions will spur deepening of long-term risk management in our client countries
and support further cooperation at the operational level.

Bernice Van Bronkhorst                                              Preety Bhandari
Global Director                                                     Chief of Climate Change and Disaster Risk Management
Climate Change Group                                                Thematic Group concurrently Director Climate Change and
The World Bank Group                                                Sustainable Development & Climate Change Department
                                                                    Asian Development Bank
CLIMATE RISK COUNTRY PROFILE: AFGHANISTAN                                                                                           1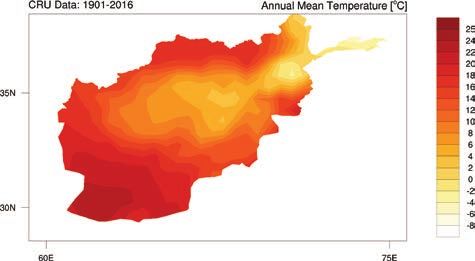
KEY MESSAGES

•   Afghanistan faces rates of warming higher than the global average with a potential rise of 1.4°C–5.4°C by the
    2080s and the 2090s, compared with the baseline of 1986–2005. The range in possible temperature rises
    highlights the significant differences between 21st century emissions pathways.
•   Rises in the annual maximum and minimum temperature are projected to be greater than the rise in average
    temperature, likely amplifying the pressure on human health, livelihoods, and ecosystems.
•   Changes to Afghanistan’s rainfall regime, and hence water resources, are highly uncertain, but an increase
    in the incidence of drought conditions is very likely, and the shifts in the runoff regime have already been
    documented. Over the long-term, loss of glaciers could fundamentally disrupt regional water and hydropower
    supplies.
•   Arid land-cover is likely to expand either side of the Hindu Kush, leading to shifts in ecosystems and potentially
    loss of biodiversity.
•   Events over the early 21st century show the extreme vulnerability of Afghanistan’s communities to hazards
    such as drought and flash flooding. This vulnerability is amplified by poverty, undernourishment, food insecurity,
    and inequality.
•   Temperature increases are likely to place strain on urban dwellers, outdoor laborers, and the country’s energy
    network, with increased risk of heat-related sickness and fatalities under all emissions pathways.
•   Comprehensive understanding of current and future climate risks across multiple sectors is severely
    constrained by a lack of data and research. This is an obstacle to adaptation and disaster risk reduction for
    Afghanistan.

COUNTRY OVERVIEW

A
        fghanistan is a landlocked nation at the juncture of the Central, West, and South Asian regions.
        Afghanistan’s land surface includes considerable mountain cover, the Hindu Kush, with peaks as high
        as 7,000 meters (m). At lower altitudes are large expanses of arid steppe and a significant desert region
found in the southwestern plateau. Though lacking in vegetation, these drier areas of the country nonetheless
support biodiverse ecosystems and unique landscapes.

Afghanistan’s communities are ethnically and culturally diverse, and generally less urbanized. As a result of long-
running conflict and political turmoil, Afghanistan’s population is among the world’s most deprived, with a national
poverty rate exceeding 50% in 2017, and the population also faces very significant issues with undernourishment
(Table 1). Afghanistan has high unemployment and relies heavily on the agricultural sector, which constituted
around 44% of employment in 2017, yet only 23% of gross domestic product (GDP).

CLIMATE RISK COUNTRY PROFILE: AFGHANISTAN                                                                           2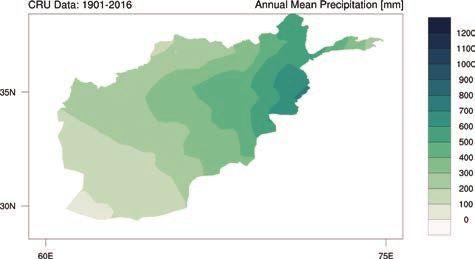
TABLE 1.  Key indicators

    Indicator                                                          Value                                      Source
    Population Undernourished   1
                                                                       23% (2014–2016)                            FAO, 2017
    National Poverty Rate 2
                                                                       54.5% (2017)                               CIA, 2019
    Share Of Wealth Held by Bottom 20%3                                N/A                                        World Bank, 2018
    Net Annual Migration Rate  4
                                                                       0.29% (2010–2015)                          UNDESA, 2017
    Infant Mortality Rate (Between Age 0 And 1)         4
                                                                       6.86% (2010–2015)                          UNDESA, 2017
    Average Annual Change in Urban Population5                         0.88% (2010–2015)                          UNDESA, 2018
    Dependents per 100 Independent Adults       4
                                                                       142.2 (2015)                               UNDESA, 2017
    Urban Population as % of Total Population       6
                                                                       25.5% (2018)                               CIA, 2018
    External Debt Ratio To GNI7                                        12.2% (2016)                               ADB, 2018b
    Government Expenditure Ratio to GDP     7
                                                                       24.4% (2017)                               ADB, 2018b

The country’s vulnerability is recognized by Afghanistan’s Nationally Determined Contribution (NDC) submitted in
2016. Not only does the document highlight the nation’s very modest contribution to the causes of climate change,
but also the significant deficit in financial resources available to adapt to the diverse hazards already beginning
to manifest as a result of human-induced climate change. Afghanistan’s Second National Communication to the
UNFCCC (NC2) highlights the country’s commitment to increase its adaptation capabilities for the key sectors of
agriculture, human health, energy and infrastructure as well as increase the population’s overall awareness about
climate change.

This document aims to succinctly summarize the climate risks faced by Afghanistan. This includes rapid onset and
long-term changes in key climate parameters, as well as impacts of these changes on communities, livelihoods and
economies, many of which are already underway. This is a high-level synthesis of existing research and analyses,
focusing on the geographic domain of Afghanistan, therefore potentially excluding some international influences and
localized impacts. The core data presented is sourced from the database sitting behind the World Bank Group’s Climate
Change Knowledge Portal (CCKP), incorporating climate projections from the Coupled Model Inter-comparison
Project Phase 5 (CMIP5). This document is primarily meant for WBG and ADB staff to inform their climate action
and to direct them to many useful sources of secondary data and research.

Due to a combination of political, geographic, and social factors, Afghanistan is one of the most vulnerable
nations to climate change impacts in the world, ranked 176th out of 181 countries in the 2019 ND-GAIN
Index.8 The ND-GAIN Index ranks 181 countries using a score which calculates a country’s vulnerability to

1
     FAO, IFAD, UNICEF, WFP, WHO (2017). The state of food security and nutrition in the world. Building Resilience for peace and food
     security. FAO. Rome. URL: http://www.fao.org/3/a-i7695e.pdf
2
     CIA (2019). The World Factbook. URL: https://www.cia.gov/library/publications/the-world-factbook/geos/af.html [accessed 07/05/19]
3
     World Bank (2018). Income share held by lowest 20%. URL: https://data.worldbank.org/indicator/SI.DST.FRST.20 [accessed 26/02/2019]
4
     UNDESA (2017). World Population Prospects 2017. URL: https://population.un.org/wpp/Download/Standard/Population/
     [accessed 26/02/2019]
5
     UNDESA (2018). World Urbanization Prospects 2018. URL: https://population.un.org/wup/Download/ [accessed 26/02/2019]
6
     CIA (2018). The World Factbook. Central Intelligence Agency. Washington DC. URL: https://www.cia.gov/library/publications/
     the-world-factbook/
7
     ADB (2018b). Key Indicators for Asia and the Pacific 2018, 49th Edition. Asian Development Bank. URL: https://www.adb.org/sites/
     default/files/publication/443671/ki2018.pdf
8
     University of Notre Dame (2019). Notre Dame Global Adaptation Initiative. URL: https://gain.nd.edu/our-work/country-index/

CLIMATE RISK COUNTRY PROFILE: AFGHANISTAN                                                                                            3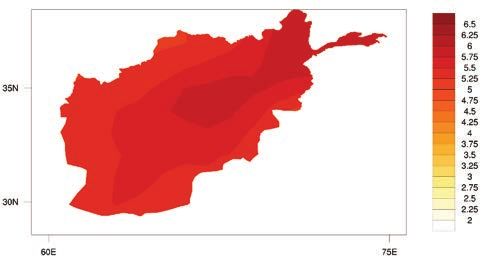
climate change and other global challenges as
well as their readiness to improve resilience. The                           FIGURE 1.  The ND-GAIN Index score (out of
more vulnerable a country is the lower their score,                          100) summarizes a country’s vulnerability to
while the more ready a country is to improve its                             climate change and other global challenges
resilience the higher it will be. Norway has the                             in combination with its readiness to improve
highest score and is ranked 1st. Figure 1 is a                               resilience.8
time-series plot of the ND-GAIN Index showing                                    34

Afghanistan’s development progress.
                                                                                 32

                                                                             Score
                                                                                 30

                                                                                 28

                                                                                 26
                                                                                      1995   1997   1999   2001   2003   2005   2007   2009   2011   2013
                                                                                                                         Year
                                                                                      Afghanistan

CLIMATOLOGY

Climate Baseline
Overview
Afghanistan has an arid continental climate with considerable temperature and precipitation variation between
seasons (Figure 2). Temperatures also vary greatly by altitude, with mountainous regions experiencing
temperatures well below zero on an annual basis, yet southern arid regions regularly experiencing temperatures
over 35°C. Precipitation varies considerably with topography, with the southwestern arid region typically
experiencing less than 150 milimeters (mm) of precipitation each year, and the northeastern mountain range
experiencing more than 1,000 mm.9 Conditions in Afghanistan also have a complex intra-annual interaction with
large-scale climate phenomena, specifically the El Niño Southern Oscillation (ENSO) 10 and the Indian Ocean
Dipole.11 The latter is associated with drought conditions in Afghanistan. Figure 3 shows the spatial differences
of observed temperature precipitation and rainfall in Afghanistan.

9
     Aich, V., Akhundzadah, N. A., Knuerr, A., Khoshbeen, A. J., Hattermann, F., Paeth, H., . . . Paton, E. N. (2017). Climate Change in
     Afghanistan Deduced from Reanalysis and Coordinated Regional Climate Downscaling Experiment (CORDEX)—South Asia
     Simulations. Climate, 5(2). URL: https://www.mdpi.com/2225-1154/5/2/38
10
     Dimri, A. P. (2013). Relationship between ENSO phases with Northwest India winter precipitation. International Journal of Climatology,
     33(8), 1917–1923. URL: https://rmets.onlinelibrary.wiley.com/doi/epdf/10.1002/joc.3559
11
     Ummenhofer, C. C., D’Arrigo, R. D., Anchukaitis, K. J., Buckley, B. M., & Cook, E. R. (2013). Links between Indo-Pacific climate variability
     and drought in the Monsoon Asia Drought Atlas. Climate Dynamics, 40(5), 1319–1334. URL: https://academiccommons.columbia.edu/
     doi/10.7916/D8280JBH

CLIMATE RISK COUNTRY PROFILE: AFGHANISTAN                                                                                                                   4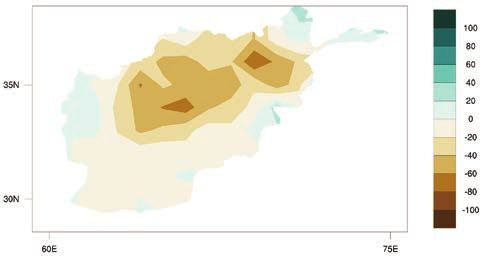
Annual Cycle

FIGURE 2.  Average monthly temperature and rainfall in Afghanistan, 1901–201612
               32°C                                                                                  80 mm

               24°C                                                                                  60 mm
Temperature

                                                                                                              Rainfall
               16°C                                                                                  40 mm

                8°C                                                                                  20 mm

                0°C                                                                                  0 mm
                      Jan   Feb    Mar    Apr   May    Jun    Jul   Aug   Sep    Oct   Nov    Dec

                                                Rainfall       Temperature

Spatial Variation

FIGURE 3.  Annual mean temperature (°C) (left), and annual mean precip (mm) (right) in Afghanistan
over the period 1901–201913

12
              WBG Climate Change Knowledge Portal (CCKP, 2019). Climate Data: Historical. URL: https://climateknowledgeportal.worldbank.org/
              country/afghanistan/climate-data-historical
13
              WBG Climate Change Knowledge Portal (CCKP, 2019). Afghanistan URL: https://climateknowledgeportal.worldbank.org/country/
              afghanistan/climate-data-historical

CLIMATE RISK COUNTRY PROFILE: AFGHANISTAN                                                                                                 5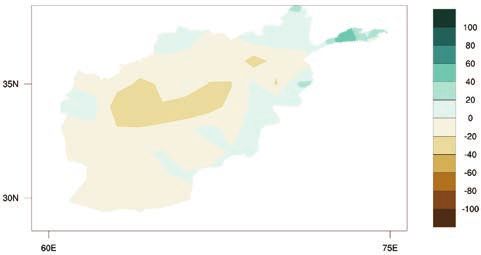
Key Trends
Temperature
While data availability for Afghanistan is somewhat limited, most records agree that there was warming of well over
1°C across most regions of Afghanistan over the 20th century. This is shown by the Berkeley Earth dataset,14 which
suggests an average change of around +1.5°C between the periods 1900–1917, and 2000–2017. Afghanistan’s
Second National Communication to the UNFCCC (NC2) (2019) also reports increased frequency of hot days
and nights.15 Warming has been strongest in Afghanistan’s central and southwestern regions, and weakest in the
northeast in the vicinity of Afghanistan’s largest glaciers.9

Precipitation
Precipitation trends in Afghanistan over the past century have varied by region, with few areas of the country
registering statistically significant changes. On the other hand, there has been a significant increase in the severity
of drought in certain parts of the country. Between 1901
and 2010, there was a significant increase in drought
severity in the southern provinces of Kandahar, Helmand              A precautionary approach
and Nimruz during the wheat growing season (November
to May), whereas drought intensity during the corn and               Studies published since the last iteration
rice growing seasons (primarily July to September)                   of the IPCC’s report (AR5), such as Gasser
worsened significantly in the western third of Afghanistan’s         et al. (2018), have presented evidence which
territory. These changes in drought severity were most
          16                                                         suggests a greater probability that earth will
pronounced in the far western areas bordering Iran. Some
                                                       16            experience medium and high-end warming
changes in precipitation patterns were observed between              scenarios than previously estimated.17 Climate
1951–2010 across Afghanistan, including slight (
Climate Future
Overview
The main data source for the World Bank Group’s Climate Change Knowledge Portal (CCKP) is the Coupled
Model Inter-comparison Project Phase 5 (CMIP5) models, which are utilized within the Fifth Assessment Report
(AR5) of the Intergovernmental Panel on Climate Change (IPCC), providing estimates of future temperature
and precipitation. Four Representative Concentration Pathways (i.e. RCP2.6, RCP4.5, RCP6.0, and RCP8.5) were
selected and defined by their total radiative forcing (cumulative measure of greenhouse gas [GHG] emissions
from all sources) pathway and level by 2100. In this analysis, RCP2.6 and RCP8.5, the extremes of low and high
emissions pathways, are the primary focus: RCP2.6 represents a very strong mitigation scenario, whereas RCP8.5
assumes a business-as-usual. For more information, please refer to the RCP Database.
For Afghanistan, these models show a trend of consistent warming across different emissions scenarios. Projections
in rainfall have greater uncertainty and vary by both RCP scenario as well as model. Projected precipitation trends
indicate a minimal reduction in average daily rainfall, but an increase in intensity for extreme rainfall events. Tables 2
and 3 below, provide information on temperature projections and anomalies for the four RCPs over two distinct time
horizons; presented against the reference period of 1986–2005.
TABLE 2. Projected anomaly (changes °C) for maximum, minimum, and average daily
temperatures in Afghanistan for 2040–2059 and 2080–2099, from the reference period of
1986–2005 for all RCPs. The table shows the median of the CCKP model ensemble and the
10th–90th percentiles in brackets18
Average Daily Maximum Average Daily Minimum
Temperatures Average Daily Temperatures Temperatures
Scenario 2040–2059 2080–2099 2040–2059 2080–2099 2040–2059 2080–2099
1.5 1.5 1.5 1.4 1.5 1.3
RCP2.6
(–0.1, 3.4) (–0.3, 3.4) (0.0, 3.1) (–0.1, 3.1) (–0.1, 3.3) (–0.3, 3.2)
2.1 2.9 2.0 2.7 1.9 2.6
RCP4.5
(0.4, 3.9) (1.7, 4.9) (0.4, 3.6) (1.0, 4.5) (0.2, 3.9) (0.7, 4.8)
1.7 3.7 1.7 5.4 1.7 3.3
RCP6.0
(0.3, 3.6) (1.9, 5.8) (0.4, 3.2) (2.0, 3.8) (0.0, 3.3) (1.6, 5.3)
2.7 5.8 2.6 5.5 2.6 5.5
RCP8.5
(0.9, 4.6) (3.8, 8.1) (1.1, 4.3) (3.8, 7.5) (0.7, 4.5) (3.4, 7.6)
18
World Bank Climate Change Knowledge Portal (2018). Climate Data: Projection. URL: https://climateknowledgeportal.worldbank.org/
country/afghanistan/climate-data-projections
CLIMATE RISK COUNTRY PROFILE: AFGHANISTAN 7TABLE 3. Projections of average temperature changes (°C) in Afghanistan for different seasons
(3-monthly time slices) over selected time horizons and emissions pathways, showing the median
estimates of the full CCKP model ensemble and the 10th and 90th percentiles in brackets18
2040–2059 2080–2099
Scenario Jun–Aug Dec–Feb Jun–Aug Dec–Feb
1.8 1.4 1.7 1.3
RCP2.6
(0.3, 3.4) (0.0, 3.0) (–0.1, 3.5) (–0.3, 2.8)
2.2 1.9 3.0 2.7
RCP4.5
(0.4, 3.8) (0.4, 3.4) (1.2, 5.0) (1.2, 4.5)
2.0 1.7 3.7 3.4
RCP6.0
(0.6, 3.4) (0.1, 2.8) (2.5, 5.8) (1.7, 5.0)
2.7 2.5 5.8 5.3
RCP8.5
(1.3, 4.2) (0.8, 4.1) (4.2, 7.9) (3.4, 7.3)
Model Ensemble
Climate projections presented in this profile
are derived from datasets available through the FIGURE 4. ‘Projected average temperature
CCKP, unless otherwise stated. These datasets anomaly’ and ‘projected annual rainfall
are processed outputs of simulations performed anomaly’ in Afghanistan. Outputs of 16 models
by multiple General Circulation Models (GCM) within the ensemble simulating RCP8.5 over
(for further information see Flato et al., 2013).19 the period 2080–2099. Models shown represent
Collectively, these different GCM simulations the subset of models within the CMIP5 ensemble
are referred to as the ‘model ensemble’. Due which provide projections across all RCPs and,
to the differences in the way GCMs represent therefore-are most robust for comparison. Three
the key physical processes and interactions models are labelled.
within the climate system, projections of future 9
climate conditions can vary widely between
Average temperature anomaly (oC)
8
gfdl_cm3
different GCMs, this is particularly the case for 7
6
rainfall related variables and at national and
5 mri_cgcm3
local scales. The range of projections from 16 4 fio_esm
GCMs on the indicators of average temperature 3
Median,
anomaly and annual precipitation anomaly for 2 10th and 90th
Percentiles
Afghanistan under RCP8.5 is shown in Figure 4. 1
0
Future projections of annual temperature –40% –30% –20% –10% 0% 10% 20%
Average annual precipitation anomaly (%)
and precipitation for mid and late century are
presented in Figure 5.
19
Flato, G., Marotzke, J., Abiodun, B., Braconnot, P., Chou, S. C., Collins, W., . . . Rummukainen, M. (2013). Evaluation of Climate Models.
Climate Change 2013: The Physical Science Basis. Contribution of Working Group I to the Fifth Assessment Report of the
Intergovernmental Panel on Climate Change, 741–866. URL: http://www.climatechange2013.org/images/report/WG1AR5_ALL_FINAL.pdf
CLIMATE RISK COUNTRY PROFILE: AFGHANISTAN 8Spatial Variation
FIGURE 5. CMIP5 ensemble projected change (32 GCMs) in annual temperature (top) and
precipitation (bottom) by 2040–2059 (left) and by 2080–2090 (right) relative to 1986–2005
baseline under RCP8.520
Temperature
Projections of temperature change are presented in three primary formats. Table 2 shows the changes (anomalies)
in daily maximum and minimum temperatures over the given time period, as well as changes in the average
temperature. Figures 6 and 7 display the annual and monthly average temperature projections. While similar,
these three indicators can provide slightly different information. Monthly and annual average temperatures are
most commonly used for general estimation of climate change, but the daily maximum and minimum can explain
more about how daily life might be impacted in a region, via key variables such as the viability of ecosystems,
health impacts, productivity of labor, and the yield of crops, which are often disproportionately influenced by
temperature extremes.
20
WBG Climate Change Knowledge Portal (CCKP 2019). Afghanistan. Climate Data. Projections. URL: https://climateknowledgeportal.
worldbank.org/country/afghanistan/climate-data-projections
CLIMATE RISK COUNTRY PROFILE: AFGHANISTAN 9FIGURE 6. Historic and projected mean FIGURE 7. Projected change in monthly
annual temperature in Afghanistan under temperature, shown by month, for Afghanistan
RCP2.6 (blue) and RCP8.5 (red) estimated for the period 2080–2099 under RCP8.5.
by the model ensemble. Shading represents The values shown represent the median of
the standard deviation of the model the model ensemble with the shaded areas
ensemble.21 showing the 10th–90th percentiles.22
21 8.5
20 8.0
19 7.5
7.0
18
6.5
17
degreesC
6.0
degC
16
5.5
15 5.0
14 4.5
13 4.0
12 3.5
1980 2000 2020 2040 2060 2080 2100 3.0
Year Jan Feb Mar Apr May Jun Jul Aug Sep Oct Nov Dec
Historical RCP 2.6 RCP 4.5 RCP 6.0 RCP 8.5
There is good agreement among climate models that Afghanistan can expect levels of warming above the global
average. The ensemble projects an average rise of 5.5°C by the 2080s and the 2090s, under the highest emission
pathway (RCP8.5). This is significantly higher than the projected global average rise of 3.7°C over the 1986–2005
baseline. In comparison, the rise projected under the lowest emission pathway (RCP2.6) of 1.4°C highlights what
could be achieved through dramatic reductions in global greenhouse gas emissions. Such efforts might also
protect Afghanistan from even more extreme projected rises in minimum and maximum temperature. There is some
evidence in the CCKP model ensemble that temperature rises may be greater in the late summer months of August
and September, but further modelling is required to better constrain these estimates.
Precipitation
The CCKP climate model ensemble suggests minimal change to the average annual precipitation total over the
21st century, as well as little change to the intensity of multi-day precipitation extremes in Afghanistan. However,
there is considerable uncertainty in these projections. This is shown by the range in Figure 8 and the different
directions of change projected by individual models in Figure 4. Large uncertainty is also reported by other
modelling studies looking at Afghanistan.9 Some downscaling analyses have been conducted on a limited subset
of models for the Kabul river basin region in the East of Afghanistan, which indicate 10%–20% increases in
annual precipitation23, as well as projections of a decrease.24
21
World Bank Climate Change Knowledge Portal (2018). Climate by Sector: Interactive Climate Indicator Dashboard. URL: https://
climateknowledgeportal.worldbank.org/country/afghanistan/climate-sector-energy
22
World Bank Climate Change Knowledge Portal (2018). Climate by Sector: Interactive Climate Indicator Dashboard. URL: https://
climatedata.worldbank.org/CRMePortal/web/agriculture/crops-and-land-management?country=AFG&period=2080-2099
23
Iqbal, M. S., Dahri, Z. H., Querner, E. P., Khan, A., & Hofstra, N. (2018). Impact of Climate Change on Flood Frequency and Intensity in
the Kabul River Basin. Geosciences, 8(4). URL: https://www.mdpi.com/2076-3263/8/4/114
24
Bokhari, S. A. A., Ahmad, B., Ali, J., Ahmad, S., Mushtaq, H., & Rasul, G. (2018). Future Climate Change Projections of the Kabul
River Basin Using a Multi-model Ensemble of High-Resolution Statistically Downscaled Data. Earth Systems and Environment, 2(3),
477–497. URL: http://www.lead.org.pk/lead/Publications/Future%20Climate%20Change%20Projections%20of%20the%20Kabul%20
River%20Basin%20using%20a%20multi-model%20ensemble%20of%20High-Resolution%20Statistically%20Downscaled%20Data.pdf
CLIMATE RISK COUNTRY PROFILE: AFGHANISTAN 10While considerable uncertainty surrounds
projections of local, long-term precipitation FIGURE 8. Projected average annual
changes, some global trends are evident. The precipitation for Afghanistan in the period
intensity of sub-daily extreme rainfall events 2080–209927
appears to be increasing with temperature — 700
a finding supported by evidence from different 600
regions of Asia.25 There is some limited evidence of
500
this trend emerging in Afghanistan, with 10%–25%
mm
400
increases in flash rainfall intensity documented
300
in northeastern, eastern, and southern regions.26
However, as this phenomenon is highly dependent 200
on local geographical contexts, further research 100
Historical RCP 2.6 RCP 4.5 RCP 6.0 RCP 8.5
is required to constrain its impact in Afghanistan.
CLIMATE-RELATED NATURAL HAZARDS
A
fghanistan faces some of the highest levels of natural hazard risk in the world. This is reflected in its
ranking as the 5th most at-risk country in the INFORM 2019 Index.28 Risk is driven by hazard exposure,
notably communities face very significant impacts from flood (and associated threats from land and
mudslide), and drought. Risk is further amplified by very high levels of social vulnerability and a large deficit in
coping capacity (Table 4).
TABLE 4. Selected indicators from the INFORM 2019 Index for Risk Management for Afghanistan.
For the sub-categories of risk (e.g. “Flood”) higher scores represent greater risks. Conversely the
most at-risk country is ranked 1st. Global average scores are shown in brackets.
Lack of Overall
Tropical Coping Inform
Flood Cyclone Drought Vulnerability Capacity Risk Level Rank
(0–10) (0–10) (0–10) (0–10) (0–10) (0–10) (1–191)
7.2 [4.5] 0.0 [1.7] 7.9 [3.2] 8.2 [3.6] 7.2 [4.5] 8.0 [3.8] 5
25
Westra, S., Fowler, H. J., Evans, J. P., Alexander, L. V., Berg, P., Johnson, F., Kendon, E. J., Lenderink, G., Roberts, N. (2014). Future
changes to the intensity and frequency of short-duration extreme rainfall. Reviews of Geophysics, 52, 522–555. URL: https://agupubs.
onlinelibrary.wiley.com/doi/full/10.1002/2014RG000464
26
National Environment Protection Agency/UNEP/WFP (2016). Climate change in Afghanistan: What does it mean for rural livelihoods
and food security? United Nations Environment Programme (UNEP). URL: https://postconflict.unep.ch/publications/Afghanistan/
Afg_CC_RuralLivelihoodsFoodSecurity_Nov2016.pdf
27
WBG Climate Change Knowledge Portal (CCKP 2019). Afghanistan Water Sector Dashboard. URL: https://climatedata.worldbank.
org/CRMePortal/web/water/land-use-/-watershed-management?country=AFG&period=2080-2099
28
European Commission (2019). INFORM Index for Risk Management. Afghanistan Country Profile. URL: https://drmkc.jrc.ec.europa.
eu/inform-index/Countries/Country-Profile-Map
CLIMATE RISK COUNTRY PROFILE: AFGHANISTAN 11Heat Waves
Afghanistan regularly experiences high maximum temperatures. The national average monthly maximum is
around 20°C, with July maximum averages around 33°C. These national averages hide considerable sub-
national variations and some extremely hot areas such as the cities of Kandahar (pop. 550,000) and Herat
(pop. 440,000), which experience average July maxima of around 40°C and 37°C, respectively. The World
Bank’s GFDRR ThinkHazard! Portal designates
the extreme heat hazard faced in Afghanistan’s
FIGURE 9. Historical (1986–2005) and
lower altitudes zones as ‘high’. 29 Given the
projected (2080–2099) frequency of days in
significant projected rises in temperature, the
which maximum temperature surpasses 35°C31
heatwave hazard (intensity and frequency) is
140
expected to increase significantly.9 Projections
130
suggest that an extreme heatwave could occur 120
every 6–10 years in Afghanistan under the 110
RCP4.5 emissions pathway, or at every 1–2 years 100
days
under the highest emissions pathway (RCP8.5). 30 90
80
Under all but the lowest emissions pathway
70
(RCP2.6) temperatures will more regularly
60
exceed 35°C (Figure 9) and, particularly under 50
the highest emissions pathway (RCP8.5), could 40
Historical RCP 2.6 RCP 4.5 RCP 6.0 RCP 8.5
reach levels that are unsafe for human life.
Drought
Two primary types of drought affect Afghanistan, meteorological (usually associated with a precipitation deficit)
and hydrological (usually associated with a deficit in surface and subsurface water flow, potentially originating
in the region’s wider river basins). These issues may also combine with land and crop management practices to
result in agricultural drought. At present, Afghanistan faces significant drought issues which have direct impacts
on livelihoods and the economy.32 Although there are few studies that have quantified their precise impact, drought
events such as that of 2011 have been known to push millions into food insecurity and poverty. Water resources
provided by runoff from mountainous regions are not well distributed to those sectors and communities who need
them most and are often lost to inadequate and derelict infrastructure.33
29
ThinkHazard! (2019). Afghanistan Extreme Heat. URL: http://thinkhazard.org/en/
30
Russo, S., Dosio, A., Graversen, R.G., Sillmann, J., Carrao, H., Dunbar, M.B., Singleton, A., Montagna, P., Barbola, P. & Vogt, J.V., (2014).
Magnitude of extreme heat waves in present climate and their projection in a warming world. Journal of Geophysical Research:
Atmospheres, 119, 12500–12512. URL: http://www.theurbanclimatologist.com/uploads/4/4/2/5/44250401/extremeheatwaves.pdf
31
WBG Climate Change Knowledge Portal (CCKP 2019). Afghanistan Water Sector Dashboard. URL: https://climatedata.worldbank.org/
CRMePortal/web/water/land-use-/-watershed-management?country=AFG&period=2080-2099
32
Pervez, M. S., Budde, M., & Rowland, J. (2014). Mapping irrigated areas in Afghanistan over the past decade using
MODIS NDVI. Remote Sensing of Environment, 149, 155–165. URL: https://digitalcommons.unl.edu/cgi/viewcontent.
cgi?referer=&httpsredir=1&article=1850&context=usgsstaffpub
33
Ward, F. A., Amer, S. A., & Ziaee, F. (2013). Water allocation rules in Afghanistan for improved food security. Food Security, 5(1), 35–53.
URL: https://water-research.nmsu.edu/files/2016/09/afghan-water-nov-2012.pdf
CLIMATE RISK COUNTRY PROFILE: AFGHANISTAN 12Research into the situation of farming households in Herat Province, in the west of the country indicates
the numerous negative economic, social and environmental impacts of drought in Afghanistan.34 Within this
context, drought was found to severely reduce the availability of employment for unskilled workers, impacting
their living standards and financial situation. The social implications of drought included conflict over water
resources, an increase in migration and knock-on effects on mental and physical health and educational outcomes.
Existing adaptation strategies in use in Herat Province were found to be ineffective in cases of severe drought.35
The nation’s southeastern region is already chronically drought-impacted. As a proportion of Afghanistan’s
total land surface, the area affected is likely to expand considerably as a result of climate change. Naumann
et al. (2018) provide a global overview of changes in drought conditions under different warming scenarios and
highlight a potential doubling or tripling in the frequency of extreme drought events in Afghanistan by the middle
of the century.36 Meteorological drought issues are already increasing as a result of reduced spring precipitation
and increased evaporation rates across the northwest, central and northeastern regions. At the same time
hydrological drought has also emerged in the northeast due to reduced snowfall feeding of river systems.37
Historically, this glacial meltwater has been vital to maintaining Afghanistan’s water supply during drought
years. The ongoing reduction in glacial mass in the region is projected to lead to reduced runoff in the second
half of the 21st century, which would exacerbate the impact of drought on water supply in Afghanistan.38
In depth research into these trends is urgently needed, but what evidence has been assembled suggests there
is widespread livelihood vulnerability to these risks across Afghanistan.
Flood
Flood risk is widespread in Afghanistan, despite the generally arid, low-precipitation, environment. Data are
severely limited, but there is sufficient evidence to say that flooding causes at least 100 deaths per year (likely
a considerable underestimate), and that Afghanistan is a regionally significant disaster hotspot.39 Flooding
also increases the risk of waterborne diseases and has been identified as a causal factor in high rates of
anemia among women of reproductive age in Afghanistan.40 There have been attempts to remotely map flood
hazard across Afghanistan.41,42 Flash flooding together with land and mudslides are of particular concern. As
34
Iqbal, M.W, Donjadee, S., Kwanyuen, B., & Liu, S.Y. (2018). Farmers’ perceptions of and adaptations to drought in Herat Province,
Afghanistan. Journal of Mountain Science 15(8). URL: https://link.springer.com/content/pdf/10.1007%2Fs11629-017-4750-z.pdf
35
National Environmental Protection Agency (2013). Afghanistan Initial National Communication to the UNFCCC. Islamic Republic of
Afghanistan. URL: https://unfccc.int/sites/default/files/resource/afgnc1_0.pdf
36
Naumann, G., Alfieri, L., Wyser, K., Mentaschi, L., Betts, R. A., Carrao, H., . . . Feyen, L. (2018). Global Changes in Drought Conditions
Under Different Levels of Warming. Geophysical Research Letters, 45(7), 3285–3296. URL: https://agupubs.onlinelibrary.wiley.com/
doi/epdf/10.1002/2017GL076521
37
National Environmental Protection Agency (2013). Afghanistan Initial National Communication to the UNFCCC. Islamic Republic of
Afghanistan. URL: https://unfccc.int/sites/default/files/resource/afgnc1_0.pdf
38
Pritchard, H.D. (2019). Asia’s shrinking glaciers protect large populations from drought stress. Nature, 569, 649–654. URL: https://
www.ncbi.nlm.nih.gov/pubmed/31142854
39
Elalem, S., & Pal, I. (2015). Mapping the vulnerability hotspots over Hindu-Kush Himalaya region to flooding disasters. Weather and
Climate Extremes, 8, 46–58. URL: https://www.sciencedirect.com/science/article/pii/S2212094714000929
40
Oskorouchi, H.R., Nie, P. & Sousa-Poza, A. (2018). The effect of floods on anemia among reproductive age women in Afghanistan. PloS
One, 13, p.e0191726. URL: https://www.ncbi.nlm.nih.gov/pubmed/29425219
41
Hagen, E., Shroder, J. F., Lu, X. X., & Teufert, J. F. (2010). Reverse engineered flood hazard mapping in Afghanistan: A parsimonious
flood map model for developing countries. Quaternary International, 226(1), 82–91. URL: https://courses.nus.edu.sg/course/
geoluxx%5Cnotes/2010%20Emlyn%20Hagen%20et%20al%20in%20QI.pdf
42
Bahadurzai, M., Shrestha, A. (2009). Flash flood risk assessment for Afghanistan. International Centre for Integrated Mountain
Development (ICIMOD). URL: http://lib.icimod.org/record/26743/files/c_attachment_648_5831.pdf
CLIMATE RISK COUNTRY PROFILE: AFGHANISTAN 13well as floods triggered by intense precipitation events, Afghanistan’s mountainous regions are also exposed
to the risk of glacier lake outburst floods (GLOFs), which occur when the natural ‘moraine’ dam holding back
glacier meltwater breaches. Analysis of satellite images has shown that glacial lakes in the area of the sources
of the Amu Darya (including northeastern regions of Afghanistan) grew significantly in size between 1968
and 2009, suggesting an increased risk of GLOFs in the years to come.43 Finally, Afghanistan’s communities
are also exposed to river ‘fluvial’ flooding. The World Resources Institute’s AQUEDUCT Global Flood
Analyzer can be used to establish a baseline level of river flood exposure. As of 2010, assuming protection
for up to a 1-in-10-year event, the population annually affected by flooding in Afghanistan is estimated at
334,700 people and the impact on GDP is estimated at $411.1 million.44
There is limited research on climate change and flooding trends in Afghanistan. Some global models, such as
that of Willner et al. (Table 5) and the AQUEDUCT model44 suggest either no change, or small reduction in the
number of people exposed to river flooding as a result of climate change. This trend links to the projected drying of
Afghanistan, including some of its water courses, but will miss potentially increasing risks of surface water (pluvial)
flooding. Other studies have suggested that some sections of the Helmand river basin have already experienced
increases in flood risk due to snow and glacier melt.26 Further studies utilizing limited sets of downscaled climate
models have suggested increased river flood risk. For example, one study found that a 1 in 50-year flow in the
Kabul river basin could become a 1 in 10-year event by the 2030s to the 2050s.23 These findings are highly
uncertain and, given the ongoing melting of many of Afghanistan’s glaciers, further research is urgently required
to understand future trends.45
TABLE 5. Estimated number of people in Afghanistan affected by an extreme river flood
(extreme flood is defined as being in the 90th percentile in terms of numbers of people affected)
in the historic period 1971–2004 and the future period 2035–2044. Figures represent an average
of all four RCPs and assume present day population distributions (Willner et al., 2018).46
Population Exposed Population Exposed Increase
to Extreme Flood to Extreme Flood in Affected
Estimate (1971–2004) (2035–2044) Population
16.7 Percentile 1,140,068 1,095,624 -44,444
Median 1,201,590 1,150,562 -51,028
83.3 Percentile 1,278,706 1,231,190 -47,516
43
Mergili, M., Müller, J.P. and Schneider, J.F. (2013). Spatio-temporal development of high-mountain lakes in the headwaters of the
Amu Darya River (Central Asia). Global and Planetary Change, 107, 13–24. URL: https://www.sciencedirect.com/science/article/pii/
S092181811300091X?via%3Dihub
44
WRI (2018). AQUEDUCT Global Flood Analyzer. URL: https://floods.wri.org/ [Accessed: 22/11/2018]
45
Bajracharya, S. R., Maharjan, S. B., Shrestha, F., Guo, W., Liu, S., Immerzeel, W., & Shrestha, B. (2015). The glaciers of the Hindu Kush
Himalayas: current status and observed changes from the 1980s to 2010. International Journal of Water Resources Development,
31(2), 161–173. URL: https://www.tandfonline.com/doi/pdf/10.1080/07900627.2015.1005731?needAccess=true
46
Willner, S., Levermann, A., Zhao, F., Frieler, K. (2018). Adaptation required to preserve future high-end river flood risk at present levels.
Science Advances: 4:1. URL: https://advances.sciencemag.org/content/4/1/eaao1914
CLIMATE RISK COUNTRY PROFILE: AFGHANISTAN 14CLIMATE CHANGE IMPACTS
Natural Resources
Water
Afghanistan’s water resources situation is nuanced. The nation is arid, water scarce, and regularly drought afflicted,
but simultaneously has access to significant water resource derived mainly (80%) from runoff from mountains over
2,000 m.47 The most significant rivers by discharge volume are: the Amu Darya, running along the country’s northern
border; the Helmand river (and its wider drainage basin) in the south; and the Kabul/Kunar river network in the
east. Analysis has suggested that Afghanistan contains several rivers which are already regionally significant in
terms of their vulnerability across environmental, governance, economic, and social indicators. The Helmand River
Basin is particularly vulnerable, and there is also concern about the Hari Rud and Amu Darya.48 Multiple common
water management issues include siltation of reservoirs, lack of flow monitoring, and inefficient infrastructure
maintenance and operation.49
Traditional water sources for those living further from rivers in Afghanistan are also vulnerable to the impacts of
climate change. Karezes (hand-dug systems of tunnels) have traditionally been used to supply water to areas at
the southern and western fringes of the Hindu Kush and Paropamisus mountains.50 Many of these karezes, which
access ground water via subsurface canals, have dried up in the past two decades.50 This reduction in water supply
is likely to be compounded by projected temperature increases, via an accompanying reduction in snow cover at
the sources of karezes.
The need for improved management practices is clear, but the status of the snow and glaciers which feed these rivers
will also be of paramount importance to the future of Afghanistan’s water resources. The available analysis suggests
that the total ice mass held within the glacier systems, which feeds Afghanistan’s rivers is declining.45 In the short-term
(i.e. current-day to the 2050s) it is likely that the runoff from major river systems will maintain or even increase as
a result of glacier melting. Depending on changes in regional precipitation, loss of glaciers is likely to significantly
reduce runoff over the longer-term. Changes to the runoff regime are also likely to develop over coming decades
as the smoothing effect of glacier melt reduces, and spring and early-summer runoff peaks grow.51 Studies suggest
47
Shroder, J. F., & Ahmadzai, S. J. (2016). Transboundary Water Resources in Afghanistan: Climate Change and Land-Use
Implications. Elsevier. URL: https://www.elsevier.com/books/transboundary-water-resources-in-afghanistan/shroder/978-0-12-801886-6
48
Varis, O., & Kummu, M. (2012). The Major Central Asian River Basins: An Assessment of Vulnerability. International Journal of Water
Resources Development, 28(3), 433–452. URL: https://www.tandfonline.com/doi/abs/10.1080/07900627.2012.684309
49
Goes, B. J. M., Howarth, S. E., Wardlaw, R. B., Hancock, I. R., & Parajuli, U. N. (2016). Integrated water resources management in an
insecure river basin: a case study of Helmand River Basin, Afghanistan. International Journal of Water Resources Development, 32(1),
3–25. URL: https://www.tandfonline.com/doi/full/10.1080/07900627.2015.1012661
50
Macpherson, G.L., Johnson, W.C., & Liu, H. (2017). Viability of karezes (ancient water supply systems in Afghanistan) in a changing
world. Applied Water Science, 7, 1689–1710. URL: https://link.springer.com/article/10.1007/s13201-015-0336-5
51
Siegfried, T., Bernauer, T., Guiennet, R., Sellars, S., Robertson, A. W., Mankin, J., . . . Yakovlev, A. (2012). Will climate change exacerbate
water stress in Central Asia? Climatic Change, 112(3), 881–899. URL: https://ideas.repec.org/a/spr/climat/v112y2012i3p881-899.html
CLIMATE RISK COUNTRY PROFILE: AFGHANISTAN 15a potential decline in runoff from the Amu Darya of 10%–20% by the 2070s to the 2090s.52 These declines, in
combination with temperature, evaporation and carbon dioxide (CO2)-level changes, are likely to place significant
strain on irrigation systems which will in turn create trans-boundary water management challenges53 and potentially
crop production losses. These changes, in the context of ongoing, rapid, and weakly regulated development, place
increasing importance on land use planning, regulation and protection of ecosystem services, such as forest cover,
which stabilize water resources.54
Land, Soil, and Biodiversity
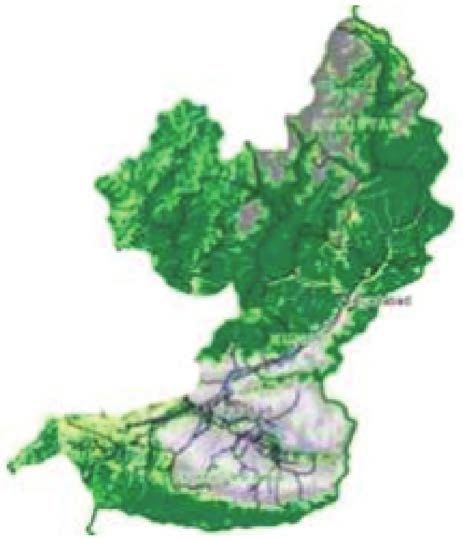
Over recent decades, Afghanistan has seen rapid removal of its forest and shrub cover (Figure 10). Alongside
extensive overgrazing, these changes in vegetation cover have accelerated soil erosion, land degradation, and
biodiversity loss.55 As a result of projected increases in temperature and drought, many of Afghanistan’s ecosystems
are projected to undergo an ecological transition. Under higher emissions pathways, regions in both the west and east
of Afghanistan’s Hindu Kush mountain range are expected to convert from a sub-humid to semi-arid classification. A
likely consequence of climate-driven shifts in ecozones will be a realignment of the viable ranges for many plant and
animal species. In some cases, such as the snow leopard, there may be significant shrinkage of the viable habitat.56 For
others, such as the date palm tree, habitat lost in traditional locations may be replaced in other more northerly regions
of the country.57 In general terms, shifts are expected to be either away from the equator (northerly) or upslope (to
higher altitudes),58 hence the outlook for species currently inhabiting very high-altitude areas is precarious.
Economic Sectors
Agriculture
There is a high dependence on agriculture for livelihood and subsistence in Afghanistan, with the sector
employing almost half the working population. Natural hazards represent a regular threat to local production and
communities in the agricultural sector. As reported in Afghanistan’s NC1, the nation was persistently affected
by drought throughout the period 1997–2007, which was an influential factor in a 50% reduction in livestock
52
White, C. J., Tanton, T. W., & Rycroft, D. W. (2014). The Impact of Climate Change on the Water Resources of the Amu Darya
Basin in Central Asia. Water Resources Management, 28(15), 5267–5281. URL: https://pureportal.strath.ac.uk/en/publications/
the-impact-of-climate-change-on-the-water-resources-of-the-amu-da
53
Laghari, A.N., Vanham, D. & Rauch, W. (2012). The Indus basin in the framework of current and future water resources management.
Hydrology and Earth System Sciences, 16, 1063–1083. URL: https://www.hydrol-earth-syst-sci.net/16/1063/2012/
54
Najmuddin, O., Deng, X., & Siqi, J. (2017). Scenario analysis of land use change in Kabul River Basin – A river basin with rapid socio-
economic changes in Afghanistan. Physics and Chemistry of the Earth, Parts A/B/C, 101, 121–136. URL: https://app.dimensions.ai/
details/publication/pub.1090583150?and_facet_journal=jour.1294780&and_facet_for=2558
55
Shroder, J. F. (2012). Afghanistan: rich resource base and existing environmental despoliation. Environmental Earth Sciences, 67(7),
1971–1986. URL: https://pubag.nal.usda.gov/catalog/372575
56
Lovari, S., Ventimiglia, M., & Minder, I. (2013). Food habits of two leopard species, competition, climate change and upper treeline:
a way to the decrease of an endangered species? Ethology Ecology & Evolution, 25(4), 305–318. URL: https://www.tandfonline.com/
doi/abs/10.1080/03949370.2013.806362
57
Shabani, F., Kumar, L., & Taylor, S. (2012). Climate Change Impacts on the Future Distribution of Date Palms: A Modeling Exercise
Using CLIMEX. PLOS ONE, 7(10), 1–12. URL: https://journals.plos.org/plosone/article?id=10.1371/journal.pone.0048021
58
Shah, R. D. T., Shah, D. N., & Domisch, S. (2012). Range shifts of a relict Himalayan dragonfly in the Hindu Kush Himalayan region
under climate change scenarios. International Journal of Odonatology, 15(3), 209–222. URL: https://www.tandfonline.com/doi/abs/
10.1080/13887890.2012.697399
CLIMATE RISK COUNTRY PROFILE: AFGHANISTAN 16FIGURE 10. Change in Afghanistan Forestry Cover, 1977 (left) to 2002 (right)59
numbers. Staple crops such as wheat are also highly susceptible to water shortages, with yields reducing by
up to 50% during droughts in 2017–2018.60 Studies have also shown that the irrigated agricultural production
area can reduce by as much as 30% in years of water scarcity, indicating major livelihood impacts. 32 Due to
its resilience to drought, cultivation of the opium poppy is correlated with drought conditions and has seen
resurgence in the early 21st century.61
Despite the relative size of its agricultural sector, Afghanistan remains a net food importer in financial value
terms, and as such is vulnerable to external price shocks. In recent years, annual cereal imports have been
equivalent to 29% of annual domestic cereal production, driven in part by a lack of wheat milling capacity within
the country.62 At the same time, the population is heavily reliant on wheat for their food consumption, with this
staple crop providing up to two-thirds of the average person’s daily caloric intake.63 The countries exporting
wheat to Afghanistan, such as Kazakhstan, which has accounted for a large proportion of the country’s imports
59
National Environmental Protection Agency (2013). Afghanistan Initial National Communication to the UNFCCC. Islamic Republic of
Afghanistan. P. 16. URL: https://unfccc.int/sites/default/files/resource/afgnc1_0.pdf
60
Government of the Islamic Republic of Afghanistan (2018). Country Statement. URL: https://www.unisdr.org/files/globalplatform/
afghanistancountrystatement.pdf [accessed 08/05/2019]
61
Parenti, C. (2015). Flower of War: An Environmental History of Opium Poppy in Afghanistan. SAIS Review of International Affairs 35(1),
183–200. URL: https://muse.jhu.edu/article/582537/pdf
62
FAO (2019). GIEWS Country Brief: Afghanistan. URL: http://www.fao.org/giews/countrybrief/country/AFG/pdf/AFG.pdf
[accessed 15/08/2019].
63
d’Amour, C.B., Wenz, L., Kalkuhl, M., Steckel, J.C. and Creutzig, F. (2016). Teleconnected food supply shocks. Environ. Res. Lett,
11(035007). URL: https://iopscience.iop.org/article/10.1088/1748-9326/11/3/035007/meta
CLIMATE RISK COUNTRY PROFILE: AFGHANISTAN 17You can also read