BRAZIL CLIMATE RISK COUNTRY PROFILE - World Bank Climate Change Knowledge Portal
←
→
Page content transcription
If your browser does not render page correctly, please read the page content below
CLIMATE RISK COUNTRY PROFILE

         BRAZIL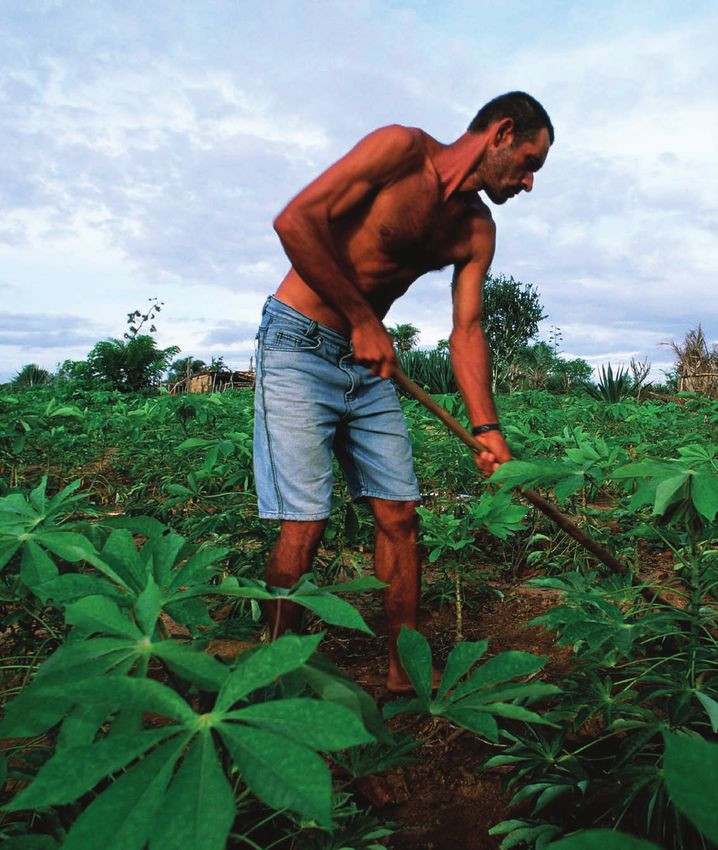
COPYRIGHT
© 2021 by the World Bank Group
1818 H Street NW, Washington, DC 20433
Telephone: 202-473-1000; Internet: www.worldbank.org

This work is a product of the staff of the World Bank Group (WBG) and with external contributions. The opinions, findings,
interpretations, and conclusions expressed in this work are those of the authors and do not necessarily reflect the views or the
official policy or position of the WBG, its Board of Executive Directors, or the governments it represents.

The WBG does not guarantee the accuracy of the data included in this work and do not make any warranty, express or implied,
nor assume any liability or responsibility for any consequence of their use. This publication follows the WBG’s practice in
references to member designations, borders, and maps. The boundaries, colors, denominations, and other information shown
on any map in this work, or the use of the term “country” do not imply any judgment on the part of the WBG, its Boards, or the
governments it represents, concerning the legal status of any territory or geographic area or the endorsement or acceptance
of such boundaries.

The mention of any specific companies or products of manufacturers does not imply that they are endorsed or recommended
by the WBG in preference to others of a similar nature that are not mentioned.

RIGHTS AND PERMISSIONS
The material in this work is subject to copyright. Because the WBG encourages dissemination of its knowledge, this work may
be reproduced, in whole or in part, for noncommercial purposes as long as full attribution to this work is given.

Please cite the work as follows: Climate Risk Profile: Brazil (2021): The World Bank Group.

Any queries on rights and licenses, including subsidiary rights, should be addressed to World Bank Publications, The World Bank
Group, 1818 H Street NW, Washington, DC 20433, USA; fax: 202-522-2625; e-mail: pubrights@worldbank.org.

Cover Photos: © Mariana Ceratti/World Bank, “Port of Salvador in All Saints Bay” February 20, 2013 via Flickr, Creative
Commons CC BY-NC-ND 2.0. © Scott Wallace/World Bank, “Man tending manioc field in Northeast Brazil” June 16, 2009 via
Flickr, Creative Commons CC BY-NC-ND 2.0.

Graphic Design: Circle Graphics, Inc., Reisterstown, MD.

CLIMATE RISK COUNTRY PROFILE: BRAZIL                                                                                          ii
ACKNOWLEDGEMENTS
This profile is part of a series of Climate Risk Country Profiles developed by the World Bank Group (WBG). The country profile
synthesizes most relevant data and information on climate change, disaster risk reduction, and adaptation actions and policies
at the country level. The country profile series are designed as a quick reference source for development practitioners to better
integrate climate resilience in development planning and policy making. . This effort is managed and led by Veronique Morin
(Senior Climate Change Specialist, WBG) and Ana E. Bucher (Senior Climate Change Specialist, WBG).

This profile was written by MacKenzie Dove (Senior Climate Change Consultant, WBG). Additional support was provided by
Fernanda Zermoglio (Senior Climate Change Consultant, WBG), Yunziyi Lang (Climate Change Analyst, WBG), and Jason
Johnston (Operations Analyst, WBG).

Climate and climate-related information is largely drawn from the Climate Change Knowledge Portal (CCKP), a WBG online
platform with available global climate data and analysis based on the latest Intergovernmental Panel on Climate Change (IPCC)
reports and datasets. The team is grateful for all comments and suggestions received from the sector, regional, and country
development specialists, as well as climate research scientists and institutions for their advice and guidance on use of climate
related datasets.

CLIMATE RISK COUNTRY PROFILE: BRAZIL                                                                                          iii
CONTENTS

FOREWORD  .  .  .  .  .  .  .  .  .  .  .  .  .  .  .  .  .  .  .  .  .  .  .  .  .  .  .  .  .  .  .  .  .  .  .  . 1

COUNTRY OVERVIEW .   .   .   .   .   .   .   .   .   .   .   .   .   .   .   .   .   .   .   .   .   .   .   .   .   .   .   .   .   .   .  2

CLIMATOLOGY  .   .   .   .   .   .   .   .   .   .   .   .   .   .   .   .   .   .   .   .   .   .   .   .   .   .   .   .   .   .   .   .   .   .   5
   Climate Baseline .  .  .  .  .  .  .  .  .  .  .  .  .  .  .  .  .  .  .  .  .  .  .  .  .  .  .  .  .  .  .  .  .  .  .  .  .  .  .  . 5
      Overview  .  .  .  .  .  .  .  .  .  .  .  .  .  .  .  .  .  .  .  .  .  .  .  .  .  .  .  .  .  .  .  .  .  .  .  .  .  .  .  .  .  . 5
      Key Trends .  .  .  .  .  .  .  .  .  .  .  .  .  .  .  .  .  .  .  .  .  .  .  .  .  .  .  .  .  .  .  .  .  .  .  .  .  .  .  .  . 7
   Climate Future .  .  .  .  .  .  .  .  .  .  .  .  .  .  .  .  .  .  .  .  .  .  .  .  .  .  .  .  .  .  .  .  .  .  .  .  .  .  .  .  . 8
      Overview  .  .  .  .  .  .  .  .  .  .  .  .  .  .  .  .  .  .  .  .  .  .  .  .  .  .  .  .  .  .  .  .  .  .  .  .  .  .  .  .  .  . 8
      Key Trends .  .  .  .  .  .  .  .  .  .  .  .  .  .  .  .  .  .  .  .  .  .  .  .  .  .  .  .  .  .  .  .  .  .  .  .  .  .  .  .  . 10

CLIMATE RELATED NATURAL HAZARDS .   .   .   .   .   .   .   .   .   .   .   .   .   .   .   .   .   .   .   .   .   . 11
   Overview .  .  .  .  .  .  .  .  .  .  .  .  .  .  .  .  .  .  .  .  .  .  .  .  .  .  .  .  .  .  .  .  .  .  .  .  .  .  .  .  .  .  . 11
   Key Trends .  .  .  .  .  .  .  .  .  .  .  .  .  .  .  .  .  .  .  .  .  .  .  .  .  .  .  .  .  .  .  .  .  .  .  .  .  .  .  .  .  . 13
   Implications for DRM .  .  .  .  .  .  .  .  .  .  .  .  .  .  .  .  .  .  .  .  .  .  .  .  .  .  .  .  .  .  .  .  .  .  .  .  .  . 15

CLIMATE CHANGE IMPACTS TO KEY SECTORS .   .   .   .   .   .   .   .   .   .   .   .   .   .   .   .   .   .   . 15
   Agriculture  .  .  .  .  .  .  .  .  .  .  .  .  .  .  .  .  .  .  .  .  .  .  .  .  .  .  .  .  .  .  .  .  .  .  .  .  .  .  .  .  .  . 16
   Water  .  .  .  .  .  .  .  .  .  .  .  .  .  .  .  .  .  .  .  .  .  .  .  .  .  .  .  .  .  .  .  .  .  .  .  .  .  .  .  .  .  .  .  . 19
   Energy  .  .  .  .  .  .  .  .  .  .  .  .  .  .  .  .  .  .  .  .  .  .  .  .  .  .  .  .  .  .  .  .  .  .  .  .  .  .  .  .  .  .  .  . 22
   Forestry  .  .  .  .  .  .  .  .  .  .  .  .  .  .  .  .  .  .  .  .  .  .  .  .  .  .  .  .  .  .  .  .  .  .  .  .  .  .  .  .  .  .  . 24
   Health .  .  .  .  .  .  .  .  .  .  .  .  .  .  .  .  .  .  .  .  .  .  .  .  .  .  .  .  .  .  .  .  .  .  .  .  .  .  .  .  .  .  .  . 27

ADAPTATION .   .   .   .   .   .   .   .   .   .   .   .   .   .   .   .   .   .   .   .   .   .   .   .   .   .   .   .   .   .   .   .   .   .   . 29
   Institutional Framework for Adaptation .  .  .  .  .  .  .  .  .  .  .  .  .  .  .  .  .  .  .  .  .  .  .  .  .  .  .  .  . 29
   Policy Framework for Adaptation  .  .  .  .  .  .  .  .  .  .  .  .  .  .  .  .  .  .  .  .  .  .  .  .  .  .  .  .  .  .  .  . 29
   Recommendations .  .  .  .  .  .  .  .  .  .  .  .  .  .  .  .  .  .  .  .  .  .  .  .  .  .  .  .  .  .  .  .  .  .  .  .  .  . 30
      Research Gaps .  .  .  .  .  .  .  .  .  .  .  .  .  .  .  .  .  .  .  .  .  .  .  .  .  .  .  .  .  .  .  .  .  .  .  .  .  .  . 30
      Data and Information Gaps .  .  .  .  .  .  .  .  .  .  .  .  .  .  .  .  .  .  .  .  .  .  .  .  .  .  .  .  .  .  .  .  .  . 31
      Institutional Gaps  .  .  .  .  .  .  .  .  .  .  .  .  .  .  .  .  .  .  .  .  .  .  .  .  .  .  .  .  .  .  .  .  .  .  .  .  .  . 31

CLIMATE RISK COUNTRY PROFILE: BRAZIL                                                                                                                 iv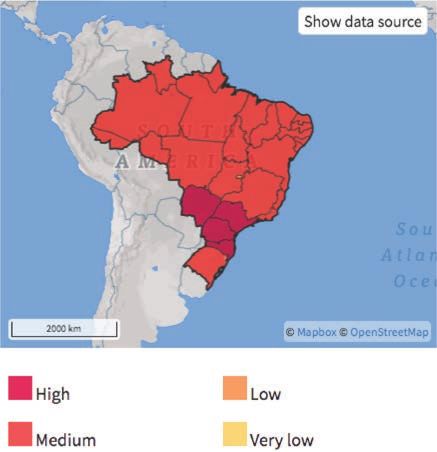
FOREWORD

Climate change is a major risk to good development outcomes, and the World Bank Group is committed to playing
an important role in helping countries integrate climate action into their core development agendas. The World
Bank Group is committed to supporting client countries to invest in and build a low-carbon, climate-resilient future,
helping them to be better prepared to adapt to current and future climate impacts.

The World Bank Group is investing in incorporating and systematically managing climate risks in development
operations through its individual corporate commitments.

A key aspect of the World Bank Group’s Action Plan on Adaptation and Resilience (2019) is to help countries
shift from addressing adaptation as an incremental cost and isolated investment to systematically incorporating
climate risks and opportunities at every phase of policy planning, investment design, implementation and evaluation
of development outcomes. For all IDA and IBRD operations, climate and disaster risk screening is one of the
mandatory corporate climate commitments. This is supported by the Bank Group’s Climate and Disaster Risk
Screening Tool which enables all Bank staff to assess short- and long-term climate and disaster risks in operations
and national or sectoral planning processes. This screening tool draws up-to-date and relevant information from
the World Bank’s Climate Change Knowledge Portal, a comprehensive online ‘one-stop shop’ for global, regional,
and country data related to climate change and development.

Recognizing the value of consistent, easy-to-use technical resources for client countries as well as to support
respective internal climate risk assessment and adaptation planning processes, the World Bank Group’s Climate
Change Group has developed this content. Standardizing and pooling expertise facilitates the World Bank Group in
conducting initial assessments of climate risks and opportunities across sectors within a country, within institutional
portfolios across regions, and acts as a global resource for development practitioners.

For developing countries, the climate risk profiles are intended to serve as public goods to facilitate upstream
country diagnostics, policy dialogue, and strategic planning by providing comprehensive overviews of trends
and projected changes in key climate parameters, sector-specific implications, relevant policies and programs,
adaptation priorities and opportunities for further actions.

It is my hope that these efforts will spur deepening of long-term risk management in developing countries and our
engagement in supporting climate change adaptation planning at operational levels.

Bernice Van Bronkhorst
Global Director
Climate Change Group (CCG)
The World Bank Group (WBG)

CLIMATE RISK COUNTRY PROFILE: BRAZIL                                                                                 1
COUNTRY OVERVIEW

B
         razil is the largest country in South America.
         It has an extensive coastline to the east,       FIGURE 1. Elevation in Brazil3
         covering over 7,491 kilometers (km),
along the Atlantic Ocean and a land area of
8,510,295 km2, making it the fifth largest country
in the world. The country shares a border with
Colombia, Venezuela, Guyana, Suriname, and
French Guiana in the northwest; Peru, and Bolivia in
the west; and Paraguay, Argentina, and Uruguay in
the southwest. The nation’s territory also includes
several oceanic islands: Fernando de Noronha,
Abrolhos and Trindade. In addition to harboring
over a third of the Earth’s tropical forests, Brazil is
home to an extremely rich flora and fauna and a rich
diversity of ecosystems including, but not limited to,
the Amazon forest, the Cerrado (central plateaus,
covering 21% land area), the Atlantic Forest
(forests which extend along the Atlantic coastline),
the Caatinga (desert shrubland in the northeast)
and the Pantanal wetlands(encompasses the
world’s largest wetland area, located along the western border) (Figure 1).1 Brazil’s diverse and abundant natural
resources, ecosystems, and significant biodiversity are world renowned. The national territory comprises six unique
biomes: Amazon, Caatinga, Cerrado, Atlantic Forest, Pampa, and Pantanal. The Amazon and Atlantic Forest are home
to humid and seasonal forests and significant biodiversity. The Caatinga is characterized by semi-arid climate and
arid plant life. Cerrado houses three major watersheds of South America, which makes it the richest savannah in
biodiversity worldwide.2

Brazil has a complex and dynamic economy and is classified as a developing country. While the country experienced
a period of economic and social progress between 2003 and 2014, in which more than 29 million people were
lifted out of poverty and inequality declined significantly, the economic recovery weakened from 2015 to
2018. The more frequent and continuing periods of recession, which started in 2015, have left the country ‘s
economy sluggish and created significant political upheaval, stagnating the gains and pace of poverty and inequality
reduction. In the first quarter of 2021, the unemployment rate reached 14.7%, the highest since 2012. 4 Brazil’s

1
    Brazil (2020). Fourth National Communication of Brazil to the UNFCCC. URL: https://unfccc.int/sites/default/files/resource/
    4a%20Comunicacao%20Nacional.pdf
2
    World Bank Group (2017). Brazil’s INDC Restoration and Reforestation Target — Analysis of INDC Land-use Targets. WBG
    Environment & Natural Resources. URL: http://documents1.worldbank.org/curated/en/917511508233889310/pdf/AUS19554-WP-
    P159184-PUBLIC-Brazils-INDC-Restoration-and-Reforestation-Target.pdf
3
    World Bank (2019). Internal Climate Migration Profile — Brazil.
4
    Barros, A. (2021). Unemployment reaches 14.7% in the first quarter, highest since 2012. Agencia IBGE. [May 21, 2021}. URL: https://
    agenciadenoticias.ibge.gov.br/agencia-noticias/2012-agencia-de-noticias/noticias/30793-desemprego-chega-a-14-7-no-primeiro-
    trimestre-maior-desde-2012-e-atinge-14-8-milhoes-de-pessoas

CLIMATE RISK COUNTRY PROFILE: BRAZIL                                                                                                  2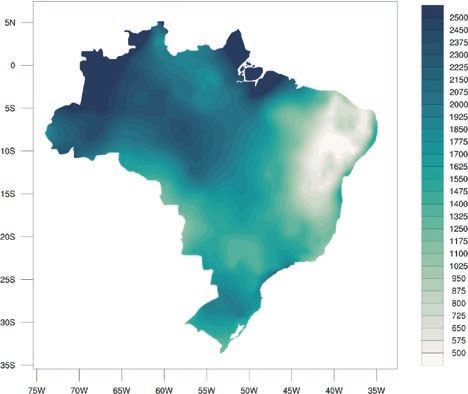
macro-economic environment is expected to remain in place, however, a lack of structural reforms and the need
for strong fiscal consolidation continues to create bottlenecks for expanded growth and productivity.5

Brazil has a population of 212.6 million people (2020) with an annual population growth rate of 0.7% (2020).6 The
population projected to reach 223.8 million people by 2030 and 228.9 million by 2050 (Table 1). An estimated
86% of the country’s population resides in urban areas, and this is expected to increase to 92% by 2050. Gross
Domestic Product (GDP) in 2020 was $1.44 trillion and Brazil has experienced volatile growth rates, which fluctuated
significantly over the past decade.7 The volatility of economic growth can be seen across the years, with the economy
growing at an annual rate of 4.5% (between 2006 and 2010) to 2.1% (between 2011 and 2014). A significant
contraction in economic activity occurred in 2015 and 2016, with GDP dropping by 3.6% and 3.4% (respectively).8

The country’s economy is driven primarily by industry, its services sector and agriculture. Brazil is the largest net-exporter
of agricultural commodities, with the agri-business sector contributing approximately 20% of the country’s GDP and
over 30% of all domestic employment.9 Brazil is one of the world’s leading exporters of soybeans, beef, coffee, and
automobiles. Imports are dominated by agricultural and industrial machinery, electrical equipment, oil, and automotive
parts from other countries, particularly China and the United States.

TABLE 1.  Data snapshot: Key development indicators10

     Indicator
     Life Expectancy at Birth, Total (Years) (2019)                                    75.9
     Population Density (People per sq. km Land Area) (2018)                           25.1 km
     % of Population with Access to Electricity (2019)                                 99.8%
     GDP per Capita (Current US$) (2020)                                               $6,796.80

The ND-GAIN Index11 ranks 181 countries using a score which calculates a country’s vulnerability to climate change
and other global challenges as well as their readiness to improve resilience. This Index aims to help businesses and
the public sector better identify vulnerability and readiness in order to better prioritize investment for more efficient
responses to global challenges. Due to a combination of political, geographic, and social factors, Brazil is recognized
as vulnerable to climate change impacts, ranked 96 out of 181 countries in the 2020 ND-GAIN Index. The more
vulnerable a country is the lower their score, while the more ready a country is to improve its resilience the higher
it will be. Norway has the highest score and is ranked 1st. Figure 2 is a time-series plot of the ND-GAIN Index
showing Brazil’s progress

5
      World Bank Group (2021). Brazil Overview. URL: https://www.worldbank.org/en/country/brazil/overview
6
      World Bank Open Data (2021). Data Retrieved April 2021. Data Bank: World Development Indicators, Brazil. URL: https://databank.
      worldbank.org/source/world-development-indicators
7
      World Bank Open Data (2021). Data Retrieved April 2021. Data Bank: Population Estimates and Projections, Brazil. URL: https://
      databank.worldbank.org/data/reports.aspx?source=health-nutrition-and-population-statistics:-population-estimates-and-projections
8
      World Bank Group (2021). Brazil Overview. URL: https://www.worldbank.org/en/country/brazil/overview
9
      World Bank Group (2017). Brazil’s INDC Restoration and Reforestation Target — Analysis of INDC Land-use Targets. WBG Environment
      & Natural Resources. URL: http://documents1.worldbank.org/curated/en/917511508233889310/pdf/AUS19554-WP-P159184-PUBLIC-
      Brazils-INDC-Restoration-and-Reforestation-Target.pdf
10
      World Bank (2021). DataBank — World Development Indicators. URL: https://databank.worldbank.org/source/world-development-indicators
11
      University of Notre Dame (2020). Notre Dame Global Adaptation Initiative. URL: https://gain.nd.edu/our-work/country-index/

CLIMATE RISK COUNTRY PROFILE: BRAZIL                                                                                                   3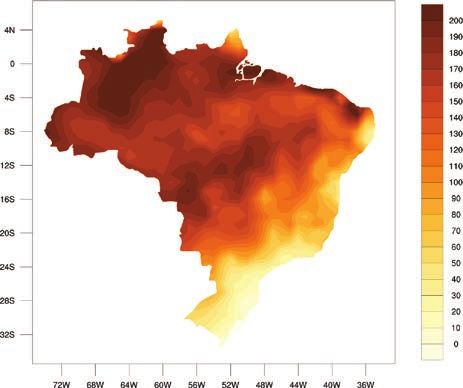
FIGURE 2.  ND-GAIN index for Brazil
         49

         48

         47
Score

         46

         45

         44

         43
              1996 1998 2000 2002 2004 2006 2008 2010 2012 2014 2016 2018

Brazil is vulnerable to climate change impacts, which present a significant threat to the country’s economic growth
as well as its continued social development. Extreme temperatures, rising seas, as well as the complex challenges
of different regions across the country experiencing significant water scarcity and heavy rainfall place significant
pressure on vulnerable groups, urban infrastructure, the economy and the country’s unique ecosystems. Furthermore,
while Brazil’s economy is dominated by its agricultural sector, this often results in competing demands and economic
priorities which are intertwined with environmental and climate change adaptation and mitigation priorities.12 Brazil
is home to the second largest forest in the world and also experiences the largest net forest loss worldwide. The
country’s deforestation and environmental degradation can be attributed largely to the agricultural sector.13 As of
2015, the Agriculture and Forest and Land-Use Sectors represented a combined 55% of the country’s greenhouse
gas emissions (GHG), with the energy sector contributing 33%.14

Brazil adopted the Paris Agreement and submitted its Nationally Determined Contribution (NDC) to the UNFCCC
in 2016 and its Updated NDC in 2020 in support of its adaptation commitments and continued economic and
social development agendas. Through its NDC, Brazil has committed to reduce its GHG emissions by 37% below
2005 levels, by 2025. Brazil has also committed to address climate change impacts to the country’s sectors
environment, forestry, agricultural and livestock, energy, and health sectors.15 Brazil submitted its Fourth National
Communication to the UNFCCC in 2020.

12
        Souza-Rodrigues, E. (2019). Deforestation in the Amazon: A unified Framework for Estimation and Policy Analysis. The Review of
        Economic Studies, 86 (6). pp. 2713–2744. DOI: https://doi.org/10.1093/restud/rdy070
13
        World Bank Group (2017). Brazil’s INDC Restoration and Reforestation Target — Analysis of INDC Land-use Targets. WBG Environment
        & Natural Resources. URL: http://documents1.worldbank.org/curated/en/917511508233889310/pdf/AUS19554-WP-P159184-PUBLIC-
        Brazils-INDC-Restoration-and-Reforestation-Target.pdf
14
        Brazil (2019). Brazil’s Third Biennial Update Report to the UNFCCC. Ministry of Foreign Affairs, Ministry of Science, Technology,
        Innovations and Communications. URL: https://unfccc.int/sites/default/files/resource/2018-02-28_BRA-BUR3_ENG_FINAL.pdf
15
        Brazil (2020). Updated Nationally-Determined Contributions. URL: https://www4.unfccc.int/sites/ndcstaging/PublishedDocuments/
        Brazil%20First/Brazil%20First%20NDC%20(Updated%20submission).pdf

CLIMATE RISK COUNTRY PROFILE: BRAZIL                                                                                                    4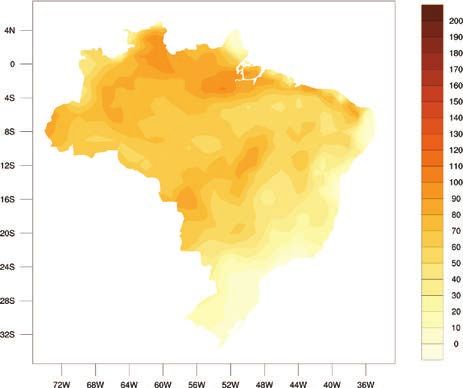
Green, Inclusive and Resilient Recovery
The coronavirus disease (COVID-19) pandemic has led to unprecedented adverse social and economic impacts.
Further, the pandemic has demonstrated the compounding impacts of adding yet another shock on top of the
multiple challenges that vulnerable populations already face in day-to-day life, with the potential to create devastating
health, social, economic and environmental crises that can leave a deep, long-lasting mark. However, as governments
take urgent action and lay the foundations for their financial, economic, and social recovery, they have a unique
opportunity to create economies that are more sustainable, inclusive and resilient. Short and long-term recovery
efforts should prioritize investments that boost jobs and economic activity; have positive impacts on human, social
and natural capital; protect biodiversity and ecosystems services; boost resilience; and advance the decarbonization
of economies.

CLIMATOLOGY

Climate Baseline
Overview
Brazil’s vast territory is home to an extraordinary mosaic of ecosystems, which parallel its climatic and topographic
diversity. Brazil experiences equatorial, tropical as well as sub-tropical climates. The Amazon forest drives rainfall
conditions across the South American continent, and is a critical factor to the planet’s energy balance. Brazil’s
forest formations occupy most of the national territory, and include humid and seasonal forests, which appear most
commonly in the Amazon and Atlantic Forest.16 Savannas are predominant in the Cerrado, but they also appear in
other regions of the country, including the Amazon. Steppe savannah formations appear mainly in the Northeastern
Caatinga and in the plateaus and prairies in the far southern areas of Brazil, in the Pampa biome. Campinaranas
are found primarily in the Amazon and in the Rio Negro Watershed. Dominated by equatorial and tropical climates,
northern and central Brazil receives frequent rainfall and experiences higher temperatures. Meanwhile, southern
Brazil is characterized by a humid subtropical climate. Notably, northeast Brazil exhibits a semi-arid climate, receiving
less than 700 mm per year of rain.17 Climate variability across the country is driven by the South American Monsoon
System (SAMS), the El Niño Southern Oscillation (ENSO), and the Inter Tropical Convergence Zone (ITCZ). Typically,
early October marks the beginning of monsoon season in tropical Brazil. For the country’s austral summer (December
to February), the Amazon Basin receives a significant increase of precipitation. The country experiences a rainfall
gradient from the northwest to the south and east.18

16
     Soterroni, A., Mosnier, A., Carvalho, A., Camara. G., Obersteiner, M., Andrade, P.R., Souza, R.C., and Brock, R. et al. (2018). Future
     environmental and agricultural impacts of Brazil’s Forest Code. Environmental Research Letters. DOI: 10.1088/1748-9326/aaccbb.
17
     Brazil (2020). Fourth National Communication of Brazil to the UNFCCC. URL: https://unfccc.int/sites/default/files/resource/
     4a%20Comunicacao%20Nacional.pdf
18
     Liebmann, B. and Mechoso, C. (2011). The South American Monsoon System: Research and Forecast (2nd Edition) (2011). URL: http://
     people.atmos.ucla.edu/mechoso/Liebmann.pdf

CLIMATE RISK COUNTRY PROFILE: BRAZIL                                                                                                     5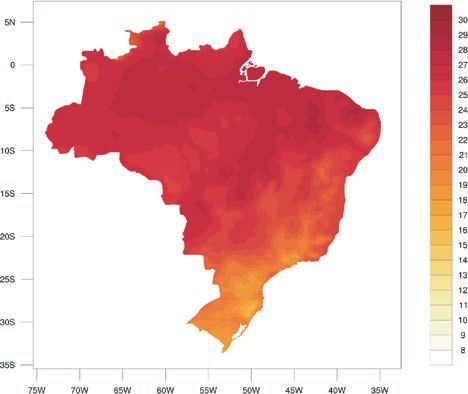
Analysis of data from the World Bank’s Climate Change Knowledge Portal (CCKP) (Table 2) shows historical
 climate information for Brazil. Mean annual temperatures are 25°C, with average monthly temperatures ranging
 between 25°C (November to February) and 23°C (June, July). Mean annual precipitation is 1,741.8 mm, with
 highest rainfall amounts falling between December and March (Figure 3), as shown in the latest climatology,
 1991–2020.19 Figure 4 shows the spatial variation of observed average annual precipitation and temperature
 across Brazil.

 TABLE 2.  Data snapshot: Summary statistics

        Climate Variables                                                                 1991–2020
        Mean Annual Temperature (°C)                                                      25.6°C
        Mean Annual Precipitation (mm)                                                    1,755.8 mm
        Mean Maximum Annual Temperature (°C)                                              30.9°C
        Mean Minimum Annual Temperature (°C)                                              20.3°C

 FIGURE 3.  Average monthly temperature and rainfall of Brazil for 1991–202020
                    27.2                                                                               320

                    25.6                                                                               240
Temperature (°C)

                                                                                                             Rainfall (mm)

                     24                                                                                160

                    22.4                                                                               80

                    20.8                                                                               0
                           Jan   Feb   Mar    Apr   May    Jun    Jul   Aug   Sep   Oct    Nov   Dec

                                                    Rainfall      Temperature

 19
                   WBG Climate Change Knowledge Portal (CCKP, 2021). Brazil. URL: https://climateknowledgeportal.worldbank.org/country/brazil/
                   climate-data-historical
 20
                   WBG Climate Change Knowledge Portal (CCKP, 2021). Brazil. URL: https://climateknowledgeportal.worldbank.org/country/brazil/
                   climate-data-historical

 CLIMATE RISK COUNTRY PROFILE: BRAZIL                                                                                                            6
FIGURE 4. Map of average annual temperature (°C) (left); annual precipitation (mm) (right) of
Brazil, 1991–202021
Key Trends
Temperature
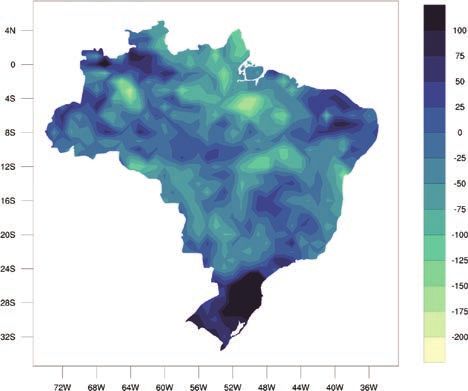
Brazil’s warmest areas are in the north, with high temperatures also occurring northeaster coastline. Temperatures
across the Amazon Basin have risen by 0.5°C since 1980 (Figure 5), with greater rates of warming observed
during the dry season (August to November). Winter temperatures are rising, while the frequency of cool nights
across the country have decreased. As temperatures continue to rise, the number of warm days and nights have
also increased significantly, particularly during the dry season, with a slight increase in the number of warm days
also occurring during winter seasons.22 Given the country’s high humidity, rising temperatures have also increased
values for critical heat indexes, particularly in low-lying areas and the northern and central-west regions, which are
the most humid. Extreme low temperatures have also been observed in southern areas of Brazil, with extreme low
temperatures continuing to occur over the past half century, but at a less frequent pace.23
21
WBG Climate Change Knowledge Portal (CCKP, 2021). Brazil. URL: https://climateknowledgeportal.worldbank.org/country/brazil/
climate-data-historical
22
Prevedella, J., Winck, G., Weber, M., Nicholas, E., Sinervo, B. (2019). Impacts of forestation and deforestation on local temperatures
across the globe. PLOS One [March 20, 2019]. DOI: https://doi.org/10.1371/journal.pone.0213368
23
Brazil (2020). Fourth National Communication of Brazil to the UNFCCC. URL: https://unfccc.int/sites/default/files/resource/
4a%20Comunicacao%20Nacional.pdf
CLIMATE RISK COUNTRY PROFILE: BRAZIL 7FIGURE 5. Observed annual temperature anomalies for Brazil, 1901–2020
27
Temperature (°C)
26
25
24
1901 1911 1921 1931 1941 1951 1961 1971 1981 1991 2001 2011 2020
Annual mean Smoothed
Precipitation
Given Brazil’s size and diverse topography, the country has highly variable precipitation patterns. Brazil receives the
highest average monthly precipitation in January to March and the least amount of average precipitation in July to
September. Historically, average annual rainfall decreases from north to south, however this pattern continues to
be largely affected by the country’s monsoon regime. Inter-annual climate variability plays a vital role in affecting
the seasonal cycle of precipitation.24 Over the last three decades, the increased frequency and intensity of heavy
rainfall events have often resulted in intense soil run-off, flash flooding and landslides, due in part to an increase
in environmental degradation.25 During El Niño events, the northern region receives less rainfall than normal in
summer, while the southern region receives more rainfall; the opposite occurs during La Niña events. Since 1960,
a trend has been observed of an average annual increase in precipitation. Specifically, its tropical wet region, which
covers the majority of the Amazon, has experienced a 5% increase in rainfall over the past 30 years.26
Climate Future
Overview
The main data source for the World Bank Group’s CCKP is the CMIP5 (Coupled Inter-comparison Project
Phase5) data ensemble, which builds the database for the global climate change projections presented in the
Fifth Assessment Report (AR5) of the Intergovernmental Panel on Climate Change (IPCC). Four Representative
Concentration Pathways (i.e. RCP2.6, RCP4.5, RCP6.0, and RCP8.5) were selected and defined by their total
radiative forcing (cumulative measure of GHG emissions from all sources) pathway and level by 2100. The RCP2.6
for example represents a very strong mitigation scenario, whereas the RCP8.5 assumes business-as-usual scenario.
For more information, please refer to the RCP Database. For simplification, these scenarios are referred to as a
low (RCP2.6); a medium (RCP4.5) and a high (RCP8.5) emission scenario in this profile. Table 3 provides CMIP5
projections for essential climate variables under high emission scenario (RCP 8.5) over 4 different time horizons.
Figure 6 presents the multi-model (CMIP5) ensemble of 32 Global Circulation Models (GCMs) showing the
projected changes in annual precipitation and temperature for the periods 2040–2059 and 2080–2099.
24
Brazil (2020). Fourth National Communication of Brazil to the UNFCCC. URL: https://unfccc.int/sites/default/files/resource/
4a%20Comunicacao%20Nacional.pdf
25
Anache, J., Wendland, E., Oliveria, P., Flanagan, D., and Nearing, M. (2017). Runoff and soil erosion plot-scale studies under natural
rainfall: A meta-analysis of the Brazilian experience. CATENA, 152 (May). pp. 29–39. DOI: https://doi.org/10.1016/j.catena.2017.01.003
26
USAID (2018). Climate Risk Profile Fact Sheet — Brazil. URL: https://www.climatelinks.org/sites/default/files/asset/document/
2018-April-30_USAID_CadmusCISF_Climate-Risk-Profile-Brazil.pdf
CLIMATE RISK COUNTRY PROFILE: BRAZIL 8TABLE 3. Data snapshot: CMIP5 ensemble projection
CMIP5 Ensemble Projection 2020–2039 2040–2059 2060–2079 2080–2099
Annual Temperature Anomaly (°C) +0.6°C to +2.0°C +1.3°C to +3.2°C +2.1°C to +4.7°C +2.9°C to +6.4°C
(+1.1°C) (+2.0°C) (+3.1°C) (+4.1°C)
Annual Precipitation Anomaly (mm) -25.6 to +23.0 -30.1 to +28.1 -39.1 to +34.3 -47.4 to +40.4
(−1.2 mm) (−1.5 mm) (−1.5 mm) (−3.5 mm)
Note: The table shows CMIP5 ensemble projection under RCP8.5. Bold value is the range (10th–90th Percentile) and values in parentheses
show the median (or 50th Percentile).
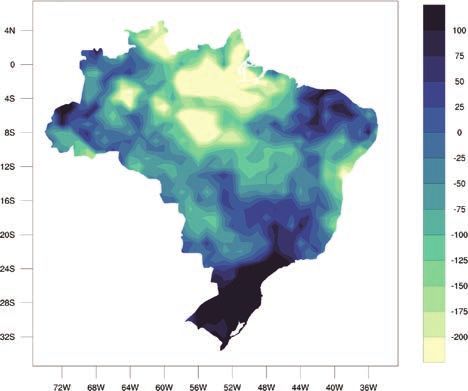
FIGURE 6. Multi-model (CMIP5) ensemble projected changes (32 GCMs) in annual temperature (top)
and precipitation (bottom) by 2040–2059 (left) and by 2080–2099 (right), relative to 1986–2005
baseline under RCP8.527
27
WBG Climate Change Knowledge Portal (CCKP, 2021). Brazil Projected Future Climate. URL: https://climatedata.worldbank.org/
CRMePortal/web/agriculture/crops-and-land-management?country=BRA&period=2080-2099
CLIMATE RISK COUNTRY PROFILE: BRAZIL 9Key Trends
Temperature
Brazil’s average annual temperatures are expected to rise by 1.7°C to 5.3°C by the end of the century. The most
significant increases are expected to occur on the months of January and July. Higher warming is projected to
increase from the country’s western interior to its eastern coast. Central regions are expected to experience the
most significant temperature increases. The interior of the country is expected to warm at a faster rate than areas
along the coast, however, rising sea surface temperatures may adversely impact the normally cooling ocean air
flow for coastal regions. The frequency and duration of heat waves over the Amazon is projected to increase by as
much as an additional 214 days by the 2090s.28
Across all emission scenarios, temperatures in Brazil will continue to rise throughout the end of the century. As seen in
Figure 7, under a high-emission scenario (RCP 8.5), average temperatures will increase rapidly by mid-century.
Although temperature will raise throughout the year, important peaks are projected between April and September
(Figure 8). Increased heat and extreme heat conditions will result in significant implications for human and animal
health, agriculture, water resources, and ecosystems.
FIGURE 7. Projected average temperature for FIGURE 8. Projected change in summer days
Brazil (Reference Period, 1986–2005)29 (Tmax >25°C) (RCP8.5, Reference Period,
1986–2005)30
32 3.5
31 3.0
30 2.5
Temperature (°C)
29 2.0
Days
28 1.5
27 1.0
26 0.5
25 0
24 –0.5
1980 2000 2020 2040 2060 2080 2100 Jan Feb Mar Apr May Jun Jul Aug Sep Oct Nov Dec
Year
Historical RCP 2.6 RCP 4.5 RCP 6.0 RCP 8.5
28
Brazil (2020). Fourth National Communication of Brazil to the UNFCCC. URL: https://unfccc.int/sites/default/files/resource/
4a%20Comunicacao%20Nacional.pdf
29
WBG Climate Change Knowledge Portal (CCKP, 2021). Interactive Climate Indicator Dashboard — Agriculture. Brazil. URL https://
climatedata.worldbank.org/CRMePortal/web/agriculture/crops-and-land-management?country=BRA&period=2080-2099
30
WBG Climate Change Knowledge Portal (CCKP, 2021). Interactive Climate Indicator Dashboard — Agriculture. Brazil. URL https://
climatedata.worldbank.org/CRMePortal/web/agriculture/crops-and-land-management?country=BRA&period=2080-2099
CLIMATE RISK COUNTRY PROFILE: BRAZIL 10Precipitation
Rainfall is highly variable across Brazil as are projections
at the seasonal and geographical level. However, FIGURE 9. Projected annual average
through the end of the century, annual precipitation precipitation in Brazil (Reference Period,
is projected to increase northern, center-west and 1986–2005)34
southern areas of Brazil. Decreases are expected for 1900
northeastern, central, and southwestern areas of the 1800
1700
country.31 The dry season in the Amazon will likely get
Precipitation (mm)
1600
longer as precipitation values decline, notably for the 1500
traditional dry season (August to November). ENSO 1400
events bring stronger and more frequent precipitation 1300
1200
events, with an increased likelihood of longer drier
1100
periods in between.32 The country’s tropical wet region
1000
is projected to also experience a significant increase 1980 2000 2020 2040 2060 2080 2100
Year
in dry spells. Figure 9, shows the change in the Historical RCP 2.6 RCP 4.5 RCP 6.0 RCP 8.5
projected annual average precipitation for Brazil.
Water routing, storage and other management options
can be highly varied depending if the precipitation input comes frequently or with long periods of aridity in between
rainfall.33 At a nationally aggregated scale, annual average precipitation is expected to remain similar to historical
observations, but will vary slightly throughout the century, based on emission scenarios.
CLIMATE RELATED NATURAL HAZARDS
Overview
Brazil’s diverse territory renders it susceptible to a variety of natural hazards, including floods, earthquakes, droughts,
extreme temperatures, landslides, tropical cyclones, and infectious diseases. Brazil is also highly susceptible to
natural disasters due to its location in tropical regions, with high temperatures and high evaporation potential
facilitates large rainfall amounts. Drought and excess rainfall, resulting in recurrent floods and landslides, are the
most frequent and disruptive hazard events, with important impacts for urban areas. Floods, landslides, and droughts
have occurred on a regular basis throughout the past century, accompanied by significant mortality, economic and
31
Almagro, A., Oliveria, P., Nearing, M. and Hagemann, S. (2017). Projected climate change impacts in rainfall erosivity over Brazil.
Scientific Reports. 7 (2017). URL: https://www.nature.com/articles/s41598-017-08298-y
32
Anache, J., Wendland, E., Oliveria, P., Flanagan, D., and Nearing, M. (2017). Runoff and soil erosion plot-scale studies under natural
rainfall: A meta-analysis of the Brazilian experience. CATENA, 152 (May). pp. 29–39. DOI: https://doi.org/10.1016/j.catena.2017.01.003
33
Brazil (2020). Fourth National Communication of Brazil to the UNFCCC. URL: https://unfccc.int/sites/default/files/resource/
4a%20Comunicacao%20Nacional.pdf
34
WBG Climate Change Knowledge Portal (CCKP, 2021). Climate Data-Projections. Brazil. URL: https://climateknowledgeportal.
worldbank.org/country/brazil/climate-sector-water
CLIMATE RISK COUNTRY PROFILE: BRAZIL 11social losses. Floods comprise over 65% of the natural hazards and intense rainfall events, which triggered flash
floods and landslides were responsible for 74% of the deaths related to natural disasters in the 1991–2010
period.35 In 2011, floods, landslides, and mudslides in Rio de Janeiro claimed roughly 1,000 lives and registered
economic losses of 1.35% of the state’s GDP. Brazil’s coast was impacted by Hurricane Catarina in 2004, which
caused infrastructure damage and disrupted key economic activities and production zones.36
The country’s high susceptibility to climate hazards translates into significant economic impacts, with annual losses
from natural disasters estimated at $3.9 billion.37 Rapid, unplanned and uncontrolled urbanization, which has
taken place since the 1960s has meant building in unsafe areas (floodplains, steep hillside slopes) making urban
residents and public infrastructure additionally vulnerable. Between 2009 and 2014, nearly every highly populated
municipality in Brazil was affected by floods and about 50,000 low-income homes were destroyed.38
The western and central Amazon suffered severe floods in 2009, 2011, 2012–2013, and 2014. The floods of
2009, known as the “flood of the century”, surged flows of the Rio Negro by 29.77 m. The northeast region of Brazil
has experienced some of the worst droughts in the history, affecting over 4 million people and 1,400 municipalities.
Although tropical cyclones are nearly non-existent, Hurricane Catarina (category 2) appeared in the south region
of Brazil in March 2004, destroying 1,500 households and damaging another 40,000, also causing three deaths
and 75 injuries.39
Data from the Emergency Event Database: EM-Dat, presented in Table 4, shows the country has endured various
natural hazards, including floods, landslides, epidemic diseases, extreme temperatures, and storms.
35
Debortoil, N. et al., (2017). An index of Brazil’s vulnerability to expected increases in natural flash flooding and landslide disasters in
the context of climate change. Natural Hazards. 86, pp. 557–582. URL: https://link.springer.com/article/10.1007/s11069-016-2705-2
36
World Bank (2014). Coping with Loss: Options for Disaster Risk Financing in Brazil. GFDRR. URL: https://www.gfdrr.org/en/
publication/options-disaster-risk-financing-brazil
37
GFDRR (2020). Brazil — Overview. URL: https://www.gfdrr.org/en/brazil
38
Debortoil, N. et al., (2017). An index of Brazil’s vulnerability to expected increases in natural flash flooding and landslide disasters in
the context of climate change. Natural Hazards. 86, pp. 557–582. URL: https://link.springer.com/article/10.1007/s11069-016-2705-2
39
Brazil (2020). Fourth National Communication of Brazil to the UNFCCC. URL: https://unfccc.int/sites/default/files/resource/
4a%20Comunicacao%20Nacional.pdf
CLIMATE RISK COUNTRY PROFILE: BRAZIL 12TABLE 4. Natural disasters in Brazil, 1900–202040
Natural Hazard Events Total Total Damage
1900–2020 Subtype Count Deaths Total Affected (’000 USD)
Drought Drought 18 20 78,812,000 111,831,100
Earthquake Ground Movement 2 2 23,286 5,000
Bacterial Disease 5 1,696 45,893 0
Epidemic
Viral Disease 11 633 1,937,335 0
Cold Wave 5 154 600 1,075,000
Extreme Temperatures
Heat Wave 3 201 0 0
Flash Flood 11 658 325,931 275,770
Flood
Riverine Flood 69 3,106 11,418,683 6,158,670
Insect Infestation Infestation 1 0 2,000 0
Landslide 15 1,262 4004045 27
Landslides
Mudslide 10 483 234,569 231,000
Convective Storm 10 70 36,257 183,000
Extra-tropical 1 3 1,600 350,000
Storm
Storm
Tropical Cyclone 1 4 150,060 350,000
Forest Fire 2 0 0 0
Wildfire Land Fire (Brush, 2 1 12,000 36,000
Bush, Pasture)
Key Trends
Climate change is expected to increase the risk and intensity of water scarcity and drought across the country, with
the main exception of increased precipitation experienced in Brazil’s south-central tip, from São Paulo south. The
primary sectors affected are water, agriculture and livestock, forestry, and infrastructure. As intense precipitation
events become more common, these will translate into increased risks of floods, both riverine and flash flooding.
Such floods could further erode soils and damage crops through water logging, further damaging yield potentials
and increasing food insecurity; particularly for subsistence-scale farmers. Higher temperatures will increase soil
moisture loss, leading to greater aridity, affecting livestock and crops, furthering economic losses, damage to
agricultural lands and infrastructure as well as human casualties. Furthermore, land degradation and soil erosion,
exacerbated by recurrent flood and drought adversely impact agricultural production, and thus the livelihoods of
the rural poor. Small rural farmers, are more sensitive to impacts of disasters (floods, dry periods) because they
have limited resources with which to influence and increase their responses to these risks.41 Large urban zones,
such as São Paulo (estimated population of 11 million people) are impacted by seasonal flooding, which damages
infrastructure and housing, particularly for the urban poor.42 Rising temperatures are expected to exacerbate existing
40
EM-DAT: The Emergency Events Database — Universite catholique de Louvain (UCL) — CRED, D. Guha-Sapir, Brussels, Belgium.
URL: http://emdat.be/emdat_db/
41
Brazil (2020). Fourth National Communication of Brazil to the UNFCCC. URL: https://unfccc.int/sites/default/files/resource/
4a%20Comunicacao%20Nacional.pdf
42
Haddad, E. and Teixeira, E. (2015). Economic impacts of natural disasters in megacities: The case of floods in São Paulo, Brazil. Habitat
International. 45(2). pp. 106–113. DOI: https://doi.org/10.1016/j.habitatint.2014.06.023
CLIMATE RISK COUNTRY PROFILE: BRAZIL 13tensions for water resources, particularly between the agriculture and livestock sector, and urban populations,
especially during periods of high aridity and drought. Water scarcity and changing rainfall patterns will significantly
impact the agricultural sector. Rising temperatures and degraded agricultural conditions are expected to also
adversely affect ‘working days’, impacting livelihoods and economic resilience of vulnerable groups.43
Brazil’s extensive network of rivers and streams makes the country vulnerable to riverine floods, which, according to
some estimates have resulted in an accumulated economic loss of over 6.1 billion USD. Flash floods in Brazil have
inflicted damage to infrastructure and human lives. In the west and northeastern areas of the country, precipitation
is projected to increase by 5% in the second half of the century, which could potentially lead to flash or riverine
flood. In addition, as a consequence of rising sea levels in southern Atlantic Ocean, coastal floods are expected
to happen at least once over the coming decade.44 Droughts in Brazil have caused more than 11.2 billion USD in
total damages. In addition, almost 80 million people have been affected by these events. The likelihood of drought
occurrence in the coming decade is expected to increase by approximately 20%. This is of critical importance to
the northeastern and southeastern regions, both of which will face higher drought and water scarcity issues in
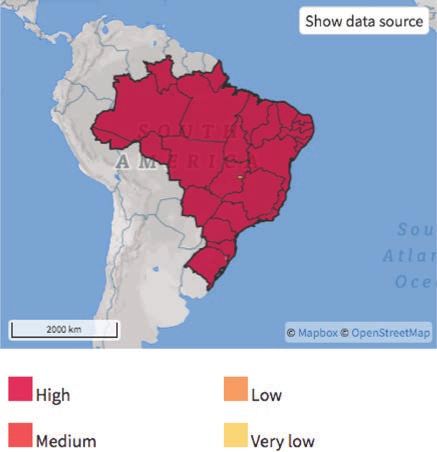
the future compared to other regions of the country. Figure 10 below present the risk of coastal flooding and
landslides for Brazil.45
FIGURE 10. Risk of urban flood (left);46 risks of landslide (right)47
43
Debortoil, N. et al., (2017). An index of Brazil’s vulnerability to expected increases in natural flash flooding and landslide disasters in
the context of climate change. Natural Hazards. 86, pp. 557–582. URL: https://link.springer.com/article/10.1007/s11069-016-2705-2
44
ThinkHazard! (2016). Brazil. URL: http://thinkhazard.org/report/37-brazil
45
FAO (2018). Drought Characteristics and management in North African and the Near East. URL: http://www.fao.org/3/CA0034EN/
ca0034en.pdf
46
ThinkHazard! (2020). Brazil — Urban Flooding. URL: http://thinkhazard.org/en/report/37-brazil/UF
47
ThinkHazard! (2020). Brazil — Landslide. URL: https://thinkhazard.org/en/report/37-brazil/LS
CLIMATE RISK COUNTRY PROFILE: BRAZIL 14Implications for DRM
Brazil’s policy on Disaster Risk Management (DRM) is increasingly moving from response-oriented to proactive
anticipation and management and investments are focused on ensuring DRM continuity by building technical
capacity at the federal, state, and municipal levels. In 2012, the government invested in the production of risk
information to support informed decision-making and streamline risk-management strategies, spearheaded through
the creation of the National Natural Disasters Database. Brazil has also implemented its National Center for
Monitoring and Early Warning of Natural Disasters (CEMADEN), which is responsible for the development, testing
and implementation of systems to predict natural disasters in susceptible areas in Brazil and provide necessary
alerts on natural disasters.48 Most recently, CEMADEN developed drought indicators, informed by a remote sensing-
based index, to provide detailed information to sub-state actors involved in drought risk management.49 The center
is also currently monitoring natural hazards in 795 municipalities in addition to all municipalities in the Northeastern
semiarid region, which is highly vulnerable to severe droughts. Additionally, advanced hydro-meteorological services
provide a concrete foundation for effective early warning systems and include the Brazilian Network on Global
Climate Change Research (CLIMA), System for Monitoring and Observation of Impacts of Climate Change (SISMOI),
Brazilian Earth System Model (BESM), and the Earth System Grid Federation (ESGF).50
The federal government is responsible for preparing the National Civil Protection and Defense Plan and for
identifying the most disaster-prone municipalities. All municipalities are now required, by law, to follow disaster risk
management guidelines.51 The country is also working on the development and implementation of a quantitative
analysis of exposure and vulnerabilities for its population and assets, such as infrastructure, agricultural land and
livestock, to specific natural hazards. Given the increasing frequency and intensity of extreme weather events, early
warning systems can play a vital role in preventing natural hazard related mortality and property damages.52
CLIMATE CHANGE IMPACTS TO KEY SECTORS
B
razil is highly vulnerable to climate variability and change in the immediate as well as longer-term, particularly
for the country’s water, agriculture, forestry, energy, and health sectors. Environmental degradation, changes
in water resources, and loss of biodiversity are significant obstacles to the country’s continued development
and poverty reduction efforts.53 The country’s diverse topography, complex climate, dispersed rural and urban
populations and socio-economic disparity, increases its vulnerability to climate change impacts. Competing demands
48
Brazil (2020). Fourth National Communication of Brazil to the UNFCCC. URL: https://unfccc.int/sites/default/files/resource/
4a%20Comunicacao%20Nacional.pdf
49
Cunha, A. et al. (2019). Brazilian experience on the development of drought monitoring and impact assessment systems. Contributing
Paper to Global Assessment Report on Disaster Risk Reduction 2019. URL: https://www.undrr.org/publication/brazilian-experience-
development-drought-monitoring-and-impact-assessment-systems
50
Brazil (2020). Fourth National Communication of Brazil to the UNFCCC. URL: https://unfccc.int/sites/default/files/resource/
4a%20Comunicacao%20Nacional.pdf
51
GFDRR (2020). Brazil — Overview. URL: https://www.gfdrr.org/en/brazil
52
Debortoil, N. et al., (2017). An index of Brazil’s vulnerability to expected increases in natural flash flooding and landslide disasters in the
context of climate change. Natural Hazards. 86, pp. 557–582. URL: https://link.springer.com/article/10.1007/s11069-016-2705-2
53
Brazil (2020). Updated Nationally-Determined Contributions. URL: https://www4.unfccc.int/sites/ndcstaging/PublishedDocuments/
Brazil%20First/Brazil%20First%20NDC%20(Updated%20submission).pdf
CLIMATE RISK COUNTRY PROFILE: BRAZIL 15between economic growth and environmental stewardship increase the country’s challenges for implementing
effective climate change adaptation and mitigation efforts.54
Gender
An increasing body of research has shown that climate-related disasters have impacted human populations in many
areas including agricultural production, food security, water management and public health. The level of impacts
and coping strategies of populations depends heavily on their socio-economic status, socio-cultural norms, access
to resources, poverty as well as gender. Research has also provided more evidence that the effects are not gender
neutral, as women and children are among the highest risk groups. Key factors that account for the differences
between women’s and men’s vulnerability to climate change risks include: gender-based differences in time use;
access to assets and credit, treatment by formal institutions, which can constrain women’s opportunities, limited
access to policy discussions and decision making, and a lack of sex-disaggregated data for policy change.55
Agriculture
Overview
Agriculture remains a critical element of the Brazilian economy, with total output more than doubling since the
1990s. As of 2016, the sector employed over 18 million people and contributes over one-fifth to the country’s
GDP. Brazil is the largest net exporter of agricultural commodities in the world, however 85% of farmers are part
of small family farms. Brazil has a relatively complex network of rural credit and farmer financing opportunities to
support its small-scale farming businesses, however resources can be unevenly distributed across large geographic
areas and throughout complex terrain. Additionally, farm cooperatives have gained influence and economic power
for members, specifically for primary export commodities such as coffee.56
The Brazilian livestock industry accounts for 14% of the world’s beef output. Brazil’s vast agricultural and grazing
land (33.4% of total land area) make it a prominent factor in overall global agricultural production, and a leading
exporter of various agricultural goods (e.g. soybeans, corn, coffee, beef, sugarcane, and rice). Soybeans, maize,
wheat, cotton, coffee, oranges, and sugarcane are among the country’s most important crops. Given its long coastline,
the fishing industry is also a significant part of its economy and food security. The Northern Brazil Shelf, which hosts
a $700 million fishing industry is at increasing risk to increased intensity and frequency of hurricanes, as well as
rising sea surface temperature.57
54
Brazil (2020). Fourth National Communication of Brazil to the UNFCCC. URL: https://unfccc.int/sites/default/files/resource/
4a%20Comunicacao%20Nacional.pdf
55
World Bank Group (2016). Gender Equality, Poverty Reduction, and Inclusive Growth. URL: http://documents1.worldbank.org/
curated/en/820851467992505410/pdf/102114-REVISED-PUBLIC-WBG-Gender-Strategy.pdf
56
Assuncao, J., Souza, P. and Figueiredo, B. (2018). Distribution Channels for Rural Credit. Policy Brief — INPUT. URL: https://www.
inputbrasil.org/wp-content/uploads/2018/02/CPI_Brief_IN_-_Distribution_Channels_for_Rural_Credit.pdf
57
Brazil (2020). Fourth National Communication of Brazil to the UNFCCC. URL: https://unfccc.int/sites/default/files/resource/
4a%20Comunicacao%20Nacional.pdf
CLIMATE RISK COUNTRY PROFILE: BRAZIL 16Although Brazil’s food production is robust enough to meet both domestic and export demands, nearly a third
of the population remains food-insecure. Advances of Brazil’s agricultural sector have also resulted in intense
environmental degradation and the loss of biodiversity and ecosystem services. Pressure from the production of
beef, resulting in the destruction of forested land for intensive cattle grazing and ranching has advanced forest
cover loss.58 Beef production, followed by soy are the largest drivers of tropical deforestation for the country and
the demand for meat and dairy products is projected to rise 80–90% by the mid-century.59
Climate Change Impacts
Projected climate change impacts to food production, agricultural livelihoods and food security in Brazil are significant
national concerns. These are linked to future projected water supply constraints as well as temperature rise. While
the increase in agricultural productivity has been largely driven by technological advancements, changes in rainfall
patterns and rising temperatures present serious challenges to the continued success of the sector, as well as the
country’s food security.60 Climate risks threaten land availability and continues to drive agricultural intensification,
furthering deforestation and increasing soil erosion and deterioration. Decreased agricultural production may be
further impacted by the loss of up to 11 million hectares of agricultural land by the 2030s as a result of cumulative
climate change impacts, accelerated by deforestation.61 Soybean and cotton crops are expected to be moderately
impacted by climatic changes, but maize and wheat yields will decline significantly. The agriculture sector is also
threatened by potential increase in extreme events, with an increase of frequency and intensity for flooding and
drought due to strong El Niño events. Key specialty crops, such as coffee and cocoa, are expected to be impacted
by high temperatures and changing rainfall patterns, as they are both drought sensitive crops and dependent on
rainfall.62 Sugarcane is also heavily reliant upon intense water availability, but production zones in southern Brazil
are likely to improve in suitably due to increased rainfall.63
The country’s livestock industry is also highly vulnerable due to the impact of increased temperatures on animals.
Brazil’s robust fishing industry also faces increased risk due to rising ocean temperatures and altered ocean
currents. Overfishing and rising sea temperatures have the potential to decrease maximum fish catch potential by
up to 50%.64 Heat stress will have a variety of detrimental effects on Brazil’s crops and livestock, with significant
effects on milk production and reproduction in dairy cows.65 The projected increased heat will also increase stress
58
World Bank Group (2017). Brazil’s INDC Restoration and Reforestation Target — Analysis of INDC Land-use Targets. WBG
Environment & Natural Resources. URL: http://documents1.worldbank.org/curated/en/917511508233889310/pdf/AUS19554-WP-
P159184-PUBLIC-Brazils-INDC-Restoration-and-Reforestation-Target.pdf
59
PROFOR (2019). Leveraging Agricultural Value Chains to enhance tropical tree cover and slow deforestation — Synthesis Report.
URL: https://www.profor.info/sites/profor.info/files/LEAVES_SynthesisReport_PROFOR_2018.pdf
60
Brazil (2020). Fourth National Communication of Brazil to the UNFCCC. URL: https://unfccc.int/sites/default/files/resource/
4a%20Comunicacao%20Nacional.pdf
61
Giannini, T. et al., (2017). Projected climate change threatens pollinators and crop production in Brazil. PLOS One. DOI: https://doi.org/
10.1371/journal.pone.0182274
62
Gateau-Ray, L. et al. (2018). Climate change could threaten cocoa production: Effects of 2015–2016 El Nino-related drought on cocoa
agroforests in Bahia, Brazil. PLOS One. DOI: https://doi.org/10.1371/journal.pone.0200454
63
Marin, F. et al. (2012). Climate change impacts on sugarcane attainable yield in southern Brazil. Climatic Change, 117. pp. 227–239.
URL: https://link.springer.com/article/10.1007/s10584-012-0561-y
64
Brazil (2020). Fourth National Communication of Brazil to the UNFCCC. URL: https://unfccc.int/sites/default/files/resource/
4a%20Comunicacao%20Nacional.pdf
65
WWF (2018). What are the biggest drivers of tropical deforestation. URL: https://www.worldwildlife.org/magazine/issues/summer-2018/
articles/what-are-the-biggest-drivers-of-tropical-deforestation
CLIMATE RISK COUNTRY PROFILE: BRAZIL 17on crops and is likely to change the length of the growing season. Decreased water availability is likely to reduce
yields and the reduction in soil moisture may alter suitable areas for agriculture or crop production. Increased heat
and water scarcity conditions are likely to increase evapotranspiration, which is expected to contribute to crop
failures and overall yield reductions.66
Figure 11 shows the projected change in average
daily max-temperature across the seasonal cycle. FIGURE 11. Projected average daily max
Higher temperatures experienced throughout the year temperature for Brazil (RCP8.5, Reference
have implications soil moisture availability and crop Period, 1986–2005)68
growth. Many of Brazil’s key staple crops such as corn, 10
soy, sugarcane, coffee and cocoa are limited in their 9
8
heat tolerance.67 Through the end of the century,
Temperature (°C)
7
under a high emissions scenario, RCP 8.5, daily
6
max temperatures will increase throughout the year, 5
with max temperatures projected to reach a median 4
increase of 6°C from September to November, 3
impacting planting and harvest seasons. Figure 12 2
shows the spatial variation for ‘hot days’, temperatures 1
Jan Feb Mar Apr May Jun Jul Aug Sep Oct Nov Dec
reaching over 35°C for the period 2040–2059 and
2080–2099, under RCP8.5. The areas experiencing
the largest increase in hot days will also experience
some of the largest reductions in precipitation.
Adaptation Options
Climate change trends and impacts to the country’s agricultural sector are linked with many other challenges and
stressors that Brazil faces due to environmental degradation, disease outbreaks, and higher input costs as well
as challenges regarding land rights and inequality. Brazil has committed to supporting adaptation strategies such
as climate smart agriculture practices, improved water management, improved monitoring and early warning, the
development of knowledge and decision-support systems, and the development of new crop varieties and technologies
to support farming. Brazil has also committed to strengthen its Low Carbon Emission Agriculture Program, which
includes the restoration of an additional 15 million hectares of degraded pasturelands and enhancing integrated
cropland-livestock-forestry systems by 2030. The country already operates one of the largest and most successful
biofuel production programs to date, and is increasing efforts to increase biofuel production (dominated by corn and
66
WBG (2013). Impacts of Climate Change on Brazilian Agriculture. URL: https://openknowledge.worldbank.org/bitstream/handle/
10986/18740/687740Revised00LIC00web0brasil02030.pdf?sequence=1&isAllowed=y
67
Giannini, T. et al., (2017). Projected climate change threatens pollinators and crop production in Brazil. PLOS One. DOI: https://doi.org/
10.1371/journal.pone.0182274
68
WBG Climate Change Knowledge Portal (CCKP, 2021). Brazil Agriculture. Dashboard URL: https://climatedata.worldbank.org/
CRMePortal/web/agriculture/crops-and-land-management?country=BRA&period=2080-2099
CLIMATE RISK COUNTRY PROFILE: BRAZIL 18You can also read