Spatialized flood resilience measurement in rapidly urbanized coastal areas with a complex semi-arid environment in northern Morocco
←
→
Page content transcription
If your browser does not render page correctly, please read the page content below

Nat. Hazards Earth Syst. Sci., 21, 1101–1118, 2021
https://doi.org/10.5194/nhess-21-1101-2021
© Author(s) 2021. This work is distributed under
the Creative Commons Attribution 4.0 License.

Spatialized flood resilience measurement in
rapidly urbanized coastal areas with a complex
semi-arid environment in northern Morocco
Narjiss Satour1 , Otmane Raji2 , Nabil El Moçayd3 , Ilias Kacimi1 , and Nadia Kassou1
1 Geosciences,  Water and Environment Laboratory, Mohammed V University in Rabat, Morocco
2 Geology & Sustainable  Mining, University Mohammed 6 Polytechnic, Benguerir, Morocco
3 International Water Research Institute, University Mohammed 6 Polytechnic, Benguerir, Morocco

Correspondence: Narjiss Satour (narjiss.satour@gmail.com)

Received: 18 December 2019 – Discussion started: 17 January 2020
Revised: 10 February 2021 – Accepted: 16 February 2021 – Published: 25 March 2021

Abstract. Enhancing resilience is critical for coastal urban       more likely to change, which will alter the hydrological cycle
systems to cope with and minimize flood disaster risks. This       in many regions, causing a change in the occurrence of ex-
issue is certainly more important in Africa, where the in-         treme events such as drought and flooding, especially in arid
crease in flood frequency is a significant concern for many ar-    and semi-arid areas (Karanja Ng’ang’a et al., 2016).
eas. In this context, urban planners need accurate approaches         The coastal zones situated in semi-arid areas are consid-
to set up a standard for measuring the resilience to floods.       ered to be among the most threatened areas by the increase
In Morocco, this issue is still not fully covered by the scien-    in flood occurrence and rapid urbanization (Leal Filho et al.,
tific community despite the obvious need for a new approach        2018). The impact of these floods particularly affects pop-
adapted to local conditions. This study applied a composite        ulation concentrations. Consequently, as population growth
index and geographic-information-system approach to mea-           increases, exposure to floods will be a real societal prob-
sure and map resilience to floods in three northern coastal        lem (Kundzewicz et al., 2014). Between 1993–2002, more
municipalities. The approach is also based on a linear rank-       than 19 000 000 persons have been affected by floods, and
ing of resilience parameters, offering a more optimal classi-      9642 persons have died in Africa (Conway, 2009). More-
fication of spatial resilience variation. The results allowed us   over, it is excepted that coastal African cities will experience
to identify specific areas with different resilience levels and    a higher rate of population growth and urbanization over the
revealed the relationship between urban dimensions and the         21st century (UN-Habitat, 2008; Lutz and Samir, 2010; Neu-
flood resilience degree. This approach provides an efficient       mann et al., 2015). The rapid coastal development will exac-
decision-support tool to facilitate flood risk management, es-     erbate the already high vulnerability of many African coastal
pecially in terms of prioritizing protective actions.              areas (Hinkel, 2011) since coastal cities are the most densely
                                                                   populated, with inhabitants taking advantage of residential,
                                                                   industrial, commercial, educational, and military opportuni-
                                                                   ties (UN-Habitat, 2015).
1   Introduction                                                      Morocco, situated in the north-west of Africa, reveals a
                                                                   trend towards a decrease in average annual rainfall as well
Climate change is a major challenge for the development of         as an increase in average annual temperature (Hoffman and
African countries. Several studies have highlighted the severe     Vogel, 2008; Terink et al., 2013; El Moçayd et al., 2020).
impact of global change in Africa (Bates et al., 2008; CRED,       The intensity of floods will increase over time (Vicuña et
2019). The patterns of precipitation (Born et al., 2008; Giorgi    al., 2011; Doocy et al., 2013; Roy et al., 2018), while the
and Lionello, 2008; Paeth et al., 2011), temperature (Fisher       main economic activities are located in coastal zones, where
et al., 2015), and evapotranspiration (Speth et al., 2010) are     60 % of the total Moroccan population is living (Snoussi et

Published by Copernicus Publications on behalf of the European Geosciences Union.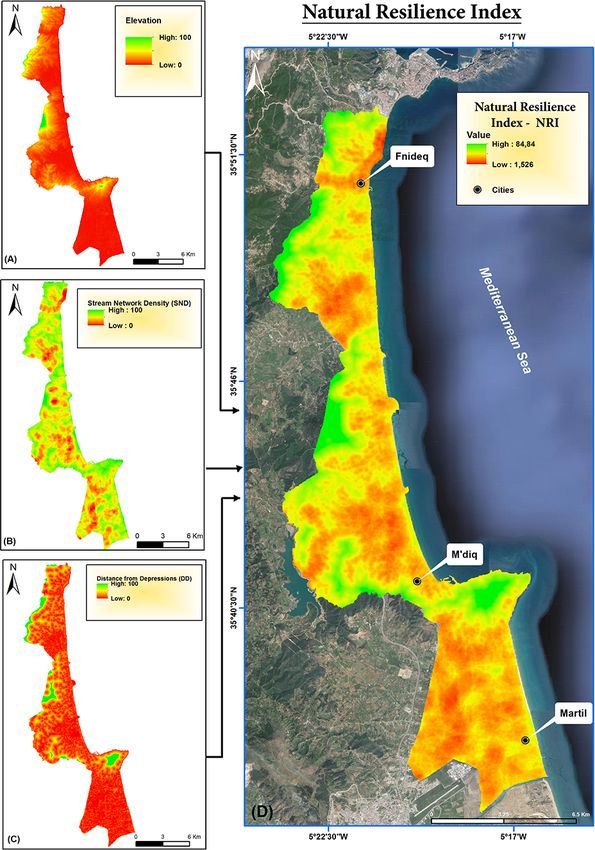
1102                         N. Satour et al.: Spatialized flood resilience measurement in rapidly urbanized coastal areas

al., 2009). During recent years, several new policies have         tial scales, considering resilience to be the ability of urban-
been implemented (Barthel and Planel, 2010; Ducruet et al.,        system components (ecological and socio-technical) to main-
2011; Kanai and Kutz, 2011) to improve these areas’ eco-           tain or rapidly return to desired functions.
nomic growth and reduce the negative effect of rural migra-           Resilience has a systemic property and implies greater
tion. In this regard, the economy’s main drivers are based         consideration of the temporal variability (Reghezza-Zitt et
on tourism and free-zone industries, which regrettably will        al., 2015). Some works describe it as the ability of short-term
increase the vulnerability of these zones to climate change        absorbing, self-organizing, and long-term learning and adap-
(Perelli, 2018). Adaptation to climate change is an important      tation (e.g. Chen and Graham, 2011; Colding and Barthel,
factor to consider in order to achieve sustainability in such      2013). The current diversity in definitions makes it difficult
areas. As the combinations of environmental change, demo-          to have a common concept (Carpenter et al., 2001). There-
graphic growth, and urban-complexity challenges will put           fore, a set resilience concept definition could be an appropri-
the urban environment under pressure (Marana et al., 2019),        ate basis.
there are several ways to tackle adaptation issues, limiting the      In this work, the resilience of the urban system to floods
impact of a climate-related disaster, especially flooding (UN-     is the capacity of flooded urban areas to maintain the activ-
DRR, 2019). The classical methods proposed to deal with            ities during and after floods. Simply put, a resilient coastal
such issues involve implementing structural systems (Plate,        urban area will be able to absorb the disaster (at an accept-
2002; Papadopoulos et al., 2017; Bertilsson et al., 2019).         able level) and be adapted to the changes. Besides, urban re-
However, climate variability has a very substantial effect         silience is a complex and multidimensional concept (Shar-
on the reliability of complex coastal-area systems. There-         ifi and Yamagata, 2016); the resilience of the urban sys-
fore, adaptation should also focus on resilience (sustainable-     tem to floods includes several dimensions of an urban sys-
development goals) (Chen and Leandro, 2019; Miguez and             tem: social, economic, physical, natural, and institutional di-
Veról, 2016) rather than only structural measures. Resilience      mensions are equally important (Batica, 2015; Qasim et al.,
approaches aim to understand and manage a system’s capac-          2016). The social dimension explores flexibility, health sta-
ity to adapt, cope with, and shape uncertainty (Adger et al.,      tus, and knowledge, while the economic dimension is related
2005; Folke et al., 2002).                                         to the economic capacities, income resources, and connec-
   Since the work of Holling (1973), where the resilience          tive devices within the community. The physical dimension
concept originates from the ecology field, the concept has         may include urban density, building materials, and infras-
gained increasing interest and recognition (Cretney, 2014;         tructure (Qasim et al., 2016) and can be quantified based
Weichselgartner and Kelman, 2014; Patel et al., 2017; Kon-         on physical indicators such as flood depth or flood duration
tokosta and Malik, 2018). The concept of resilience has been       extracted from flood simulation data (Mugume et al., 2015;
considered, in different ways, by various research fields: psy-    Chen and Leandro, 2019). Areas located at low elevations
chology (Westphal and Bonanno, 2007), geography (Pike et           or near rivers are more sensitive to flood disasters, constitut-
al., 2010; Cutter et al., 2010), archaeology (Redman, 2005),       ing the natural component of resilience (Hung et al., 2016).
and physics (Cohen et al., 2000). Natural disasters, risk man-     Thus, institutions’ efforts aim to cope with disasters through
agement, and climate change adaptation have recently been          better planning; awareness programmes prefer integrated ap-
included (e.g. Godschalk, 2003; Cutter et al., 2008; Gaillard,     proaches by considering all these dimensions in the evalua-
2010; Nelson et al., 2007; Serre et al., 2018).                    tion of resilience. It may help to have a global perspective,
   Within the context of disasters and climate change, many        which will lead to creating suitable management tools that
definitions of the resilience concept have emerged. Some are       can be very useful in the decision-making process (Bertils-
focusing on the ability of the system, community, or city to       son et al., 2019). Supporting this decision-making process
absorb disturbances, retaining the same basic structures and       on strategies, actions, and measures to be taken and planning
normal ways of functioning, with self-organization capacity        for the long, medium, and short terms as well as assessing
and adaption to stress and change (e.g. Pelling, 2003; Pen-        the progress start with assessing the current and expected fu-
dall et al., 2007; IPCC, 2007). Bouncing back to the origi-        ture status of resilience. This will highlight where resilient
nal state (equilibrium) after a disaster is undesirable (Klein     urban areas are and identify their strengths and weaknesses
et al., 2003) knowing that social systems are in a contin-         (Cardoso et al., 2020).
uous state of change. Adaptation to some changing trends              Because of its multidimensional aspect, quantifying re-
or several states of equilibrium becomes one of the main           silience remains a great challenge (Bertilsson et al., 2019).
characteristics of resilience depending on preparedness for        Many works have shown the need to have some metrics able
the unprecedented and unexpected changes (Walker et al.,           to measure resilience. However, to date, there is no consensus
2004; Pendall et al., 2007; Paton et al., 2006; Ahern, 2011).      about a single metric evaluation, and the literature refers to
This is determined by a system’s capacity to organize it-          the need for measures (e.g. Meerow et al., 2016; Asadzadeh
self, learn from past disasters, and improve risk reduction        et al., 2017; Rus et al., 2018). Furthermore, making resilience
measures (UNISDR, 2016). Some works (e.g. Meerow et                tangible and practical for cities through a transition from the-
al., 2016) have linked the concept to the temporal and spa-        ory to practice is challenging (Kontokosta and Malik, 2018;

Nat. Hazards Earth Syst. Sci., 21, 1101–1118, 2021                                https://doi.org/10.5194/nhess-21-1101-2021
N. Satour et al.: Spatialized flood resilience measurement in rapidly urbanized coastal areas                                1103

Meerow et al., 2016). Quantitative approaches through com-         Morocco is mentioned as a hotspot for climate change in sev-
posite indicators provide a synthetic measurement of a com-        eral works (Born et al., 2008; Driouech et al., 2009; Ouham-
plex and multidimensional phenomenon (Chang and Jeon,              douch and Bahir, 2017). Moreover, the precipitation’s sea-
2014). Those indicators are developed based on the aggre-          sonal distribution strongly influences the Mediterranean river
gation of multiple individual indicators (OECD, 2008). The         hydrology (Thornes, 2009). Assessing the intensity of the
choice of method to construct composite indices is depen-          impact, regional-climate-model (RCM) simulations over this
dent upon the type of problem, the nature of the data, and         area all agree that Morocco might experience an increase in
the goals (OECD, 2008). Several composite indices to assess        temperature and a decrease in precipitation (Driouech et al.,
the resilience of urban areas and compare their resilience lev-    2010). This will have a severe impact on water (Bahir et al.,
els within specific geographical regions have been proposed        2020) and natural hazards (Satta et al., 2016), among others.
in recent years (e.g. Sharifi and Yamagata, 2016; Asadzadeh        Consequently, increasing resilience against flooding is, there-
et al., 2017). For example, the work of Cutter et al. (2014)       fore, of utmost importance to achieve sustainability (Snoussi
using BRIC (Baseline Resilience Indicators for Communi-            et al., 2008). However, a knowledge gap for a better under-
ties) is the first attempt at the operationalized version of       standing of resilience has been identified at national and local
the conceptual framework “DROP” (disaster resilience of            levels (Price, 2017) in Morocco. It is highly recommended to
place) model (Cutter et al., 2008). Within a socio-ecological      provide policymakers with a simple approach and ways to
approach, BRIC was calculated for a multi-hazard context.          enhance resilience to floods in the local area (OCDE, 2016).
Among other analysts, Joerin et al. (2014) state that the CDRI        The present study is the first attempt to provide a method-
(climate disaster resilience index) gauges the different capa-     ological way to measure flood resilience for northern coastal
bilities needed for communities in an urban system to regain       municipalities in Morocco: Martil, M’diq, and Fnideq. In this
an equilibrium state after climate-related disasters such as cy-   work, flood resilience refers to the resilience of these coastal
clones, droughts, floods, and heatwaves. Following the same        urban areas (Martil, M’diq, and Fnideq) to floods. These ar-
holistic spirit, this index was adopted in Climatic Hazard         eas were selected because they show 18 hotspots highly ex-
Resilience Indicators for Localities (CHRIL) (Hung et al.,         posed to floods (ABHL, 2016). Moreover, the area is partic-
2016). Mayunga (2007) also proposed a community disas-             ularly highly vulnerable to multiple hazard types, including
ter resilience index (CDRi). All of those previous indicators      floods (Karrouchi et al., 2016; Taouri et al., 2017), sea-level
were applied to quantify community resilience to multiple          rise (Niazi, 2007; Snoussi et al., 2011), and coastal erosion
natural hazards. Qassim et al. (2016) determined community         (Satta et al., 2016; Nachite, 2009). However, the littoral is
resilience to a particular hazard, “floods”, and specific com-     nowadays very urbanized, and tourist activities are the main
munity, “urban areas”, as recently proposed also by Cariolet       economic resources in the area (Anfuso et al., 2010).
et al. (2019). However, many particular indicators were de-
veloped for a specific case of urban resilience to a specific
hazard like floods.                                                2     Methods: study area and index development
   Based on time-dependent characteristics, FResI (flood re-
                                                                   2.1    Fnideq, M’diq, and Martil municipalities
silience index) was constructed to assess future resilience re-
sponses relative to the present situation (Miguez and Veról,       Related to the M’diq-Fnideq prefecture, the Fnideq,
2016). Further, Chen and Leandro (2019) quantified the flood       M’diq, and Martil municipalities have a population of
resilience of households in urban areas by the FRI (flood re-      984 inhabitants/km2 (RGPH, 2014). The precipitation
silience index) as a time-dependent method. More examples          regime is characterized by seasonality, with an annual aver-
of specific indicators are available (Kotzee and Reyers, 2016)     age rainfall of 679 mm (ABHL, 2016). Rainfall variability is
using geographic information systems (GISs) and stress the         based on altitude and the geographic situation (Karrouchi et
need to move towards diversifying resilience assessment ap-        al., 2016). Rivers flowing into the Mediterranean Sea (Mar-
proaches.                                                          til, Mellah, Smir, Negro, and Fnideq) drain slowly during the
   Regardless of several challenges associated with data qual-     rainy months and intensely in a short time during flash floods
ity and availability constraint (Moghadas et al., 2019; Cai et     (Niazi, 2007), while the frequency of flood events and re-
al., 2018) and as a standard procedure for composite indica-       lated damages increased gradually over time (e.g. on 26 De-
tor development (Asadzadeh et al., 2017), particular attention     cember 2000, Martil floods invaded more than 2400 ha in the
has been paid to composite indicators (Heinzlef et al., 2019)      Martil plain) (Fig. 1). Urbanization is concentrated in coastal
regarding their ability to analyse the urban, social, and tech-    zones and puts pressure on coastal ecosystems with high
nical resilience of a city. However, a lack of resilience mea-     touristic value (Snoussi et al., 2011). It is pitiable that mu-
surement tools developed by local authorities and organiza-        nicipalities are also vulnerable to multiple climate and non-
tions in the developing countries was reported in a critical       climate hazards such as erosion and morphological changes
review by Sharifi and Yamagata (2016).                             (Satta et al., 2016).
   The Mediterranean region will suffer from severe impact
due to climate change (Tuel and Eltahir, 2020). Particularly

https://doi.org/10.5194/nhess-21-1101-2021                                 Nat. Hazards Earth Syst. Sci., 21, 1101–1118, 2021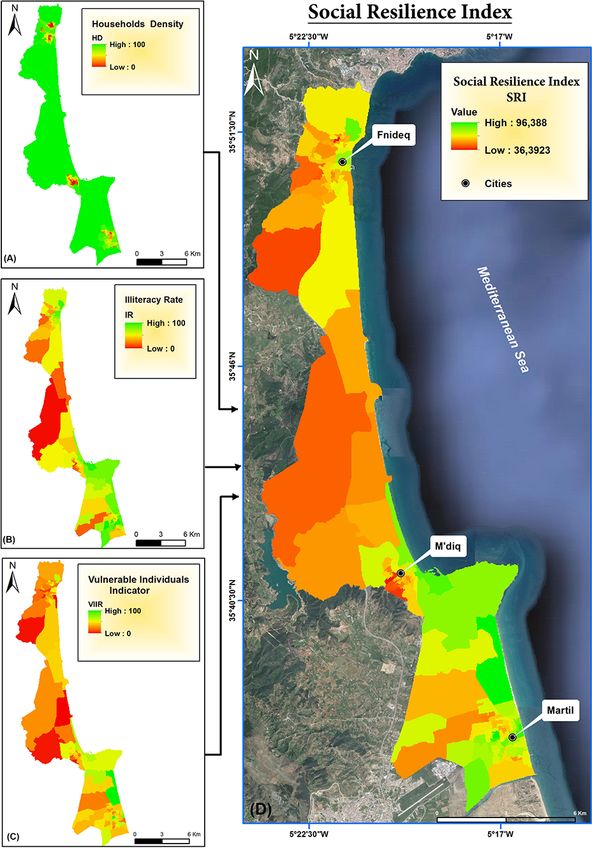
1104                          N. Satour et al.: Spatialized flood resilience measurement in rapidly urbanized coastal areas

Figure 1. Location of the three studied municipalities: Fnideq, M’diq, and Martil, in northern Morocco, and examples of the flooding
(1: photo of Fnideq centre on 28 September 2008; 2: photo of Almassira commercial centre Fnideqin on 27 September 2014; 3 and 4: photos
of M’diq on 6 March 2010; 5: photo of Martil River on 2 March 2018). © Copernicus data (2017).

2.2    Theoretical comprehensiveness for composite index              (Cutter et al., 2008). Also, the quality of the framework, the
       development                                                    data, and the used methodology can significantly influence
                                                                      a composite index’s qualities and the soundness of the mes-
To produce an aggregate measure of resilience, through ma-            sages that it conveys.
nipulation of individual variables, constructing a “compos-              The flood resilience index is explored and calculated dif-
ite indicator” is often undertaken. It is a mathematical com-         ferently in several works. Kotzee and Reyers (2016) used
bination of thematic sets of variables that represent differ-         PCA (principal component analysis) as a method to con-
ent dimensions of a concept that cannot be fully captured             struct this index and define its component weights. For Bat-
by any individual indicator alone (OECD, 2008). An indica-            ica (2015) it has been built taking into account different spa-
tor is a quantitative or qualitative measure derived from ob-         tial scales and focusing on urban functions. Using time series
served facts revealing the relative position of the phenomena         indicators (event phase and recovery phase), Chen and Lean-
being measured. “It can illustrate the magnitude of change            dro (2019) computed the FRI at time t as the product of the
(a little or a lot) as well as the direction of change over           recovery factor and the FRI at the previous time step t −1. By
time (up or down; increasing or decreasing)” (Cutter et al.,          defining resilience as time-dependent, based on two phases
2010). Moreover, considerable attention is increasingly given         (event and recovery), Leandro et al. (2020) have also shown
to composite indices as useful tools for decision-making and          the ability of the developed FRI for assessing climate change
public communication. They simplify and communicate eas-              adaptation. Despite the already-existing studies on flood re-
ily the reality of complex situations (Freudenberg, 2003)             silience assessment, there is still a need to develop methods
and convey more precise information (Saisana et al., 2005).           for a specific case of study, where data availability remains
However, through different geographical contexts and scales,          a challenge, and the need for a tangible and simple way to
these indices may encompass many theoretical perspectives             better understand resilience is increasing.

Nat. Hazards Earth Syst. Sci., 21, 1101–1118, 2021                                    https://doi.org/10.5194/nhess-21-1101-2021
N. Satour et al.: Spatialized flood resilience measurement in rapidly urbanized coastal areas                                         1105

Figure 2. Procedure used to assess flood resilience in the three municipalities.

   In this study, we adopt the specific flood resilience index            2.3      Selecting indicators: scoring and classification
to quantify the resilience of coastal urban areas to floods.
The FRI was divided into four sub-indicators – social, phys-              Based on their relevance, analytical representativeness, and
ical, economic, and natural sub-indices – so as to enable                 accessibility, 16 indicators (variables) were selected (Ta-
sufficient flexibility to include or not each sub-index in the            ble 1). The data used were mainly drawn from the national
global composite index (Fig. 2). Three indicators were cho-               population and housing census (RGPH, 2014). The Arc Hy-
sen for each sub-index (Table 1) based on data availability               dro and Line Density modules of ArcGIS© were used to gen-
and their contribution to persistence, recovery, or adaptive              erate a stream network density from an ASTER (Advanced
capacity (the main components of the adopted resilience def-              Spaceborne Thermal Emission and Reflection Radiometer)
inition): household density (HD), illiteracy rate (IR), and the           digital elevation model (30 m of spatial resolution), while
vulnerable-individual indicator (VII) were taken into consid-             Google high-resolution satellite imagery was used for dig-
eration as the mean indicators that affect the social resilience          itizing the building area. This was converted firstly into
negatively and construct the social sub-index. The physical               points, and then their density was calculated using the Ar-
sub-index included the old-building rate (OBR), the mod-                  cGIS© Point Density module.
ernly built houses (MBHs), and the connection to water in-
frastructure (CWI). This sub-index is important because it                2.4      Normalization
improves the physical capacity of individual and common
                                                                          Indicators’ integration into sub-indicators needs data normal-
properties against floods and thus minimizes their vulner-
                                                                          ization. Respecting the theoretical framework and the data
ability degree. The economic-resilience sub-index also in-
                                                                          characteristics, a min–max normalization was applied. Sub-
cludes three indicators: unemployment rate (UR), building
                                                                          sequently, each variable was normalized from 0 to 100 ac-
density (BD), and communication capacity (CC). Finally,
                                                                          cording to Eqs. (1) and (2):
elevation (E), stream network density (SND), and distance
from depressions (DD) are the indicators selected to deter-
mine the natural-resilience sub-index.

https://doi.org/10.5194/nhess-21-1101-2021                                          Nat. Hazards Earth Syst. Sci., 21, 1101–1118, 2021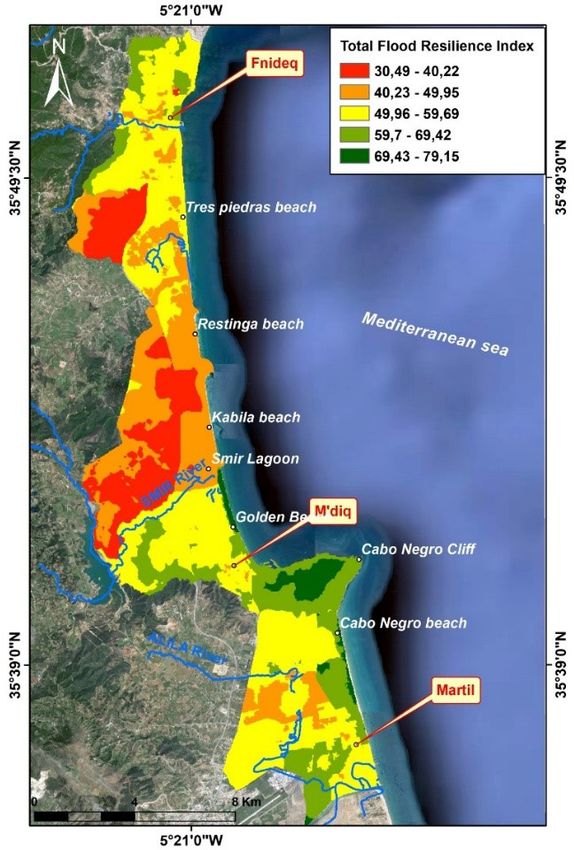
1106                             N. Satour et al.: Spatialized flood resilience measurement in rapidly urbanized coastal areas

Table 1. Indicator descriptions selected to assess the flood resilience in the Fnideq, M’diq, and Martil areas (compiled from different sources).

   Dimensions      Indicators                                    Description of effect on resilience and justification
   Social          Household density (HD)                        Cities with higher building density in developing countries tend
   (SD)                                                          to be densely populated, with many areas that have grown fast
                                                                 (Andersson, 2006), often with insufficient infrastructure,
                                                                 resulting in environmental degradation and high-damage floods.
                                                                 Studies have found that highly resilient sites had low population
                                                                 density (Sanabria-Fernandez et al., 2019).
                   Illiteracy rate (IR)                          This refers to the persons who have never learned to read. That can make
                                                                 the emergency and public awareness processes challenging (Cutter
                                                                 et al., 2010).
                   Vulnerable-individual indicator (VII)         It refers to all vulnerable people (0–14-year-olds, 60-year-olds, and
                                                                 disabled people) who can create hindrances in mobility during
                                                                 floods and operations of evacuation (Hung et al., 2016; Qasim et
                                                                 al., 2016).
   Physical        Old-building rate (OBR)                       This is the percentage of buildings that are over 50 years old. It
   (PD)                                                          expresses the fragility that increases with building material age.
                   Modernly built houses (MBHs)                  Based on the building material factor (by reinforced concrete and
                                                                 bricks with mortar), modernly built houses will suffer less exterior
                                                                 damage during flood events in the local state (Cutter et al., 2010).
                   Connection to water infrastructure (CWI)      The high rate of connection to the sewage system and drinking water
                                                                 distribution strengthens community resilience (Cutter et al., 2010).
                                                                 Not being guaranteed access to water during and after
                                                                 an emergency (Pagano et al., 2017) will aggravate the situation.
   Economic        Unemployment rate (UR)                        It expresses the decrease in the individual economic capacity.
   (ED)                                                          Unemployed people are faced with difficulties related to their
                                                                 disability to recover or rebuild their damaged property (Cutter et
                                                                 al., 2010; Sherrieb et al., 2010).
                   Building density (BD)                         It reflects the concentration of buildings per area. For people more
                                                                 concentrated in low-quality urban housing, infrastructure, and
                                                                 services, the impact of a natural disaster is higher (Pallard et al.,
                                                                 2009). It was selected based on the fact that an area with high
                                                                 building density is less resilient to floods.
                   Communication capacity (CC)                   This is the rate of persons with communication devices (television,
                                                                 mobile phone, and internet). The communication facilities’
                                                                 availability during, after, and before flood hazards, strengthen
                                                                 resilience (Cutter et al., 2010).
   Natural         Elevation (E)                                 It was selected based on the fact that lands with low elevation are
   ND                                                            more at risk of flooding and exposed to damages compared to high-
                                                                 elevation areas.
                   Stream network density (SND)                  It describes the degree of drainage network development and was
                                                                 recognized to be significantly linked with the formation of flood
                                                                 flows (Pallard et al., 2009).
                   Distance from depressions (DD)                It expresses the distance from flood-prone areas or flood risk areas
                                                                 (ABHL, 2016), including natural depressions of high flow accumulation.

Nat. Hazards Earth Syst. Sci., 21, 1101–1118, 2021                                          https://doi.org/10.5194/nhess-21-1101-2021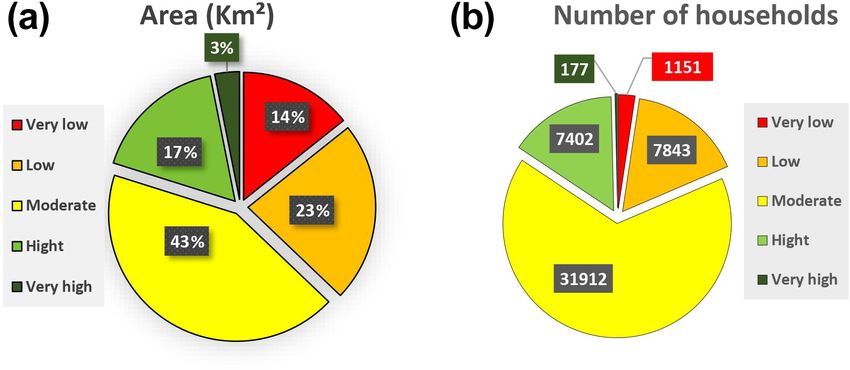
N. Satour et al.: Spatialized flood resilience measurement in rapidly urbanized coastal areas                                 1107


                                                                    2.6    Links to other indicators
 +      real value − minimum value
V =                                     × 10         (1)            To assess the correlation between the composite index and
      maximum value − minimum value

              real value − minimum value
                                                                  corresponding sub-indices and variables, a statistical analysis
V− = 1−                                       × 100. (2)            was performed using the program SPSS 23. Data presented
           maximum value − minimum value
                                                                    as a mean and standard deviation (SD) were statistically anal-
Equation (1) was applied for variables that positively influ-       ysed using multi-variance to confront data of natural, physi-
ence resilience, while Eq. (2) was applied to those that are        cal, economic, and social conditions with the flood resilience
negatively correlated with resilience. When the scores are at-      index and to identify which variables differ significantly be-
tributed, each of these indicators was gridded, and then a geo-     tween the three case study sites. The significant differences
database was created to calculate the sub-indices by using the      were distinguished by post hoc Tukey’s honestly significant
GIS. Each sub-index is the mean value of all correspondent          difference (HSD) test at p < 0.05. The Spearman’s ρ coeffi-
indicators.                                                         cient was used for correlations between variables. Only sig-
                                                                    nificant correlation coefficients at a level of 0.05 are consid-
2.5   Weighting and aggregation                                     ered.

The existing methods for determining weights do not always          2.7    Visualization and validation
reflect the priorities of decision-makers (Esty et al., 2005),
which are subjective (Cutter et al., 2010). Equal weighting         Particular attention has been paid to the visualization given
is the most common for composite indices with several sub-          its relevance in helping and enhancing interpretability. Maps
indicators (OECD, 2008). Thus, several arguments are listed         facilitate further exploration of spatial data trends (Kotzee
by Greco et al. (2019) (i. simplicity of construction, ii. a        and Reyers, 2016). For that purpose, geographic informa-
lack of theoretical structure to justify a differential weighting   tion systems (GISs) were adopted to visualize the FRI and
scheme, iii. no agreement between decision-makers, iv. inad-        sub-indicators. After visualizing the composite index results,
equate statistical and/or empirical knowledge, v. alleged ob-       validation was the last step. Acting like a “quality assur-
jectivity). Moreover, the weighting method selection depends        ance”, this step will highly reduce the possibilities of con-
on the local factors where the method is applied (Mayunga,          veying a misleading message (Saisana et al., 2005). Unfor-
2007; Reisi et al., 2014). Allocating equal importance across       tunately such a step is often skipped for the vast majority
different indicators is better suited when no knowledge ex-         of the composite indices (OECD, 2008). External validation
ists about the interactions among the sub-indicators and in-        has been the most used to validate several indicator results
dices and the corresponding composite index at the local            (CDRI 2009, BRIC 2012, CDRI 2013, and BRIC 2014).
scale (Cutter et al., 2014; Asadzadeh et al., 2017). All vari-         In our case, the validation based on actual outcomes of the
ables are given equal weight (EW) in our case of study. The         municipalities is possible using cross-validation type. It was
main reason is to allocate equal importance across indicators       performed to test and compare the reliability of FRI results
because of the lack of knowledge and justification about the        using the results of other studies interested in hydro-climatic
existing interactions among the sub-indicators and composite        hazards as suggested by Satta et al. (2016). This is possible
index at the local level while avoiding a high concentration        through the opposite correlation between risk and resilience
of a few indicators and making the composite index easy to          (Cutter et al., 2014; Sherrieb et al., 2010). Seeking optimiza-
communicate.                                                        tion by considering social and economic pathways, and com-
   The simple method of aggregation, which is supposed to           bining flood resilience and flood risk, measures can be effec-
be transparent and easy to understand, is a critical criterion      tive against a broader range of hazards than when considering
for potential users (Cutter et al., 2010). All individual in-       either method alone (Disse et al., 2020).
dicators have the same measurement unit. Therefore, using
linear aggregations is preferred over geometric aggregation.
The linear aggregation formula of the FRI takes the follow-         3     Results
ing form:
                                                                    3.1    Sub-indices
      SRI + PRI + ERI + NRI
FRI =                       ,                                (3)    Each sub-index was observed separately to get additional in-
                4
                                                                    sights about the flood resilience index. The social resilience
where SRI is the social-resilience index, PRI is the physical-      sub-index (Fig. 3d) was produced based on the three indi-
resilience index, ERI is the economical resilience index, and       cators of social resilience (Fig. 3a–c). The highest values of
NRI is the natural-resilience index; 0 is considered to be a        social resilience are more related to a few urban areas than
low resilience level, 100 a high resilience level, and 50 a         rural and less developed sectors. In terms of mean value,
medium resilience level.                                            the social-resilience sub-index was higher in Martil (69.03 ±
                                                                    11.24), followed by Fnideq and the coastal area of M’diq,

https://doi.org/10.5194/nhess-21-1101-2021                                  Nat. Hazards Earth Syst. Sci., 21, 1101–1118, 2021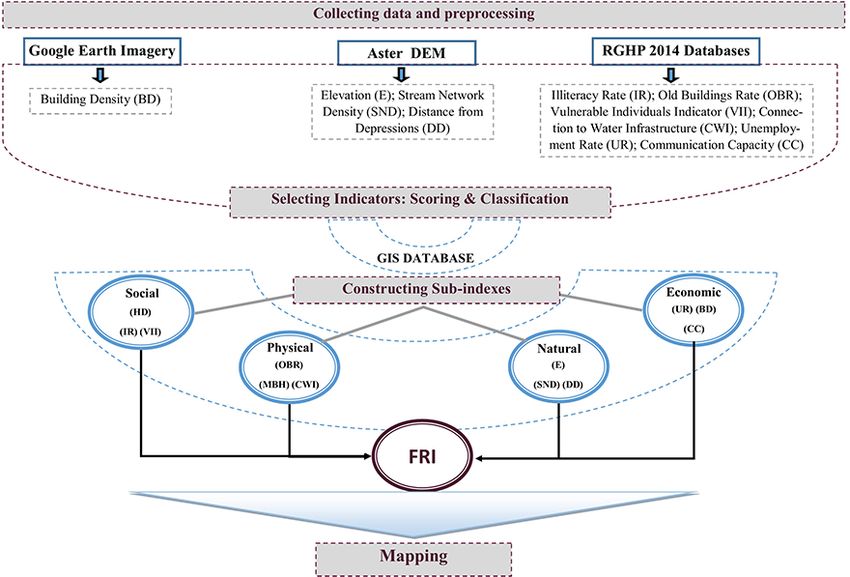
1108 N. Satour et al.: Spatialized flood resilience measurement in rapidly urbanized coastal areas
Figure 3. Spatial distribution of (a) household density, (b) illiteracy rate, (c) vulnerable-individual indicator, and (d) social-resilience index
(obtained from © Google Maps 2018).
showing similar values (57.11 ± 9.26 and 57.17 ± 11.44, re- pared to the urban centres of Fnideq, M’diq, and Martil and
spectively). the coastal zone (Fig. 4d).
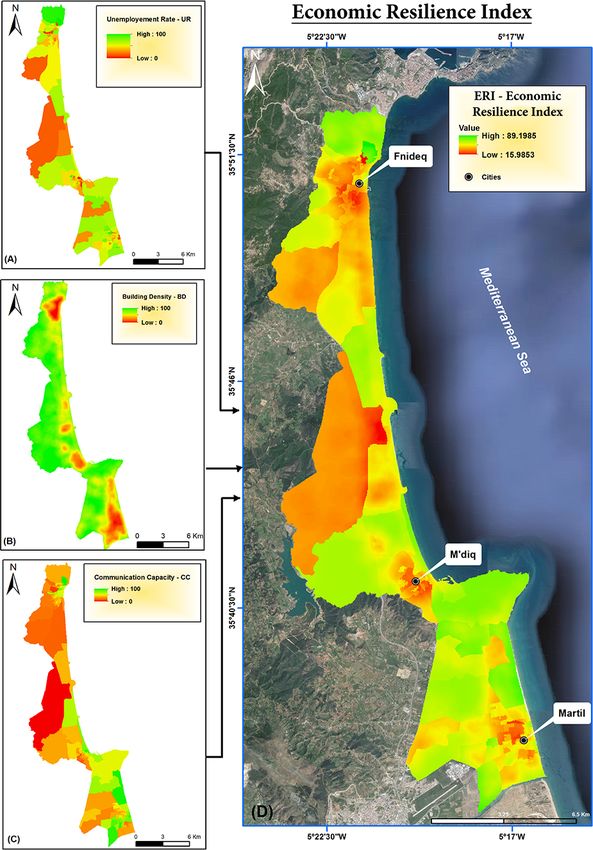
Higher physical-resilience scores (Fig. 4a–d) are concen- Results (Fig. 5d) show a concentration of the low and mod-
trated in the urban-centre areas, with a spatial tendency to- erate levels of economic resilience in the three urban centres.
wards the coastal area, even though pockets of lower scores However, this does not exclude some coastal urban sectors
exist in the central area and some less developed sectors, in- showing high levels of the economic-resilience sub-index.
dicating low physical-resilience levels. Therefore, the central The overall map of the natural-resilience index shows a
area had a somewhat low level of physical resilience as com- spatial variability between the lowest and the medium level
of the NRI in the whole study area (Fig. 6d). However, the
Nat. Hazards Earth Syst. Sci., 21, 1101–1118, 2021 https://doi.org/10.5194/nhess-21-1101-2021N. Satour et al.: Spatialized flood resilience measurement in rapidly urbanized coastal areas 1109
Figure 4. Spatial distribution of (a) old-building rate, (b) brick-house rate, (c) connection to water infrastructure, and (d) physical-resilience
index (obtained from © Google Maps 2018).
high level of natural resilience is more prevalent in areas with classified as moderately resilient, and only 17 % of the stud-
high altitudes, such as Capo Negro (Fig. 6a and c). ied area (17 km2 ) was classified as highly resilient; the re-
maining 3 % had very high resilience. The central area shows
3.2 Total flood resilience index the lowest levels of the FRI, including sensitive coastal sites
such as Smir lagoon, Kabila beach, and Restinga beach. In
contrast, M’diq and the north of Martil have relatively mod-
The results reveal a marked spatial variability in resilience to
erate to high values in terms of resilience to floods. How-
floods (Fig. 7). Overall, 31 % of the study area varies from
ever, the significant disparities between rural and urban ar-
low to very low, which equals 45 km2 (Fig. 8a). A total of
43 % of the studied area, which is equivalent to 52 km2 , was
https://doi.org/10.5194/nhess-21-1101-2021 Nat. Hazards Earth Syst. Sci., 21, 1101–1118, 20211110 N. Satour et al.: Spatialized flood resilience measurement in rapidly urbanized coastal areas Figure 5. Spatial distribution of (a) unemployment rate, (b) building density in 2017, (c) communication capacity, and (d) economic- resilience index (obtained from © Google Maps 2018). eas, especially in terms of socioeconomics, highly influence holds (around 2.4 %) are in areas of very low resilience and the flood resilience index values. more than 7800 households (about 16 %) in low-resilience In order to avoid any confusion related to flood manage- areas. On the other hand, 7402 households are in a high- ment priorities between the rural and the urban areas, the re- resilience situation, and only 177 can be qualified as having silience maps corresponding to urban areas were extracted, very high resilience (Fig. 8b). and the index values using GISs were reclassified to have the priority areas without taking into account the rural part. Us- ing this tool to overlay the spatial distribution of households (RGPH, 2014) and the FRI map, it turns out that 1151 house- Nat. Hazards Earth Syst. Sci., 21, 1101–1118, 2021 https://doi.org/10.5194/nhess-21-1101-2021
N. Satour et al.: Spatialized flood resilience measurement in rapidly urbanized coastal areas                                         1111

Figure 6. Spatial distribution of (a) elevation, (b) stream network density, (c) distance from depressions, and (d) natural-resilience index
(obtained from © Google Maps 2018).

3.3   Statistical analysis                                              where it is proven to be important as an FRI component. Re-
                                                                        garding the ERI sub-index, it shows a moderate correlation
                                                                        in the Fnideq and Martil municipalities (p < 0.01) or even a
In order to evaluate the contribution of the sub-dimensions             low correlation at the M’diq level (p < 0.05). Unlike the SRI
(social, economic, physical, and natural dimensions) for the            and ERI, the correlation with the PRI sub-index is different
resilience analysis, the statistical relationship between the to-       from one municipality to another. It is strong at the level of
tal flood resilience index (FRI) and its sub-indices was esti-          Martil (p < 0.001), weak at the level of Fnideq (p < 0.01),
mated for each municipality (Table 2).                                  and absent at the level of M’diq. In the case of the NRI sub-
   The SRI is positively correlated with the FRI in the three
municipalities (p < 0.001), particularly in the urban areas,

https://doi.org/10.5194/nhess-21-1101-2021                                      Nat. Hazards Earth Syst. Sci., 21, 1101–1118, 2021
1112 N. Satour et al.: Spatialized flood resilience measurement in rapidly urbanized coastal areas
has thus become a crucial issue for local flood management
planners (Godschalk, 2003). However, these products require
generally detailed knowledge about all resilience compo-
nents in time and space to be effective. They should be de-
signed in such a way that can help the decision-making by us-
ing the ranking and prioritization process (Chitsaz and Bani-
habib, 2015). Accordingly, the choice of a good methodology
to assess and quantify resilience attains its utmost importance
and relevance. Indeed, the adopted methodological approach
as well as the quality of the data has a significant influence on
the obtained results and hence on the final decision-making
(Suárez et al., 2016).
In this paper, the adopted methodology is adaptable ac-
cording to the study case and the available data. Moreover,
the adapted ranking process is based on linear scoring, which
offers the advantage of being more sensitive to changes com-
pared to the usual methods based on assigning scores ac-
cording to intervals (e.g. Angeon and Bates, 2015). It also
provides a more reliable and objective spatial comparison of
resilience parameter values, which will finally allow effective
prioritization of resilient areas to be obtained.
It should be noted that significant components for the re-
silience analysis have been considered and the obtained re-
silience map allowed the classification of the study area ac-
cording to four resilience degrees to floods: very low, low,
moderate, and high.
The difference in the social-resilience sub-index between
urban and rural areas could be explained by the fact that hu-
man development indicators are generally lower in rural and
less developed areas, especially those related to school at-
Figure 7. Distribution of total flood resilience index (obtained from tendance and people’s vulnerability, which affect social re-
© Google Maps 2018). silience negatively. However, the difference in the SRI be-
tween municipalities may occur because of the great growth
Table 2. Spearman’s rho correlation between the total flood re- rate of Martil municipality rather than Fnideq and M’diq
silience index (FRI) and its dimensions. (HCP, 2018)
The low physical resilience in the central area and the less
SRI ERI PRI NRI developed sectors may exist because of the low population
and urbanization (e.g. at the central-area access to water in-
Fnideq 0.643∗∗∗ 0.441∗∗ 0.378∗ 0.650∗∗∗ frastructure) as basic service is still low (Fig. 4c), unlike in
FRI Martil 0.764∗∗∗ 0.425∗∗ 0.589∗∗∗ 0.470∗∗
the case of the urban centres with high physical-resilience
M’diq 0.800∗∗∗ 0.408∗ – 0.544∗∗
scores.
∗ p < 0.05; ∗∗ p < 0.01; ∗∗∗ p < 0.001. Meanwhile, the high level of the economic-resilience sub-
index in some coastal urban sectors may be explained by
tourism and economic activities. An expected result has
index, it displays a strong correlation at the level of Fnideq given the characteristics of the wealthy residents living there
and moderate at the level of Martil and M’diq. (Tempelhoff et al., 2009; Kotzee et Reyers, 2016), unlike the
three urban centres having low and moderate economic re-
silience that could be explained by the high unemployment
4 Discussion rate of 17.9 % (HCP, 2018) and the high urban density. These
results support our hypotheses and the suggestions from Cut-
Within the current context of global climate change associ- ter et al. (2010) and Hung et al. (2016). Further, the results of
ated with an increase in flood damage, the efficient use of Irajifar et al. (2016) show that the association of high popula-
available data is, in most cases, the primary source of judge- tion density and high incomes makes a recovery after disaster
ment control in decision-making for flood risk management quicker.
(Ouma and Tateishi, 2014). Producing flood resilience maps
Nat. Hazards Earth Syst. Sci., 21, 1101–1118, 2021 https://doi.org/10.5194/nhess-21-1101-2021N. Satour et al.: Spatialized flood resilience measurement in rapidly urbanized coastal areas 1113
Figure 8. (a) Total flood resilience score distribution according to the surface of the study area; (b) total flood resilience score distribution
according to household numbers in the study area.
The overall picture of natural resilience shows that all levels to provide support and strengthen actions promoting
three municipalities have lower natural resilience. Martil had social and economic levels in the municipalities.
a somewhat low level of the NRI as compared to Fnideq and Further, the statistical analysis shows a significant link be-
M’diq. This is because of the lowest values of elevation indi- tween the natural characteristics and resilience degrees. In
cator and distance from depressions. The findings fully cor- that situation, it is recommended to establish best practices
respond to the existing literature (Hung et al., 2016), support- and measures to avoid urban development in flooded areas
ing the relationship between elevation, flood-prone areas, and and to provide more efforts to manage the risk of floods in
the least resilience. urbanized areas, with a strong focus on the contingency plans
The areas with a very low and low flood resilience index in case of power or drinking water failure in the three munic-
seem to be generally associated with the areas showing un- ipalities.
stable socials conditions. This observation is confirmed by Therefore, there is a need to incorporate disaster manage-
the statistical analysis and studies (Godschalk, 2003; Cut- ment education in college to explain hazard adaptation and
ter et al., 2010; Kotzee et Reyers, 2016; Moghadas et al., to educate people through communication devices, seminars,
2019) showing that social resilience is strongly correlated and workshops to make citizens aware of the damages and
with flood resilience degree. Moreover, the disparities high- the climate change effects.
lighted between rural and urban areas revealed that rural ar- The obtained results highlight the importance of using a
eas display the lowest resilience to floods. multidimensional approach to assess flood resilience. Fur-
The natural resilience, which is tightly linked at the sites, thermore, GISs are also highly recommended as a solution
is the second-most statistically significant indicator linked to to complex situations and as a decision-support tool that of-
the total FRI. Disparities between municipalities are less sig- fers an interactive use and continued improvement (Ouma
nificant. This means that areas having low or moderate re- and Tateishi, 2014; Mayunga, 2007).
silience to floods need equal attention (Qasim et al., 2016).
The risk- and vulnerability-oriented studies (Niazi, 2007;
Snoussi et al., 2011; Nejjari, 2014; Satta et al., 2016) in the 5 Conclusions
coastal area were used for validation. The results are consis-
tent, showing that coastal sites such as Restinga plain, Kabila Building and enhancing resilience to floods become critical
beach, Smir lagoon, and Martil-Alila plain, which have a low as the urban development in a coastal area in Africa is in-
resilience, are highly vulnerable to the flash floods and sea- creasingly stressed, especially for the coastal zones situated
level-rise impacts (Snoussi et al., 2011; Niazi, 2007; Satta et in semi-arid threatened areas, as in Morocco’s local contexts,
al., 2016). Considering all the output, this confirms that the where this study is the first attempt at focusing on enhanc-
flood resilience index is relatively valid and can be adapted ing the understanding of resilience to floods and highlighting
and tested in other geographical areas. Moreover, this robust- the application of the tangible approach to summarize and
ness analysis makes the FRI in this case of study support the present complex components linked to resilience to floods.
idea that areas with higher vulnerability levels have lower re- Flood resilience assessment was piloted using a compos-
silience levels (Hung et al., 2016). ite index and geographic information systems. The spatial
In this context, there is a need to prioritize the actions con- and statistical analysis gave further insights into the ge-
tributing to enhancing the social and economic communities’ ographic distribution of the flood resilience index across
Fnideq, M’diq, and Martil municipalities. Moreover, the in-
https://doi.org/10.5194/nhess-21-1101-2021 Nat. Hazards Earth Syst. Sci., 21, 1101–1118, 20211114 N. Satour et al.: Spatialized flood resilience measurement in rapidly urbanized coastal areas
dex clarifies the presentation of a complex set of components Review statement. This paper was edited by Kai Schröter and re-
linked in a reproducible way. viewed by Jorge Leandro and two anonymous referees.
The findings indicate that different factors can affect spa-
tial patterns of resilience to floods. The framework is flexible
enough to allow the proposed index, in future work, to take
References
into consideration the institutional component. Including the
institutional component could advance our understanding of ABHL: Hydraulic Basin Agency of Loukkos, Typology and inven-
flood resilience and provide useful results to suggest flood tory of sites at flloding risk ABHL, 2, available at: http://www.
adaptation strategies in a coastal area. The robustness of the abhloukkos.ma/abhl/index.php/fr/ (last access: March 2021),
flood resilience indicator was tested by comparing the re- 2016.
sults against additional case studies and operationalized re- Adger, W. N., Hughes, T. P., Folke, C., Carpenter, S. R., and Rock-
silience measures. Some of the main limitations of the de- ström, J.: Social-Ecological Resilience to Coastal Disasters, Sci-
veloped flood resilience index are starting with tackling the ence, 309, 1036–1039, https://doi.org/10.1126/science.1112122,
main limitations from considering real and simulated flood 2005.
inundation maps and integrating climatic data (flood data or Ahern, J.: From fail-safe to safe-to-fail: Sustainability and resilience
in the new urban world, Landsc. Urban Plan., 100, 341–343,
flood simulation data). Besides, for robust validation, the date
https://doi.org/10.1016/j.landurbplan.2011.02.021, 2011.
of resilience assessment and validation tool date should be Andersson, E,: Urban landscapes and sustainable cities, Ecol. Soc.,
highlighted to take the specific changes in land covers be- 11, 34, available at: http://www.ecologyandsociety.org/vol11/
tween the two periods of time into account. Further work will iss1/art34/ (last access: 22 March 2021), 2006.
use other methodologies for developing the flood resilience Anfuso, G., Martinez, J. A., and Nachite, D.: Coastal vulnerability
index in the same coastal area to provide further insights into in the Mediterranean sector between Fnideq and M’diq (North of
indicator assessments and the relationships among flood re- Morocco). Co Ren de l’Aca bulgare des Sci, Géophy. Géomo.,
silience and flood risk. 63, 561–570, 2010.
Angeon, V. and Bates, S.: reviewing composite vul-
nerability and resilience indexes: A sustainable ap-
Data availability. To get the data, the request is directed to the proach and application, World Dev., 72, 140–162,
“HCP – Haut-Commissariat Au Plan” https://www.hcp.ma/ (last ac- https://doi.org/10.1016/j.worlddev.2015.02.011, 2015.
cess: 22 March 2021) (HCP, 2021) via direct deposit upon presen- Asadzadeh, A., Kötter, T., Salehi, P., and Birkmann, J.: Op-
tation of the deposit receipt or by sending a request through http: erationalizing a concept: The systematic review of com-
//www.chafafiya.ma/demande.php (last access: 22 March 2021). posite indicator building for measuring community disas-
ter resilience, Int. J. Dis. Risk Reduct., 25, 147–162,
https://doi.org/10.1016/j.ijdrr.2017.09.015, 2017.
Bahir, M., Ouhamdouch, S., Ouazar, D., and El Moçayd, N.: Cli-
Author contributions. NS prepared the paper with contributions
mate change effect on groundwater characteristics within semi-
from all co-authors. NS and OR designed the study. OR carried
arid zones from western Morocco, Groundwater Sustain. Dev.,
out the computational experiments. NS investigated and visual-
11, 100380, https://doi.org/10.1016/j.gsd.2020.100380, 2020.
ized the results and developed the statistical analysis. NS wrote the
Barthel, P. A. and Planel, S.: Tanger-Med and Casa-Marina,
manuscript with support from NEM and OR. NEM added crucial
prestige projects in Morocco: new capitalist frame-
suggestions to the paper and contributed to the editing and revision
works and local context, Built Environ., 36, 176–191,
of the manuscript. IK and NK supervised the project. All authors
https://doi.org/10.2148/benv.36.2.176, 2010.
approved the final publication.
Bates, B. C., Kundzewicz, Z. W., Wu, S., and Palutikof, J. P. (Eds.):
Climate Change and Water, Technical Paper of the Intergov-
ernmental Panel on Climate Change, IPCC Secretariat, Geneva,
Competing interests. The authors declare that they have no conflict 210 pp., ISBN 978-92-9169-123-4, 2008.
of interest. Batica, J.: Methodology for flood resilience assessment in urban en-
vironments and mitigation strategy development, Diss. Univer-
sité Nice Sophia Antipolis, 2015.
Acknowledgements. The authors would like to thank the Office of Bertilsson, L., Wiklund, K., de Moura Tebaldi, I., Rezende,
the High Commission for Planning (HCP) and the Hydraulic Basin O. M., Veról, A. P., and Miguez, M. G.: Urban flood
Agency of Loukkos in Morocco for making their data available for resilience – A multi-criteria index to integrate flood re-
our study. We acknowledge the inputs from the reviewers (includ- silience into urban planning, J. Hydrol., 573, 970–982,
ing Jorge Leandro) and the editor as they have been very helpful https://doi.org/10.1016/j.jhydrol.2018.06.052, 2019.
in improving the quality of the present work. Special thanks are to Born, K., Fink, A. H., and Paeth, H.: Dry and wet periods in the
Mohamed Ben-Daoud, Mounir Ouzir, and Khalid Margaa for their northwestern Maghreb for present day and future climate condi-
meaningful insights provided. tions, Meteorol. Z., 17, 533–551, https://doi.org/10.1127/0941-
2948/2008/0313, 2008.
Cai, H., Lam, N. S., Qiang, Y., Zou, L., Correll, R. M., and
Mihunov, V.: A synthesis of disaster resilience measurement
Nat. Hazards Earth Syst. Sci., 21, 1101–1118, 2021 https://doi.org/10.5194/nhess-21-1101-2021N. Satour et al.: Spatialized flood resilience measurement in rapidly urbanized coastal areas 1115 methods and indices, Int. J. Disast. Risk Reduct., 31, 844–855, Disse, M., Johnson, T. G., Leandro, J., and Hartmann, https://doi.org/10.1016/j.ijdrr.2018.07.015, 2018. T.: Exploring the relation between flood risk manage- Cardoso, M. A., Brito, R. S., Pereira, C., Gonzalez, A.. Stevens, J., ment and flood resilience, Water Secur., 9, 100059, and Telhado, M. J.: RAF Resilience Assessment Framework – A https://doi.org/10.1016/j.wasec.2020.100059, 2020. Tool to Support Cities’ Action Planning, Sustainability, 12, 2349, Doocy, S., Daniels, A., Packer, C., Dick, A., and Kirsch, T. D.: The https://doi.org/10.3390/su12062349, 2020. human impact of earthquakes: a historical review of events 1980– Cariolet, J. M., Vuillet, M., and Diab, Y.: Mapping urban re- 2009 and systematic literature review, PLoS Currents, 5, ecur- silience to disasters – A review, Sustain. Cities Soc., 51, 101746, rents.dis.67bd14fe457f1db0b5433a8ee20fb833, 2013. https://doi.org/10.1016/j.scs.2019.101746, 2019. Driouech, F., Déqué, M., and Mokssit, A.: Numerical sim- Carpenter, S., Walker, B., Anderies, J. M., and Abel, N.: From ulation of the probability distribution function of pre- metaphor to measurement: resilience of what to what?, Ecosys- cipitation over Morocco, Clim. Dynam., 32, 1055–1063, tems, 4, 765–781, https://doi.org/10.1007/s10021-001-0045-9, https://doi.org/10.1007/s00382-008-0430-6, 2009. 2001. Driouech, F., Déqué, M., and Sánchez-Gómez, E.: Weather Chang, P. G. and Jeon, B. H.: The usage of traditional roof frame regimes – Moroccan precipitation link in a regional cli- and fire prevention design in the Deajojeon Complex reconstruc- mate change simulation, Global Planet. Change, 72, 1–10, tion in Changdeokgung during the period from 1917 to 1921, J. https://doi.org/10.1016/j.gloplacha.2010.03.004, 2010. Architect. Inst. Korea Plan. Design, 30, 153–164, 2014. Ducruet, C., Mohamed-Chérif, F., and Cherfaoui, N.: Maghreb port Chen, K. F. and Leandro, J.: A conceptual time-varying flood re- cities in transition: the case of Tangier, Portus Plus, available at: silience index for urban areas: Munich city, Water, 11, 830, http://www.reteonline.org (last access: 22 March 2021), 2011. https://doi.org/10.3390/w11040830, 2019. El Moçayd, N., Kang, S., and Eltahir, E. A. B.: Climate change Chen, N. and Graham, P.: Climate change as a survival strategy: soft impacts on the Water Highway project in Morocco, Hydrol. Earth infrastructure for urban resilience and adaptive capacity in Aus- Syst. Sci., 24, 1467–1483, https://doi.org/10.5194/hess-24-1467- tralia’s coastal zones, in: Resilient Cities, Springer, Dordrecht, 2020, 2020. 379–388, https://doi.org/10.1007/978-94-007-0785-6_38, 2011. Esty, D. C., Levy, M., Srebotnjak, T., and De Sherbinin, Chitsaz, N. and Banihabib, M. E.: Comparison of different multi A.: Environmental sustainability index: Benchmark- criteria decision-making models in prioritizing flood manage- ing national environmental stewardship, Yale Center ment alternatives, Water Resour. Manage., 29, 2503–2525, for Environmental Law & Policy, New Haven, 47–60, https://doi.org/10.1007/s11269-015-0954-6, 2015. https://doi.org/10.1017/S1355770X05002275, 2005. Cohen, R., Erez, K., Ben-Avraham, D., and Havlin, S.: Resilience Fisher, M., Abate, T., Lunduka, R. W., Asnake, W., Alemayehu, Y., of the internet to random breakdowns, Phys. Rev. Lett., 85, 4626, and Madulu, R. B.: Drought tolerant maize for farmer adapta- https://doi.org/10.1103/PhysRevLett.85.4626, 2000. tion to drought in sub-Saharan Africa: Determinants of adoption Colding, J. and Barthel, S.: The potential of ‘Urban Green Com- in eastern and southern Africa, Climatic Change, 133, 283–299, mons’ in the resilience building of cities, Ecolog. Econ., 86, 156– https://doi.org/10.1007/s10584-015-1459-2, 2015. 166, https://doi.org/10.1016/j.ecolecon.2012.10.016, 2013. Folke, C., Carpenter, S., Elmqvist, T., Gunderson, L., Holling, C. S., Conway, G.: The science of climate change in and Walker, B.: Resilience and sustainable development: build- Africa: impacts and adaptation, Grantham Insti- ing adaptive capacity in a world of transformations, Ambio, 31, tute for Climate Change Discussion Paper 1, avail- 437–440, https://doi.org/10.1579/0044-7447-31.5.437, 2002. able at: http://www.ask-force.org/web/Global-Warming/ Freudenberg, M.: Indicateurs composites de performances des pays: Convay-Science-Climate-Change-Africa-2008.pdf (last access: Examen critique, Documents de travail de l’OCDE sur la science, March 2021), 2009. la technologie et l’industrie, no. 2003/16, Éditions OCDE, Paris, CRED – Centre for Research on the Epidemiology of Dis- https://doi.org/10.1787/405566708255, 2003. asters: News letter, Crunch 56 – Disasters in Africa: Gaillard, J. C.: Vulnerability, capacity and resilience: perspectives 20 Year Review (2000–2019), available at: https://www.emdat. for climate and development policy, J. Int. Dev., 22, 218–232, be/publications (last access: 22 March 2021), 2019. https://doi.org/10.1002/jid.1675, 2010. Cretney, R.: Resilience for Whom? Emerging Critical Geographies Giorgi, F. and Lionello, P.: Climate change projections for the of Socio-ecological Resilience, Geogr. Compass, 8/9, 627–640, Mediterranean region, Global Planet. Change, 63, 90–104, https://doi.org/10.1111/gec3.12154, 2014. https://doi.org/10.1016/j.gloplacha.2007.09.005, 2008. Cutter, S. L., Barnes, L., Berry, M., Burton, C., Evans, E., Tate, Godschalk, D. R.: Urban hazard mitigation: creat- E., and Webb, J.: A place-based model for understanding com- ing resilient cities, Nat. Hazards Rev., 4, 136–143, munity resilience to natural disasters, Global Environ. Change, https://doi.org/10.1061/(ASCE)1527-6988(2003)4:3(136), 18, 598–606, https://doi.org/10.1016/j.gloenvcha.2008.07.013, 2003. 2008. Greco, S., Ishizaka, A., Tasiou, M., and Torrisi, G.: On the method- Cutter, S. L., Burton, C. G., and Emrich, C. T.: Disaster resilience ological framework of composite indices: A review of the issues indicators 517 for benchmarking baseline conditions, J. Home- of weighting, aggregation, and robustness, Social Indicat. Res., land Secur. Emerg. Manage., 7, 51, https://doi.org/10.2202/1547- 141, 61–94, https://doi.org/10.1007/s11205-017-1832-9, 2019. 7355.1732, 2010. HCP – Haut-Commissariat Au Plan: Monographie de la préfecture Cutter, S. L., Ash, K. D., and Emrich, C. T.: The geographies of de M’diq-Fnideq, Direction régionale de Tanger, Tétouan-al Ho- community disaster resilience. Global Environ. Change, 29, 65– ceima, Kingdoom of Morocco, 2018. 77, https://doi.org/10.1016/j.gloenvcha.2014.08.005, 2014. https://doi.org/10.5194/nhess-21-1101-2021 Nat. Hazards Earth Syst. Sci., 21, 1101–1118, 2021
You can also read