IP3 mediated global Ca2+ signals arise through two temporally and spatially distinct modes of Ca2+ release - eLife
←
→
Page content transcription
If your browser does not render page correctly, please read the page content below
RESEARCH ARTICLE

                                     IP3 mediated global Ca2+ signals arise
                                     through two temporally and spatially
                                     distinct modes of Ca2+ release
                                     Jeffrey T Lock1*, Ian Parker1,2
                                     1
                                         Department of Neurobiology & Behavior, UC Irvine, Irvine, United States;
                                     2
                                         Department of Physiology & Biophysics, UC Irvine, Irvine, United States

                                     Abstract The ‘building-block’ model of inositol trisphosphate (IP3)-mediated Ca2+ liberation
                                     posits that cell-wide cytosolic Ca2+ signals arise through coordinated activation of localized Ca2+
                                     puffs generated by stationary clusters of IP3 receptors (IP3Rs). Here, we revise this hypothesis,
                                     applying fluctuation analysis to resolve Ca2+ signals otherwise obscured during large Ca2+
                                     elevations. We find the rising phase of global Ca2+ signals is punctuated by a flurry of puffs, which
                                     terminate before the peak by a mechanism involving partial ER Ca2+ depletion. The continuing rise
                                     in Ca2+, and persistence of global signals even when puffs are absent, reveal a second mode of
                                     spatiotemporally diffuse Ca2+ signaling. Puffs make only small, transient contributions to global
                                     Ca2+ signals, which are sustained by diffuse release of Ca2+ through a functionally distinct process.
                                     These two modes of IP3-mediated Ca2+ liberation have important implications for downstream
                                     signaling, imparting spatial and kinetic specificity to Ca2+-dependent effector functions and Ca2+
                                     transport.

*For correspondence:
                                     Introduction
                                     Cytosolic Ca2+ signals generated by the liberation of Ca2+ ions sequestered in the endoplasmic
lockj@uci.edu
                                     reticulum (ER) through inositol trisphosphate receptor (IP3R) channels regulate ubiquitous cellular
Competing interests: The             processes as diverse as gene transcription, secretion, mitochondrial energetics, electrical excitability
authors declare that no              and fertilization (Clapham, 2007; Berridge et al., 2000). Cells achieve such unique repertories of
competing interests exist.
                                     Ca2+-dependent functions by generating a hierarchy of cytosolic Ca2+ signals with markedly different
Funding: See page 22                 spatial scales and temporal durations, ranging from brief, localized Ca2+ transients called puffs
Received: 09 January 2020            (Parker and Yao, 1991; Yao et al., 1995) to larger and more prolonged Ca2+ elevations that engulf
Accepted: 12 May 2020                the cell. Global elevations in cytosolic Ca2+ typically last several seconds and may appear as waves
Published: 12 May 2020               that propagate throughout the cell (Woods et al., 1986). They can recur as oscillations with periods
                                     between a few seconds and a few minutes, and are thought to encode information in a ‘digital’ man-
Reviewing editor: Kenton J
                                     ner, whereby increasing stimulus strength results predominantly in an increase in frequency rather
Swartz, National Institute of
                                     than amplitude (Parekh, 2011; Smedler and Uhlén, 2014). Puffs, on the other hand, are tightly
Neurological Disorders and
Stroke, National Institutes of
                                     localized elevations in cytosolic Ca2+ generated by stationary clusters containing small numbers of
Health, United States                IP3Rs, which last only tens or a few hundreds of milliseconds and remain restricted within a few
                                     micrometers (Bootman et al., 1997a; Parker et al., 1996).
   Copyright Lock and Parker.
                                        The patterning of cellular Ca2+ signals evoked by IP3 is largely determined by the functional prop-
This article is distributed under
                                     erties of the IP3Rs and by their spatial arrangement in the ER membrane. Crucially, the opening of
the terms of the Creative
Commons Attribution License,         IP3R channels is regulated by cytosolic Ca2+ itself, in addition to IP3. Low concentrations of Ca2+
which permits unrestricted use       increase the open probability of the channel whereas high concentrations favor a closed state
and redistribution provided that     (Parker and Ivorra, 1990; Iino, 1990; Bezprozvanny et al., 1991). This biphasic modulation of
the original author and source are   IP3Rs by Ca2+ leads to the phenomenon of Ca2+-induced Ca2+ release (CICR). Ca2+ diffusing from
credited.                            one open channel may thus trigger the opening of adjacent channels, with self-reinforcing CICR

Lock and Parker. eLife 2020;9:e55008. DOI: https://doi.org/10.7554/eLife.55008                                                        1 of 26
Research article                                                           Cell Biology Structural Biology and Molecular Biophysics

                                   countered by Ca2+ feedback inhibition. The clustered distribution of IP3Rs further shapes the extent
                                   of this regenerative process. CICR may remain locally restricted to a single cluster, containing from a
                                   few to a few tens of functional IP3Rs, to produce a puff; whereas it is proposed that a global
                                   response is generated by successive cycles of CICR and Ca2+ diffusion acting over longer spatial
                                   ranges to recruit successive puff sites (Bootman et al., 1997a; Parker et al., 1996; Berridge, 1997;
                                   Bootman and Berridge, 1996; Callamaras et al., 1998; Dawson et al., 1999; Marchant, 2001;
                                   Marchant et al., 1999). However, the transition between these modes remains an area of active
                                   investigation (Rückl and Rüdiger, 2016; Miyamoto and Mikoshiba, 2019; Sneyd et al., 2017a;
                                   Sneyd et al., 2017b; Rückl et al., 2015), and recent theoretical simulations have questioned
                                   whether Ca2+ released through puff activity is alone sufficient to propagate global cytosolic Ca2+
                                   signals (Piegari et al., 2019).
                                       Here, we examined the nature of Ca2+ liberation through IP3Rs during global cellular Ca2+ signals,
                                   asking whether this accords with the widely-accepted ‘building block’ model (Bootman et al.,
                                   1997a; Parker et al., 1996; Berridge, 1997; Bootman and Berridge, 1996; Marchant, 2001;
                                   Marchant et al., 1999; Mataragka and Taylor, 2018) in which global signals are constructed by the
                                   summation of coordinated, pulsatile activation of Ca2+ release at puff sites; or whether global signals
                                   also involve an additional mode of Ca2+ liberation that is more homogeneous in space and time.
                                   Although Ca2+ puffs are often evident during the initial rising phase of global Ca2+ signals
                                   (Bootman et al., 1997a; Bootman and Berridge, 1996; Marchant, 2001; Marchant et al., 1999), a
                                   challenge in answering this question arises because puffs become obscured as the overall cytosolic
                                   Ca2+ level continues to increase. To reveal and monitor temporally rapid and spatially confined Ca2+
                                   transients (puffs) during even large amplitude global Ca2+ elevations we developed image process-
                                   ing and analysis routines to analyze local fluctuations in Ca2+ fluorescence signals (Ellefsen et al.,
                                   2019). We applied these routines to Ca2+ recordings obtained both by total internal reflection fluo-
                                   rescence (TIRF) microscopy to resolve signals arising near the plasma membrane, and by lattice
                                   light-sheet (LLS) microscopy to acquire optical sections through the cell interior. We find that rapid
                                   flurries of Ca2+ puffs accompany the rising phase of global Ca2+ signals evoked by photoreleased
                                   IP3 and by agonist stimulation of the IP3 signaling pathway, but these rapidly terminate before the
                                   peak of the response through a mechanism regulated by ER Ca2+ store content. The punctate libera-
                                   tion of Ca2+ via transient, localized Ca2+ puffs contributes only a small fraction of the total Ca2+ lib-
                                   erated during global Ca2+ signals, which are instead sustained by diffuse Ca2+ liberation through a
                                   functionally distinct mode of release. These two modes of IP3-mediated Ca2+ release will likely selec-
                                   tively activate different populations of effectors; those positioned close to the IP3R clusters that
                                   mediate puffs and which respond to brief, repetitive transients of [Ca2+], and others that respond to
                                   a more sustained, spatially diffuse elevation of bulk cytosolic [Ca2+].

                                   Results
                                   Fluctuation processing of Ca2+ images highlights transient signals
                                   Our central question was whether IP3-evoked Ca2+ liberation during cell-wide Ca2+ signals arises
                                   through coordinated activation of pulsatile, spatially -localized events, analogous to the local Ca2+
                                   puffs observed with weaker IP3 stimulation or after loading cells with EGTA to suppress global sig-
                                   nals (Dargan and Parker, 2003; Smith et al., 2009). To better visualize and identify transient, local-
                                   ized Ca2+ events occurring during the course of larger, global elevations of Ca2+, we developed an
                                   image processing algorithm to highlight and quantify temporal fluctuations of the Ca2+ fluorescence
                                   signal. We previously described the use of pixel-by-pixel power spectrum analysis of temporal Ca2+
                                   fluctuations for this purpose (Swaminathan et al., 2020), but this is computationally intensive and
                                   unfeasible for large data sets. Here, we adopted a faster approximation, by first temporally band-
                                   pass filtering image stacks and then calculating the standard deviation (SD) of the fluorescence fluc-
                                   tuations at each pixel over a running time window (Ellefsen et al., 2019).
                                      The conceptual basis of the algorithm is illustrated in Figure 1 (see also Figure 1—video 1). WT
                                   HEK293 cells were loaded with the fluorescent Ca2+ indicator Cal520 and imaged by TIRF micros-
                                   copy during global cytosolic Ca2+ signals. The panels in Figure 1A show Cal520 fluorescence of indi-
                                   vidual image frames of a HEK cell captured before (i) and after (ii-v) photorelease of i-IP3, an active,
                                   metabolically stable analog of IP3. Photoreleased i-IP3 evoked a widespread increase in fluorescence

Lock and Parker. eLife 2020;9:e55008. DOI: https://doi.org/10.7554/eLife.55008                                                         2 of 26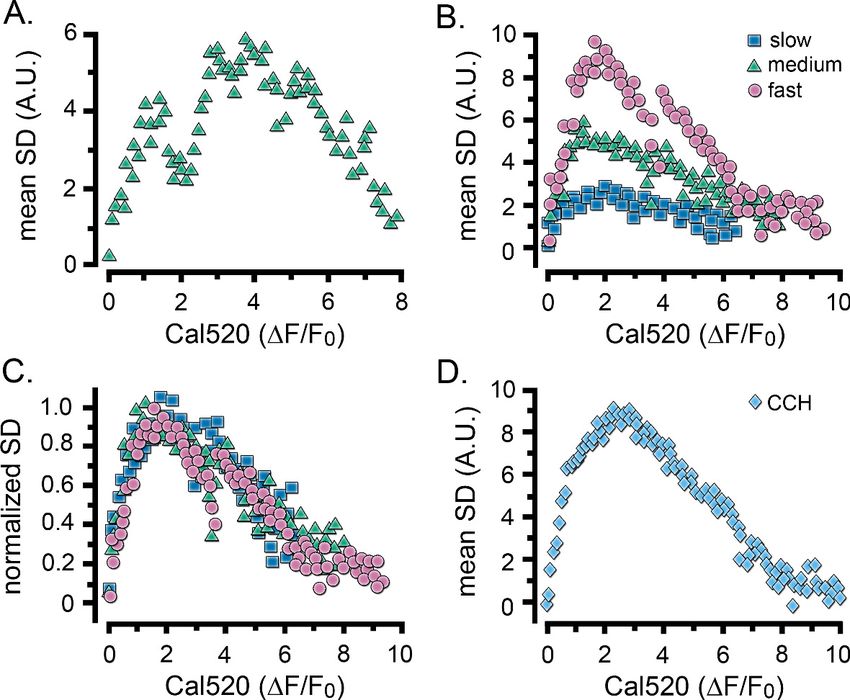
Research article                                                                     Cell Biology Structural Biology and Molecular Biophysics

Figure 1. Fluctuation analysis of Ca2+ signals. (A–D) Records from a single WT HEK cell loaded with Cal520 and stimulated by photorelease of i-IP3 to
evoke a global Ca2+ elevation. (A) Panels show ‘raw’ TIRF fluorescence images of the cell before (i), during the rising phase (ii-iv) and at the peak (v) of
the global Ca2+ signal. Images are Gaussian-blurred (sigma ~1 mm) single frames (8 ms exposure time) captured at times as marked in C. Grey scale
intensities depict fluorescence in arbitrary camera units, as indicated by the bar at the right. The yellow outline marks the TIRF footprint of the cell. (B)
Figure 1 continued on next page

Lock and Parker. eLife 2020;9:e55008. DOI: https://doi.org/10.7554/eLife.55008                                                                         3 of 26
Research article                                                                    Cell Biology Structural Biology and Molecular Biophysics

Figure 1 continued
Panels show corresponding standard deviation (SD) images at the same times as in A, highlighting hot spots of local, transient Ca2+ release. Grey scale
intensities (arbitrary units; A.U.) represent the shot noise-corrected standard deviation of fluorescence fluctuations within a 160 ms running time window.
(C) Overlaid black traces show fluorescence monitored from 24 regions of interest (ROIs; marked by squares in panel Ai) placed on areas of local Ca2+
activity. The arrow indicates the time of the photolysis flash. (D) Power spectra of Ca2+ fluorescence fluctuations averaged from the 24 ROIs at baseline
(blue trace) and during the rising phase of the global Ca2+ signal (red trace). Spectra were calculated from recordings during the respective times
indicated by the colored bars in C, after low-pass (1 Hz) filtering of the fluorescence image stack to strip out the slow rise of the global signal. (E)
Overlaid traces show shot noise-corrected SD signals from the 24 ROIs centered on hot spots of Ca2+ activity. The thicker yellow trace shows the mean
SD signal monitored from a ROI encompassing the entire cell and is depicted after scaling up by a factor of 10 relative to the traces from small ROIs.
(F–I) Corresponding images and plots from an HEK cell devoid of IP3Rs (3KO) in which a global Ca2+ elevation was evoked by pipetting a 10 ml aliquot
of ionomycin into the bathing solution at a distance from the cell when marked by the arrow in H. In this case no hot spots or increased low-frequency
fluctuations accompanied the elevation in cytosolic [Ca2+], and the ROIs (marked by squares in panel Fi) used to derive the data in H-J were placed
randomly. The yellow trace in J depicting the mean SD signal from the entire cell is scaled up by a factor of 10 relative to the traces from small ROIs.
Fluorescence and SD magnitudes are expressed in arbitrary units consistent with those in A-D.
The online version of this article includes the following video and figure supplement(s) for figure 1:
Figure supplement 1. Optimization of space-time parameters used in SD fluctuation analysis algorithm.
Figure supplement 2. Correction of signal variance for photon shot noise.
Figure supplement 3. Spatial fluctuation analysis of IP3-mediated global Ca2+ signals mirrors temporal fluctuations.
Figure 1—video 1. Fluctuation processing of Ca2+ image recordings.
https://elifesciences.org/articles/55008#fig1video1

                                     throughout the cell that peaked within about 5 s, during which time several transient, local ‘hot
                                     spots’ were evident. These are visible in Figure 1—video 1 but are not readily apparent in
                                     Figure 1A because of the extended grey scale required to encompass the peak global fluorescence
                                     signal. To illustrate the activity at local hot spots, we monitored fluorescence from regions of interest
                                     (ROIs) centered on 24 sites (Figure 1C). Traces from these sites showed progressive, large fluores-
                                     cence increases above the baseline, with small, superimposed transients (puffs) during the rising
                                     phase. To better discriminate these localized signals, we high-pass (1 Hz) filtered the image stack,
                                     pixel-by-pixel, to strip out the slow increase in global fluorescence. Figure 1D shows mean power
                                     spectra averaged from the 24 sites during image sequences (5 s) acquired before (control; blue
                                     trace) and immediately following (red trace) photorelease of i-IP3. The control, baseline spectrum
                                     showed substantially uniform power across all frequencies above the applied 1 Hz high-pass filter,
                                     compatible with the dominant noise source arising from ‘white’ photon shot noise. Strikingly, the
                                     spectrum obtained during the rise of the global Ca2+ signal showed much greater power at frequen-
                                     cies between about 1–20 Hz as compared to the control spectrum, rolling off at higher frequencies
                                     to a noise floor determined by photon shot noise. We thus developed an approach to isolate the
                                     low-frequency fluctuations attributable to transient Ca2+ puffs, while subtracting the photon shot
                                     noise that would arise in linear proportion to the overall fluorescence intensity.
                                         Beginning with a black level-subtracted ‘raw’ fluorescence image stack, our algorithm applied a
                                     spatial filter (Gaussian blur with sigma ~1 mm), and a band-pass temporal Butterworth filter (3–20
                                     Hz). The resulting image stack was then processed by a running boxcar window (160 ms) that, for
                                     each pixel, calculated the standard deviation (SD) of the fluorescence signal at that pixel throughout
                                     the duration of the window. These parameters were chosen to optimally ‘tune’ the algorithm to
                                     reject slow changes in baseline fluorescence and attenuate high-frequency photon shot noise while
                                     retaining frequencies resulting from puff activity (Figure 1—figure supplement 1). Lastly, the algo-
                                     rithm corrected for photon shot noise by subtracting a scaled measure of the square root of fluores-
                                     cence intensity at each pixel. If measurements were in terms of numbers of detected photons, the
                                     SD would equal the square root of the intensity; however, that was not the case for our records
                                     because of considerations including the camera conversion factor and the filtering applied to the
                                     image stack. We thus empirically determined an appropriate scaling factor, by determining the linear
                                     slope of a plot of mean variance vs. mean fluorescence emission from a sample of fluorescein where
                                     photon shot noise was expected to be the major noise source (Figure 1—figure supplement 2).
                                         Figure 1B presents representative SD images calculated by the algorithm, at time points corre-
                                     sponding to the panels in Figure 1A, and Figure 1—video 1 shows fluorescence and SD images
                                     throughout the response. The SD signal was uniformly close to zero throughout the cell before

Lock and Parker. eLife 2020;9:e55008. DOI: https://doi.org/10.7554/eLife.55008                                                                     4 of 26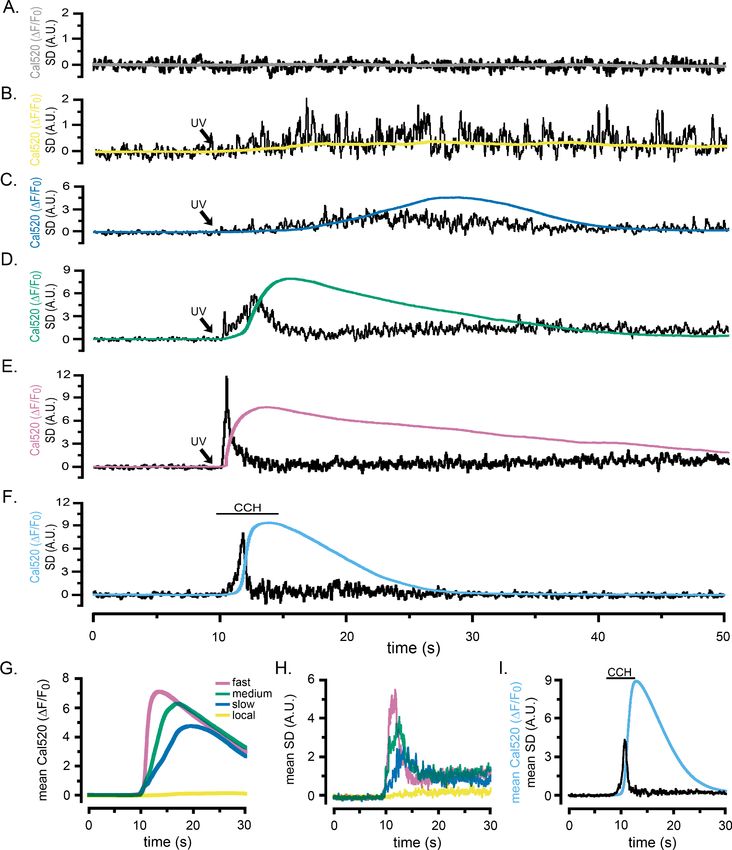
Research article                                                           Cell Biology Structural Biology and Molecular Biophysics

                                   stimulation (Figure 1B, panel i), while discrete, transient hot spots were clearly evident at several dif-
                                   ferent sites during the rising phase of the global Ca2+ elevation (panels ii-iv), but ceased at the time
                                   of the peak response (panel v). This behavior is further illustrated by the black traces in Figure 1E,
                                   showing overlaid SD measurements from the 24 hot spots of activity. A flurry of transient events at
                                   these sites peaked during the rising phase of the global Ca2+ response to photoreleased i-IP3 but
                                   had largely subsided by the time of the maximal global Ca2+ elevation. Even though the global Ca2+
                                   level then stayed elevated for many seconds the mean SD signals at these regions remained low.
                                   Measurement of the SD signal derived from a ROI encompassing the entire cell (yellow trace,
                                   Figure 1E) closely tracked the aggregate kinetics of the individual puff sites.
                                      To further validate the fluctuation analysis algorithm, we examined a situation where cytosolic
                                   [Ca2+] was expected to rise in a smoothly graded manner, without overt temporal fluctuations or
                                   spatial heterogeneities. For this, we imaged Cal520 fluorescence by TIRF microscopy in HEK293
                                   3KO cells in which all IP3R isoforms were knocked out (Alzayady et al., 2016). We pipetted an ali-
                                   quot of ionomycin (10 ml of 10 mM) into the 2.5 ml volume of Ca2+-free bathing solution at a distance
                                   from the cell chosen so that the diffusion of ionomycin evoked a slow liberation of Ca2+ from intra-
                                   cellular stores to give a fluorescence signal of similar amplitude (8.3 DF/F0) and kinetics to that
                                   evoked by photoreleased i-IP3 (6.9 DF/F0) in Figure 1A,C. Figure 1F shows snapshots of ‘raw’ fluo-
                                   rescence captured before (i) and during (ii-v) application of ionomycin. The fluorescence rose uni-
                                   formly throughout the cell without any evident hot spots of local transients in the SD images
                                   (Figure 1G and Figure 1—video 1). Measurements from 24 randomly located ROIs (squares in
                                   Figure 1F) showed only smooth rises in fluorescence (Figure 1H). Mean spectra from these regions
                                   (Figure 1I) displayed flat, substantially uniform distributions of power across all frequencies, consis-
                                   tent with photon shot noise increasing in proportion to the mean fluorescence level. Notably, SD sig-
                                   nals from local ROIs (Figure 1J, superimposed black traces) and from a ROI encompassing the
                                   entire cell (yellow trace) showed no increase in fluctuations beyond that expected for photon shot
                                   noise.

                                   Temporal fluctuations reflect spatially localized Ca2+ signals
                                   The SD image stacks generated by the temporal fluctuation algorithm showed transient hot spots of
                                   Ca2+ release associated with temporal fluctuations. However, the SD signal could also include tem-
                                   poral fluctuations in fluorescence that were spatially blurred or uniform across the cell. To determine
                                   whether these contribute appreciably, or whether the SD signal could be taken as a good reporter
                                   of localized puff activity, we developed a second algorithm to reveal spatial Ca2+ variations in
                                   Cal520 fluorescence image stacks (Figure 1—figure supplement 3).
                                       Ca2+ image stacks were first temporally bandpass filtered as described above. The algorithm
                                   then calculated, frame by frame, the difference between strong and weak Gaussian blur functions
                                   (respective standard deviations of about 4 and 1 mm at the specimen), essentially acting as a spatial
                                   bandpass filter to attenuate high spatial frequencies caused by pixel-to-pixel shot noise variations
                                   and low-frequency variations resulting from the spread of Ca2+ waves across the cell, while retaining
                                   spatial frequencies corresponding to the spread of local Ca2+ puffs. The resulting spatial SD images
                                   were remarkably similar to images generated by the temporal fluctuation analysis routine (Figure 1—
                                   figure supplement 3A), and traces of mean cell-wide temporal and spatial SD signals during Ca2+
                                   elevations matched closely (Figure 1—figure supplement 3B–E). We thus conclude that the tempo-
                                   ral SD signals faithfully reflect transient, localized Ca2+ puff activity while minimizing confounding
                                   contributions from shot noise and slower changes in global fluorescence.

                                   Fluctuation analysis reveals a transient flurry of puffs during global
                                   Ca2+ signals
                                   In Figure 1, we show traces from discrete subcellular regions to illustrate how temporal SD images
                                   detect transient, local Ca2+ elevations while being insensitive to homogeneous global Ca2+ eleva-
                                   tions. However, for all the following experiments in this paper we show SD signals derived from sin-
                                   gle ROIs that completely encompassed each cell, so as to obtain an aggregate measure of puff
                                   activity throughout the cell and obviate any subjective bias that might arise in selecting smaller, sub-
                                   cellular regions. Unless otherwise stated, all imaging was done by TIRF microscopy with cells bathed

Lock and Parker. eLife 2020;9:e55008. DOI: https://doi.org/10.7554/eLife.55008                                                         5 of 26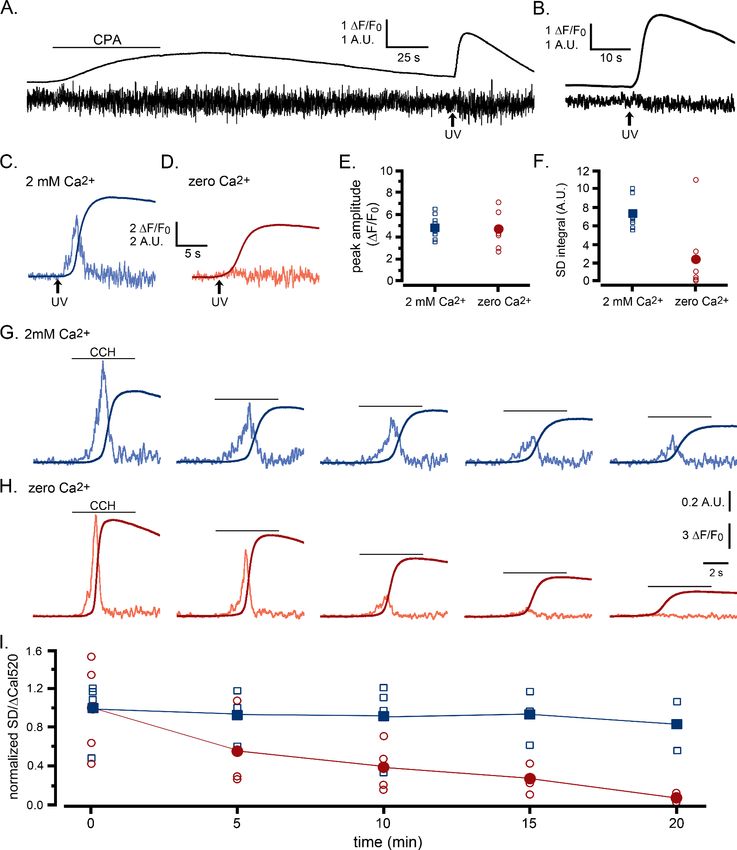
Research article                                                           Cell Biology Structural Biology and Molecular Biophysics

                                   in a zero Ca2+ solution including 300 mM EGTA to avoid possible complication from entry of extra-
                                   cellular Ca2+ into the cytosol.
                                       Figure 2 and Figure 2—videos 1 and 2 present records from WT HEK cells loaded with Cal520
                                   and caged i-IP3 showing how the SD signal reveals the patterns of puff activity underlying global
                                   Ca2+ signals. Under basal conditions, the shot noise-corrected cell-wide SD signals were almost flat,
                                   with a mean around zero (Figure 2A, Figure 2—video 1), indicating a negligible level of local Ca2+
                                   activity at rest. Photorelease of small amounts of i-IP3 by brief (~100 ms) UV flashes evoked Ca2+
                                   puffs - directly visible in the Cal520 fluorescence ratio movie in Figure 2—video 1, and more evident
                                   as sharp transients in the whole-cell SD trace - but without generating any appreciable global rise in
                                   basal Ca2+ (Figure 2B). Longer flashes (200–1000 ms) generated whole-cell elevations in cytosolic
                                   Ca2+ that rose and fell over several seconds, with fluorescence signals reaching peak amplitudes in
                                   rough proportion to the flash duration (smooth traces, Figure 2C–E; Figure 2—video 2). SD movies
                                   (Figure 2—video 2) and whole-cell SD traces (noisy traces, Figure 2C–E) revealed an underlying
                                   flurry of localized, transient Ca2+ events during the rising phase of the global Ca2+ responses. In
                                   instances where global Ca2+ signals were small and slowly rising, the SD traces showed Ca2+ transi-
                                   ents persisting throughout the prolonged rising phase (Figure 2C). On the other hand, the SD traces
                                   from cells exhibiting intermediate (Figure 2D) and fast rising (Figure 2E) global signals revealed
                                   Ca2+ fluctuations that began almost immediately following photorelease of i-IP3, reached a maxi-
                                   mum during the rising phase of the global signal, but then declined almost to baseline by the peak
                                   of the response.
                                       The records in Figure 2A–E and Figure 2—videos 1 and 2 illustrate representative responses in
                                   individual cells. To pool data from multiple cells we grouped records into categories matching the
                                   examples in Figure 2B–E: that is responses showing puffs without an appreciable elevation of global
                                   Ca2+; and slow-, intermediate- and fast- rising global Ca2+ responses. Figure 2G shows overlaid
                                   traces depicting the mean Cal520 fluorescence ratios (DF/F0) of the global Ca2+ responses from cells
                                   in these different categories, and Figure 2H shows the associated mean SD traces. Notably, in all
                                   three categories where global Ca2+ signals were evoked (Figure 2C–E) the mean SD signals were
                                   transient, indicating that puff activity was largely confined to the rising phase of the global Ca2+ ele-
                                   vation and largely ceased by the time the global signal reached a maximum. The durations of the
                                   puff flurries progressively shortened with increasing rates of rise in global Ca2+ and the magnitudes
                                   of the SD signal at the peak of the flurry activity increased.

                                   Ca2+ signals evoked by agonist activation and photoreleased i-IP3 show
                                   similar patterns of puff activity
                                   UV photorelease of i-IP3 provides a convenient tool to activate IP3Rs with precise timing and control
                                   of the amount released. However, this IP3 analog is slowly metabolized by the cell, remaining ele-
                                   vated for minutes following photo-uncaging (Smith et al., 2009; Dakin and Li, 2007), and its uni-
                                   form release throughout the cell differs from endogenous generation of IP3 at the cell membrane
                                   (Keebler and Taylor, 2017; Lock et al., 2017). We thus compared responses evoked by photore-
                                   leased i-IP3 with those activated by the G-protein coupled muscarinic receptor agonist carbachol
                                   (CCH), locally applied through a picospritzer-driven micropipette (puffer pipet) positioned above
                                   WT HEK cells bathed in zero Ca2+ medium. A brief (5 s) pulse of CCH elicited a rapid, global rise in
                                   Ca2+ that was accompanied by an underlying burst of local Ca2+ signals (Figure 2F; Figure 2—video
                                   3). As with responses evoked by photoreleased i-IP3, fluctuations arising from local Ca2+ signals
                                   occurred predominantly during the initial portion of the rising phase and then subsided to near basal
                                   levels before the peak of the global response. Figure 2I shows mean traces of whole-cell global
                                   Ca2+ signals (DF/F0) and SD signals of CCH-evoked responses from 12 cells. Peak fluorescence
                                   amplitudes were similar to mean values for 11 cells stimulated by strong photorelease of i-IP3 (DF/F0
                                   of 8.89 ± 0.3 for CCH vs. 7.27 ± 0.4 for i-IP3); as were the rising phase kinetics of the global Ca2+ sig-
                                   nal (rise from 20% to 80% of peak 0.70 s ± 0.05 s for CCH vs. 0.80 s ± 0.06 s for i-IP3). However,
                                   global Ca2+ elevations evoked by CCH decayed more rapidly than those evoked by i-IP3 (fall from
                                   80% to 20% of peak 6.33 s ± 0.3 s for CCH vs 20.05 s ± 3.2 s for i-IP3) - likely because the slowly-
                                   degraded i-IP3 evoked a more sustained release of Ca2+.

Lock and Parker. eLife 2020;9:e55008. DOI: https://doi.org/10.7554/eLife.55008                                                         6 of 26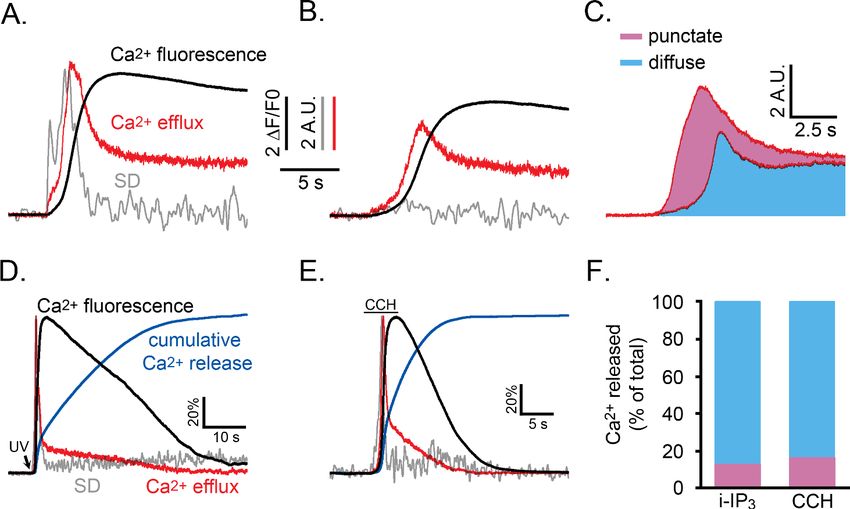
Research article                                                                    Cell Biology Structural Biology and Molecular Biophysics

Figure 2. Localized fluctuations in cytosolic [Ca2+] occur predominantly during the rising phase of global Ca2+ elevations. Representative records show
the Cal520 fluorescence ratio (DF/F0; smooth traces) and the associated SD fluctuation measurements (noisy traces) from ROIs encompassing single WT
HEK cells bathed in Ca2+-free medium. (A) Record obtained under basal conditions without stimulation. (B–E) Responses evoked by progressively
longer photolysis flashes to release increasing amounts of i-IP3 in cells loaded with caged i-IP3. The SD signals are presented in arbitrary units (A.U.) but
are consistent throughout all panels. To better display responses to weaker stimuli, the y-axes are scaled differently between panels. (F) Responses
evoked by application of carbachol (CCH; 10 mM) when indicated by the bar. (G, H) Pooled data plotting, respectively, means of the global Ca2+
fluorescence signals and SD signals of cells stimulated with progressively increasing photorelease of i-IP3 to evoke predominantly local Ca2+ signals
(yellow traces; n = 7), and global elevations with slow (blue; n = 9), medium (green; n = 13), and fast rising Ca2+ signals (pink; n = 11). (I) Mean Cal520
Figure 2 continued on next page

Lock and Parker. eLife 2020;9:e55008. DOI: https://doi.org/10.7554/eLife.55008                                                                        7 of 26
Research article                                                                 Cell Biology Structural Biology and Molecular Biophysics

Figure 2 continued
fluorescence ratio signal (cyan trace) and SD signal (black trace) averaged from 12 cells stimulated by local application of 10 mM CCH when marked by
the bar.
The online version of this article includes the following video(s) for figure 2:
Figure 2—video 1. Detection of local Ca2+ puffs by fluctuation analysis.
https://elifesciences.org/articles/55008#fig2video1
Figure 2—video 2. Ca2+ fluctuations during global Ca2+ elevations evoked by increasing photorelease of i-IP3.
https://elifesciences.org/articles/55008#fig2video2
Figure 2—video 3. Ca2+ fluctuations during a carbachol evoked global Ca2+ signal.
https://elifesciences.org/articles/55008#fig2video3

                                    Ca2+ puff activity terminates during the rising phase of global Ca2+
                                    signals
                                    Puff activity (SD signal) showed a characteristic rise and fall during the rising phase of global Ca2+
                                    signals, and both parameters accelerated with increasing photorelease of i-IP3 (Figure 2). To investi-
                                    gate the relationship between the bulk Ca2+ level and puff activity in a time-independent manner,
                                    we took paired measurements of cell-wide SD signals and Ca2+ level (DF/F0) at intervals during the
                                    rising phase of IP3-evoked Ca2+ elevations. Figure 3A shows a scatter plot of SD vs. DF/F0 values for
                                    measurements from the cell in Figure 2D, and Figure 3B plots corresponding mean data pooled
                                    from groups of cells that gave i-IP3-evoked global signals with fast (pink circles), intermediate (green
                                    triangles) and slow (blue squares) rising phases. Although the amplitudes of the SD signals were
                                    greater for the faster rising responses, all cells showed similar ‘inverted U’ shaped relationships. In
                                    all three groups, the SD signal was maximal when the Cal520 fluorescence ratio reached a DF/F0
                                    value of about two and then declined progressively as global Ca2+ rose higher. This is illustrated
                                    more clearly in Figure 3C, where the curves for the three groups of cells superimpose closely after
                                    normalization to the same peak SD level. A closely similar inverted U relationship was observed for
                                    Ca2+ elevations evoked by CCH (Figure 3D).
                                        The decline in SD signal at higher Ca2+ levels during global signals cannot be attributed to a fail-
                                    ure of our algorithm to detect local fluctuations because of saturation of the Cal520 indicator dye.
                                    Notably, maximal fluorescence responses evoked by addition of ionomycin in high (10 mM) Ca2+-
                                    containing medium (DF/F0 of 18.93 ± 1.5; n = 32 cells) considerably exceeded the peak fluorescence
                                    level evoked by even strong photorelease of i-IP3 (mean DF/F07.27 ± 0.4, n = 11 cells), and were
                                    greatly in excess of the fluorescence level (DF/F0 ~2; Figure 3) at which the SD signal began to
                                    decline. Moreover, we observed instances of local Ca2+ signals even during large global Ca2+ eleva-
                                    tions (DF/F0 >8; Figure 3—figure supplement 1), and obtained SD signals using the lower affinity
                                    indicator fluo8L (Kd 1.86 mM vs. 320 nM for Cal520) confirming that puff activity was similarly sup-
                                    pressed prior to the peak of i-IP3 evoked Ca (Berridge et al., 2000) elevations (Figure 3—figure
                                    supplement 2).

                                    Ca2+ puffs are independent of extracellular Ca2+
                                    We performed the experiments in Figures 1–3 using a bathing solution containing no added Ca2+
                                    together with 300 mM EGTA to specifically monitor the release of Ca2+ from intracellular stores with-
                                    out possible confounding signals arising from entry of Ca2+ across the plasma membrane. To
                                    explore whether these results were representative of responses in more physiological conditions, we
                                    examined Ca2+ signals evoked by photoreleased i-IP3 in WT HEK cells bathed in solutions containing
                                    2 mM Ca2+ (Figure 3—figure supplement 3). Cell-wide Ca2+ responses and flurries of local Ca2+
                                    signals closely matched the patterns of activity in cells imaged in the absence of extracellular Ca2+
                                    (Figure 3—figure supplement 3B–G), and scatter plots of SD signal vs. global Ca2+ fluorescence
                                    signal (Figure 3—figure supplement 3H,I) mirrored those in the absence of extracellular Ca2+ (Fig-
                                    ure 3). Thus, the puff activity during IP3-evoked global Ca2+ elevations appears independent of Ca2+
                                    influx into the cell. However, global Ca2+ responses decayed more slowly when Ca2+ was included in
                                    the bath solution (fall80-20 for strong photoreleased i-IP3 of 35.87 s ± 3.9 s in 2 mM Ca2+ vs. 20.05
                                    s ± 3.2 s in zero Ca2+; Fall80-20 for CCH of 13.06 s ± 0.5 s in 2 mM Ca2+ vs 6.33 s ± 0.3 in zero Ca2+).

Lock and Parker. eLife 2020;9:e55008. DOI: https://doi.org/10.7554/eLife.55008                                                                 8 of 26
Research article Cell Biology Structural Biology and Molecular Biophysics
Figure 3. Relationship between Ca2+ fluctuations and Ca2+ level during the rise of global Ca2+ signals. Scatter
plots show measurements of the SD signal at intervals during the rising phase of global Ca2+ response against the
magnitude of the global Ca2+ elevation (DF/F0) at that time. Data were binned at intervals of (0.1 DF/F0). (A)
Measurements from the same cell as in Figure 2D. (B) Data from the same groups of cells as in Figure 2G,H,
plotting mean SD signal amplitude as a function of mean Ca2+ level during global responses for cells exhibiting
slow (blue squares), intermediate (green triangles) and fast rising responses (pink circles). (C) The same data as in
B, after normalizing to the respective maximum SD signals for each group of cells. (D) Scatter plot of mean SD
signal amplitude as a function of Ca2+ level during global responses for 12 cells stimulated by local application of
CCH, as in Figure 2I.
The online version of this article includes the following figure supplement(s) for figure 3:
Figure supplement 1. Fluctuation image analysis resolves Ca2+ puffs at peak elevations in global Ca2+ signals.
Figure supplement 2. Temporal fluctuations in cytosolic [Ca2+] during global Ca2+ elevations in HEK cells
monitored with the low affinity Ca2+ indicator fluo8L.
Figure supplement 3. Temporal fluctuations in cytosolic [Ca2+] during cell-wide Ca2+ signals evoked by
photoreleased of i-IP3 in HEK cells bathed in medium including 2 mM Ca2+.
Figure supplement 4. Patterns of Ca2+ liberation during global Ca2+ signals are substantially unaffected by
depolarization of mitochondria and lysosomes with FCCP.
A likely explanation is that influx through slowly activating store-operated channels prolongs the
response when extracellular Ca2+ is present.
Patterns of Ca2+ release are largely unaffected by inhibition of
mitochondrial and lysosomal Ca2+ uptake
Mitochondria and lysosomes help shape intercellular Ca2+ dynamics by accumulating and releasing
Ca2+ (Rizzuto et al., 2012; Mammucari et al., 2018; Morgan et al., 2011; Yang et al., 2019). To
examine whether activity of these organelles influenced the spatial-temporal occurrence of puffs dur-
ing IP3-evoked global Ca2+ signals, we treated WT HEK cells for 10 min with FCCP to inhibit mito-
chondrial (Stout et al., 1998; Jensen and Rehder, 1991) and lysosomal (Churchill et al., 2002)
Ca2+ uptake by dissipating the proton gradient necessary for Ca2+ flux. (Figure 3—figure supple-
ment 4A,B). Mean traces of whole-cell Ca2+ fluorescence (DF/F0) and associated SD fluctuations in
FCCP-treated cells stimulated with CCH exhibited local and global Ca2+ signals similar to vehicle-
treated controls, although with slightly smaller peak magnitudes (Figure 3—figure supplement 4C,
Lock and Parker. eLife 2020;9:e55008. DOI: https://doi.org/10.7554/eLife.55008 9 of 26Research article Cell Biology Structural Biology and Molecular Biophysics
D). Scatter plots of SD signal vs. bulk Ca2+ level during the rising phase of CCH-evoked Ca2+ eleva-
tions were closely similar in control and following FCCP application (Figure 3—figure supplement
4E).
Ca2+ puffs do not terminate because of rising cytosolic Ca2+ during cell-
wide elevations
In light of the resemblance between the inverted U relationship between puff activity and Ca2+ level
(Figure 3) and the well-known bell-shaped curve for biphasic modulation of IP3R channel activation
by Ca2+(Iino, 1990; Bezprozvanny et al., 1991), we considered whether the suppression of puff
activity during global elevations might result because IP3Rs became inhibited by rising cytosolic
Ca2+ levels. To test this, we first examined the effect of elevating cytosolic Ca2+ levels prior to evok-
ing IP3-mediated Ca2+ signals. We loaded HEK WT cells with caged Ca2+ (NP-EGTA) and delivered
photolysis flashes of varying durations to cause jumps of cytosolic free Ca2+ of different magnitudes
before locally applying CCH from a puffer pipette (Figure 4A). Although the SD signals evoked by
CCH declined progressively with increasing prior photorelease of Ca2+, this reduction was matched
by a similar diminution in peak amplitudes (DF/F0) of the global Ca2+ signal. The open symbols in
Figure 4B plot the ratio of puff activity (integral under SD traces) relative to the size of the CCH-
evoked global Ca2+ signal in each cell, and are presented after binning according to the magnitude
of the preceding Ca2+ jump evoked by photolysis of caged Ca2+. Mean ratios (Figure 4B, filled sym-
bols) remained almost constant for all Ca2+ jumps; even at levels (DF/F0 >6) corresponding to those
where puff activity was strongly suppressed during the rising phase of global responses (Figure 3).
As a complementary approach, we then examined the effect of buffering the rise in cytosolic
[Ca2+] during global responses by strong cytosolic loading of EGTA.
Figure 4C shows representative SD and DF/F0 traces in response to photoreleased i-IP3 from a
WT HEK cell that was loaded with EGTA by incubation for 1 hr with 15 mM EGTA-AM. The cell
showed a typical flurry of puff activity like that in non-EGTA-loaded cells. Puffs ceased before the
peak of the global Ca2+ signal, even though the amplitude of the signal (2.5 DF/F0) was strongly
attenuated. Figure 4D summarizes mean data from multiple cells, plotting paired measurements of
cell-wide SD signals and Ca2+ level (DF/F0) at intervals during the rising phase of IP3-evoked Ca2+
elevations, as in Figure 3. The data again followed an inverted U relationship (solid circles), but in
comparison to control, non EGTA-loaded cells (open circles) the relationship was shifted markedly to
the left. Notably, the peak SD signal was attained at a fluorescence level of about 0.40 DF/F0 vs.
about 2 DF/F0 for controls, and puffs were substantially suppressed at fluorescence levels (DF/F0 ~2)
where the puff activity was near maximal in control cells.
Taken together, these results demonstrate that inhibition of IP3Rs by elevated cytosolic [Ca2+] is
not the primary mechanism causing puff activity to terminate during whole-cell Ca2+ responses. They
further buttress other evidence that the decline in SD signal during the rising phase of the response
does not arise because the indicator dye becomes saturated, but faithfully reflects a physiological
termination of puff activity.
Partial depletion of ER Ca2+ selectively inhibits Ca2+ puffs
We next considered the possibility that puff activity may terminate during the rising phase of global
Ca2+ elevations because of falling luminal ER [Ca2+], rather than rising cytosolic [Ca2+]. We tested
this idea by imaging i-IP3 evoked global Ca2+ signals after partially depleting ER Ca2+ stores while
minimizing changes in cytosolic free [Ca2+].
In a first approach (Figure 5A), we transiently applied cyclopiazonic acid (CPA) to reversibly
inhibit SERCA activity (Uyama et al., 1992), resulting in a net leak of Ca2+ from the ER and a small
elevation of cytosolic Ca2+. Following wash-out of CPA, the cell was maintained in Ca2+-free medium
so that the cellular Ca2+ content (including that of the ER) gradually depleted owing to passive and
active extrusion across the plasma membrane. After about 4 min the resting cytosolic Ca2+ level had
returned close to the original baseline, and we delivered a photolysis flash to photorelease i-IP3. This
evoked a substantial elevation in global Ca2+, yet the SD signal showed almost no transient puff
activity during this response. Similar results were obtained in a further seven cells, as shown by the
mean DF/F0 and SD traces in Figure 5B. To confirm that the suppression of puff activity resulted
from cellular Ca2+ depletion, we repeated this experiment, now making a paired comparison of
Lock and Parker. eLife 2020;9:e55008. DOI: https://doi.org/10.7554/eLife.55008 10 of 26Research article Cell Biology Structural Biology and Molecular Biophysics
Figure 4. The suppression of Ca2+ puffs during global signals does not result because of elevated cytosolic [Ca2+]. (A,B) IP3-evoked Ca2+ puffs are not
suppressed by prior photorelease of Ca2+. (A) Traces depict fluorescence ratios (black; DF/F0) from WT HEK cells and corresponding SD signals (grey; in
arbitrary units, A.U.). Records, from left to right, show responses from individual cells loaded with NP-EGTA (caged Ca2+) that were unstimulated or
exposed to increasing UV flash durations (marked by arrows) to photorelease progressively increasing amounts of free Ca2+ before challenging cells
with CCH (100 mM) locally delivered by a puffer pipette when indicated by the bars. Traces are blanked out during the artifact caused by the photolysis
flash. (B) Data points from traces like those in A show the integral under SD trace (a measure of puff activity) as a ratio of the change in global Ca2+
signal (DF/F0) evoked by CCH. The data are binned in terms of the jump in Cal520 fluorescence (DF/F0) evoked by photolysis of caged Ca2+. Open
symbols are from individual cells, and filled symbols are means for each group (respective n numbers for different bins; 20, 4, 4, 6, 8). Data are
normalized with respect to the mean ratio without prior photorelease of Ca2+. There was no significant difference between control CCH responses and
CCH responses following Ca2+ jumps (evaluated by Student T-test; p values between 0.17 and 0.66 for the different binned groupings). (C,D)
Termination of puff activity is unaffected when global cytosolic Ca2+ signals are attenuated by buffering with EGTA. (C) Traces showing the Cal520
fluorescence ratio (DF/F0; smooth trace) and SD signal (noisy trace) in response to photoreleased i-IP3 in a representative WT HEK cell that was
incubated with 15 mM EGTA/AM to buffer cytosolic Ca2+ and attenuate the amplitude of the global Ca2+ signal. (D) Scatter plots show measurements
of the SD signal at intervals during the rising phase of global Ca2+ responses against the magnitude of the global Ca2+ elevation (DF/F0) at that time.
Measurements were binned at intervals of (0.1 DF/F0) and SD data are normalized to a peak value of 1. Solid circles show mean data from 14 EGTA-
loaded cells. For comparison, open circles present data reproduced from Figure 3C showing measurements from 11 control cells that gave fast rising
responses to photoreleased i-IP3.
i-IP3-evoked responses between cells that were bathed for 30 min after washing out CPA either in
Ca2+-containing medium to allow ER store refilling (Figure 5C; Figure 5—video 1), or in Ca2+-free
medium (Figure 5D; Figure 5—video 1). Cells in both groups showed substantial global Ca2+
responses that were not appreciably different in peak amplitudes (Figure 5E); but whereas the SD
signals showed that puff activity was strongly suppressed in cells maintained in zero Ca2+ medium,
Lock and Parker. eLife 2020;9:e55008. DOI: https://doi.org/10.7554/eLife.55008 11 of 26Research article Cell Biology Structural Biology and Molecular Biophysics Figure 5. Ca2+ puffs are selectively depressed by reduced ER Ca2+ content. (A–F) Selective depression of puffs during i-IP3-evoked global Ca2+ signals following depletion of ER Ca2+ content using transient application of cyclopiazonic acid (CPA; 50 mM) (A) The smooth trace shows fluorescence ratio (DF/F0) from a WT HEK cell, and the noisy trace the corresponding SD signal (in arbitrary units). The cell was bathed throughout in solution containing no added Ca2+ and 300 mM EGTA, and CPA was locally applied from a puffer pipette during the time indicated by the bar. A UV flash was delivered when marked by the arrow to photorelease caged i-IP3 loaded into the cell. (B) Mean DF/F0 and SD signals from seven WT HEK cells in response to photoreleased i-IP3 following CPA treatment and wash in Ca2+-free medium as in A. (C,D) Representative DF/F0 and SD responses to photoreleased i-IP3 in individual cells that were bathed, respectively, in Ca2+-containing or Ca2+-free medium for 30 min following treatment with CPA as in A. (E) Peak amplitudes of global fluorescence signals evoked by photoreleased i-IP3 in experiments like those in C,D, for cells bathed in Ca2+-containing (n = 8 cells; blue squares) or Ca2+-free medium (n = 6; red circles). Open symbols denote measurements from individual cells; filled symbols are means. No significant difference between peak amplitudes (DF/F0) of cells bathed in Ca2+-containing and Ca2+-free medium (Student T test; p=0.72). (F) Corresponding measurements of integral under SD traces (puff activity) during the time from the photolysis flash to the peak global fluorescence signal. SD integrals were significantly different between cells bathed in Ca2+-containing and Ca2+-free medium (Student T test; p=0.012). (G–I) Selective depression of puffs by depleting ER Ca2+ content by repeated applications of CCH in zero Ca2+ bathing solution. (G,H) Global Ca2+ signals (smooth traces; DF/F0) and SD signals (noisy traces) evoked by successive, identical applications of CCH at 5 min intervals in two representative cells bathed, respectively, in medium containing 2 mM Ca2+ or 300 mM EGTA with no added Ca2+. Amplitudes of the SD signals are depicted after normalizing to the peak amplitude of the first response for each cell. (I) Data points show the ratio of puff activity (integral under the SD trace) vs. peak magnitude of Figure 5 continued on next page Lock and Parker. eLife 2020;9:e55008. DOI: https://doi.org/10.7554/eLife.55008 12 of 26
Research article Cell Biology Structural Biology and Molecular Biophysics
Figure 5 continued
the global Ca2+ signal (DF/F0) for successive responses evoked by CCH application at 5 min intervals. Blue squares are data from cells bathed in
medium containing 2 mM Ca2+ and red circles are from cells in Ca2+-free medium; open symbols are ratios from individual cells and filled symbols are
means. Data are plotted after normalizing to the mean SD integral and peak DF/F0 evoked by the initial stimulus in each condition. Responses were
significantly different between cells bathed in the presence and absence of external Ca2+ for times 10 min (Student T test; p=0.000008).
The online version of this article includes the following video for figure 5:
Figure 5—video 1. Partial depletion of ER Ca2+ selectively inhibits Ca2+ puff activity.
https://elifesciences.org/articles/55008#fig5video1
cells in Ca2+-containing medium showed robust puff activity during the rising phase of the response
(Figure 5F).
As an alternative approach to partially deplete ER Ca2+ without pharmacological intervention, we
evoked Ca2+ signals by repeated applications of CCH at 5 min intervals, and compared responses in
cells bathed in Ca2+-containing (Figure 5G) and Ca2+-free solutions (Figure 5H). In both cases, the
amplitudes of the global Ca2+ signals progressively declined, likely a result of inhibition of IP3Rs.
However, whereas the amplitude of puff activity reported by SD signals in cells bathed in Ca2+-con-
taining medium fell roughly in proportion to the amplitude of the global fluorescence signal, puff
activity in Ca2+-free medium declined abruptly. In the example depicted in Figure 5H, no activity
was evident in the SD signal after the fifth stimulus at 20 min even though an appreciable global
Ca2+ elevation remained. To quantify these data, we determined puff activity as the integral under
the SD trace, and plotted the normalized ratio of puff activity vs. peak global Ca2+ amplitude
(Figure 5I). For cells in Ca2+-containing medium, the mean ratio remained constant across successive
stimuli (blue squares, Figure 5I), whereas it declined almost to zero for cells in Ca2+-free medium
(red circles, Figure 5I).
We conclude from these results that Ca2+ puff activity is modulated by ER Ca2+ store content,
and that when stores are partially depleted IP3 can still evoke Ca2+ release by a process that is inde-
pendent of puff activity, and occurs without detectable temporal fluctuations. We term this mode of
Ca2+ liberation as ‘diffuse’ release and refer to Ca2+ puffs as a ‘punctate’ mode of Ca2+ liberation.
All three IP3R isoforms mediate punctate and diffuse modes of Ca2+
liberation
In common with many other cell types, WT HEK and HeLa cells express all three major IP3R isoforms
– types 1, 2, and 3 – that are encoded by separate genes and translated into structurally and func-
tionally distinct proteins that co-translationally oligomerize to form heterotetrameric channels. We
(Lock et al., 2018) and others (Mataragka and Taylor, 2018) recently demonstrated that all three
isoforms can individually mediate Ca2+ puffs. We now utilized HEK cells genetically engineered to
express single IP3R isoforms to evaluate the respective roles of each isoform in liberating Ca2+ via
punctate, localized transients versus sustained, diffuse release.
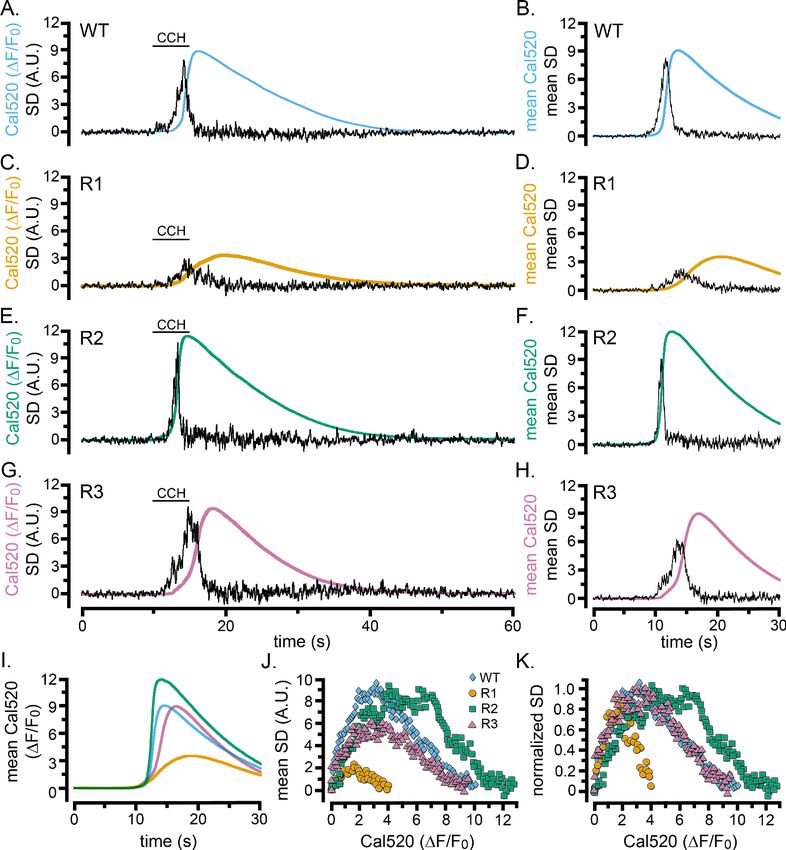
We evoked Ca2+ liberation in WT HEK cells and cells exclusively expressing type 1, 2, or 3 IP3Rs
by local application of CCH (Figure 6). All three single-isoform-expressing cell lines exhibited pat-
terns of responses qualitatively similar to WT cells. The SD traces showed flurries of puffs during the
foot and rising phase of global Ca2+ signals that ceased before the time of the peak global Ca2+ ele-
vation (Figure 6A–H). Nevertheless, notable differences were apparent between the isoforms. Cells
expressing IP3R1 generated whole-cell Ca2+ signals having much smaller amplitudes and slower ris-
ing phases than WT and R2- and R3-expressing cells, and localized fluctuations persisted longer
(Figure 6C,D,I). In contrast, IP3R2-expressing cells displayed fast rising, large amplitude Ca2+ sig-
nals, with a transient flurry of Ca2+ fluctuations concentrated during the initial portion of the rising
phase (Figure 6E,F). Ca2+ signals in cells expressing IP3R3 (Figure 6G,H) were similar in amplitude
to WT and IP3R2-expressing cells, but with slower rates of rise and more prolonged flurries of puffs.
Scatter plots of puff activity (SD signal) as a function of the global Ca2+ level (DF/F0) during the rising
phase of the global response further highlighted these differences (Figure 6J,K). Ca2+ fluctuations
were maximal when Cal520 fluorescence (DF/F0) rose to roughly 1.5, 6, and 3 for types 1, 2, and 3
IP3Rs, respectively; and similarly large differences were evident in the global Ca2+ level attained
when puff activity terminated.
Lock and Parker. eLife 2020;9:e55008. DOI: https://doi.org/10.7554/eLife.55008 13 of 26Research article Cell Biology Structural Biology and Molecular Biophysics
Figure 6. Cell-wide Ca2+ elevations and SD fluctuations in WT HEK cells and cells exclusively expressing single IP3R isoforms. (A–H) Traces show whole-
cell Cal520 fluorescence ratio (smooth colored traces; DF/F0) and SD fluctuations (noisy black traces) of HEK cells locally stimulated with CCH locally
delivered in a Ca2+-containing bath solution when indicated by the bars. Panels on the left are representative records from individual cells, and panels
on the right show mean traces from 7 (B) or 3 (D,F,H) cells. (A, B) Records from HEK WT cells. (C–H) Records from HEK cells solely expressing IP3R1 (C,
D), IP3R2 (E,F), or IP3R3 (G,H). (I) Overlaid mean Cal520 fluorescence ratio traces, aligned to their rising phase, in WT HEK cells (cyan; n = 7), and HEK
cells solely expressing IP3R1 (gold; n = 3), IP3R2 (green; n = 3), and IP3R3 (pink; n = 3). (J) Scatter plots of SD signal vs. fluorescence ratio during the
rising phase of the Ca2+ responses in WT HEK cells (cyan diamonds) and HEK cells solely expressing IP3R1 (gold circles) IP3R2 (green squares) or IP3R3
(pink triangles). Data points are means from the same cells as in I. (K) The same data as in J, after normalizing to the same peak SD values.
The online version of this article includes the following figure supplement(s) for figure 6:
Figure supplement 1. Ca2+ fluctuations during global Ca2+ signals in HeLa cells.
HeLa and HEK cells exhibit similar patterns of Ca2+ signals
We utilized HEK cells for most experiments because of the availability of cell lines expressing individ-
ual IP3R isoforms (Alzayady et al., 2016). The patterning of local, transient Ca2+ signals during IP3-
mediated whole-cell Ca2+ elevations was not unique to this cell type. Stimulation of HeLa cells with
histamine also evoked global Ca2+ signals accompanied by flurries of local Ca2+ activity during the
rising phase, which subsided as Ca2+ levels continued to rise (Figure 6—figure supplement 1).
Lock and Parker. eLife 2020;9:e55008. DOI: https://doi.org/10.7554/eLife.55008 14 of 26Research article Cell Biology Structural Biology and Molecular Biophysics
Diffuse Ca2+ signals in TIRF do not reflect punctate release in the cell
interior
The data in Figures 1–6 derive from TIRF imaging of Ca2+ signals in close proximity to the plasma
membrane, where a majority (~80%) of puff sites in WT HEK cells are located (Lock et al., 2018).
However, TIRF microscopy provides no direct information from the interior of the cell, leaving open
the question as to whether slow diffusion of Ca2+ ions from puffs at internal sites may contribute to
the diffuse component of the Ca2+ signal visualized in TIRF images after the puff flurry has ceased.
To address this issue, we applied fluctuation analysis to images obtained using lattice light-sheet
(LLS) microscopy to record Ca2+ signals within diagonal optical ‘slices’ through the cell volume
(Ellefsen and Parker, 2018).
Figure 7A,B illustrate LLS Ca2+ fluorescence ratio images and corresponding SD images recorded
before and after photorelease of i-IP3 to evoke a global Ca2+ response. Similar to observations with
TIRF imaging, the SD images revealed local Ca2+ transients that began soon after photorelease, and
before any appreciable rise in the global Ca2+ signal (Figure 7A, panel ii). Discrete events then con-
tinued during much of the rising phase of the global signal (panels iii-v) but had largely ceased at
the time of the peak global signal (panel vi). In this cell Ca2+ puffs were primarily restricted to the
cell periphery, whereas Figure 7B shows an example from another cell where local activity was
observed both around the periphery and in the cell interior.
Figure 7. Lightsheet imaging of global Ca2+ elevations evoked in HEK cells by photoreleased i-IP3. (A) Upper panels show 45o diagonal image ‘slices’
through the center of a WT HEK cell imaged by lattice light-sheet microscopy. Grey scale intensities correspond to increases in fluorescence (DF) of
Cal520 relative to the mean intensity (F0) averaged over 100 frames before stimulation (DF/F0). Each panel is a single 10 ms exposure, captured at times
before and after stimulation, as indicated by the Roman numerals in C. The cell outline is marked in yellow. Lower panels show corresponding SD
images, at times corresponding to the upper panels. Colored outlines mark ROIs used to derive DF/F0 and SD traces from peripheral (red) and center
(blue) regions of the cell. (B) Corresponding DF/F0 and SD lightsheet images from a different HEK cell that showed more prominent puff activity in the
center of the cell. (C) Measurements of DF/F0 (smooth traces) and SD (noisy traces) from the cell illustrated in A. Traces in red show average
measurements from the peripheral region of interest marked in the bottom left panel of A, and traces in blue show measurements from the central
region of interest. (D) Corresponding measurements of DF/F0 and SD from the cell illustrated in B. (E) Scatter plot of SD signal versus Ca2+ fluorescence
(DF/F0) at intervals during the rising phase of global Ca2+ signals. Data are from eight cells, with measurements binned at intervals of 0.1 DF/F0.
Lock and Parker. eLife 2020;9:e55008. DOI: https://doi.org/10.7554/eLife.55008 15 of 26Research article Cell Biology Structural Biology and Molecular Biophysics
Figure 7C,D shows respective measurements from these two cells, plotting fluorescence ratio
changes (DF/F0) and SD signals from ROIs encompassing peripheral (red traces) and central (blue
traces) regions of the cells, as indicated in the leftmost lower panels of Figure 7A,B. In both cells,
the local Ca2+ activity monitored by SD fluctuations started within a few hundred ms of the photoly-
sis flash and was maximal during the early portion of the rising phase. The SD signal then declined,
returning close to baseline as the global Ca2+ signal approached a peak. For the cell illustrated in
Figure 7A, the SD signal within the peripheral region was much greater than in the central region,
even though the rise in global Ca2+ was slightly smaller. In contrast, the cell illustrated in Figure 7B
showed a SD signal in the interior that was similar in size to the periphery (Figure 7D). On average,
however, mean SD signals from the cell interior were about one quarter of that at the periphery, and
fluctuations arising from interior sites followed a similar relation with bulk Ca2+ level as peripheral
sites (Figure 7E).
Given the relatively low average level of puff activity in the cell interior, and the similar termina-
tion of internal and peripheral puff flurries during the rising of global Ca2+ signals, we conclude that
the diffuse component of the Ca2+ rise observed by TIRF microscopy cannot be accounted for by
Ca2+ spreading from punctate release at internal sites and becoming blurred by diffusion in space
and time.
Puff activity contributes only a fraction of the total Ca2+ liberated
during global signals
To assess the relative contributions of punctate versus diffuse modes of Ca2+ release during global
Ca2+ signals, we derived the kinetics of Ca2+ flux into the cytosol through IP3Rs on the basis that the
cell-wide fluorescence signal reflects a balance between Ca2+ release into the cytoplasm and its sub-
sequent removal. To obtain a rate constant for removal of cytosolic Ca2+ in WT HEK cells, we
recorded the decline of fluorescence Ca2+ signals following transient photorelease of Ca2+ from
caged Ca2+ loaded into the cytosol (Figure 8—figure supplement 1A), and during the final ‘tail’ of
CCH-evoked Ca2+ signals when Ca2+ liberation would have almost ceased (Figure 8—figure supple-
ment 1B). Both fitted well to single exponential decay functions, consistent with a dominantly first
order removal process, with respective mean rate constants of 0.22 and 0.32 s 1.
We then calculated the instantaneous Ca2+ release flux at intervals throughout the time course of
a global Ca2+ response by differentiating the whole-cell fluorescence Ca2+ signal and adding to this
the estimated rate of Ca2+ removal; for i-IP3 signals we used a rate constant of 0.22 s 1; for CCH
evoked responses we applied rate constants (0.3 s 1 to 0.6 s 1) that were determined from the tail-
end of the global Ca2+ decay for that particular cell.
We used data from the experiment of Figure 5C,D to compare the kinetics of Ca2+ liberation
during Ca2+ signals under normal conditions, and when puff activity had been inhibited by partial
depletion of ER Ca2+ store content. Figure 8A,B show records from two representative cells that
gave global Ca2+ responses of comparable peak amplitudes (black traces). However, whereas the
SD signals (grey traces) exhibited the normal flurry of puff activity in the control cell (Figure 8A) this
activity was almost completely suppressed in the cell pretreated with CPA (Figure 8B). The red
traces show the respective rates of Ca2+ release into the cytosol, revealing a larger initial transient of
Ca2+ liberation in the control cell during the flurry of puff activity. Figure 8C shows overlaid mean
traces of Ca2+ release from control (n = 5) and CPA-treated cells (n = 6). Colored areas indicate the
relative cumulative amounts of Ca2+ entering the cytosol (integral under the release trace) in CPA-
treated cells where puff activity was substantially abolished (blue shading), and the additional Ca2+
flux (pink shading) in control cells showing flurries of puffs. From these respective areas, we estimate
that, in normal conditions, the punctate liberation of Ca2+ through puff activity contributes about
41% of the total Ca2+ release responsible for the initial rise of Ca2+ toward its peak. Figure 8D,E fur-
ther illustrate representative records of SD signals (grey traces), global Ca2+ (black), rate of Ca2+
release into the cytosol (red), and cumulative amount of Ca2+ released (blue) during the entire time
course of global Ca2+ signals evoked by photoreleased i-IP3 (Figure 8D) and by CCH (Figure 8E).
Because much of the cumulative Ca2+ release through IP3Rs arises from a sustained, low level flux
that continues after the peak, Ca2+ puffs on average contribute only about 13% of the total Ca2+ lib-
eration during global i-IP3-evoked signals, and about 17% during shorter-lasting responses evoked
by CCH (Figure 8F).
Lock and Parker. eLife 2020;9:e55008. DOI: https://doi.org/10.7554/eLife.55008 16 of 26You can also read