Transport of metabolic active bacteria through saturated quartz sand columns with and without substrate addition
←
→
Page content transcription
If your browser does not render page correctly, please read the page content below
Transport of metabolic active bacteria through
   saturated quartz sand columns with and
          without substrate addition

 Von der Fakultät für Mathematik, Informatik und Naturwissenschaften der Rheinisch-
Westfälischen Technischen Hochschule Aachen zur Erlangung des akademischen Grades
           einer Doktorin der Naturwissenschaften genehmigte Dissertation

                                      vorgelegt von

                                   Diplom-Chemikerin
                                 Carla Ralfs, geb. Küsters

                                aus Dülmen, Kreis Coesfeld

                   Berichter:      Universitätsprofessor A. Schäffer
                                   Universitätsprofessor U. Klinner

                        Tag der mündlichen Prüfung: 28.2.2007

 Diese Dissertation ist auf den Internetseiten der Hochschulbibliothek online verfügbar.
2 Für Benedikt, Dominik, Matthias, Florian und Michael
3
4

Danksagung
Herrn Dr. Erwin Klumpp möchte ich für die Themenstellung und die Unterstützung während
der 3 ½ Jahre danken. Ebenso Herrn Prof. Harry Vereecken für die Bereitstellung des
Arbeitsplatzes und die Unterstützung seitens der Institut-Leitung. Herrn Prof. Andreas
Schaeffer danke ich herzlich für die Betreuung der Arbeit sowie für die Vertretung der Arbeit
an der RWTH Aachen.

Aus der Arbeitsgruppe gilt vor allen anderen mein Dank Herrn Dr. Peter Klauth, der mich
durch zahlreiche, nicht nur fachliche Gespräche unterstützt und einen wesentlichen
Bestandteil dieser Arbeit mit initiiert hat.
Herrn Peter Klahre und Herrn Dr. Petr Ustohal danke ich für die stets freundliche fachliche
Unterstützung technischer und rechnerischer Art.
Allen Kolleginnen und Kollegen im Institut ein herzliches Dankeschön für nette Tür- und
Angel-Gespräche sowie erhol- und unterhaltsame Kaffepausen.

Ein wesentlicher Dank gebührt meinen Eltern, Charlotte und Dr. Ferdinand Küsters, die,
wenn es nötig war, einsprangen um notfalls sich um ein (oder gleich mehrere) kranke Kinder
zu kümmern und mir auf diese Weise den Rücken freigehalten haben.

Der größte Dank gilt meinen „fünf Männern“ Michael, Benedikt, Dominik, Matthias und
Florian zu Hause. Auch wenn es manchmal schwierig für alle war haben sie mich immer an
die wesentlichen Dinge im Leben erinnert, für die schönste Abwechslung gesorgt und die
nötige Bodenhaftung gegeben.
5

Index

1     Introduction ........................................................................................................................ 9
2     Bacterial transport and breakthrough through porous media ........................................... 12
3     Materials and methods ..................................................................................................... 17
   3.1      Pseudomonas fluorescens, its cultivation and gfp-modification.............................. 17
   3.2      Columns and buffer for breakthrough ...................................................................... 19
   3.3      Column experiments and experimental setup .......................................................... 21
   3.4      Microscope procedure and data analysis.................................................................. 23
   3.5      Investigation of stress occurring due to lack of oxygen........................................... 28
      3.5.1        Investigation of the increase of cells ................................................................ 28
      3.5.2        Investigation of the morphological composition of control and stressed culture
                   28
4     Breakthrough of Pseudomonas fluorescens-gfp through quartz sand columns under
saturated conditions without substrate ..................................................................................... 29
   4.1      Results ...................................................................................................................... 29
      4.1.1        Comparison between the breakthrough of bacteria and microspheres............. 29
      4.1.2        Influence of duration of carbon and energy starvation of P. fluorescens-gfp on
      breakthrough behaviour.................................................................................................... 31
      4.1.3        Balance of breakthrough based on the total amount of cells. Morphological
      change of Pseudomonas fluorescens-gfp during the breakthrough through saturated sand
      columns 36
      4.1.4        The morphological change of P. fluorescens-gfp under static conditions ....... 42
      4.1.5        Influence of experimental runtime on bacterial breakthrough ......................... 44
   4.2      Discussion ................................................................................................................ 47
      4.2.1        Bacterial breakthrough compared to breakthrough of microspheres and D2O 47
      4.2.2        Morphological change of Pseudomonas fluorescens-gfp as a cause for
      breakthrough behaviour and retardation. The impact of oxygen deficiency as observed
      under static conditions...................................................................................................... 49
      4.2.3        Investigations of the morphological change of P. fluorescens-gfp under static
      conditions in chemostat and batch experiments ............................................................... 52
5     Breakthrough behaviour of Pseudomonas fluorescens-gfp under continuous addition of
substrate.................................................................................................................................... 54
   5.1      Results ...................................................................................................................... 54
      5.1.1        Distribution of cells in effluent and column depending on the age of the used
      cultures 54
      5.1.2        Morphological aspects...................................................................................... 59
   5.2      Discussion ................................................................................................................ 63
      5.2.1        General aspects................................................................................................. 63
      5.2.2        Comparison of bacterial breakthrough without and with substrate-addition ... 66
6    Summary, conclusion and Outlook .................................................................................. 68
7    References ........................................................................................................................ 70
6
Index of figures and tables
Figures
Figure 3-1 Growth curve and morphological species detected during cell-cycle from P.
fluorescens. CFU indicated the viable and reproducible cells, CTC indicates viable cells.
Modified according to Wilhelm et al. (1998)................................................................... 17
Figure 3-2 Column setup. Inner diameter 3 cm, length 12 cm................................................. 20
Figure 3-3 Scheme of experimental setup. Column system, detector row and control panel. . 22
Figure 3-4 Explanation of crack- and chain-code .................................................................... 25
Figure 3-5 Calculation of the biovolume of different types of cells. ....................................... 26
Figure 3-6 Example: Biovolume remains nearly constant. A slight increase is probably due to
rest of metabolic useable sources of the culture itself...................................................... 27
Figure 4-1 Breakthrough curves of D2O (refractive index), bacteria of different ages and
microspheres (each fluorescence) under saturated conditions. Each experiment run with a
pulse of 1 ml 50 mM D2O/Medium 461, cell suspension or microspheres (1x10⁹ cells,
6x10⁹ MS). Flow rate was 0.1 ml/min ............................................................................. 30
Figure 4-2 Cell amounts [%] of P. fluorescens-gfp found in the effluent and retained in the
column versus duration of carbon starvation (age of the used culture). Black: column,
white: effluent .................................................................................................................. 32
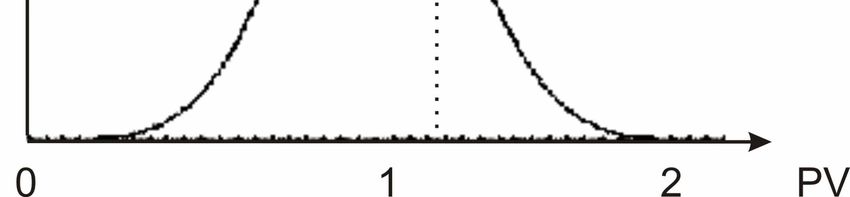
Figure 4-3 Breakthrough curves of P. fluorescens-gfp through saturated quartz sand columns
at different age of culture compared to the breakthrough curve of microspheres (1 µm of
diameter) under the same conditions. The line represents the fitted curve as a Gaussian
curve. ................................................................................................................................ 33
Figure 4-4 Retention profiles of Pseudomonas fluorescens-gfp and microspheres. Graphs in
descending order: 4h (orange)-20h (pink)-72h (purple)-144h (blue)-336h (black)-ms
(red). Data observed from counting each single layer. Layer 1: inlet, layer 10 (or 12
respectively) outlet. .......................................................................................................... 35
Figure 4-5 Different observed morphological species of P. fluorescens-gfp inocula. Pictures
obtained from fluorescence microscopy of different inocula. green: age of culture in h,
white line: scaling for 1 µm ............................................................................................. 37
Figure 4-6 Change of the morphological composition of P. fluorescens-gfp inocula as a
function of the age [h]. White: coccoid, grey: rod-shaped cells. ..................................... 38
Figure 4-7 Composition of effluent (left band) and columns (right band) with coccoid (upper
band) and rod-shaped (lower band) cells versus the age of a culture. ............................. 39
Figure 4-8 Distribution of coccoid and rod-shaped cells in layers. % related to the cell amount
in the regarding layer (100%). Points: coccoid cells, squares: rod-shaped cells. ............ 40
Figure 4-9 Distribution of coccoid and rod-shaped cells in the effluent. % related to the cell
amount in the regarding layer (100%). Points: coccoid cells, squares: rod-shaped cells 41
Figure 4-10 Culture of P. fluorescens-gfp (18h old, log-phase) were degassed with helium for
1 h and afterwards incubated without oxygen. The increase of cell amount (y-axis) is
plotted against the incubation time (x-axis) after degassing. ........................................... 42
Figure 4-11 Quota of viable cells after different oxygen degasing times. The viability is
measured by colony forming units of treated cells in comparison to a control. Quota cfu
[%]: amount of cells that are able to recover. .................................................................. 43
Figure 4-12 Morphological change of degassed cultures after 24 h incubation without oxygen.
control: shaker, air access possible, 2: shaker, degassed with He, no air exchange, 3:
shaker, airtight (no fresh air, rest of oxygen). White: coccoid cells, grey: rod-shaped
cells................................................................................................................................... 44
Figure 4-13 Influence of experimental runtime on the distribution of stationary phase cells in
a column after breakthrough. White: 1.4 PV, black: 4.8 PV............................................ 457
Figure 4-14 Influence of runtime on the distribution of log phase cells in a column after
breakthrough under saturated conditions. White: 1.3 PV, black: 2 PV ........................... 46
Figure 4-15 Summary of results obtained by breakthrough as a function of age of culture. ... 51
Figure 5-1Breakthrough curves of P. fluorescens-gfp (different ages) through quartz sand
columns under saturated conditions and continuous addition of substrate (glucose (0.5
g/l)). A fitting was not possible due to the complex shape of the obtained BTCs. Grey
line: fluorescence signal, grey box: indicates the part of the BTC < 1.0 PV ................... 55
Figure 5-2 Distribution of cells in effluent and column depending on the age of a culture. ... 57
Figure 5-3 Retention profiles of columns after breakthrough of Pseudomonas fluorescens-gfp
of different ages under continuous substrate addition. Layer numbers (from inlet to
outlet) versus retained cell amount................................................................................... 58
Figure 5-4 Distribution of coccoid and rod-shaped cells in effluent and column after the
breakthrough under substrate-addition as a function of duration of carbon and energy
starvation of the used culture [h]...................................................................................... 59
Figure 5-5 Morphological composition of different regions of effluent and column after
breakthrough versus duration of carbon and energy starvation (age of culture [h]). left:
coccoid cells, right: rod-shaped cells ............................................................................... 60
Figure 5-6 Morphological composition of single layers in columns after breakthrough. Points:
coccoid, squares: rod-shaped cells ................................................................................... 62
Tables
Table 1 Physico-chemical characteristics of P. fluorescens. * average value from all stages
(logarithmic, stationary, decay)........................................................................................ 18
Table 2 Characteristic data and parameters for the different used lenses of the microscope
setup. ................................................................................................................................ 24
Table 3 Classification parameters obtained via digital image analysis.................................... 25
Table 4 Increase of cell amount depending on duration of carbon and energy starvation of
culture. Increase x-times: cell amount of recovered cells compared to injected cells
(inoculum). ....................................................................................................................... 36
Table 5 Recovered amount of cells compared to inoculated cells. Enhancement in dependence
of duration of carbon and energy starvation of the inoculated culture [h]. ..................... 54
Table 6 Amount of recovered cells in the effluent before and after 1.0 PV in dependence from
the age [% of total recovered amount of cells in the experiment].................................... 568 Abbreviations CFU colony forming unit gfp green fluorescent protein IEP isoelectric point Lag-phase start of growth phase Log-Phase logarithmic growth phase PFA para-formaldehyde PV pore volume
9

1 Introduction

Xenobiotics in the environment cause harm and processes of contamination are described
manifold in the literature (Leeson 2001; Scott 2004). Beside chemical pollutants in the
environment biological pollutants such as microorganisms and viruses also have to be
considered, since they can enter the environment via human assistance: At lower
concentrations, by filter plants and their sewage and in case of crop protection through
biological agents like Bacillus thuringiensis. In normal cases disposal of sludge or manure on
fields (Unc 2004) with a significantly higher concentration of microorganisms is harmless
because the bacteria are not pathogenic, they are kept at the soil surface, or in the upper levels
of the soil. The problem emerges when these bacteria or viruses are pathogenic and reach the
saturated soil, subsequently groundwater. The passage of microorganisms may be possible
when the soil is near the surface and the soil is wetted through time, i.e. it never dries. Beside
transport of pathogenic bacteria themselves, pathogenic and antibiotic resistance genes can be
exchanged between the infiltrated and autochthone bacteria. This can also lead to a
contamination without the abundance of the pathogenic bacteria and plays a role in drinking
water safety.

Further, due to bioremediation, soil-derived bacteria were applied on contaminated areas to
degrade the contaminant. After successfully decontamination the remaining bacteria stay in
unknown parts inside the soil. The problem may occur when the microorganisms reach the
aquifer due to irrigation and passage along preferential flow paths (Bundt M. 2001).

The transport of microorganisms through variably saturated soil is simulated in laboratory
experiments in different scales: soil- or sand-filled columns in lab-scale setup (Becker 2004),
undisturbed soil columns (Lovins 1993), lysimeters as an intermediate setup (Hase 2001,
Pitkäjärvi 2003) and field experiments as the biggest scale that can be monitored (Oyster site,
Virginia, for detailed review see (Ginn 2002) and (Taylor 2004).

Although the high environmental impact of pathogenic bacteria from manure or from fields of
bioremediation is known as a global topic, the specific mechanism of bacteria transport from
the surface to the groundwater is not yet clearly understood. Currently, there are two basic
approaches: experiments taking place under unsaturated conditions, simulating the vadose
10

zone, and experiments under saturated conditions mimicking the region directly above the
groundwater level, the aquifer.

Up to now there is no general prediction of bacterial transport possible because of the lack of
fundamental datasets to develop simulations for bacterial breakthrough and considering all
features of heterogenic bacterial cell populations at the same time.

In this work experiments under saturated conditions were performed to acquire information
about metabolic active microorganisms (Pseudomonas fluorescens) and the influence of
substrate addition on the bacterial behaviour, such as age and oxygen availability. The
experimental setup was established for online measuring breakthrough of Pseudomonas
fluorescens-gfp as well as the proceeding of balancing this breakthrough in form of
distribution of total cell amount in effluent and layers.

The investigations were divided into two main parts:

(1) Bacterial breakthrough under saturated conditions without substrate. Includes factors like
different ages of the used cultures, morphological changes during the column passage and the
influence of experimental runtime

(2) Bacterial breakthrough under saturated conditions with substrate-addition. After
determining the magnitude of influence of the described factors above (without substrate), the
influence of the age of the used culture under substrate addition was investigated.

Prior to the breakthrough experiments the gfp-mutant of P. fluorescens had to be developed
and selected. The amount of cells, that were injected by short (1ml, 0.02 PV) pulse, was not
higher than 109 per ml to prevent that the cell amount within the column reaches levels that
are not present in natural areas (not more than 104 per ml) (Uhlman 1986), i.e. no continuous
pulse application was performed. The qualitative detection of bacterial breakthrough occurred
by monitoring of the fluorescence signal of the gfp-expression as well as UV/VIS-absorption
to determine bacterial and other colloidal breakthrough. The breakthrough curves had to be
compared to ones of the conservative tracer D2O and to particles (melanin microspheres,
carboxylate coated) of the same size as bacteria under the same experimental conditions.
11

The balancing of cell amount in effluent and column was studied by digital image analysis of
cells stained with fluorescence dyes (according to Weinbauer et al. (1998)). By means of data
base queries the morphology of recovered cells could be determined and compared to cells of
used inoculum.

In comparison to batch- and chemostat-experiments the effect of oxygen starvation during the
breakthrough should be explained. In this work the influence of substrate addition had to be
investigated with prior knowledge of bacterial behaviour inside a saturated column and the
role of a limiting amount of oxygen. In these substrate experiments the columns were
equilibrated with the substrate solution so an overall availability of substrate excess was
established. With the subsequent pulse of bacteria the growth effects with morphological
changes and increase of cell amount were determined - in contrast to works in literature
(Murphy 1997, 2000; Jordan 2004) where a simple bioassay was investigated by detection
and calculation of degradation of limited substrate in a bacteria-saturated column.
12

2 Bacterial transport and breakthrough through porous
  media

Particle transport has been investigated in detail, and results are available that allow
modelling of transport under saturated and unsaturated conditions (Bradford 2002; 2003;
2006). However, investigations on bacterial transport are still matter of research interest in
either saturated or unsaturated porous media.

Bacteria are exposed to convective transport as particulates species that move forward with
the pore-water, but some strains (amongst others Pseudomonas), are able to move actively
throughout the aqueous solution by flagella-mediated forward movement (Schlegel 1992).
The factors which affect bacterial convective transport and retardation of bacteria are diverse
(Stevik 2004) and not only of physical and physico-chemical but also of biological nature:

Flow rate: Increasing water flow leads to an increased transport of biomass (Klauth et al.
2006) whereas the increase of the ionic strength inside the eluant leads to a decrease of
bacterial breakthrough (Tan 1994)

Grain (and pore) and particle size: increasing grain size leads to an increased breakthrough of
the same particles, until the pore size reached a definite value, where particles are trapped
(straining, see below). Increasing particle size leads to an increased breakthrough (size
exclusion, filtering), too, until the particle size reaches a level where the particles are retained
on the top of the column (McGechan 2002).

Particle concentration: increasing the particle concentration leads to increased breakthrough
and to increasing straining of particles. This is one of the factors leading to blocking and
ripening (McGechan 2002).

Surface characteristics of matrix and microorganism: the resultant hydrophilic/hydrophobic
interactions between microorganism and matrix surfaces can enhance or retard the transport.
These interactions are influenced by ionic strength, solved organic compounds and the age of
the microorganism (Becker 2004; Foppen 2005)

Growth/decay/chemotaxis/motility: each culture is a dynamic system of growth and decay of
cells. Chemotaxis allows bacteria to enter a preferred medium on their own, in some cases
this movement is supported by flagella motion, as in the case of Pseudomonas fluorescens.
13

The factors mentioned above are responsible for the resulting retardation or breakthrough of
microorganisms through porous media. The mechanisms for transport and retardation are:

Straining indicates the physical trapping of any particle in small pores and throats within the
matrix and is influenced 1st by the particle to mean grain size ratio, and 2nd by hydraulic
characteristics like flow rate and ionic strength. The breakthrough curves which show
straining are non-symmetric with a broad shoulder behind the maximum (Corapcioglu 1984).

Attachment and detachment are interactions between microorganisms and the matrix within a
column based on the electrostatic and van-der-Waals forces. The interactions between
microorganisms can result in filtering (Murphy 1997) and subsequently blocking and ripening
(described further in this section). During unsaturated conditions the system becomes more
complex due to the presence of air enclosed in the matrix and therefore an additional interface
becomes available which is known to be a favourable site for bacterial attachment. Jewett et
al. (1999) found that fewer than 100% saturation – no air-water or air-matrix surfaces are
present - the breakthrough of bacteria reaches a maximum. With decreasing saturation the
breakthrough decreases (and the retardation increases, respectively) due to resulting
attachment of microorganisms at the air-water-interface (Schaefer 1998)

Filtering is the removal of any particle from solution by collision with the porous media and
deposition on it.

Size exclusion results in detected breakthrough times of bacteria that are shorter than those of
conservative tracers. Assuming that large cells are released to the effluent by means of size
exclusion (Corapcioglu 1984) implicates additionally a dependence from the age and nutrient
condition due to size shrinkage occurs with increasing age and under starvation (Sanin 2003).

Blocking occurs when first injected particles attach to the matrix and occupy preferential
attachment sites. Subsequently following particles are then prevented from attaching to the
matrix surface and are eluated.

Ripening occurs when prior attached particles serve as new preferred attachment sites for
subsequently following particles.
14

The greatest part of bacterial transport in an aqueous system is facilitated by the advective
flow (Dong 2002). Several works are presented in literature where bacterial and particle
transport are compared (Pang 1998; Becker 2004). Becker et al. recorded breakthrough curves
of inactive bacteria, particles (polystyrene, 1 µm) and bromide through raw material (glass
beads of 3 mm diameter).

Biological factors vary with age and metabolic state of the regarding culture. A culture
consists of different morphological species under certain conditions and the surface
characteristics change during a cell-cycle (van Loosdrecht 1990). Depending on the age of a
cell this cell can interact with surfaces to start culture-growing or is able to leave the surface
to rest in aqueous solution for finding new binding regions. Surfaces become preferred areas
for metabolic active cells because during exponential growth of bacteria cell wall
hydrophobicity is increasing and therefore adhesion is increasing, too. Adhesion is necessary
as well for colonization and afterwards developing a biofilm as for colonization and
afterwards leaking into the surrounding aqueous solution. Attached cells are metabolic mor
active than suspended cells (Ellwood 1982).

The surface characteristics can be determined by physico-chemical parameters (IR-data of
bacterial cell surface (Chen 2001), ζ-potential, isoelectric point IEP, and contact angle
Θ (Rijnaarts 1995)). The hydrophobicity-index measured by MATH test according to (van
der Mei 1995) gives information about the hydrophobicity (and hydrophilicity, respectively)
of bacteria in a defined hexadecane-water-system which allows comparison of different
strains. The influence of the surface characteristics of different soils and different bacteria is
important. I.e. hydrophobic soil compartments can be occupied by hydrophobic cells, which
may start culture growing and therefore serve as a depot for leaching bacteria into the
subsurface, especially when there are microchannels available where the leaching may be
enhanced. The same is valid for hydrophilic soil (sand for example) and hydrophilic bacterial
strains.

Beside the surface characteristics of bacteria and the matrix, bacterial features like flagella
can also affect the transport (Camper 1993, Gannon 1991). Flagella allow bacteria like P.
fluorescens to enter aqueous medium independently. This movement can reach velocities up
to 4 mm/h.
15

For visualization of bacterial transport different methods were used in the past. As well as the
online-detection of radio-labelled cells (Jewett 1999), the fluorescence-detection of genetic
modified cells after gfp- or lux-transformation was used (Dunn 2005; Oates 2005).

The greatest part of investigations concerning about the microbial transport has been carried
out as either field or column experiments with inactive bacteria or viruses (Mallen 2005).
Hekman et al. (1995) balanced the breakthrough of bacteria only with regard to the effluent
and did not consider the age of a used culture. All living organisms which should pass a
column or even a field were held inactive because of the problems occurring when simulating
bacterial breakthrough with transport-models. Foppen et al. (2005) came to this conclusion as
they modelled breakthrough of an E. coli-strain assuming heterogenic cells and the results did
not match the experimental data. To allow for the heterogeneity of bacterial suspensions,
Tufenkji et al. (2003) developed a model where the retention profile of cells within a column
was adapted to observed experimental data based on different transport theories: the colloid
filtration theory, microbial deposition patterns and steady-state filtration with no dispersion.
All different theories are able to describe one part of bacterial transport, which is always
simplified as a particle transport. Boundary conditions were inactivation of the used
microorganisms, short residence-times of microorganisms inside the column, constant
depositions rate coefficients.

The influence of substrate on bacterial breakthrough under saturated conditions has not been
investigated in detail. Jordan et al. (2004) and Murphy et al. (1997, 2000) obtained for first
data with an experimental setup of water- and bacteria-saturated column where a substrate-
pulse was added and the degradation was monitored. But up to now no investigations were
performed regarding the breakthrough of bacteria under consideration of the culture age and
conditions simulating the aquifer (saturated conditions, limited amount of cells, presence of
non-limited substrate, oxygen limitation). These aspects are some of the objective of this
thesis and should be investigated as a function of age of a used culture, i.e. in dependence of
the culture age and nutrient starvation state as well as a function of available nutrient
(substrate) during the transport process. For this purpose it was important to know the normal
standard behaviour of the bacterial culture, so that Pseudomonas fluorescens was the
appropriate strain to be examined under the given conditions.
16

In this thesis the transport of a gfp-mutant of Pseudomonas fluorescens was investigated
under saturated conditions as a function of the age of a used culture (duration of carbon and
energy starvation) without and with substrate-addition during the breakthrough. The effect of
aerotaxis as a special feature of chemotaxis was investigated and balanced and its effect on
bacterial size and shape was described.
17

3 Materials and methods

3.1 Pseudomonas fluorescens, its cultivation and gfp-modification

P. fluorescens is a soil-derived bacterium which is taken as a model organism (next to E. coli
and Bacillus or other Pseudomonas species) in a large number of transport experiments
(Brunninger 1999; Chen 2001; Ripp 2001; Timms-Wilson 2001; Rockhold 2002; Chen 2004).

P. fluorescens is a motile, normally rod-shaped gram-negative bacterium from dimensions of
0.5-1.0 µm in diameter and 1.5-4 µm in length, depending on age and nutrient state (Bergey`s
Manual of systematic Bacteriology, 1986). Cells of the logarithmic phase are lophotric
(monopolar polytrich). That is, the flagella are located at one pole of the longitudinal cell and
the typical flagella motion leads to velocities from 20 to 60 µm/sec, i. e. in average about 14
cm/h (Schlegel 1992). Wilhelm et al. (1998) showed size differences of physiologically
distinguishable cell species as a function of cell age. Figure 3-1 shows the growth curve
(“total cells”) and its composition of large and small cells. The logarithmic phase (phase of
exponential growth of the culture) consists mainly of large cells whereas the stationary phase
and afterwards the resting cells consist of mainly small cells.

Figure 3-1 Growth curve and morphological species detected during cell-cycle from P. fluorescens. CFU
indicated the viable and reproducible cells, CTC indicates viable cells. Modified according to Wilhelm et al.
(1998)
18

Depending on the detection and enumeration method of cell sizes and shapes (and therefore
the measurement of factors that influence directly the magnitude of these parameters) age and
nutrient state have to be monitored. Agranovski et al. (2003) came to the conclusion that for
P. fluorescens case no size distribution could not be obtained via UV/APS (UV-aerodynamic
particle sizer). In the same paper stress factors for P. fluorescens were not obtained although
for other bacteria these factors played an important role and bacteria showed differences in
their performance.

ζ-potential [mV]*                  -19.13                              Chen and Strevett (2001)
IEP [I=0.01M]                      3.6                                 Rijnaarts et al. (1995)
U                                  -1.03                               Rijnaarts et al. (1995)
contact angle Θ [deg]              25                                  Rijnaarts et al. (1995)

Table 1 Physico-chemical characteristics of P. fluorescens. * average value from all stages (logarithmic,
stationary, decay)

Table 1 shows the physico-chemical parameters of P. fluorescens from literature.

The ζ-potential was determined to be independent from the age of the culture -19 mV. IR-data
(Chen and Strevett 2001) indicated that the surface composition changed with increasing age
from polar to apolar, the rate of carbonyl and amide-groups was decreasing whereas the rate
of apolar ethenyl-groups was increasing with progressing age (Chen 2001).

(Fouchard 2005) found that different growth conditions led to varying membrane
compositions. Several results have been achieved about the effect of nutrient starvation
(carbon, nitrogen; (Sanin 2003)), oxygen and heat stress, and their effects on other bacteria
(Smeulders 1999; Ojha 2000) and Pseudomonas putida (Givskov 1994).

The used strain was Pseudomonas fluorescens that was genetically modified for gfp-
expression: the gfp-gene was inserted into the genome by conjugation of E. coli-S17λpir
carrying the donor-plasmid pAG408 (provided by D. Pieper, GBF Braunschweig) as mini-
transposon vector and the wild type Pseudomonas fluorescens as recipient. The conjugation
was conducted as described before (de Lorenzo 1990). During the insertion a kanamycin-
resistance was also inserted into the genome. The cells were plated on kanamycin-agar and
separated after detection of the green fluorescent colonies. For the breakthrough experiments
19

single colonies were grown in BC minimal-medium (Sambanis 1985) or Medium 462 with
glucose (0.5 g/l). The inoculum of cells (about 109 per ml) for each column was taken out
directly from the culture-flasks, an aliquot was taken for cell counting (see below). For fresh
cultures of less than 18h (experiment “4h- without substrate addition” and “5h- with substrate
addition”) the amount of cells was about 108 per ml. To concentrate the cell suspension, a
centrifugation step was done, but this centrifugation altered the cells dimensions and therefore
the morphological appearance. This effect is described by Smets et al.(1999), too. Therefore
for fresh cells the inoculated cell amount was a magnitude lower than for the older cells. The
morphological appearance should be investigated in dependence from the age of a culture.

3.2 Columns and buffer for breakthrough

The transport of gfp-labelled bacteria was conducted under saturated conditions in columns of
quartz sand (TECO-SIL, CE minerals, -50 +100). The dimensions of the columns were 3 cm
inner diameter and 12 cm length.

The used quartz sand (CE minerals, density 2.2 g/cm3, porosity 0.5, diameter ±150µm) was
directly used, without sterilization. The cell background and the substrate availability were
determined once as 104 cells per 5 g sand and no cell enhancement after 24h under standard
conditions, shaker, air access.

The columns (Figure 3-2) were equipped with PE-mesh (0.5 mm, Bückmann) at the inlet and
the outlet for evenly distribution of buffer, teflon-mesh (pore size 10 µm, Bückmann) towards
the sand for filtering bigger particles and to prevent occlusion of the detector cells. The
columns were sealed with Teflon® O-rings. The package of the column was carried head first,
so that the filling direction was the same as the later flow direction.
20

                                  PE-    Teflon-                    Steelcaps and
                                  mesh   mesh    Teflon
                                                                    steel body
                                  0.5 mm 10 µm O-ring

Figure 3-2 Column setup. Inner diameter 3 cm, length 12 cm.

To avoid enclosure of air bubbles during the filling process the column body was first filled
25 ml of buffer before the sand was poured in. Permanent knocking ensured that the matrix
inside was stratified uniformly. Alternative pouring of buffer and sand was repeated till the
sand surface established a bending that fitted the distance to the mesh of the top (thickness of
the O-ring).
21 3.3 Column experiments and experimental setup Several methods are available for determination of cell amount in solution. Direct methods are cell counter, flow-cytometry and digital image analysis after fluorescence staining LIT. Indirect methods like UV/VIS-absorption of cell suspensions are too imprecise and only give information on the sum of cells. The determination of CFU indicates only the viable and reproducible cells. However, the UV/VIS-absorption method was used for the qualitative determination of bacterial breakthrough additional to fluorescence detection. Methods of cell counting by means of cell counters are not able to detect the differences between morphological species of one strain, as seen in other works (Agranovski 2003), and lead to a false estimation of bacterial behaviour. During the experimental part of this work the method of fluorescence staining of cells, microscopic detection, and subsequent digital image analysis to acquire datasets for each single cell and evaluation by data base queries was operated, though it was time consuming, but it gave the most information not only about the amount of cells but also about cell characteristics. A scheme of the experimental setup is given in Figure 3-3. The column was loaded by a HPLC-pump (Merck-Hitachi, L-6200) with flow direction from bottom to top, to maintain saturated conditions. The effluent passed a fluorescence- (Merck-Hitachi, F-1050) and UV/VIS-detector (Merck- Hitachi, L-4200), a refractometer (Merck, differential refractometer RI-71) and was collected in a fraction collector (ISCO, retriever 500) at least. For calibration with D2O the effluent was not collected. All detectors were controlled by PC (Merck-Hitachi software HSM-7000). For controlling the complete setup a sample valve (rheodyne 6-valve) was installed before the series of detectors. This valve and a controlling pump (Merck-Hitachi, L-7100) were PC- controlled, too. Stainless steel columns of 3 cm diameter and 12 (or 10) cm length were used. The column was loaded with buffer (BC minimal medium without C-source) by HPLC-pump with constant flow rate of 0.1 ml/min, simulating natural conditions of flow velocity of 1 m/d.
22

The effluent passed successively the fluorescence-detector, the UV/VIS-detector and the
refractometer before it was collected by auto sampler.

                                                 C

                                                                                               Fluo
                  column
                                                  RI

                                                                                         UV/Vis

           Sample loop            v
                                               waste
                                                                         Fraction
                                                                         collector
                                pump

                                                                                    55

                                                                                    50          D2O
                                                                                    45          fluorescence
                                                                                                UV/Vis-absorption
                                                                                    40

                                                                                    35
                                                                         Int [mV]

                                                                                    30

                                                                                    25

                                                                                    20

                                                                                    15

                                                                                    10

                                                                                    5

                                                                                    0

                                                                                    -5
                                                                                         0.0   0.2    0.4      0.6        0.8   1.0   1.2   1.4
                                                                                                                     PV

                                buffer

                                                                       Control
                                                                        panel
              C: controller

              V: sample valve

Figure 3-3 Scheme of experimental setup. Column system, detector row and control panel.

The determination of the pore volume was done by calculating the empty column volume
minus the volume of the sand (calculated by weight and density of 2.2 cm3/g). The
measurements with conservative tracer were taken with a pulse of 1ml 0.05 M D2O in M461-
medium, the breakthrough was measured by the refractometer and the effluent was directly
discarded. For the bacterial breakthrough (pulse) the sample loop was filled with 1 ml of
bacterial suspension (cell amount about 109 cells), the cell amount was determined before.
The breakthrough was monitored by fluorescence-detection (excitation wavelength 360 nm,
emission wavelength 520 nm) and by UV/VIS-absorption (660 nm). The effluent was
collected in fractions of 4 ml (corresponding to 40 min) in sample tubes containing 400µl 4%
23 PFA solution (in PBS). The small amount of PFA was used to inactive the leaking cells and prevent further growing during the experimental runtime, but avoiding denaturation of gfp during the long runtime. After 12 h runtime the column was removed from the system and stored at 8°C. Aliquots of fractions (30 µl up to 150 µl, depending on cell amount) were counted for total cell amount (see 3.4.). For comparison between bacterial and particle breakthrough latter was investigated by pumping a 1 ml-pulse of micropheres (sulforhodamin b encapsulated in melanin, surface- coated with carboxylate groups; Microparticles, Berlin) into a column. After the breakthrough had finished the column was opened at the bottom (inlet) and 1cm- layers were separated, whereas the layer structure was destroyed. The sand was resuspended in 50 ml of a 1:3-dilution of 4% PFA (in PBS; 12.5 ml) and PBS (37.5 ml) and left on a shaker for 1 h at room temperature. Aliquots of 1 ml supernatant were counted for total cell amount (see 3.4). 3.4 Microscope procedure and data analysis The total cell amount of the original bacterial suspension as well as aliquots of effluent and supernatant were determined by fluorescence spectroscopy of fluorescence labelled cells. The detection of pure gfp-expression under UV-light for counting cells of the samples was not sufficient, because the excitation-light intensity was too high, thus a bleaching of the cells occurred much faster than it took to get the digital images of the samples. The method for fluorescence labelling of cells used was carried out as described in Weinbauer (1998), modified by Klauth (2004). Therefore the corresponding sample (50-150 µl of fractions, 1 ml of suspended layer, 100 µl of a 1:10 or 1:100-dilution of inoculum, depending on cell-density) was pipetted into a FinStar staining reactor containing 4 ml of PBS buffer (pH 7), as described previously (Poschen 2002). For filtration, an isopore filter (Millipore, 0.2 µm, 25 mm diameter, GTBP, Millipore) was used. The liquid sample was sucked off with 130 mbar underpressure and the retained particles were washed twice with 4 ml PBS buffer (pH 7). The filter was then coated with 1.5 ml of 5 µM Sybr-Green solution in PBS buffer (pH 7) and incubated for 5 min. Two washing steps were performed subsequently.
24

The filter with the stained cells was mounted into a drop of water on a microscope slide after
drying and a drop of water was put on the surface. A cover slide was used and a drop of
immersion oil was put on the cover slide. The sample was viewed under blue excitation light
(Nikon B-2A, excitation 450-490 nm, dichroic mirror 505 nm, longpass > 520 nm) at 600-
fold (in some cases 450- or 1000-fold) magnification. The experimental setup was the same as
described at Klauth et al. (2004). In Table 2 the values are given for the regarding lenses in
different experiments.

                               450-fold                   600-fold                     1000-fold
Picture size                   750*545                    1232*972                     1232*972
(in PIXEL)
1Px=                           0.106µm                    0.104µm                      0.057µm
1µm=                           9.43Px                     9.7Px                        17.5Px
Picture size in µm2            80*5                       128*101                      70.2*55.4
                               =4.6*103                   =1.29*103                    =3.9*103
Filter size in cm2             4,15                       4,15                         4,15
Filterfactor                   9*104                      3.22*104                     1.07*105
=filter size/picture size
Table 2 Characteristic data and parameters for the different used lenses of the microscope setup.

Each counted cell was classified with 22 parameters, which were designated in the KS400
software (Carl Zeiss, Jena). All raw data (for each counted cell 22 parameters) were stored
and left unprocessed in a microsoft access database. By SQL-query morphological portions of
each investigated fraction/layer or inoculum could be determined as well as calculations of the
biovolume of a regarding sample.

For classification of morphology three limitations were set, deriving from test data (Table 3):

        FERETRATIO = ratio of minimal and maximal extent of an object

        NCHAINS = number of chain-coded objects in a regarded cell, within the object, three
        dimensions. Chain coding can begin at any point of the object, so the number is the
        varying parameter (see Figure 3-4).

        NCRACKS = number of chain-coded objects in a regarded cell, along the object, in
        two dimensions (see Figure 3-4).
25
Figure 3-4 Explanation of crack- and chain-code
classification FERETRATIO NCRACKS NCHAINS
parameter
lens 0.45 0.6 1.0 0.45 0.6 1.0 0.45 0.6 1.0
cocci >= 0.6 ≤2026
This was done outgoing from the 2-dimensional picture of each cell to a 3-dimensional
geometric body: A circle-formed cell became a spherical cell, a coccus, whereas a long,
straight cell became a rod. Figure 3-5 shows the corresponding figures with the data derived
from the digital image analysis.
4 4
V c = πr 3 Volume of a coccoid cell V R = πr 3 + πhr 2 Volume of a rod cell
3 3
FERETMAX= h
FERETMAX – FERETMIN
= h – 2r
FERETMIN=FERETMAX= 2r
FERETMIN= 2r
Figure 3-5 Calculation of the biovolume of different types of cells.
Deriving from the parameters FERETRATIO/NCHAINS/NCRACKS another method for
balancing the bacterial breakthrough was done by calculating the biovolume: through digital
image analysis the volume of each counted cell was determined (see above).
After upscaling for the cell amount in each fraction, layer or in the inoculum the biovolume
could be determined. This remains nearly constant for cultures, which derived from older
inocula (at least one week old) (Figure 3-6).27
x 3,2 12000
1,00E+010
no change 11000
8,00E+009 10000
9000
6,00E+009
cell number
biovolume
8000
7000
4,00E+009
6000
5000
2,00E+009
4000
0,00E+000 3000
Inokulum sum effluent sum layer sum recovery
Figure 3-6 Example: Biovolume remains nearly constant. A slight increase is probably due to rest of metabolic
useable sources of the culture itself.
For cultures, which derived from fresh inocula, where the metabolic turnover was quite high,
the biovolume showed a slightly increasing behaviour. But this increase was very low
compared to a biovolume-increase of an actively growing culture with glucose as sole C- and
energy source in the same time of 12-18 h runtime.28
3.5 Investigation of stress occurring due to lack of oxygen
3.5.1 Investigation of the increase of cells
To find out the reasons for morphological change and cell increase of bacteria during column
passage a culture of P. fluorescens-gfp was grown according to Tappe et al. (1996) in a
chemostat, i.e. without mechanical retardation of bacteria. The dilution rate D was 0.05h-1 as
was the growthrate µ. Two aliquots of this chemostat culture were taken and treated as
followed: A control was transferred into a flask and allowed to grow under air access and
second a sample in which the solved oxygen was degassed through helium for 1 h and
afterwards closed airtight and left growing on the shaker. Both, sample and control were
investigated after 3, 6 and 24 hours and the cell amount was determined as described before
(see 3.4).
3.5.2 Investigation of the morphological composition of control and
stressed culture
For this investigation simple batch experiments were done. Pre-cultures were grown in BC
(with 0.5 g/l glucose) over night under air access (shaker). Afterwards the conditions were
altered in the means of replacement of oxygen by helium in one of the sample cultures
(culture 2), one was left without possible air exchange (culture 3), and one culture was left
under standard conditions as control (culture 1). All cultures were grown additionally for 24
hours. Samples from each culture were taken directly before the conditions changed (time 0)
and after 24 hours of growing under these changed conditions (time 24hr). The investigation
of morphology was executed as before (see 3.4) and was analyzed by database queries, too.29
4 Breakthrough of Pseudomonas fluorescens-gfp through
quartz sand columns under saturated conditions
without substrate
The topic of this work was the investigation of the transport behaviour of P. fluorescens-gfp
in quartz sand columns under saturated conditions without and with substrate addition.
Furthermore the comparison of the obtained breakthrough curves (BTC) and retention profiles
with microspheres (MS) has been proved.
The detection of the conservative tracer D2O, bacterial and microsphere breakthrough
occurred after injection of a short pulse (1ml, according to ~0.02 PV). Two different
experiment series were run: (1) without substrate addition (only minimal salt medium as
growing and transport buffer); (2) continuous substrate addition (0.5 g/l glucose) in minimal
salt medium. The variable parameter in each series was the culture age, respective the time of
carbon- and energy depletion of P. fluorescens-gfp cells. Prior to each experiment, the
breakthrough curve of D2O was recorded, to check if the column was saturated and filled
correctly, and as a reference to compare with the bacterial breakthrough curve. Under
established standard conditions the breakthrough of microspheres was recorded for
comparison of the breakthrough and retardation of particles of bacterial size, shape, and
surface characteristics to the one of metabolic active bacteria.
4.1 Results
4.1.1 Comparison between the breakthrough of bacteria and
microspheres
The bacterial breakthrough of the genetic modified P. fluorescence-gfp strain was detected
online by measuring the fluorescence intensity of gfp-expression as a function of cell amount.
This method has the advantage that it keeps the cells active and viable prior they enter the
column in comparison to works where cells were marked by fluorescence dyes prior to the
breakthrough (Becker 2004). The maximum of detected breakthrough of P. fluorescens-gfp
was found at nearly 1 pore volume (PV) (0.96 and 1.04 PV for fresh and old cells,30
respectively; Figure 4-1). Beside the position of the actual maximum the signal intensity was
also found to be dependent on the duration of carbon and energy starvation of the injected
culture. The signal intensity was high for fresh cells which is indicative for a larger amount of
cells broken through while the signal intensity decreased for older cultures.
fluorescence old cells
fluorescence fresh cells
fluorescence of p. fluorescens-gfp rel. Int. [mV]
50 1,0
microspheres
fluorescence of microspheres rel. Int. [mV]
40
0,8
30
0,6
20
0,4
10
0,2
0
-10 0,0
0,0 0,5 1,0 1,5 2,0 2,5 3,0
PV
Figure 4-1 Breakthrough curves of D2O (refractive index), bacteria of different ages and microspheres (each
fluorescence) under saturated conditions. Each experiment run with a pulse of 1 ml 50 mM D2O/Medium 461,
cell suspension or microspheres (1x10⁹ cells, 6x10⁹ MS). Flow rate was 0.1 ml/min
In fact, the intensity signal of this gfp expression could not be calibrated as a function of the
cell amount because the density of the gfp inside the cells was changing: The cell division of
especially fresh cells (see 4.1.2) led to a dilution of the gfp because the amount of gfp proteins
did not increase during the division process. On the other hand increasing duration of carbon
and energy starvation of a culture led to decreased intensity of fluorescence due to missing
protein translation inside the cells. Due to this obtained heterogeneity of each investigated31
culture the observed signal of gfp fluorescence was taken for qualitative control of bacterial
breakthrough as in other works (Dunn 2005). The actual bacterial breakthrough curve was
obtained by cell counting of each fraction (as is described in detail later on). The maximum of
fluorescence intensity of the injected MS showed a significant later breakthrough (at 1.5 PV,
Figure 4-1) for the same experimental conditions (flow rate 0.1 ml/min).
4.1.2 Influence of duration of carbon and energy starvation of P.
fluorescens-gfp on breakthrough behaviour
For balancing and description of breakthrough and retardation of P. fluorescens-gfp the
amount of the recovered cells was set as 100 %, because cell multiplication during the
breakthrough led to an increase of cell amount (see 4.1.3)
In the effluent as in the column, dependence from duration of carbon and energy starvation of
the retained cells was observed (Figure 4-2): Increasing the duration of carbon and energy
starvation of culture, the amount of retained cells in the column decreased. For cells of the
early log-phase (4h-24h) 57 % to 72 % of the cells (depending on the duration of carbon and
energy starvation of the inoculum) were retained in the column, whereas for 336h old cells
95% of the cells were recovered in the effluent. For cells of the early stat-phase (72h) nearly
equal distribution of cells in effluent and column was observed.32
100
90
80
70
cell amount [%]
60
50
40
30
20
10
0
0 50 100 150 200 250 300 350
age of culture [h]
Figure 4-2 Cell amounts [%] of P. fluorescens-gfp found in the effluent and retained in the column versus
duration of carbon starvation (age of the used culture). Black: column, white: effluent
The actual breakthrough curves were received by cell counting of each fraction of the effluent
(Figure 4-3) in the investigated range of pore volume, and were fitted into a Gaussian
distribution. In contrast to the MS experiment (where only 0.05 % of particles were recovered
in the effluent) all bacteria experiments showed a detectable and countable BTC.33
50 4h 50
20h
40 40
amount [%]
amount [%]
30 30
20 20
10 10
0 0
0,0 0,5 1,0 1,5 2,0 0,0 0,5 1,0 1,5 2,0
PV PV
50 72h 50 144h
40 40
amount [%]
amount [%]
30 30
20 20
10 10
0 0
0,0 0,5 1,0 1,5 2,0 0,0 0,5 1,0 1,5 2,0
PV PV
50 50
336h MS
45
40
0,008
amount [%]
amount [%]
30
20
0,004
10
0 0,000
0,0 0,5 1,0 1,5 2,0 0 1 2 3 4
PV PV
Figure 4-3 Breakthrough curves of P. fluorescens-gfp through saturated quartz sand columns at different age of
culture compared to the breakthrough curve of microspheres (1 µm of diameter) under the same conditions. The
line represents the fitted curve as a Gaussian curve.34 The retention profiles are shown in Figure 4-4. Depending on the duration of carbon and energy starvation of the injected culture the distribution of cells within a regarded column changed. Cells of a 4h old culture were retained in two parts of the column. In the first half 41% of all cells were retained, in the second half 15 % of all cells. Cells of 20h were also mainly retained in the first half of a column (40 %) and 7 % in the second half. Increasing the duration of carbon and energy starvation of a culture to 72h led to a distribution where 28 % of all cells were retained in the last third and 32 % in the second third of the column. In the middle third only 13 % were found. In the experiment with the 144h old culture the main part of the cells (38 %) was found in the last third of the column due to the high cell amount in the next to last layer, 9 % of all cells were found nearly completely in the first half of the column. For the 336h experiment only 8 % of all cells were found in the column whereas only 1 % was found in the last half of the column. In contrast to these bacterial retention profiles the retention profile of microspheres is different, because 97 % of all particles were retained and found nearly completely (87 %) in the first layer of the column.
35

                             4h                                                   20h

                        2                                                    2

                        4                                                    4

                        6                                                    6
            layer no.

                                                                 layer no.
                        8                                                    8

                        10                                                   10

                        12                                                   12
                             0      10   20      30    40   50                    0      10   20      30    40   50
                                         portion (%)                                          portion (%)
                             72h                                                  144h

                        2                                                    2

                        4
                                                                             4
                        6
            layer no.

                                                                 layer no.

                                                                             6
                        8

                                                                             8
                        10

                        12                                                   10
                             0      10   20      30    40   50                    0      10   20      30    40   50
                                         portion (%)                                          portion (%)

                             336h                                                 MS

                        2                                                    2

                        4                                                    4

                        6
            layer no.

                                                                             6
                                                                 layer no.

                        8                                                    8

                        10                                                   10

                        12                                                   12
                             0      10   20      30    40   50                    0 10 20 30 40 50 60 70 80 90 100
                                         portion (%)                                          portion (%)

Figure 4-4 Retention profiles of Pseudomonas fluorescens-gfp and microspheres. Graphs in descending order:
4h (orange)-20h (pink)-72h (purple)-144h (blue)-336h (black)-ms (red). Data observed from counting each
single layer. Layer 1: inlet, layer 10 (or 12 respectively) outlet.
36
4.1.3 Balance of breakthrough based on the total amount of cells.
Morphological change of Pseudomonas fluorescens-gfp during the
breakthrough through saturated sand columns
Comparing the cell amount of injected inocula and the amount of recovered cells of each
experiment it was observed that
● the cell amount increased during the passage of cells through a column and
● a morphological change occurred
Both, increase of cell amount and morphological change were dependent on the duration of
carbon and energy starvation of the used culture (Table 4 and Figure 4-5). The increase was
due to cell-division in means of stress-response (see 4.1.3). The small increase of the 4h-old
culture was caused by the delayed beginning of growing of a 3 weeks old inoculum.
duration of carbon and energy Enhancement (ratio recovered Phase of cell cycle
starvation of culture [hr] to inoculated amount of cells)
x-times
4 7.5 early lag
19 123.5 logarithmic
144 13.5 stationary
336 4.4 late stationary/decay
Table 4 Increase of cell amount depending on duration of carbon and energy starvation of culture. Increase x-
times: cell amount of recovered cells compared to injected cells (inoculum).
Morphological investigations of the inocula (Figure 4-5) as well as of samples from effluent
and layers showed that fresh cells looked mostly rod-shaped whereas old cells seemed to be
of a coccoid form. The third morphological species, the ellipsoid shaped cells, was mentioned
only in this investigation in detail, further investigations focussed on the rod-shaped and
coccoid cells.You can also read