Burns Lake Community Forest Landscape Fire Management Plan
←
→
Page content transcription
If your browser does not render page correctly, please read the page content below
Burns Lake Community Forest
  Landscape Fire Management Plan

                                     May 14, 2019

                                                        Submitted to:
                Submitted by:
                                                        Frank Varga, RPF
        B.A. Blackwell & Associates Ltd.
                                                        General Manager
             270 – 18 Gostick Place
                                                 Burns Lake Community Forest
        North Vancouver, BC, V7M 3G3
                                                153 Francois Lake Drive, Box 788
               Ph: 604-986-8346
                                                    Burns Lake, BC, V0J 1E0
Email: bablackwell@bablackwell.com
                                               Email: frank.varga@blcomfor.com
B.A. Blackwell & Associates Ltd.

REGISTERED PROFESSIONAL SIGN AND SEAL

                                                       RPF PRINTED NAME
                                Bruce A. Blackwell                                     RPF 2073

                                                           DATE SIGNED

                                                             May 14, 2019

                      I certify that the work described herein fulfills the standards expected of a member of the
                   Association of British Columbia Forest Professionals and that I did personally supervise the work.

                                    Registered Professional Forester Signature and Seal

May 14, 2019                                                                         Burns Lake Community Forest LFMP i
B.A. Blackwell & Associates Ltd.

TABLE OF CONTENTS
Registered Professional Sign and Seal ........................................................................................................... i

          Identification ..................................................................................................................................... 1

          Bruce Blackwell RPF – Statement of Qualifications .......................................................................... 1

          Introduction ...................................................................................................................................... 2

          The Fire Environment........................................................................................................................ 5

   4.1       Fire Weather Rating ...................................................................................................................... 5

   4.2       Climate Change ............................................................................................................................. 9

   4.3       Fire Weather Zones ..................................................................................................................... 11

   4.4       Topography ................................................................................................................................. 14

   4.5       Fire History .................................................................................................................................. 16

   4.6       Summary of Forest Fuels ............................................................................................................ 20

      4.6.1          Current Conditions .............................................................................................................. 26

          Overview Fire Hazard and Risk Assessment ................................................................................... 33

   5.1       Provincial Strategic Threat Assessment ...................................................................................... 33

          Risk Mitigation ................................................................................................................................ 43

   6.1       Fuel Management ....................................................................................................................... 43

   6.2       Landscape Level Fuel Break Development.................................................................................. 43

      6.2.1          Fuelbreak Design Principles ................................................................................................ 44

   6.3        Proposed Fuel Treatments .......................................................................................................... 46

      6.3.1          Silviculture Regime Guidelines ............................................................................................ 50

      6.3.2          Priority Areas for Consideration ......................................................................................... 52

          Fire Management and Forest Management Objectives – The Tension Zone ................................. 54

May 14, 2019                                                                                     Burns Lake Community Forest LFMP ii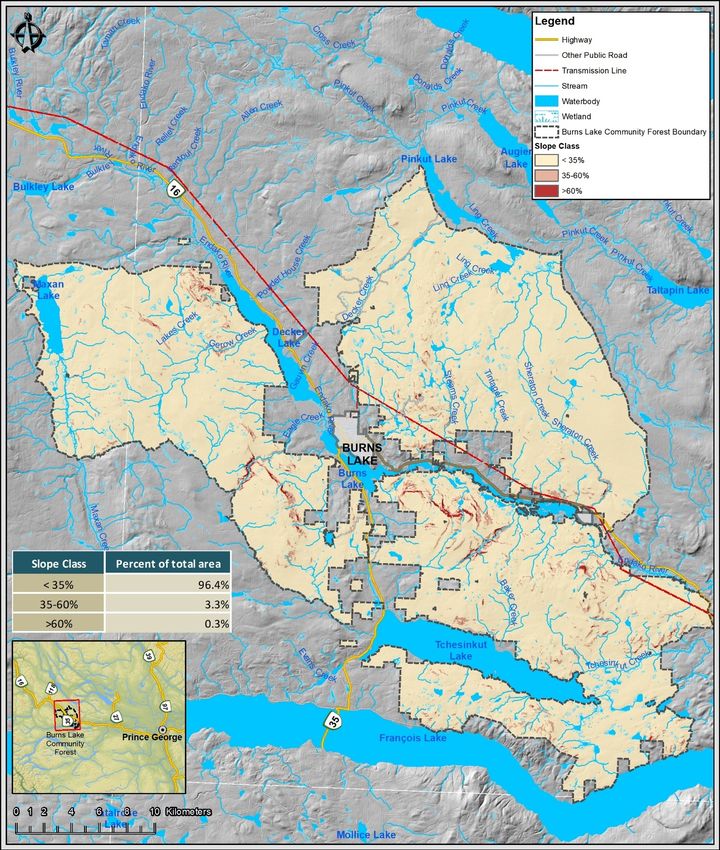
B.A. Blackwell & Associates Ltd.

   7.1         Summary of Forest Management Objectives ............................................................................. 54

           Conclusions and Recommendations ............................................................................................... 62

           References ...................................................................................................................................... 64

LIST OF TABLES

Table 1. Summary of fire size and area burned within Burns Lake Community Forest for individual
wildfires between 1920 and 2018. ............................................................................................................. 18

Table 2. Provincial fuel type summaries for the Burns Lake Community Forest. ....................................... 21

Table 3. Summary of the dead pine component in mountain pine beetle impacted stands in the Burns
Lake Community Forest by ‘stand percentage dead’ (source: Forsite Consultants Ltd.). .......................... 27

Table 4. Distribution summary of PSTA inputs: Fire Density, Head Fire Intensity and Spotting Impact. ... 40

Table 5. Summary of priority dead pine salvage and landscape level fuelbreaks identified as priority fuel
treatments within for the Burns Lake Community Forest .......................................................................... 48

Table 6. Silviculture regime for fuelbreaks, salvage treatments and operational harvest (outside of fuel
treatment areas) in stands with components of dead pine. ...................................................................... 51

Table 7. Summary of legislated management objectives including Established Visual Quality Objectives
(EVQO) and Old Growth Management Areas (OGMA) in proposed fuel break and dead pine salvage
areas. ........................................................................................................................................................... 60

Table 8. Summary of hazardous fuel types (C2, C3, C4 and M1/2*) within proposed fuel breaks and dead
pine salvage areas. ...................................................................................................................................... 61

LIST OF FIGURES

Figure 1. The number of fires and area burned summarized by decade in British Columbia (Source
MFLNRORD, 2018). ....................................................................................................................................... 3

Figure 2. Study area overview including Biogeoclimatic Zones .................................................................... 4

Figure 3. Average number of danger class days for the ‘Burns Lake 850 m weather station (summary of
fire weather data for the years 1993-2018). ................................................................................................ 6

Figure 4. Number of high and extreme danger class days for the Burns Lake Community Forest 1993-
2018. ............................................................................................................................................................. 7

May 14, 2019                                                                                         Burns Lake Community Forest LFMP iii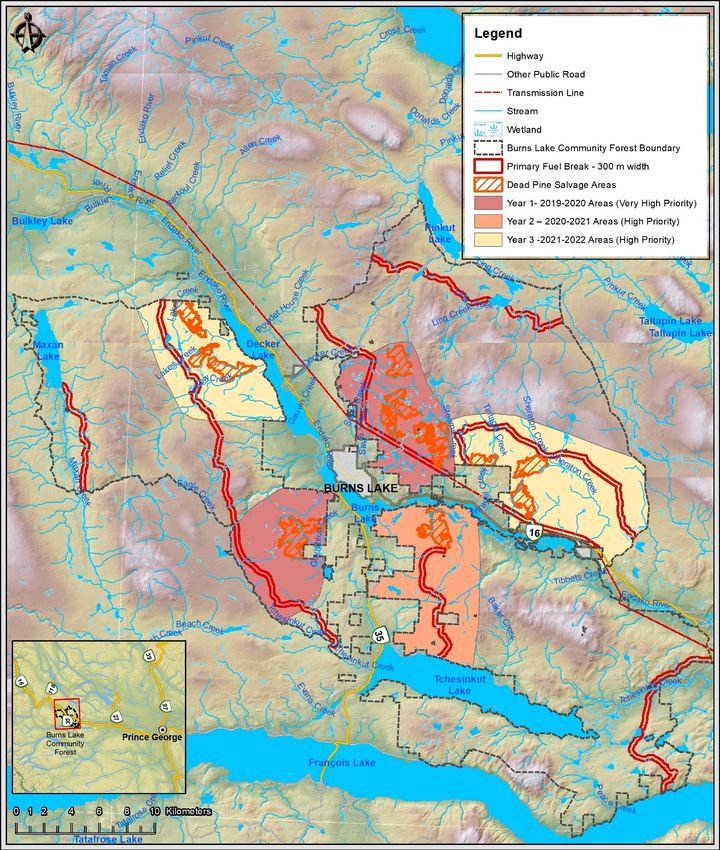
B.A. Blackwell & Associates Ltd.

Figure 5. Annual range of the Drought Code for the Burns Lake Community Forest 1993-2018. ............... 8

Figure 6. Probability of fine fuel moisture code classes summarized for each month of the fire season
(April to October 1993-2018)........................................................................................................................ 9

Figure 7. Fire Weather Zones for the Burns Lake Community Forest......................................................... 13

Figure 8. Slope classes in the Burns Lake Community Forest. .................................................................... 15

Figure 9. Number of ignitions within a 10-kilometer buffer of the study area buffer. .............................. 16

Figure 10. Study area ignition and spatial fire history ................................................................................ 17

Figure 11. Area burned summary for the study area by decade. ............................................................... 20

Figure 12. Summary of the hectares and percentage of each fuel type inventory class represented in the
Burns Lake Community Forest. ................................................................................................................... 22

Figure 13. Fuel type spatial distribution for the Burns Lake Community Forest. ....................................... 23

Figure 14. Spatial distribution of hazardous fuels in the Community Forest – C2, C3, C4; and M1/2, M3
(75% conifer and 25% deciduous)............................................................................................................... 25

Figure 15. Summary of mountain pine beetle impacted stands, including old and new grey attack within
the Burns Lake Community Forest. ............................................................................................................. 28

Figure 16. Documented rate of spread as a function of Initial Spread Index for mountain pine beetle -
affected stands (taken from the 2010 ‘Mountain Pine Beetle Information Session presentation) (Hicks,
2010). .......................................................................................................................................................... 32

Figure 17. Initial Spread Index-Rate of Spread illustration of 16 fire observations (Red attack (1-2 years
since beetle attack), grey attack (3 – 5 years since beetle attack); SF: Surface Fires; ICF: intermittent
crown fires; ACF: active crown fires) (taken from Perrakis et al., 2014). ................................................... 33

Figure 18. Provincial Strategic Threat Analysis Historical Fire Density. ...................................................... 35

Figure 19. Provincial Strategic Threat Analysis Head Fire Intensity ............................................................ 37

Figure 20. Provincial Strategic Threat Analysis Spotting Impact ................................................................ 39

Figure 21. Distribution summary of PSTA inputs: Fire Density, Head Fire Intensity and Spotting Impact. 41

Figure 22. Overall PSTA fire threat rating. .................................................................................................. 42

Figure 23. Goals of fuel break treatments. ................................................................................................. 45

May 14, 2019                                                                                         Burns Lake Community Forest LFMP iv
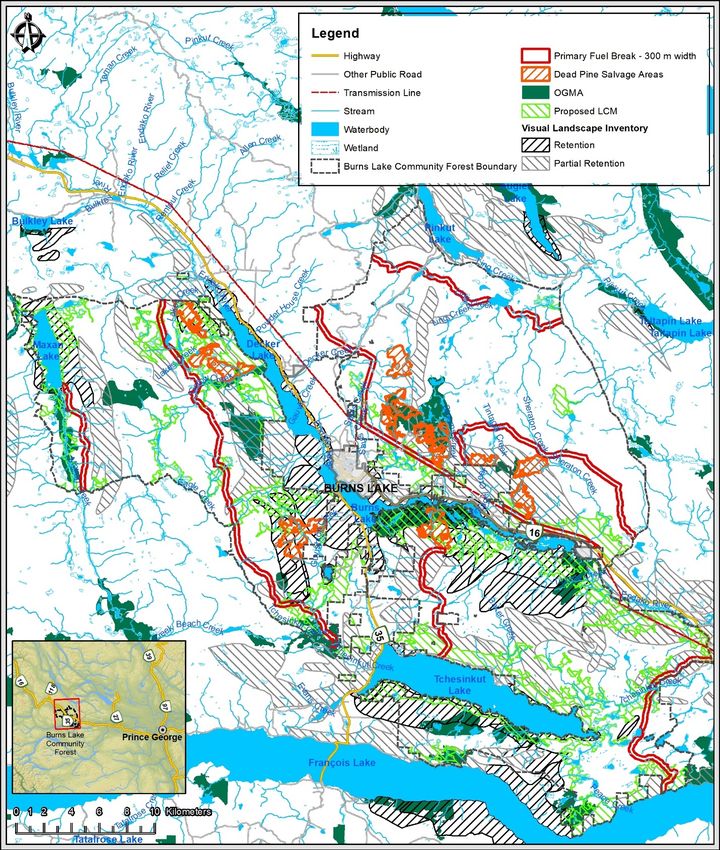
B.A. Blackwell & Associates Ltd.

Figure 24. Fuelbreaks and high-risk polygons (dead pine salvage areas) identified as a priority for
treatment within the Burns Lake Community Forest ................................................................................. 49

Figure 25. Priority fuel management and harvest zones. ........................................................................... 53

Figure 26. Current forest management FRPA objectives overlapped with proposed fuel treatments and
dead pine salvage areas within the Burns Lake Community Forest. .......................................................... 55

Figure 27. OGMA areas overlapped with proposed fuel treatments and dead pine salvage areas within
the Burns Lake Community Forest. ............................................................................................................. 56

Figure 28. EVQO areas overlapped with proposed fuel treatments and dead pine salvage areas within
the Burns Lake Community Forest. ............................................................................................................. 57

Figure 29. Proposed LCM areas overlapped with proposed fuel treatments and dead pine salvage areas
within the Burns Lake Community Forest................................................................................................... 58

May 14, 2019                                                                             Burns Lake Community Forest LFMP v
B.A. Blackwell & Associates Ltd.

         IDENTIFICATION
The opinions contained in this report are those of Bruce A. Blackwell RPF of B.A. Blackwell & Associates
Ltd. at 270-18 Gostick Place, North Vancouver, British Columbia. Mr. Blackwell is a recognized expert in
fire science and fire management within the Province of British Columbia (BC). This report provides a
review and an unbiased opinion on wildfire risk associated with the Burns Lake Community Forest
(Community Forest). The report also considers the appropriate mitigation measures to reduce the
identified risk associated with long-term fire suppression, impacts of the mountain pine beetle, and
concerns related to climate change.

         BRUCE BLACKWELL RPF – STATEMENT OF QUALIFICATIONS
The opinions and discussion contained in the enclosed report are based on 30 years of experience as a
practicing Forest Professional in BC. I am the individual responsible for the opinions expressed in this
report.

My education includes a Bachelor of Science in Forestry (BSF) and a Master of Science (MSc.) from the
University of British Columbia, specializing in Fire Science. My academic training has provided me with
the opportunity to publish numerous research and contract reports related to fire management.

Specific work experience related to forest fire suppression, fire management and forest ecology
includes:

    •   Three years with the BC Ministry of Forests Provincial Rapattack Program, specializing in fire
        suppression.
    •   Thirty years as a Professional Forester working in forest fire ecology, prescribed fire and fire
        management policy.
    •   Three years teaching the fire component of Forestry 320 (Abiotic Disturbance) at the University
        of British Columbia.
    •   Developing and teaching Applications of Fire in Ecosystem Restoration (RENR 8104) at the British
        Columbia Institute of Technology for the past seven years.
    •   Qualified as an expert in the BC Supreme Court to testify on wildfire behaviour, prescribed fire,
        fire suppression, fire ecology and fire management all related to the Greer Creek Fire (2010).
    •   Qualified as an expert to the Forest Appeals Commission to testify on wildfire hazard and
        mitigation related to the Anderson Pacific Forest Products Ltd. and harvesting abatement
        associated with Cutblock C059C3HT (Cutblock) pursuant to Timber Sale License A82206 in the
        vicinity of Port Renfrew, BC.

My consultancy has included fire related assignments throughout British Columbia on behalf of
organizations that include the Ministry of Forest, Lands, Natural Resource Operations and Rural
Development (MFLNRORD), Forest Practices Board, Ministry of Environment and Climate Change
Strategy (MoECCS), Association of BC Forest Professionals (ABCFP), BC Hydro, BC Transmission Corp,

May 14, 2019                                                     Burns Lake Community Forest LFMP 1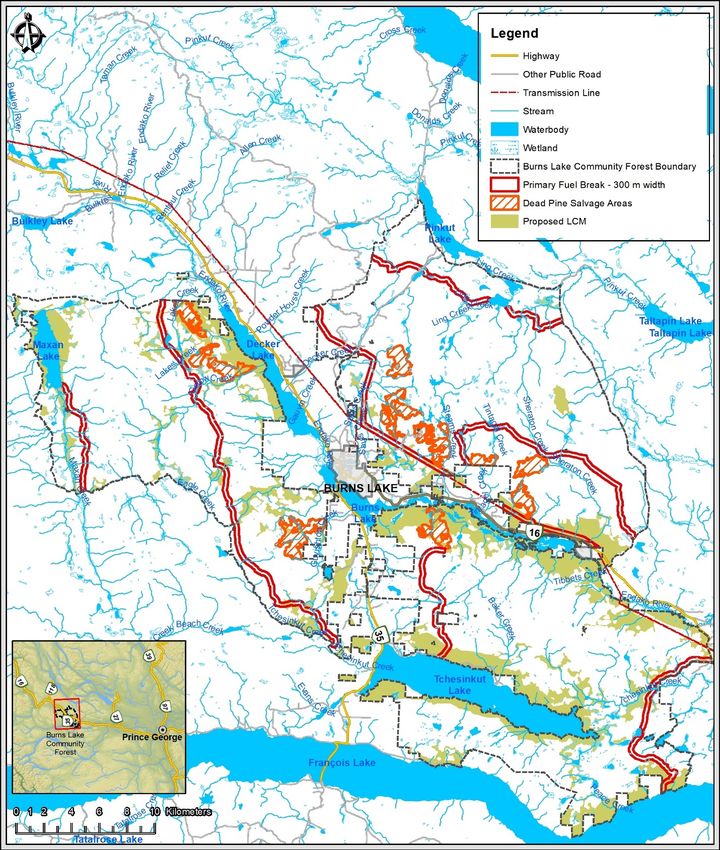
B.A. Blackwell & Associates Ltd.

numerous forest tenure holders, local governments, the private sector, First Nations, KPMG, and
PricewaterhouseCoopers. Additionally, my firm has completed fire related assignments in Alberta and
the State of Alaska, USA.

Work assignments have included detailed analyses of fire weather for prescribed burn prescriptions, fire
history studies, and fire behaviour analyses. As part of the Firestorm 2003 Provincial Review 1 conducted
by Gary Filmon P.C., O.M, I was retained to assist in the development of recommendations on fuel and
forest management practices. I was responsible for the development of a Provincial Strategic Threat
Analysis 2 for the MFLNRORD Wildfire Management Branch, focusing on the identification of
communities that were at risk from wildfire in British Columbia. Additionally, I co-authored a report
entitled “Forest Health, Fuels, and Wildfire: Implications for Long-Term Ecosystem Health” for the B.C.
Forest Practices Board (Gray and Blackwell, 2005) and was the project lead for the development of a
professional guidance document providing Interim Guidelines – Fire and Fuel Management for the
Association of B.C. Forest Professionals 3.

         INTRODUCTION
B.A. Blackwell & Associates Ltd. was retained to complete a Landscape Fire Management Plan (LFMP) for
the Burns Lake Community Forest (the study area or Community Forest) located in the Nadina Natural
Resource District. The LFMP process is aimed at determining the optimum location for fuel break
locations and types of fuel treatments that will limit fire spread and growth and provide anchors for fire
suppression operations including but not limited to aerial attack, direct attack on the ground, and or
broadcast (back) burning. This report documents the rationale and results of the fuel break fuel
treatment network design for the study area.

Wildfire seasons in BC, over the past two decades, have increased in numbers and the area burned
across the Province. Large expenditures in wildfire suppression and forest resource losses have occurred
in 2003, 2004, 2009, 2010, 2014, 2015, 2017 and 2018. Figure 1 shows the number of wildfires and the
total area burned by decade since 1910. The period 2010 to 2018 only represents 8 years of data, and
yet the area burned is larger than any other decade and the number of fires is greater than all other
decades, with the exception of 1920-1930. This is the result of two significant factors: 1) increases in fuel
loads associated with long-term fire suppression and insects and disease, (see Section 4.5 for a
description of the effects of historic fire suppression); and 2) a period of increasing drought during the
fire season. Additionally, our current forest management regime that protects static reserves, that are
often impacted by abiotic and biotic disturbance is creating additional high hazard fuels that can or are
being constrained within the current planning and legislation model.

1
  https://www2.gov.bc.ca/assets/gov/farming-natural-resources-and-industry/forestry/wildfire-
management/governance/bcws_firestormreport_2003.pdf
2
  https://www2.gov.bc.ca/gov/content/safety/wildfire-status/prevention/fire-fuel-management/psta
3
  https://member.abcfp.ca/web/Files/policies/Fire_Fuel_Management-Interim_Guidelines.pdf

May 14, 2019                                                       Burns Lake Community Forest LFMP 2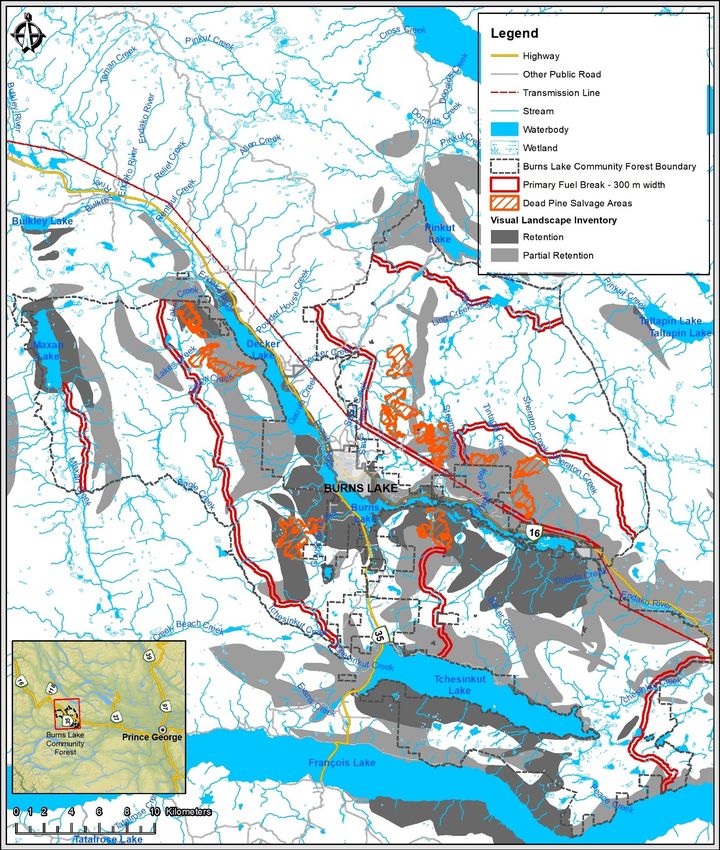
B.A. Blackwell & Associates Ltd.

                                              British Columbia Fire History by Decade
           4,500,000                                                                                                                            4500

                                                                                                                                                        Number of Fires
      Ha

           4,000,000                                                                                                                            4000

           3,500,000                                                                                                                            3500

           3,000,000                                                                                                                            3000

           2,500,000                                                                                                                            2500

           2,000,000                                                                                                                            2000

           1,500,000                                                                                                                            1500

           1,000,000                                                                                                                            1000

             500,000                                                                                                                            500

                   -                                                                                                                            0
                            1910'     1920'      1930'     1940'     1950'     1960'      1970'      1980'     1990'       2000'     2010' *
        Area Burned (ha)   184,870   2,374,615 1,879,388 1,277,290 1,916,396 1,123,936   673,436    938,758   310,129     893,507   4,000,657
        Number of Fires     263        3992      4118      1901      1530      1570       1502       1410      956         1879       2993

                                                                                                                     *2010 decade includes the 2018 fire seson

Figure 1. The number of fires and area burned summarized by decade in British Columbia (Source
MFLNRORD, 2018).

May 14, 2019                                                                                       Burns Lake Community Forest LFMP 3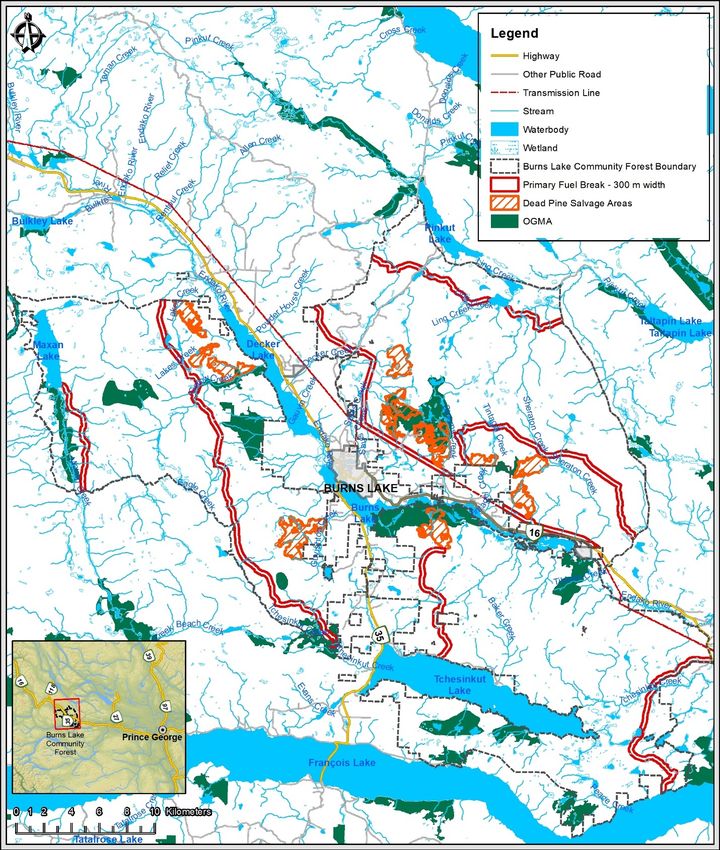
B.A. Blackwell & Associates Ltd.

Figure 2. Study area overview including Biogeoclimatic Zones

May 14, 2019                                                   Burns Lake Community Forest LFMP 4
B.A. Blackwell & Associates Ltd.

           THE FIRE ENVIRONMENT
Wildfire is a natural disturbance agent in the forest ecosystems of the Nadina Resource District. Fire
requires fuel (carbon), oxygen and heat. These three components make up the fire triangle and if one is
not present, a fire will not burn. Oxygen is present in the air and as it is used up by a fire it is replenished
quickly by wind. Heat is needed to start and maintain a fire and can be supplied through lightning or
human sources such as misused campfires and discarded cigarettes. Fuel is generally available in
adequate quantities in the forest and comes from living or dead plant materials (organic matter) and
trees and branches lying on the ground are a major source of fuel in a forest. Fuel is the only component
in the fire triangle that can be managed. Fuels can be managed through localized fuel treatments or
through the establishment of fuel breaks or containment lines.

4.1        FIRE WEATHER RATING
The Canadian Forestry Service developed the Canadian Forest Fire Danger Rating System (CFFDRS) to
assess fire danger and potential fire behaviour. Fire Danger Classes provide a relative index of the ease
of ignition and the difficulty of suppression. A network of fire weather stations is maintained during the
fire season by MFLNRORD and the recorded data is used to determine fire danger, represented by Fire
Danger Classes, on forestlands. The information can be obtained from the BC Wildfire Service (BCWS)
and is most commonly utilized by forest tenure holders, municipalities and regional districts to monitor
fire weather, restrict high risk activities when appropriate, and to determine hazard ratings associated
with bans and closures.

The BC Wildfire Act [BC 2004] and Wildfire Regulation [BC Reg. 38/2005] specify responsibilities and
obligations with respect to fire use, prevention, control and rehabilitation, and restrict high risk activities
based on these classes. Fire Danger Classes are defined as follows:

      •   Class 1 (Very Low): Fires are likely to be self-extinguishing and new ignitions are unlikely. Any
          existing fires are limited to smoldering in deep, drier layers.
      •   Class 2 (Low): Creeping or gentle surface fires. Ground crews easily contain fires with pumps and
          hand tools.
      •   Class 3 (Moderate): Moderate to vigorous surface fires with intermittent crown involvement.
          They are challenging for ground crews to handle; heavy equipment (bulldozers, tanker trucks, and
          aircraft) are often required to contain these fires.
      •   Class 4 (High): High-intensity fires with partial to full crown involvement. Head fire conditions are
          beyond the ability of ground crews; air attack with retardant is required to effectively attack the
          fire’s head.
      •   Class 5 (Extreme): Fires with fast spreading, high-intensity crown fire. These fires are very difficult
          to control. Suppression actions are limited to flanks, with only indirect actions possible against
          the fire’s head.

May 14, 2019                                                          Burns Lake Community Forest LFMP 5
B.A. Blackwell & Associates Ltd.
It is important when developing appropriate prevention programs to determine the average exposure to
periods of high and extreme fire danger. ‘High fire danger’ encompasses Danger Class ratings of 4 (High)
and 5 (Extreme). Danger class days for the study area were summarized to provide an indication of the
fire weather in the Community Forest. Considering that fire danger varies from year to year, historical
weather data can provide information on the number and distribution of days when the Community
Forest is typically subject to high fire danger conditions, which is useful information in assessing fire risk.
Figure 3 displays the average frequency of Fire Danger Class days between the months of April and
October. The data summarized comes from the ‘BurnsLake850 m’ weather station (daily data for the
years 1993 – 2018). According to Figure 3, the months with the highest average number of ‘high’ and
‘extreme’ fire danger class days are July and August. Historically, ‘high’ fire danger days also occur in
June and even extend into May and September. ‘Extreme’ fire danger class days extend only into
September. August historically has the highest number of days in the ‘extreme’ and ‘high’ classes when
compared to June, July, and September.
Figure 3. Average number of danger class days for the ‘Burns Lake 850 m 4 weather station (summary
of fire weather data for the years 1993-2018).
Figure 4 highlights the trend of increasing high and extreme danger class days over the past 25 years.
Between 1993 and 2008 the number of high and extreme danger class days was less than forty days per
wildfire season. From 2008 to 2018 the number of high and extreme danger class days has gradually
increased where since 2008, the number of high and extreme days in 5 seasons has exceed 50 days,
while in both the 2014 and 2018 seasons the number of high and extreme days has exceeded 70 days.
4
Source: BC Wildfire Service
May 14, 2019 Burns Lake Community Forest LFMP 6B.A. Blackwell & Associates Ltd.
These trends demonstrate that the window of high wildfire probability is expanding and that once a
wildfire has ignited that the potential for fire spread event days 5 is also greater, which in all likelihood
will increase wildfire severity and the total area burned in any given season.
Number of Days within Danger Class 4 and 5 (high and extreme)
April - October
90 High Extreme
Days
80
70
60
50
40
30
20
10
0
1993
1994
1995
1996
1997
1998
1999
2000
2001
2002
2003
2004
2005
2006
2007
2008
2009
2010
2011
2012
2013
2014
2015
2016
2017
2018
Year
Figure 4. Number of high and extreme danger class days for the Burns Lake Community Forest 1993-
2018.
The Drought Code (DC) is a numeric rating of average moisture content of deep, compact organic layers.
This code is a useful indicator of seasonal drought effects on forest fuels and the amount of smouldering
in deep duff layers and large logs. Similar to the number of high and extreme danger class days, the
drought code, while more variable, is also trending higher (Figure 5). This indicates that periodicity of
summer drought is increasing which also will result in higher probabilities of ignition, higher severity
wildfires, and a greater cumulative burn area.
5
Most of a fire’s growth typically occurs on a small number of days when burning conditions are conducive for spread (Podur
and Wotton, 2011).
May 14, 2019 Burns Lake Community Forest LFMP 7B.A. Blackwell & Associates Ltd.
Drought Code Annual Range (1993 - 2018)
700
600
500
400
300
200
100
0
1993
1994
1995
1996
1997
1998
1999
2000
2001
2002
2003
2004
2005
2006
2007
2008
2009
2010
2011
2012
2013
2014
2015
2016
2017
2018
Figure 5. Annual range of the Drought Code for the Burns Lake Community Forest 1993-2018.
The Fine Fuel Moisture Code (FFMC) is a numeric rating of the moisture content of litter and other cured
fine fuels. The code is an indicator of the relative ease of ignition and the flammability of fine fuel. When
the trends in the fine fuel moisture code (FFMC) are investigated, the summary of moderate, high and
extreme FFMC show similar trends in June, July, and August (Figure 6). This suggests that there are
significant periods of fine fuel curing that could contribute to ignition and spread of wildfires within the
study area. They are; however, not a good indicator of wildlife severity and/or area burned when
compared to the other variables investigated above.
May 14, 2019 Burns Lake Community Forest LFMP 8B.A. Blackwell & Associates Ltd. Figure 6. Probability of fine fuel moisture code classes summarized for each month of the fire season (April to October 1993-2018). Overall the fire weather parameters discussed above all suggest that the probability of wildfire ignition is increasing during the wildfire season based on both the number of high and extreme danger class days and the trend towards increasing drought codes. These parameters are also good indicators of increasing fire severity and increased area burned. Additionally, these results are consistent with what has been reported in other parts of BC and western North America. 4.2 CLIMATE CHANGE Climate change is a serious and complex consideration for wildfire management planning. Warming of the climate system is unequivocal, and since the 1950s, each of the last three decades has been successively warmer at the Earth’s surface than any preceding decade since 1850. The period from 1983 to 2012 was likely the warmest 30-year period of the last 1400 years in the Northern Hemisphere (International Panel on Climate Change, 2014). Numerous studies outline the nature of these impacts on wildland fire across Canada, and globally. Although there are uncertainties regarding the extent of the impacts of climate change on wildfire, it is clear that the frequency, intensity, severity, duration and timing of wildfire and other natural disturbances is expected to be altered significantly with the changing climate (Dale et al., 2001). Despite the uncertainties, trends within the data are visible. According to the Pacific Climate Impacts Consortium report Climate Change in Prince George – Summary of Past Trends and Future Projections (Picketts et al., 2009) the following projections were made for North Central BC (Prince George and surrounding area): May 14, 2019 Burns Lake Community Forest LFMP 9
B.A. Blackwell & Associates Ltd.

    •   Annual and summer mean temperatures are expected to increase 1.6˚ – 2.5˚ C by the 2050s;
    •   Mean winter temperatures are expected to increase by up to 3.0˚ C in the Prince George region;
    •   Annual mean precipitation is expected to increase 3 – 10% by the 2050s; the majority of the
        increase is expected during the winter and spring season.
    •   Summer mean annual precipitation is projected to increase or decrease, which indicates the
        inherent uncertainty in the modelling, specifically in reference to precipitation. The modelling
        shows considerably more variability in precipitation than temperature.

Similar trends are projected for the closest region to the south of Burns Lake, including the lee of the
Coast Mountains. As outlined in the BC Agriculture Climate Change Regional Adaptation series Cariboo
Region (BC Agriculture and Food Climate Action Initiative, 2014), the following climate projections for
the Cariboo Region are made:
    • Increases in average annual temperature consistent with temperature increases for the province
         of BC (approximately 1.8oC increase by 2050);
    • Annual precipitation may increase 4-6% between 2020 and 2050 with summer precipitation
         increasing 2-3% between 2020-2050;
    • Increase in winter precipitation (7% by 2050) in the form of rain and significant decreases in
         snowfall (-2 to -9% between 2020 and 2050);
    • 2.5 times the number of summer “warm days” (days in June, July and August that are warmer
         than the 90th percentile historic baseline temperatures for that day);
    • Six times the number of extremely hot days (days so hot they used to occur only once every 25
         years);
    • Increased frequency, intensity and magnitude of extreme rainfall; and
    • In the province as a whole, as average winter temperatures increase, more intense winter
         precipitation is expected to fall as rain during extreme events, and less falling as snow, potentially
         influencing watershed and groundwater storage ability, timing and amount of run-off, and soil
         and fuel moisture during early fire season.

An increased frequency of natural disturbance events is expected to occur as a result of climate change
with coincident impacts to ecosystems. These include:
    • Storm events, including catastrophic blowdown and damage to trees from snow and ice;
    • Wildfire events and drought; and
    • Increased winter precipitation may result in slope instability, mass wasting, increased peak flows
        (loss of forest cover from fire or other disturbance may increase the chance of mass wasting).

Other research regarding the intricacies of climate change and potential impacts on wildfire threats to
Canadian forests has found that:
    • Fuel moisture is highly sensitive to temperature change and projected precipitation increases will
        be insufficient to counteract the impacts of the projected increase in temperature. Results

May 14, 2019                                                        Burns Lake Community Forest LFMP 10
B.A. Blackwell & Associates Ltd.
conclude that future conditions will include drier fuels and a higher frequency of extreme fire
weather days (Flannigan et al., 2016).
• The future daily fire severity rating (a seasonally cumulative value) is expected to have higher
peak levels and head fire intensity is expected to increase significantly in western Canada. A bi-
modal (spring-late summer) pattern of peak values may evolve to replace the historical late
summer peak which is the current norm (DeGroot et al., 2013). The length of fire seasons is
expected to increase and the increase will be most pronounced in the northern hemisphere,
specifically at higher latitude northern regions. Fire season severity seems to be sensitive to
increasing global temperatures; larger and more intense fires are expected and fire management
will become more challenging (Flannigan et al., 2013; Jandt, 2013).
In summary, climate scientists expect that the warming global climate will trend towards wildfires that
are increasingly larger, more intense and difficult to control. Furthermore, it is likely that these fires will
be more threatening to Wildland Urban Interface (WUI) communities due to increased potential fire
behaviour, fire season length, and fire severity. This trend is expected to be disproportionately felt in
northern latitudes.6
4.3 FIRE WEATHER ZONES
In addition to stand characteristics such as species composition and fuel type, weather also influences
fire behaviour. Weather attributes that contribute to fire behaviour include precipitation, relative
humidity, wind and temperature. Weather can be affected by terrain and topography, resulting in
changes in fire behaviour or occurrence. The topography of the study area is variable, dominated by flat
and rolling terrain, but having limited areas that are considered steep. Topography plays a substantial
role in determining fire behaviour given the variation in slope, aspect and elevation. Slope accelerates
fire behaviour, aspect influences solar radiation loading and the effects on seasonal drying trends, and
elevation has a substantial influence on seasonality, with higher elevations staying snow covered into
June/July and lower elevations susceptible to wildfire during the early parts of the fire season
(April/May).
A network of fire weather stations throughout BC is established, and maintained by MFLNRORD and
Environment Canada. The data from these stations is typically used to determine fire danger on
forestlands and weather data can be used to predict future forecasts and track trends. Additionally, it is a
beneficial tool for Fire and Resource Managers for decision making and managing resources to suppress
wildfires. There is no MFLNRORD Nadina Resource District weather station located within the Community
Forest boundary; however, the nearest and most representative weather station located in Burns Lake
(‘BurnsLake850m’) was used in the analysis.
6All research noted was completed for Canada or globally, not for the study area. Direct application of trends may not be
appropriate, although general expectations for Canada were noted to be consistent across multiple studies.
May 14, 2019 Burns Lake Community Forest LFMP 11B.A. Blackwell & Associates Ltd.
To enhance fire hazard risk assessments for the Province, in coordination with MFLNRORD, B.A. Blackwell
& Associates Ltd. (2013) developed fire weather zone classifications for the Province using the BEC system.
These weather regions reflect differences in seasonality, mid-summer conditions and outflow
characteristics. Three fire weather zones have been identified for the Burns Lake Community Forest,
within the Nadina Resource District (Figure 7) These include the following:
• Central Plateau - Nechako Plateau
• Central Plateau - Fraser Plateau
• Interior Subalpine – NW
Overall, the complexity of climate and weather within the Burns Lake Community Forest is low and it is
expected that these weather zones would be similar in their fire behaviour potential. The topography in
combination with these weather zones indicates that the majority of the area is homogenous in fire
weather, with few topographic barriers to limit wildfire spread. Therefore; one could suggest that under
extreme fire weather conditions this entire landscape could be vulnerable to a large catastrophic
wildfire with limited control points that could be used as anchors fore wildfire suppression.
May 14, 2019 Burns Lake Community Forest LFMP 12B.A. Blackwell & Associates Ltd. Figure 7. Fire Weather Zones for the Burns Lake Community Forest May 14, 2019 Burns Lake Community Forest LFMP 13
B.A. Blackwell & Associates Ltd.

4.4     TOPOGRAPHY
The topography of the Burns Lake Community is dominated by gradual slopes (most are
B.A. Blackwell & Associates Ltd.

Figure 8. Slope classes in the Burns Lake Community Forest.

May 14, 2019                                                  Burns Lake Community Forest LFMP 15
B.A. Blackwell & Associates Ltd.

4.5      FIRE HISTORY
Fire history data was summarized by fire cause for the period between 1950 and 2018 (with no gaps
between years) for the Burns Lake Community Forest. It is worthy to note that data summarized for the
latest decade (2010s) is not a complete decade (up to 2018) and therefore estimates may appear lower
in comparison to the other (complete) decades. Fire history data was obtained from the BC Wildfire
Service. The point ignition data used in this summary represents ignitions located, as per MFLNRORD
methodology, on a grid rather than exact location; therefore, some points are located in water and
multiple points are often located on top of one another.

Figure 9 provides a summary of ignitions within 10 kilometers of the study area (both human and
lightning) for the period 1950-2018. The number of lightning ignitions has largely been stable over the
length of record. However; human ignitions have been trending upward over the length of record, and
this trend is even more pronounced in the incomplete decade period of 2010-2018. This trend is
consistent with other regions of the Province where increased summer drought and careless human
behaviour has resulted in increasing wildfire ignitions.

Figure 9. Number of ignitions within a 10-kilometer buffer of the study area buffer.

Figure 10 shows the spatial distribution of ignitions (both human and lightning caused) within the study
area and highlights the concentration of ignitions (largely human) within the developed areas, and along
the highway and road networks.

May 14, 2019                                                    Burns Lake Community Forest LFMP 16
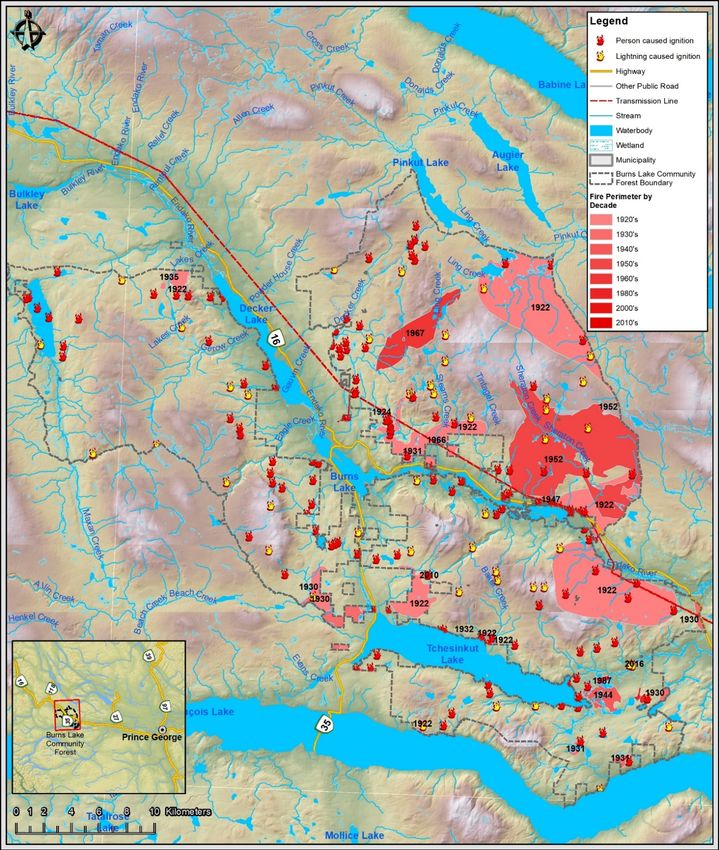
B.A. Blackwell & Associates Ltd.

Figure 10. Study area ignition and spatial fire history

May 14, 2019                                              Burns Lake Community Forest LFMP 17
B.A. Blackwell & Associates Ltd.

The study area has been impacted by three large wildfires over 10,000 ha in size over the past century;
all were human caused. A summary of individual wildfires by fire year is provided in Table 1. The largest
single wildfire occurred in 1922 and impacted 16,118 hectares. The second-largest wildfire impacted
15,134 ha in 1922 and the third largest single wildfire in 1930 impacted 16,027 ha. Other significant
wildfires (over 1,000 ha in size) occurred in 1922 (two human caused fires 2,081 ha and 1,381 ha in size)
and in 1930 (3,681 ha, human caused) and 1952 (6,472 ha, lightning caused) and 1967 (1,083 ha, person
caused). Since 1967 there have been no significant wildfires within the study area.

Table 1. Summary of fire size and area burned within Burns Lake Community Forest for individual
wildfires between 1920 and 2018.

  Fire Number           Fire Cause        Fire Year   Total Fire Size (ha)    Burned within Study Area (ha)

     R10048           Lightning               2016                      16                            15.90
     R10019           Person                  2013                      15                             5.00
     R10049           Person                  2010                       2                             1.51
     R10034           Person                  2005                       1                             0.99
     R10042           Person                  1987                      45                            44.98
     R10042           Person                  1987                      21                            21.14
     R10020           Person                  1986                      25                            24.79
     R00100           Person                  1967                  1,083                           1083.18
     R00028           Person                  1966                      24                             6.84
     R00065           Lightning               1952                  6,472                           5320.30
     R00065           Lightning               1952                       5                             3.12
        2             Person                  1947                      78                            77.87
       42             Person                  1944                    339                            338.89
       8b             Person                  1935                      21                            20.67
       8a             Person                  1932                       7                             6.52
       25c            Person                  1932                      19                             0.89
       61a            Person                  1932                       1                             1.22
       9b             Person                  1931                      56                            38.77
       3a             Person                  1931                      65                            64.61
       5a             Person                  1931                      89                            56.42
       122            Person                  1930                    105                             39.17
       87             Person                  1930                 16,027                            114.60
       104            Person                  1930                  3,681                            443.46
       62a            Person                  1929                      30                             3.47
      108b            Person                  1928                      17                            16.96

May 14, 2019                                                                 Burns Lake Community Forest LFMP 18
B.A. Blackwell & Associates Ltd.
Fire Number Fire Cause Fire Year Total Fire Size (ha) Burned within Study Area (ha)
121 Person 1928 519 300.33
73a Person 1925 10 7.65
82 Person 1924 31 31.23
189 Person 1922 57 13.81
26b Person 1922 177 158.92
43 Person 1922 43 43.11
98 Person 1922 59 56.69
25b Person 1922 1,381 605.99
33b Person 1922 10 9.38
190 Person 1922 623 48.55
25b Person 1922 66 4.14
71a Person 1922 198 0.44
179 Person 1922 2,081 1138.75
137 Person 1922 15,134 3534.00
164 Person 1922 16,118 4806.68
30a Person 1921 103 0.09
The area burned by decade within the study area is summarized in Figure 11. Of the total study area
only 20% has burned within the last 100 years. A significant area in the Burns Lake Community Forest
was burned in the 1920’s and 30’s. Thirteen human caused fires resulted in large areas burned in the
1920s. Since 1967 effective fire suppression has likely resulted in a growing fuel buildup and the
mountain pine beetle outbreak has contributed significantly to the loading of surface fuels. Additionally,
areas managed for VQO, LCM, and OGMA’s, that have been killed by the Mountain Pine Beetle and
other disturbances, create a very significant fuel hazard within these specific areas. This fuel hazard
increases both the surface fire intensity, and will 1) accelerate crown fire where there are any living
green trees in the stand and 2) will also increase spotting where there is still standing grey attack.
Overall it is the author’s opinion that this area is susceptible to wildfires of the size and behaviour that
occurred in other regions of the Bulkley Nechako in 2018. Preventative work is a must if wildfire impacts
are to be limited within the Burns Lake Community Forest tenure and to protect the WUI associated
with Burns Lake and the surrounding rural community.
May 14, 2019 Burns Lake Community Forest LFMP 19B.A. Blackwell & Associates Ltd.
Figure 11. Area burned summary for the study area by decade.
4.6 SUMMARY OF FOREST FUELS
The probability of large wildfires occurring within interior forest ecosystems is generally moderate to
high, and the associated consequences associated with a large wildfire are high. Fire behaviour is
generally influenced by fuel type, weather and topography. The Canadian Fire Behaviour Prediction
System (FBP System) 7 uses 17 national benchmark fuel types to predict fire behaviour. The FBP fuel
layer is primarily based on forest inventory data from the Provincial Vegetation Resource Inventory (VRI)
layer (polygons a minimum of 1 ha in size) and their respective land cover attributes. The Burns Lake
Community Forest includes the majority of the defined fuel types – this includes area covering non-fuel
and water (NF) (Table 2). The fuel types represented in the Community Forest are described and
summarized by total area and by percentage of the study area in Table 2. Additionally, the fuel type
distribution (by percent of the total study area) is summarized graphically in Figure 12. The most
extensive forested fuel types are C3 (fully-stocked, mature forest) which comprises approximately 46%
of the study area, followed by C7 (open uneven-age forest, crowns separated from the ground) which
comprises approximately 16% of the study area. M-1/2 (moderately well-stocked mixed stand of
conifers and deciduous species) comprises 10% of the study area, and grassland comprises 9%. The
remaining classes of fuel types in combination make up less than 17% of the total fuel type inventory.
7
Forestry Canada (1992)
May 14, 2019 Burns Lake Community Forest LFMP 20B.A. Blackwell & Associates Ltd.
Table 2. Provincial fuel type summaries for the Burns Lake Community Forest.
Wildfire Behaviour Under High
Fuel Type Description Area (ha) Percent Hazard
Wildfire Danger
Open with dense clumps, tree Almost always crown fire,
C-1 crowns extend to ground, very moderate fire intensity and rate 0B.A. Blackwell & Associates Ltd.
Wildfire Behaviour Under High
Fuel Type Description Area (ha) Percent Hazard
Wildfire Danger
Continuous, deep slash from
mature jack pine or lodgepole pine.
Surface fire, low to moderate
S-1 Slash is typically one or two seasons 2,876 3% Low - Mod
intensity.
old, retaining up to 50% of the
foliage.
Moderate slash fuel loading, cured
Surface fire, low to moderate
S-2 slash, one to two years old with 584 1% Low - Mod
intensity.
little foliage remaining.
Water Water N/A 1,829 2% N/A
No Fuel No fuel N/A 195B.A. Blackwell & Associates Ltd. Figure 13. Fuel type spatial distribution for the Burns Lake Community Forest. May 14, 2019 Burns Lake Community Forest LFMP 23
B.A. Blackwell & Associates Ltd.

Fuel types considered hazardous in terms of dangerous fire behaviour and spotting (lofting burning
embers) are C2, C3, C4, and M1/2/3. These hazardous fuel types comprise 63% of the total study area
(inclusive of water and non-fuel). It is worthy to note that C2 fuels, the highest hazard fuel type, account
for approximately 6% of the fuel type inventory within the Community Forest and the C3 fuels dominate
the study area comprising 46% of the fuel type inventory (Table 2 and Figure 12). The spatial distribution
of hazardous fuel types is illustrated in Figure 14.

When looking at the distribution of fuel types the most important consideration is to reduce the area of
dead stands, as these areas will increase fire behaviour potential. Where possible forest management
activities should promote deciduous species in close proximity to the town and important infrastructure.
Along roadsides promote lower stocking - target 600 sph. With regard to fuel types, in the hazardous C3
fuel type, promoting stands with no ladder fuel (maintaining even-age structure that self-prune) should
be a focus of management. The three key principles to manage for are:

    1) No crown contact (acceptable crown closure is
B.A. Blackwell & Associates Ltd. Figure 14. Spatial distribution of hazardous fuels in the Community Forest – C2, C3, C4; and M1/2, M3 (75% conifer and 25% deciduous). May 14, 2019 Burns Lake Community Forest LFMP 25
B.A. Blackwell & Associates Ltd.

4.6.1       CURRENT CONDITIONS
Damage and mortality associated with the major mountain pine beetle (MPB) outbreak have generally
declined throughout the Central Interior over the past five years. The main concern associated with this
forest health factor is the increased risk of wildfire due to dead and downed trees increasing the fuel
load of stands. The outbreak of the mountain pine beetle impacted the study area region-wide. Given
there are expansive areas of the Nadina Resource District inventory where lodgepole pine is a leading or
significant component of a stand, the outbreak resulted in complete stand mortality in those areas of
pure lodgepole pine and selective mortality of lodgepole pine in mixed stands. This has resulted in large
accumulations of crown and surface fuel in many areas of the District that will readily burn during the
fire season. These dead fuels will also contribute to higher levels of spotting.

Additionally, there have been smaller outbreaks of defoliators (mostly impacting aspen), bark beetles
and other insects and disease, however these have not significantly impacted the overall fuel loading
and wildfire risk to the same extent as the mountain pine beetle outbreak.

The lack of prescribed fire since the mid-eighties has resulted in accumulations of post-harvest slash.
Previously after burning, low fuel loadings prevented the spread of wildfires through cutblocks and
acted as a barrier to fire spread. The accumulations of harvest slash in the absence of prescribed fire
now facilitates easy spread and growth of wildfires within recent cutblocks. This has been further
exacerbated by mountain pine beetle salvage which has accelerated the growth of the harvested area
and typically has resulted in even higher slash loads associated with the mortality and economics
salvage harvesting. Moving forward harvest abatement needs to be more focused on the removal of fine
slash (
B.A. Blackwell & Associates Ltd.
Table 3. Summary of the dead pine component in mountain pine beetle impacted stands in the Burns
Lake Community Forest by ‘stand percentage dead’ (source: Forsite Consultants Ltd.).
Stand Percentage Dead Stand Hectares Dead
0-9% 130
10-19% 456
20-29% 3,300
30-39% 5,263
40-49% 3,737
>=50% 10,064
In BC, there are three commonly referred to classes of mountain pine beetle attacked pine (Ministry of
Forests, Lands and Natural Resource Operations, 2019):
• Green attack: Adult beetles have found a new host tree and tunneled underneath the bark to lay
their eggs. The tree dies soon after but the needles stay green for several months.
• Red attack: The needles have turned red as a result of the beetle killing the tree by mining the
layer between the bark and the wood, cutting off the tree’s supply of nutrients. This stage occurs
between a few months up to two years from time since death.
• Grey attack: The needles have fallen off the tree and only the bare branches remain. The decaying
tree has become more susceptible to falling or being blown down. This stage is three or more
years following death. Grey attacked stands are described as having the following physical
characteristics: no small tree branches, a developing understorey, and a higher likelihood of
blowdown (Marek, 2007). Grey attack stands are further distinguished as ‘old’ and ‘new’ grey
attack within the spatial inventory.
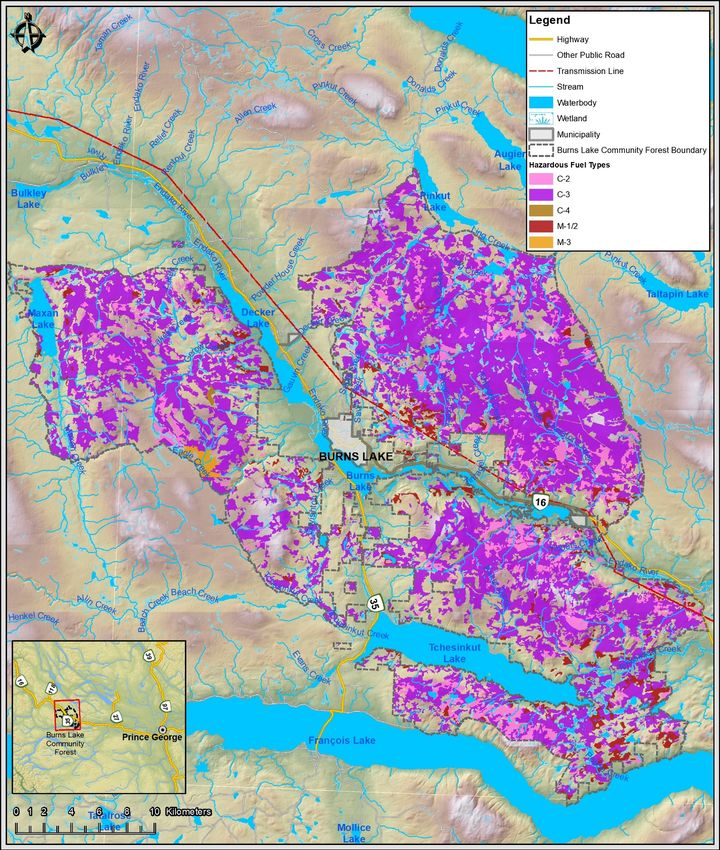
The spatial distribution of the grey attack (% mortality) classes within the Burns Lake Community Forest
is illustrated in Figure 15. There is currently no red attack remaining in the study area.
May 14, 2019 Burns Lake Community Forest LFMP 27B.A. Blackwell & Associates Ltd. Figure 15. Summary of mountain pine beetle impacted stands, including old and new grey attack within the Burns Lake Community Forest. May 14, 2019 Burns Lake Community Forest LFMP 28
B.A. Blackwell & Associates Ltd.

Following the 2003, 2004, 2009, 2010, 2014,2015, 2017 and 2018 wildfire seasons in BC, wildfire
observations of mountain pine beetle -attacked stands have included the following:

    •   Torching of red-attack trees more readily than green-attacked trees;
    •   An increased occurrence in spotting;
    •   Increased fire intensity in grey and red-attack stands; and
    •   Decreased effectiveness in suppressing fires through the employment of conventional
        suppression techniques due to radiating heat, high intensities, a mass volume of spotting.

Since 2003, the Province experienced numerous wildland fire events within mountain pine beetle affected
stands of differing mountain pine beetle phases.

Succession of Lodgepole Pine Fuels Post MPB
Lodgepole pine stands experience significant alterations to their physical, chemical, and structural
components after a mountain pine beetle attack. Although scientists and land managers have typically
described the temporal progression of mountain pine beetle attack in the three phases (green, red, and
grey), each forest stand has its own unique characteristics across space and time. It is also important to
note that although a forest stand may be characterized as a grey- attack stand, this does not mean that
100% of the trees within the stand are dead or that 100% died simultaneously. Normally, the majority of
a stand will exhibit the characteristics of either a green, red, or grey-attack mountain pine beetle stand
and it is generally assessed qualitatively.

Based on the available inventory information it is evident that approximately one third (27.5%) of the
forest stands within the Community Forest were affected by mountain pine beetle and exhibit
characteristics commonly referred to as ‘grey attack’. These stands also contained components of
unaffected green trees.

Live tree density and basal area are greatly reduced in mountain pine beetle affected stands versus
unaffected stands which causes significant modifications in stand conditions (Klutsch et al., 2009). A
study in Oregon found that in unthinned stands, 50% of mountain pine beetle affected trees had fallen
within nine years and 90% within 14 years (Mitchell and Preisler, 1998). Litter depth is also altered and
the median litter depth has been observed to be significantly greater in stands that were 3 – 7 years
post initial attack versus unaffected stands and stands 0 – 3 years post-infestation (Klutsch et al., 2009).
Additionally, the maximum height of understorey vegetation is typically significantly higher in plots 4 – 7
years after initial infestation compared to unaffected stands. An important result of both the loss of
needles and fallen trees is increased solar radiation and air movement to surface fuels which can
contribute to the lowering of overall fuel moisture (Kaufmann et al., 2008). Various studies have
examined the dynamics of moisture content of trees and time since death. For example, the sapwood of
pine trees one-year post mountain pine beetle attack will have significantly lower moisture content (as
low as 16%) versus unaffected trees (above 85%) (Reid, 1961). Sapwood moisture content varies in
attack stages where reductions in moisture content decreases from unaffected trees to red-attacked
trees, and further observed reductions in the sapwood moisture content of trees in the grey attack stage

May 14, 2019                                                      Burns Lake Community Forest LFMP 29
B.A. Blackwell & Associates Ltd. (Lewis and Hartley, 2006). Additionally, moisture content is also significantly reduced in the foliage of pine trees post-mountain pine beetle attack (Jolly et al., 2012). Following mountain pine beetle attack, lodgepole pine needles typically turn from green to red over a period of one year and within this period, foliar moisture content can decrease down to 10 – 12% or lower (Jolly et al., 2012). It has also been suggested that a red mountain pine beetle attacked stand with a fine fuel moisture content (FFMC) of ≥ 91 would be operationally treated as if it were 20 m tall standing cured grass. Another important characteristic of the fuels present in various phases of post-mountain pine beetle attacked forests relates to spotting which is linked to the drying out of needles, branches, and bark. Spotting is the process by which embers are carried aloft by thermal air currents from a fire front which then ignite flammable material beyond the advancing fire. Trees in varying degrees of decay can also exhibit sloughing bark, loose branch material, and persistent cones which provide material that can be transported in convective columns during fire spotting (Jenkins et al., 2012). Observations indicate that mountain pine beetle attacked forests can spot from crown to crown and spotting to 300 m is common, and 400 m or more is possible (Marek, 2007). This was corroborated with BC Wildfire Service personnel and included observations of higher ignition probability from long-range flying embers within mountain pine beetle attacked stands (Schroeder and Mooney, 2012). Fire Behaviour of MPB Affected Lodgepole Pine Mountain pine beetle-attacked stands create modifications to forest structure that directly relates to fire behaviour by impacting overall fuel accumulation and structure/composition, fuel moisture content, air movement, as well as chemical composition of foliage. These various attributes impact fire behaviour in various ways and are generally dependent on the attack phase and other factors. For example, litter depth is generally greater in mountain pine beetle-attacked stands compared to non-attacked stands and could result in higher flame lengths and rates of spread (Klutsch et al., 2009). Fire behaviour can be altered by changes in fuel loads, the development of ladder fuels, and through the lowering of relative humidity with increases in surface windspeed in mountain pine beetle impacted stands (Klutsch et al., 2009). The fire behaviour for mountain pine beetle red-attacked stands has been characterized as very hot with fast initial burning and quick dissipation of heat (Marek, 2007). These observations have been supported by BC Wildfire Service personnel and in 2006 it was reported that the aggressiveness of wildfire in red- attack stands had increased, creating safety concerns for forest firefighters and the public (Wiensczyk, 2006). Wildfire in grey-attack stands has been described to support very hot surface fires and generally, wildfires in grey-attack stands are difficult to action with conventional tactics (Lavoie, 2008). Wildfires in grey-attack stands challenge and defeat conventional suppression techniques due to radiating heat, high intensities and mass volume of spotting. Additionally, safety concerns with wildfire in grey-attack stands are associated with likelihood for crown fire initiation, high rate of spread, spotting distances, volume of spotting material (bark flakes/chunks), head fire intensities (HFI), and line resistance for firefighters (Schroeder and Mooney, 2012). Surface fireline intensity is typically highest for old- mountain pine beetle and grey attack stands under all moisture scenarios and grey-attack stands are predicted to crown before May 14, 2019 Burns Lake Community Forest LFMP 30
You can also read