AA Research: Standard Metrics for Transport and Driver Safety and Fuel Economy - Prepared by: William Frith and Peter Cenek
←
→
Page content transcription
If your browser does not render page correctly, please read the page content below
AA Research: Standard Metrics for Transport
and Driver Safety and Fuel Economy
       Prepared by: William Frith and Peter Cenek

       Contact: Opus International Consultants Central
       Laboratories, 138 Hutt Park Road, PO Box 30845, Lower
       Hutt

       Date version: November 2012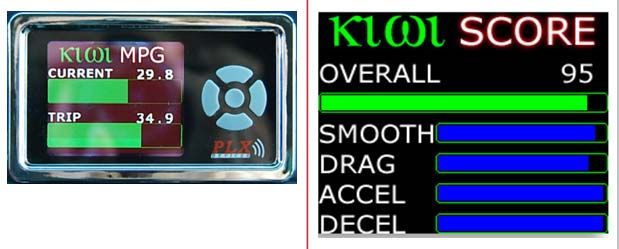
Executive summary
This report looks at the main factors by which drivers, while actually carrying out their
driving task, can influence vehicle fuel economy, and the metrics by which their
performance may be measured. It also looks at how these metrics are currently used in
the real world by drivers, fleet managers and driver trainers, and the use of insurance
based incentives to encourage good behaviour. The report points out that fuel efficient
behaviours though generally improving safety, may in some situations, become unsafe
behaviours if employed overzealously. Any scheme using metrics to measure the
effectiveness of the human element in fuel efficient driving needs to monitor safety
parameters related to acceleration/deceleration and driver distraction.
The main factors influencing vehicle consumption are:
The behaviour of the driver while driving;
Route choice;
Route topography and traffic conditions;
Vehicle choice, including tyres and differences related to automatic and manual
transmission;
Use of heaters, air-conditioning systems, audio systems etc.;
Vehicle maintenance including tyre pressures; and
Loading of vehicle.
The driver’s direct influence on fuel consumption is limited. About 82% of the energy
expended in propelling a vehicle goes in heat lost in the engine. The remaining 18% which
is the mechanical energy out of the motor is evenly split with 6% going towards
overcoming rolling friction, 6% powering acceleration and 6% overcoming rolling drag
which is speed related. Drivers can reduce only the mechanical energy out of the motor.
Overcoming rolling friction is related to tyre-choice rather than driving so the driver’s direct
influence on fuel consumption is capped at around 12% maximum.
Drivers can influence the rolling drag by staying within the speed envelope in which air
resistance is least, and minimise powered acceleration. They can also minimise stops and
idling, where mechanical energy is coming out of the motor with no kilometres being
travelled. Key driver behaviours related to fuel consumption are:
Speed during highway driving;
Frequency and intensity of braking and acceleration;
Frequency of stops; faster acceleration may be acceptable if it means that a stop is
avoided;
Timing of gear changes, but only for manual vehicles;
Following distance; and
Idling
These behaviours need to be carried out safely.
3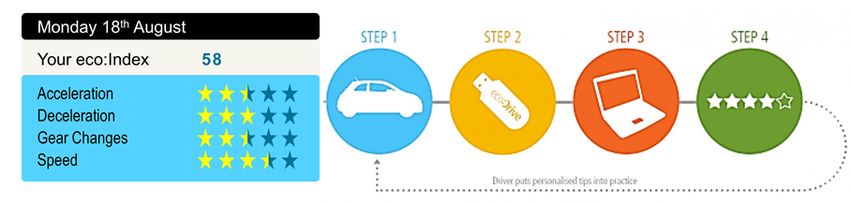
Except speed, all these behaviours relate, in the final analysis, to acceleration. Stops and
idling are obviously substantively a product of smoothness of driving and, to some extent,
speed so these factors are not mutually independent. The main ranking of factors is in fact
a dichotomy; speed is more important on the highway and smoothness of driving is more
important in the city.
This is clearly a function of the lower opportunity for acceleration and deceleration and
attendant stopping and idling on the highway. In all situations aggressive driving leads to
more fuel use than less aggressive driving.
This report has discussed the relative importance of the identified factors in terms of how
much of the variability in fuel efficiency they explain. However, this has not been done very
precisely. This is because at present, the information is not available in the literature to do
it precisely.
The impact of fuel saving driver behaviours can generally be expected to result in an
improvement in safety. These benefits can accompany such behaviour improvements as
less speeding and reductions in harsh braking events and. a more anticipatory driving
style. However there are some safety issues including
Advice to accelerate rapidly to target speed1 could be taken too literally and could
cause shorter safety distances in traffic if not combined with proper anticipation.
Maintaining a constant speed, if misunderstood, could lead to insufficient safety
margins because of delayed slowing down.
Applying engine braking too early may result in a different pattern to that of normal
traffic and increase the risk of a rear-end collision.
Avoiding stopping could cause problems, as if it is applied near pedestrian
crossings or intersections without a clear view.
Another safety issue which has not yet been fully explored is the potential driver distraction
associated with driver feedback devices for providing fuel efficient driving messages.
There is great scope for placing more fuel efficient driving technology into the vehicle itself
so that it happens automatically without driver intervention. This is appearing now with
such measures as technology that turns engines off rather than idling, sophisticated
engine management systems and vehicle stability control which dampen overly aggressive
driving and speed limiting technology. There is also the possibility of setting up the on
board computer to use its intelligence to advise the driver, and when required, managers
and course supervisors both for fuel efficiency and safety purposes. This has already been
done by Fiat (Eco-drive), Ford (EcoMode) and aftermarket suppliers like PLX Devices,
maker of the KIWI device.
At present metrics are used to varying extents in New Zealand by:
Individuals who utilise dashboard displays or propriety systems like the “Kiwi” to
gain feedback to improve their driving.
1
This action may not necessarily be correct in all situations.
4 Trainers in “eco-driving” courses who use various displays to feedback information
to drivers.
Fleets to improve fleet safety and fuel economy-in this case they are often
combined with information from GPS.
In the case of fleets both here and overseas the following is generally true:
Speed and idling time are used;
Other metrics are little used or emphasised;
GPS is used;
Most claim insurance savings but this is just through normal channels like “no
claims bonuses”;
Safety gains are claimed; and
Fuel consumption is measured.
There is little systematic analysis of engine management system outputs as yet although
some have plans to do so.
Accelerometers seem to be used not very much and there have been reports of issues
with heavy vehicle accelerometers. Generally, the approach is relatively ad hoc, but
holistic including route choice, tyre care, vehicle maintenance etc. Drivers are generally
compared via their fuel economy on similar routes. The approach seems generally
effective in bringing down fuel consumption and improving safety. However, there appears
to be room for improvement
What data is held and in what form is unclear, and it is propriety data. The more organised
fleets have driver training providers who, on a proprietary basis, analyse the data.
Apart from the normal “no claim bonuses”, insurance incentives for safe economical
driving are unknown here, and, if they exist, very uncommon elsewhere. Overseas there
are “pay as you drive” schemes where the cost of insurance is on a per kilometre driven
basis, but this is an incentive to reduce driving rather than increase driving quality.
Looking at the future, it is recommended that a pilot study be done where driver
performance as measured in a bespoke instrumented car is compared with performance
as measured by Fiat’s Eco-drive or an aftermarket device like KIWI. In the event of Eco-
drive being used:
The project would indicate how Eco-drive assessment compares with measured
performance in the driver’s own car.
It will also allow evaluation of the latest European based eco-driver assessment
metrics in the New Zealand context and facilitate inter-country comparisons.
For the AA it will provide direction for the way forward to either entering into a licensing
agreement with Fiat to use the Eco-drive software but adapted for use on AA training
vehicles or developing a New Zealand-specific alternative to which the AA will retain the
rights.
5Contents
PART 1: WHAT IS THE MINIMUM SET OF FACTORS THAT CAN VALIDATE CLAIMS
OF PERSONAL ECO-DRIVING BEHAVIOUR SUCH THAT TRAFFIC, VEHICLE-TYPE,
AND TOPOGRAPHIC CONFOUNDERS CAN BE EXCLUDED? .........................................7
1 Introduction to Part 1 .......................................................................................................9
2 The mechanisms by which drivers can minimise fuel consumption .............................10
3 The driving behaviours which have most impact on fuel consumption .........................11
4 The impact of fuel saving driver behaviours on safety ..................................................12
5 How training can produce fuel saving behaviours ........................................................13
6 The measurement of the influence of various behaviours on fuel efficiency ................14
7 The roles of speed, acceleration/deceleration, stops and idling ...................................15
7.1 Speed ..................................................................................................................15
7.2 Acceleration/deceleration ...................................................................................16
7.3 Stops/idling .........................................................................................................16
7.4 An illustration of potential fuel savings and the relative importance of these
factors under different conditions ..................................................................................17
8 Driving behaviour parameters (or metrics) for driver/manager feedback .....................19
8.1 Introduction .........................................................................................................19
8.2 Measurement of Metrics and the use of OBD ....................................................20
8.3 Discussion of Metrics associated with factors pertinent to fuel efficient driving .20
8.4 The place of engine revolutions in this discussion .............................................22
8.5 Comparing the results of different providers of fuel efficient driving tuition........23
9 Possible future directions ..............................................................................................24
10 Discussion .....................................................................................................................26
11 Conclusions ...................................................................................................................27
References ...........................................................................................................................28
PART 2: THE PRACTICAL USE OF METRICS TO PROVIDE DRIVER, FLEET
MANAGER, AND TRAINER FEEDBACK, INCLUDING INSURANCE INCENTIVES ........31
12 Introduction to Part 2 .....................................................................................................33
13 Examples of commercial devices to provide feedback on fuel efficiency of driving from
the engine management system..........................................................................................34
14 Examples of Metric and GPS use by fleets of vehicles.................................................37
14.1 Examples from the literature and the internet ....................................................37
14.2 Some Fleet Case Studies ...................................................................................38
14.3 Summary of information from vehicle fleets on the use of fuel efficient driving
metrics and GPS. ..........................................................................................................43
14.4 Data integrity and multiple drivers ......................................................................43
15 Insurance-based incentive schemes .............................................................................44
16 Summary .......................................................................................................................46
17 Where to now? ..............................................................................................................49
17.1 Discussion...........................................................................................................49
17.2 Recommendation ................................................................................................50
References ...........................................................................................................................51
6Part 1: What is the minimum set of factors
that can validate claims of personal eco-
driving behaviour such that traffic, vehicle-
type, and topographic confounders can be
excluded?
Prepared by: William Frith and Peter Cenek
Contact: Opus International Consultants Central
Laboratories, 138 Hutt Park Road, PO Box 30845, Lower
Hutt
Date version: September 2012
71 Introduction to Part 1
This report is Part 1 for an AA Research project on Standard Metrics for Transport and
Driver Safety and Fuel Economy. It looks at the factors that have the greatest impact in
determining driver fuel efficiency whilst excluding confounding factors that are not under
the driver’s influence. The question is concerned with identifying which factors have the
greatest impact in determining driver fuel efficiency whilst excluding confounding factors
that are not under the driver’s influence. The work attempts to rank the relative importance
of the identified factors in terms of how much of the variability in fuel efficiency they explain
so that factors with a minor influence can be excluded
The brief for this project calls for a minimum set of factors that can provide feedback to
drivers and validate claims of personal eco-driving behaviour such that traffic, vehicle-type
and topographic confounders can be excluded. The aim is to assist driver trainers,
particularly those in a fleet context, by developing a “gold standard” for the measurement
of improvements in fuel efficiency and safety achieved by interventions that modify driver
behaviour (in particular education) (Personal Communication, Peter King, undated).
The Standard Metrics for Transport and Driver Safety and Fuel Economy project, of which
this report forms part, concerns only the behaviour of drivers while driving. Other
behaviours related to minimising the overall use of fuel but not directly driving related are
excluded. Thus the project and this report do not consider the following important aspects
of behaviour which impact upon fuel consumption:
Route choice;
Vehicle choice (including tyres), apart from differences related to automatic and
manual transmission;
Use of heaters, air-conditioning systems, audio systems etc.;
Vehicle maintenance including tyre pressures; and
Loading of vehicle
It also is not concerned with topography or traffic conditions except where there is an
effect on the relative importance of the human factors related to fuel consumption as in the
case of highway versus city driving.
It is also a basic assumption of this project that the reduction of fuel consumption is a
worthwhile activity.
Part 2 of the project (into which this part leads) is concerned with how the critical factors
identified in Part 1 can be collected at least effort and cost to provide feedback to drivers
and performance monitoring to third parties (referred to in this report as the manager). A
major component of Part 2 will be an examination of GPS-based fleet management
systems to identify their ability to meet the above requirements.
92 The mechanisms by which drivers can
minimise fuel consumption
Fuel efficiency as defined by Haworth and Symons (2001) is:
“the work output of an engine in terms of vehicle travel as a function of
the energy content of the fuel expended in the operation of the vehicle.”
(p.6)
Thus the fuel economy of a vehicle (defined as the litres of fuel used per kilometre
travelled; the quantity we want, in the end, to improve) can be enhanced by improving the
fuel efficiency of driving.
Haworth and Symons (2001) provide the diagram shown in Figure 1 derived from DOT
(1998)2
Figure 1: Energy consumption by petrol engines
Perusal of this diagram gives an immediate rough idea of how drivers can influence fuel
efficiency once they have committed to a particular vehicle3. The options by which drivers
can influence fuel consumption relate to reducing the mechanical energy out of the motor.
They can influence the rolling drag by staying within the speed envelope in which air
resistance is least, they can minimise powered acceleration and they can minimise stops
where mechanical energy is coming out of the motor with no kilometres being travelled.
The behaviours that best achieve these influences will be further discussed in the following
sections.
2
In the subdivision of “mechanical energy out of the motor”, “rolling friction” has the same meaning as rolling
resistance and “rolling drag” has the same meaning as aerodynamic drag. The three subdivisions add up to
17% rather than 18% presumably due to rounding error.
3
Rolling friction is not influenced by driving but by choice of tyre and tyre pressure.
103 The driving behaviours which have most
impact on fuel consumption
The driving behaviours that most affect fuel consumption are well understood and have
been discussed in the literature by a number of authors including, McGordon et al (2011)
Berry (2010), Smit et al (2010), Haworth and Symons (2001), Gonder et al (2011), Van der
Voort and Dougherty (1998) and earlier Evans (1979). An excellent overview of the
literature is available in Luther and Baas (2011) who, as well as looking at the behaviours,
look at the effectiveness of measures to improve them. The behaviours described in the
listed articles do not differ markedly by year of publication or by author, differing mainly in
the nature of the metrics used to describe the behaviours. As an example, Gonder et al
(2011) mention:
Speed during highway driving.
Frequency and intensity of braking and acceleration
Frequency of stops – faster acceleration is acceptable if it means that a stop is
avoided
Timing of gear changes - but only for manual vehicles
Following distance
Idling
The last five in the list above are all related to braking and acceleration.
114 The impact of fuel saving driver behaviours
on safety
The impact of fuel saving driver behaviours can generally be expected to result in an
improvement in safety. Luther and Baas (2011) quote a number of studies to illustrate this
point, using both heavy and light vehicles. These benefits accompany such behaviour
improvements as less speeding and reductions in harsh braking events. While pointing out
that hard evidence is lacking, Luther and Baas also express a belief that benefits are also
“likely to arise from a more anticipatory driving style” (p14).
However Luther and Baas (2011) do also mention some potential safety issues which
would need to be taken into account in any teaching of fuel efficient driving. These
potential issues (p15) included:
A principle of rapid acceleration to target speed4 could be taken too literally and
could cause shorter safety distances in traffic if not combined with proper
anticipation.
Maintaining a constant speed, if misunderstood, can lead to insufficient safety
margins because of delayed slowing down.
Applying engine braking too early may result in a different pattern to that of ‘normal
traffic’ and increase the risk of a rear-end collision.
The principle of ‘avoiding stopping’ could cause problems, as if it is applied near
pedestrian crossings or intersections without a clear view ‘it is possible that the
learner driver’s observation skills may be inadequate’
Another safety issue which has not yet been fully explored is the potential driver distraction
associated with driver feedback devices for providing fuel efficient driving messages.
Gonder et al (2012) refers to a US National Renewable Energy Laboratory (NREL) review
of existing devices which found that the cognitive effort needed to interpret the visual and
audible feedback was not excessive and that visual systems should be designed to limit
the time when the driver’s eyes are not on the road to less than two seconds.
In terms of safety, any management tool using metrics should also include controls for
violation of safety parameters associated with acceleration/deceleration and driver
distraction.
4
This action may not necessarily be correct in all situations.
125 How training can produce fuel saving
behaviours
It can be taken as read that these behaviours, when carried out appropriately, do reduce
fuel consumption and thus greenhouse gas emissions which are directly linked to fuel
consumption. Fiat (2010) estimates that in a study by Fiat, on average eco-driving reduced
fuel consumption by 6% with the top 10% of drivers achieving a 10% reduction. However,
the evidence of success in attempts to teach these behaviours is mixed (Luther &Baas,
2011; Smit, 2010). The aforementioned authors found few soundly constructed or peer
reviewed studies among the many attempts to teach these behaviours which have claimed
positive results. It is thus important to obtain metrics which are readily measurable to be
able to tell the difference between success and something less than success.
How these behaviours may be shaped in a fleet situation, to produce better fuel economy
is covered thoroughly in Baas (2012). This work will be covered in more detail in Part 2 of
this project which looks at how metrics may be used most effectively to produce driving
with lower energy intensity.
136 The measurement of the influence of various
behaviours on fuel efficiency
Driving behaviours may influence the fuel consumption of vehicles as drivers go through
the various stages which characterise typical driving cycles. Driving cycles in this context
are simulations of driver behaviour under various conditions, based on field observations.
The behaviours taken account of typically include speed, acceleration deceleration and
stopping behaviour. A good reference is Smit et al (2010). Driving cycles have various
parameters which relate to fuel consumption, which may be used as measures or “metrics”
for the effect of behaviour on fuel consumption when other influences can be removed.
Typically the relative influences of behaviours are estimated by putting vehicles through
various simulated driving cycles under different conditions. These simulations may be
supplemented with results from real world driving. Thus all estimates of factor influence
carry with them the background under which the driving cycles and/or real world driving
are carried out.
Such studies using different driving cycles with different types of driving under different
conditions are generally how the relevant information is obtained. Other examples are
Berry (2010), Gonder et al (2012), Smit et al (2010) and Tamsanya et al (2004).
147 The roles of speed, acceleration/deceleration,
stops and idling
7.1 Speed
In the literature, speed per se is generally considered the more important factor in highway
driving. This is because in highway driving, speed variations, with their associated
acceleration/deceleration related economy losses, are less important than in urban driving.
Haworth and Symons (2001), referring to highway speeds, state that fuel consumption
increases with speed because the total tractive force needed to drive the vehicle increases
and aerodynamic resistance increases more than uniformly with speed. This results in the
sort of fuel economy curve shown in Figure 2 from ACC/LTSA (2000, p. 63) where fuel
economy increases with speed until the vehicle reaches around 55mph (~ 90km/h) where
the increasing air resistance impact starts to overcome other factors and drive fuel
economy down.
The lower fuel efficiency at lower speeds occurs because of engine friction, tyres, and
accessories (such as power steering) (TRB, 1998). These impacts vary with the vehicle,
and accordingly the optimal speed also varies with the vehicle but the shape of the curve
is generally similar to that in Figure 2. Thus, on the highway, keeping speed at around the
optimal point for the particular vehicle being driven is important (subject to keeping within
legal limits). One can notice from Figure 2 that the shape of the curve is fairly flat at the top
followed by a fairly sharp drop off. Therefore travel below the optimum has fewer negative
consequences than travel above the optimum. Owner’s manuals may provide information
on the optimal speed for the vehicle.
For non-highway driving, speed is less important compared with smoothness of driving
although as one can see from the curve, fuel economy drops off considerably below about
25mph or ~40km/h.
15Figure 2: Fuel efficiency as a function of speed –model year 1988-1995, automobiles and light-duty
trucks
Source: Davis (1997, p3-51, cited in TRB, 1998, p69).Note: 1 mph = 1.609 kph; 1 US gal = 3.8 L, The New
Zealand Light Vehicle Fleet had an average age of 12.7 years in 2011 (MOT, 2011)
7.2 Acceleration/deceleration
Haworth and Symons (2001), quoting (Robertson et al., 1998), point out that travelling at a
constant speed in modern vehicles allows the engine management system to optimise the
fuel flow into the combustion cylinder. This minimises fuel consumption and emissions.
Therefore, whenever accelerations/decelerations occur some optimality is lost.
7.3 Stops/idling
Acceleration/deceleration losses are accentuated when a stop occurs; eliminating stops is
therefore more important than the acceleration/deceleration both on the highway and in
cities (Gonder et al., 2012). Also (Evans, 1979) pointed out that fuel used while idling is of
great importance in urban driving. Evans (1979) for vehicles of that time estimated that
“a driver who stops, idles for 30 seconds while waiting for a light to change and
accelerates to resume a speed of 60km/hr uses about 70ml more fuel than a driver
who passes through the signal at a constant speed of 60km/hr” (p 397).
Thus stops are best avoided by judicious driving through faster (acceptable in this case) or
slower acceleration. The advent of technology which automatically stops engines when the
vehicle is stationary (e.g. Kia’s Idle Stop-Go (ISG) technology) will in the future help
ameliorate the problem of fuel being burnt while idling.
167.4 An illustration of potential fuel savings and the relative
importance of these factors under different conditions
This section illustrates what might be achieved and under what circumstances using the
work of Gonder et al (2011).
Gonder et al carried out a simulation assessment of fuel consumption optimised by
eliminating stop-and-go driving and unnecessary idling, and adjusting acceleration rates
and cruising speeds to ideal levels. They then followed up with real world assessments
using different driving techniques. To compare vehicle simulations over each real-world
cycle and its corresponding ideal cycle, a midsize conventional vehicle model was used.
The comparisons of “ideal” cycle performance and real world performance were done by
calculating fuel savings on an “ideal” driving cycle, at varying levels of Kinetic Intensity (KI)
and journey length and comparing with real world performance.
KI is a metric linked to the magnitude and frequency of accelerations. The bigger the
magnitude and frequency of accelerations, the larger the value of the Kinetic Intensity. The
unit of Kinetic Intensity is reciprocal distance. KI tends to be larger for city driving and
smaller for highway driving.
To identify maximum potential fuel savings, the project simulated five driving cycles, in
conditions of differing KI .which eliminated stop-and-go driving and unnecessary idling and
adjusted acceleration rates and cruising speeds to “ideal” levels as shown below:
Eliminate stop-and-go and idling within each trip.
Set the acceleration rate to 3 mph/s. (~5km/h/s)
Set the cruising speed to 40 mph (~60km/h).
Continue cruising at 40 mph (~60km/h) until the trip distance is reached.
These “ideal” levels were chosen by Gonder et al so are somewhat arbitrary in nature.
The results indicated a fuel savings potential in excess of 30%-40% if the “optimization”
above was carried out over the whole of each cycle. The authors concluded that while
these results would not be achievable in reality without full automation of vehicles and
traffic control, it was promising to note such significant fuel savings from cycle
modifications alone with no changes to the vehicle or powertrain.
Other key results of their work were:
In city driving decreased acceleration, decreased stops and decreased idle are
more important fuel savings sources than speed which comes into its own with
highway driving.
Overall, the results indicated that in real world driving conditions substituting
efficient driving techniques for the most aggressively driven trips could result in fuel
savings of around 20%, and improving more moderate driving styles could reduce
fuel consumption by 5%–10%.
17 For city trips over 20mph (30km/h)5, higher average acceleration was associated
with higher fuel consumption while for highway trips; higher speed was the
strongest indicator of poor fuel consumption. This was contributed to by the large
aerodynamic drag accompanying high driving speed which exacerbates higher fuel
consumption.
5
Under 20mph, fuel economy was unsatisfactory even with low acceleration.
188 Driving behaviour parameters (or metrics) for
driver/manager feedback
8.1 Introduction
This section will look at the metrics available for use to input feedback on the driver’s level
of fuel efficient behaviour. Drivers may receive feedback in three main contexts:
As drivers of fleet vehicles ‘
Through education programmes
As private motorists.
This feedback needs to be given to drivers as they drive and after they drive. It also needs
to be available to, and used by managers and course providers. These metrics include the
factors which have already featured in this report. Possible future directions in influencing
drivers towards more fuel efficient driving will also be discussed.
This report has already discussed the relative importance of the identified factors in terms
of how much of the variability in fuel efficiency they explain. However, this has not been
done very precisely. This is because at present, the information is not available in the
literature to do it precisely.
Some of the metrics can be presented as rates or absolute numbers, and over various
time periods. The time periods can vary from instantaneous to averages over an entire
journey. Where rates are chosen, there is a choice of rates. The minutiae of this are not
discussed here but would need to be grappled with, and implemented, so that driver
distraction issues do not later emerge.
As discussed earlier the importance of the factors to which these metrics relate is
dependent on how road conditions and the metrics themselves interact. For example the
number of stops and the duration of stops clearly have an interactive impact on fuel
economy. How they are used will differ between whether the purpose is driver feedback or
course manager feedback.
For the manager a system whereby the vehicle can be interrogated post journey to give a
normalised view of the driver’s fuel-efficient performance would seem a sensible option.
Systems which attempt to do this have been implemented in a number of places and will
feature in Part 2 of this project.
Whether the information is being imparted to the driver or the manager, simple, easily
assimilated messages are essential if the message is to reach its target successfully.
Thus simple metrics like stops, acceleration, speed, duration of stops should be those
directly communicated. Some of the metrics described here are complex and hard to grasp
if you are not an automotive engineering professional and should not be used for lay
communication. The more complex metrics have value as quantities used by engine
management systems to inform the driver or manager about the fuel efficient driving
characteristics of the driver.
198.2 Measurement of Metrics and the use of OBD
It is very important that metrics are easily measured. It is fortunate these days that there
are a large range of metrics that can be obtained easily from engine management
systems. All modern vehicles have complex engine management systems which are
accessible via an On-board Diagnosis (OBD) port. Through this port it is possible to
download a large array of information including much which is relevant to the degree of
fuel economy driving being shown by the driver. There are already hardware and software
systems on the market which use the OBD port in this way. It would seem that the use of
this information, linked with Global Positioning Systems (GPS) and Geographical
Information Systems (GIS) would be a sensible way for managers to evaluate the fuel
efficient driving of their students. Thus it would be sensible that metrics used be
harmonised with the outputs of the OBD ports of vehicles. It is the intention that this aspect
and the use of OBD port information be discussed in more detail in the Part 2 of the
project.
8.3 Discussion of Metrics associated with factors pertinent to fuel
efficient driving
This part of the report will discuss metrics associated with the most important factors
related to fuel efficient driving in sections headed by the name of the relevant factor. The
order of presentation of the factors is of no significance.
8.3.1 Factor 1: Speed
The available metrics are instantaneous speed, average speed (where the time unit
includes time stopped) and travel speed (where time stopped is not included).
Instantaneous speed is already available in all vehicles via the speedometer, while the
others are also available from displays on some vehicles.
The crucial thing about speed is keeping it within the envelope of optimality of the vehicle.
There are various ways in which this can be communicated to the driver. The most simple,
but probably not very effective (as anecdotally, handbooks are little used), is instruction in
the driver handbook. The handbook for the 2004 Toyota Avensis states that the most
economical speed for the car is 90km/hr. Another very simple method is attaching stickers
to the scale on the speedometer of an existing vehicle to indicate the most efficient speed
range of the vehicle, or better having such an indication as standard equipment. Figure 3
shows a speedometer display augmented to advise the driver to keep the vehicle in the
range 20 to 60 mph.
20Figure 3: Speedometer display augmented with speed advice
Other options are voice advice or alarms to indicate when you are outside the economical
speed range for the vehicle.
8.3.2 Factor 2: Smoothness of driving (Related to frequency and intensity of
braking and acceleration)
Metrics used in drive cycle studies include Kinetic Intensity (KI), defined in O’Keefe et al
(2007), Positive Kinetic Energy (PKE), defined in Nairn et al (1994) time to collision
(defined in Gonder et al., 2011) and simple acceleration and deceleration (negative
acceleration). These metrics are all directly related to smoothness of driving.
KI is a metric linked to the magnitude and frequency of accelerations. The bigger the
magnitude and frequency of accelerations, the larger the value of the Kinetic Intensity. KI
is the measure of driving smoothness used by Gonder et al (2011). The unit of Kinetic
Intensity is reciprocal distance.
Positive Kinetic Energy is the energy required per unit of distance by a vehicle when it
increases its speed and is obviously related to acceleration and thus smoothness of
driving. Its units are m/sec2. An example of its use as a metric follows in Figure 4 from
Nairn et al (1994) quoted in Haworth and Symons (2001).
Figure 4: Estimated effects of Positive Kinetic Energy (PKE) and average speed on fuel
consumption. From Nairn et al., 1994
21Howarth and Symons (2001) observe from Figure 5 that for average speeds within the
range of 40 km/h to 90 km/h, the fuel consumption rate varies significantly with PKE.
Compared to steady speed (PKE = 0), fuel consumption at PKE = 0.8 m/s2 is increased by
between 50% and 100%. At each part of the speed range in Figure 5 the change with PKE
is much greater than the change with varying speed6 indicating the importance of
acceleration to fuel economy.
Time to Collision (TTC) is a metric defined by Van der Voort et al (2001) as the following
distance from one car to another divided by the speed difference, where the second car is
approaching the first from the rear. The metric is directly related to driving smoothness as
a driver trying to drive smoothly will not approach a vehicle from behind in such a way that
rapid braking is necessary to avoid a collision.
In the case of use as an indicator to drivers, raw acceleration would appear to be
preferable to the three more technical measures as the understanding by drivers would be
higher. A bar chart of instantaneous speed would also provide good information on the
acceleration or lack thereof happening at any particular time.
Acceleration/deceleration or smoothness of driving can be measured by the variation in
speed (i.e. the smoother the driving the lower the speed variation). Developing user-
friendly ways to present this to drivers and encourage improved driving may be worth
consideration.
Another visual indicator to the driver of smoothness of driving is the instantaneous fuel
consumption of the vehicle which is available as a bar chart on most modern vehicles. This
reading also provides, arguably the best metric for gauging economical driving.
8.3.3 Factor 3: Stops (associated with smoothness of driving)
The obvious metric here is number of stops.
8.3.4 Factor 4: Idling time (associated with smoothness of driving)
The obvious metric here is time spent idling.
8.4 The place of engine revolutions in this discussion
The “rev-counter” may be used by drivers as a rough indicator of how hard the engine of
their vehicle is working. Thus it has a place as one of the tools drivers may use to regulate
their driving. However, it is vehicle specific, and is not generally recognised in the literature
as a metric used in reducing fuel consumption. It is rather used as an indicator in manual
6
This is consistent with speed having a greater real world impact in rural areas than
acceleration/deceleration as there is much less acceleration/deceleration going on in rural driving than urban
driving.
22vehicles of when to time gear-changes. An example is advice given by Renault to drivers
of Renault vehicles.7
Shift down at approximately 1,000rpm
Shift up to the next gear at approximately 2,000rpm in diesel vehicles and at
2,400rpm in a petrol engine
At 50kph, you should already be in fourth or fifth gear.
8.5 Comparing the results of different providers of fuel efficient
driving tuition
Tuition providers’ claims may be hard to evaluate as to their veracity. To compare the
results of different providers it would be best if common criteria were used involving
common metrics with some sort of a normalisation procedure for traffic conditions and
terrain. Otherwise complicated experimental approaches, like those of Van der Voort and
Dougherty (1998), would be required.
7
http://www.renault.com/en/capeco2/eco-conduite/pages/eco-conduite.aspx Viewed 20/9/2012
239 Possible future directions
This report is about measuring and ranking the factors for driver fuel economy, for driver
feedback and for use by managers and course providers to assess the degree of fuel
efficient driving being exhibited by their staff and students and to compare the efficacy of
different methods. It must be remembered however, that any such ranking of factors in
terms of impact in determining driver fuel efficiency is a relatively blunt instrument.
The logical end would be the vehicle taking over, obviating the need for driver feedback.
Gonder (2012), suggests for the future that
“the vehicle intelligently selects optimal acceleration/ deceleration rates and cruising
speeds. The driver's full attention could then remain on the road to ensure safe
operation (rather than occasionally diverting attention to a feedback device).”
This of course already happens to some extent within engine management systems. The
precursors of such vehicle intelligence related systems have already been used in Europe
as part of experiments involving design of a fuel-efficiency support tool. The impact of such
a tool has been described in Van der Voort and Van Maarseveen (undated). The support
tool includes a normative model that formulates optimal driver behaviour to minimise fuel
consumption. If actual behaviour deviates from this optimal behaviour, the support tool
presents advice to the driver on how to change driver behaviour. The advice is presented
by a human machine interface an example of which is shown in Figure 5 from Van der
Voort and Van Maarseveen (undated).
Figure 5: The human machine interface for extended advice
Van der Voort & Dougherty (1998) considered that to be effective in improving fuel
economy, a driver support tool must exhibit the following characteristics:
provide the driver with clear, accurate and non-contradictory information
take into account the present context of the vehicle
24 place no requirements on the driver which are too high to safely combine with the
actual driving task
work within both urban and non-urban environments.
The experimental tool used inputs readily available from existing technologies. These
included vehicle speed, engine speed, clutch, gear position, accelerator position, steering
angle, braking force and headway. These were combined with specific parameters
peculiar to the vehicle being used including the fuel consumption map of the engine, gear
ratios, vehicle weight, rolling resistance and air resistance. One of the basic aims of the
advice system is to keep the operation of the engine as close to optimal as possible,
particularly during acceleration.
A driving simulator experiment (see Van der Voort & Dougherty, 1998) revealed that
drivers were able to reduce fuel consumption by 16% compared with ‘normal driving’ and
by 7% compared with driving fuel-efficiently without support. The experiment being
European, where manual transmissions predominated at the time, dealt only with manual
vehicles. Presumably a system for automatic vehicles would need to include optimisation
of gear change control mechanism of the automatic transmission.
For the manager, once such a support tool was validated, evaluation of the student could
be carried out simply by looking at compliance with the support tool. This has already been
done by Fiat as reported in Fiat (2010) where the engine management systems of Fiat
vehicles were set up to feed back to the drivers and also give a star rating to drivers. This
sort of information was also in a form to be easily available to managers or course
supervisors.
2510 Discussion
The main factors related to a driver’s fuel efficient driving are:
Speed (most important in highway driving)
Smoothness of driving
Number of stops (related to smoothness of driving )
Duration of idling (related to number of stops and also smoothness of driving)
Stops and idling are obviously substantively a product of smoothness of driving and, to
some extent, speed so these factors are not mutually independent.
It is clear from the literature, that on the highway, speed is of greater importance than
smooth driving with the opposite occurring in the city. This is clearly a function of the lower
opportunity for acceleration and deceleration and attendant stopping and idling on the
highway. In all situations aggressive driving leads to more fuel use than less aggressive
driving.
This report has discussed the relative importance of the identified factors in terms of how
much of the variability in fuel efficiency they explain. However, this has not been done very
precisely. This is because at present, the information is not available in the literature to do
it precisely.
The main ranking of factors is in fact a dichotomy; speed is more important on the highway
and smoothness of driving is more important in the city.
In terms of smoothness of driving acceleration/deceleration, stops and idling time are all
important and very interactive and should all feature in information presented to the driver.
It is not possible to rank these due to the interaction and the dependence of what drivers
can achieve on the conditions in which they are driving. However, this should be no bar to
progress in improving the fuel efficiency of the driving population.
Any scheme using metrics to measure the effectiveness of the human element in fuel
efficient driving needs to monitor safety parameters related to acceleration/deceleration
and driver distraction.
There is great scope for placing more fuel efficient driving technology into the vehicle itself
so that it happens automatically without driver intervention. This is appearing now with
such measures as technology that turns engines off rather than idling, sophisticated
engine management systems and vehicle stability control which dampen overly aggressive
driving and speed limiting technology. There is also the possibility of setting up the on
board computer to use its intelligence to advise the driver, and when required, managers
and course supervisors both for fuel efficiency and safety purposes. This has already been
done by Fiat as reported in Fiat (2010) which will be reported on in greater detail in the
task 2 report.
2611 Conclusions
1. The main factors related to a driver’s fuel efficient driving are:
Speed (most important in highway driving)
Smoothness of driving
Number of stops (related to smoothness of driving )
Duration of idling (related to number of stops and also smoothness of driving)
2. The relative importance of these factors varies with the driving conditions. There are a
number of metrics which relate to these four factors. These metrics differ in their level
of clarity to the lay person who may be a driver or a manager
3. In terms of driver feedback, the usefulness of the various metrics is fairly well-known.
4. In terms of manager feedback, the relative usefulness of various metrics may become
clearer after the examination of their use in the fleet context which is within the scope
of Part 2 of this project.
5. With the advent of On-board Diagnosis Ports on vehicles a wealth of information is
available including information related to fuel economy and driver behaviour. This
information, in conjunction with GPS and GIS information, has the potential to make
much clearer the driver’s contribution to fuel economy on a particular journey. It is
sensible that any set of metrics be compatible with outputs from these diagnostic ports.
6. It is possible at this stage to provide a minimum list of factors, as listed above. It is not
however possible at this stage to provide a minimum set of metrics.
7. In terms of safety, any management tool using metrics should also include controls for
violation of safety parameters associated with acceleration/deceleration and driver
distraction.
8. Part 2 of the project will reveal to what extent such tools are available and being used
in practice.
27References
Baas PH (2012) Fleet management commitment to fuel efficiency. NZ Transport Agency
research report 482.
Berry, Irene Michelle (2010) The Effects of Driving Style and Vehicle Performance on the
Real-World Fuel Consumption of U.S. Light-Duty Vehicles, Master's Degree Thesis,
Massachusetts Institute of Technology
Evans, Leonard (1979) Driver Behavior Effects on Fuel Consumption in Urban Driving
Human Factors: The Journal of the Human Factors and Ergonomics Society vol. 21 no. 4
389-398
Fiat (2010) Eco-driving uncovered-The benefits and challenges of eco-driving, based on
the first study using real journey data
http://www.fiat.co.uk/uploadedFiles/Fiatcouk/Stand_Alone_Sites/EcoDrive2010/ECO-
DRIVING_UNCOVERED_full_report_2010_UK.pdf Viewed 20/9/2012
Gonder, Jeffrey, Earleywine, Matthew and Sparks, Witt (2011) Final Report on the Fuel
Saving Effectiveness of Various Driver Feedback Approaches, .National Renewable
Energy Laboratory, Golden, Colorado www.nrel.gov/vehiclesandfuels/vsa/pdfs/50836.pdf
viewed 11/6/2012
Gonder, Jeffrey, Earleywine, Matthew and Sparks, Witt (2012) Analysing Vehicle Fuel
Saving Opportunities through Intelligent Driver Feedback Presented at the 2012 SAE
World Congress, Detroit, Michigan
Haworth, Narelle and Symmons, Mark (2001) The Relationship Between Fuel Economy
And Safety Outcomes, Monash University Accident Research Centre, Report No. 188,
Victoria, Australia http://www.monash.edu.au/miri/research/reports/rpts01.html Viewed
14/5/2012
King, Peter (undated) Personal communication Five-Star (eco) Driver Research
Programme Report and Directions
Luther, Rebecca and Baas, Peter (2011) Eco-Driving Scoping Study .Report prepared for:
Energy Efficiency and Conservation Authority, Wellington New Zealand
McGordon, A J, Poxon, J E W, Cheng, C, Jones, R P, Jennings, P A (2011) Development
of a driver model to study the effects of real-world driver behaviour on the fuel
consumption Proceedings of the Institution of Mechanical Engineers, Part D: Journal of
Automobile Engineering, November 2011; vol. 225, 11: pp. 1518-1530.
Ministry of Transport (2011b) The aging of the New Zealand light vehicle fleet.
http://www.transport.govt.nz/ourwork/climatechange/Documents/Light-vehicle-sector-
report-aging-of-the-fleet-June-11.pdf viewed 6/6/2012
Nairn, RJ and Partners, Segal, L Economic Consultants and Watson, H (1994). Victorian
transport externalities study 3. Strategies for reducing emissions of greenhouse gases and
ozone precursors from land-based transport. Report prepared for EPA, Melbourne.
O’Keefe, Michael P.; Simpson, Andrew; Kelly, Kenneth J.; and Pedersen , Daniel S. (2007)
Duty Cycle Characterization and Evaluation Towards Heavy Hybrid Vehicle Applications
28Presented at the 2007 SAE World Congress and Exhibition, 16-19 April 2007, Detroit,
Michigan.
Smit, Robin; Rose, Geoffrey and Symmons, Mark (2010) Assessing the Impacts of
Ecodriving on Fuel Consumption and Emissions for the Australian Situation, Australasian
Transport Research Forum 2010 Proceedings, Canberra, Australia
Tamsanya, Sukanya; Chungpaibulpatana, Supachart; Atthajariyakul, Surat and
Limmeechokchai, Bundit (2004) Study on the Influence of Bangkok Driving Characteristics
on Exhaust Emissions and Fuel Consumption of Gasoline Passenger Car, The Joint
International Conference on Sustainable Energy and Environment (SEE) , Hua Hin,
Thailand
Van der Voort, M.C and Dougherty, M.S (1998) A new generation fuel efficiency support
tool. Paper presented at the TRB A1F03/A1F06 Joint Summer Meeting, Ann Arbor,
Michigan. 2-4 August 1998.
Van der Voort, Mascha and Van Maarseveen, Martin (undated) Design and evaluation of a
new-generation fuel-efficiency support tool Department of Civil Engineering &
Management, University of Twente, Enschede, The Netherlands
http://www.utwente.nl/ctw/aida/research/publications/voort_maarseveen.pdf, Viewed
28/6/2012.
29Part 2: The practical use of metrics to provide
driver, fleet manager, and trainer feedback,
including insurance incentives
Prepared by: William Frith
Contact: Opus International Consultants Central
Laboratories, 138 Hutt Park Road, PO Box 30845, Lower
Hutt
Date version: November 2012
3112 Introduction to Part 2
This report is Part 2 of an AA Research project on Standard Metrics for Transport and
Driver Safety and Fuel Economy. This report will look at how the types of metrics
described in Part 1 of the project are used in practice, in New Zealand and overseas, in
situations where fuel efficiency is a prime driver of their use. It will also detail where
discounts on insurance costs have accompanied the successful achievement of fuel
efficiencies. These discounts are not from special insurance schemes but in all cases are
just the result of safety gains, achieved along with the fuel efficiency gains reducing
insurance premiums through such time-honoured mechanisms as no claim bonuses.
The main emphasis will be on fleet users but feedback systems such as the American
“Kiwi” system from PLX Devices and that provided by Fiat for its own vehicles will also be
discussed. These information presentation systems using metrics give an idea of the
potential of devices in this area. Such devices are becoming increasingly, and more
cheaply, available to interested individuals and to fleet managers and driver educators.
Overseas there are schemes called Pay As You Drive (PAYD) insurance which
incentivises drivers to reduce their driving, but these are outside the scope of this project.
Outside of insurance, the fuel efficiency schemes looked at in many cases include
elements outside the scope of this project. These include improving route choice, travel
distance reduction, improving vehicle choice, and improving the aerodynamic qualities of
vehicles by covering loads. In many cases the fuel efficiencies obtained and quoted are
overall figures, so the impact of driver related measures cannot be separately assessed.
It is also seldom that all the metrics are being used, and in many cases they are not in fact
being used as metrics, but more as triggers. For instance many fleets speed limit their
vehicles to below the speed limit and thus access fuel efficiency gains as well as safety
gains and avoidance of expenditure on speeding tickets.
Similarly the other measure commonly used in fleets is turning off the engine instead of
idling. Measures related to acceleration are less reported, with problems with congestion
being dealt with often by route choice.
A number of vehicle fleets use GPS sometimes in conjunction with engine information to
aid them in their endeavours. GPS is a help in detecting stationary vehicles, where an
automatic alert can be sent to drivers to turn off the engine. Vehicle tracking can also
provide information on what the engine is doing, speed, acceleration etc. and the driver’s
identity.
The amount of this information utilised by fleets varies widely and there is room for
improved usage overall.
Much of the information in this area is of an anecdotal nature, from web sites, many of
them of advocacyr organisations, or the non-peer reviewed literature. Peer reviewed
information is not common. Thus comprehensive, demonstrated to be technically sound,
information is rare.
3313 Examples of commercial devices to provide
feedback on fuel efficiency of driving from the
engine management system
There are systems available which use information from the engine management systems
of vehicles to inform users and their managers /teachers on their fuel economy. Two
examples of this are the Fiat “Eco-drive “ system and the Kiwi System from PLX Devices
(http://www.plxdevices.com ).
Fiat Eco drive uses the engine management system to give drivers “eco-indices” and star
rating using fuel efficiency metrics.
The system is proprietary (the free Fiat-specific software was developed jointly by
Fiat and Microsoft).
Although it may be completely sound, exactly how the ratings are calculated is not
public information.
It is also not known how or if an allowance for safety is incorporated into the
system.
However, it is, arguably, the European gold standard for the assessment of fuel-efficient
driving.
Figure 6 illustrates the type of information available from eco-drive and also how the
information is obtained- i.e. via a computer analysing information collected using a flash
drive from the engine’s diagnostic port.
Figure 6: Information available from the Fiat eco-drive system; and how it is obtained
As can be seen an overall eco-index is provided along with star ratings against four
metrics. At the time when Fiat (2010) was written Fiat was on track to produce a real time
version for drivers in 2011. A version for fleet managers was produced in 2010.
The Kiwi provides the displays shown in Figure 7 for drivers again providing an overall
score and ratings against four metrics. The Kiwi system shares the same unknown
quantities as have been detailed earlier for the Fiat eco-drive system.
34Figure 7: Displays provided for the Kiwi Device
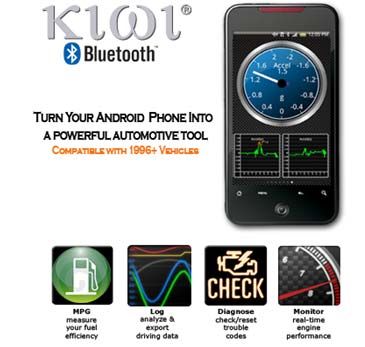
PLX Devices also markets a Bluetooth interface and an Android APP whereby engine
management system information can be displayed in real time on an Android smartphone
as well as downloaded and analysed using the phone. Figure 8 shows a screen shot of an
Android Phone displaying analyses of such data.
Figure 8: Screen shot of an Android Phone displaying analyses of engine management system
data
PLX Devices also provides free software to analyse data from the engine management
system and an OBD 2 port to Wi-Fi adapter which can communicate with Apple mobile
products.
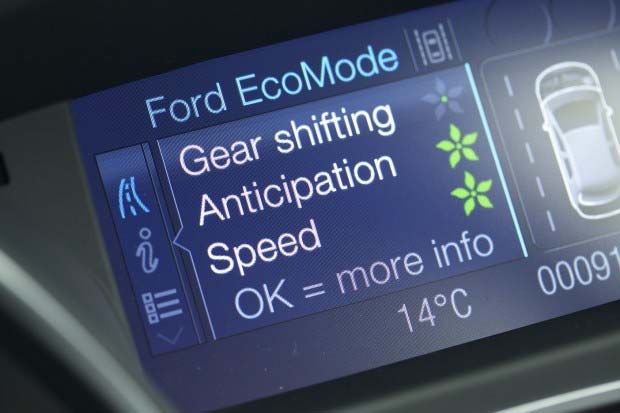
Ford is also using metrics to provide feedback to drivers on fuel efficient driving. Ford
EcoMode (http://media.ford.com/article_display.cfm?article_id=33965 ) is a software
application available on the Ford Focus that rates driver behaviour impacting fuel economy
and provides simple hints on how to improve behaviour to the driver.. EcoMode uses
35You can also read