Decarbonising road freight in Europe: A socio-economic assessment - European Climate Foundation - Actu Environnement
←
→
Page content transcription
If your browser does not render page correctly, please read the page content below
European Climate Foundation

Decarbonising road freight in Europe:
A socio-economic assessment

  Final Report                August   Cambridge Econometrics   js@camecon.com
                              2018     Cambridge, UK            www.camecon.com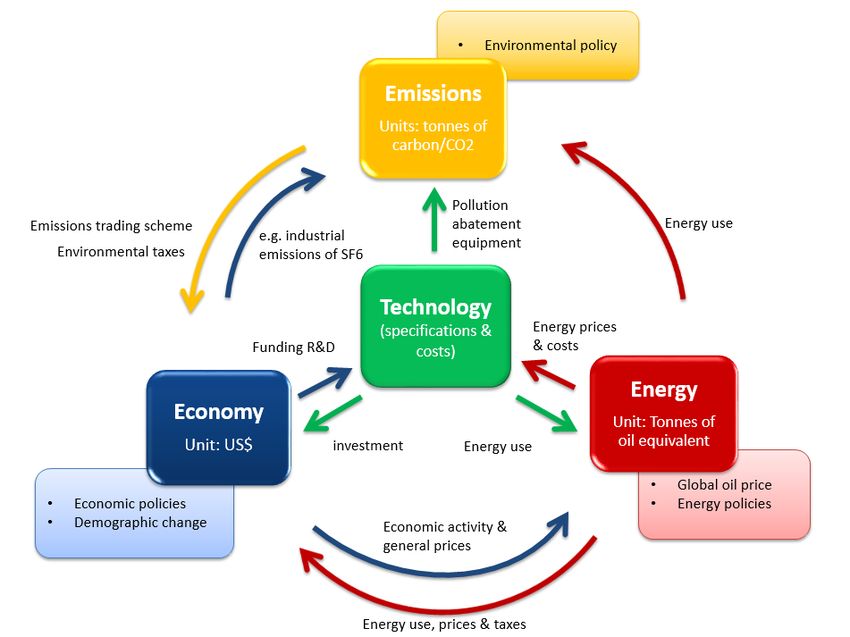
Decarbonising road freight in Europe: A socio-economic assessment

   Our mission is to provide clear insights, based on rigorous and independent economic analysis, to
  support policy-makers and strategic planners in government, civil society and business in addressing
                                 the complex challenges facing society.

                         Cambridge Econometrics Limited is owned by a charitable body,
                             the Cambridge Trust for New Thinking in Economics.
                                       www.neweconomicthinking.org

Cambridge Econometrics                                                                                                      2
Decarbonising road freight in Europe: A socio-economic assessment

Authorisation and Version History

    Version       Date      Authorised for                          Description
                              release by
  1.0          21/08/18   Jon Stenning           Final technical report

Cambridge Econometrics                                                                              3
Decarbonising road freight in Europe: A socio-economic assessment

                  Acknowledgments

  Background      In recent years a number of studies have assessed the socio-economic impact
                  of a transition to low-carbon cars in Europe, at the level of the EU as a whole
                  (‘Fuelling Europe’s Future’, 2013 and 20181) and Member State (‘Fuelling
                  Britain’s Future’, 20152, ‘En route pour un transport durable’, 20163, ‘Low-
                  carbon cars in Germany’, 20174, ‘Fuelling Spain’s Future’, 20185). However,
                  this is the first study that has looked at the whole-economy impact of a similar
                  transition in the heavy-duty freight transport segment.
Core analytical   Cambridge Econometrics provided the analytical work presented in this
         team     report, including vehicle stock analysis and economic modelling (using the
                  E3ME6 model).
                  The report was funded by the European Climate Foundation who convened a
                  core working group to advise and review the analysis and reporting. The
                  authors would like to thank all members of the core working group for their
                  respective inputs.
    Disclaimer    The stakeholders who contributed to this study shared the aim of establishing
                  a constructive and transparent exchange of views on the technical, economic
                  and environmental issues associated with the development of low-carbon
                  technologies for HGVs. The objective was to evaluate the boundaries within
                  which vehicle technologies can contribute to mitigating carbon emissions
                  from HGVs across Europe. Each stakeholder contributed their knowledge and
                  vision of these issues. The information and conclusions in this report have
                  benefitted from these contributions but should not be treated as necessarily
                  reflecting the views of the companies and organisations involved.
       Review     The technology cost data used in this analysis was independently reviewed by
                  Felipe Rodriguez and Rachel Muncrief of the International Council for Clean
                  Transportation. The infrastructure data and assumptions used were similarly
                  reviewed by Céline Cluzel of Element Energy.

                  1
                    https://www.camecon.com/how/our-work/fuelling-europes-future/
                  2
                    https://www.camecon.com/how/our-work/fuelling-britains-future/
                  3
                    https://www.camecon.com/how/our-work/en-route-pour-un-transport-durable/
                  4
                    https://www.camecon.com/how/our-work/low-carbon-cars-in-germany/
                  5
                    https://www.camecon.com/how/our-work/fuelling-spains-future/
                  6
                    More detail on this model is presented in an annex to this report, and can also be found at www.e3me.com
                  Cambridge Econometrics                                                                                         4
Decarbonising road freight in Europe: A socio-economic assessment
Contents
Page
Acronyms and abbreviations 6
Executive summary 8
1 Introduction 10
2 Overview of scenarios 13
3 Modelling assumptions 18
4 Infrastructure requirements 34
5 Hauliers’ Perspective 42
6 Economic impacts 45
7 Environmental impacts 51
8 Conclusions 52
Appendix A E3ME model description 53
Cambridge Econometrics 5Decarbonising road freight in Europe: A socio-economic assessment
Acronyms and abbreviations
Table 0.1 sets out the acronyms and abbreviations commonly used in the
report.
Table 0.1 Acronyms and abbreviations
Abbreviation Definition
Powertrain types
Internal ICE These are conventional diesel vehicles with an internal
combustion combustion engine. In the various scenarios modelled
engine there is variation in the level of efficiency improvements
to the ICE. Efficiency improvements cover engine
options, transmission options, driving resistance
reduction, tyres and hybridisation.
Plug-in hybrid PHEV Plug-in hybrid electric vehicles have a large battery and
electric vehicle an internal combustion engine. They can be plugged in
to recharge the vehicle battery. EVs with range
extenders are not included in the study.
Battery electric BEV This category refers to fully electric vehicles, with a
vehicle battery but no internal combustion engine.
Fuel cell electric FCEV FCEVs are hydrogen fuelled vehicles, which include a
vehicle fuel cell and a battery-powered electric motor.
Zero emissions ZEV Includes all vehicles with zero tailpipe emissions (e.g.
vehicle FCEVs and BEVs).
Electric vehicles EV All vehicles which are fuelled directly via electricity (i.e.
BEVs and PHEVs)
Electric road ERS Refers to electrified infrastructure to supply EV vehicles
system with a constant power supply across portions of the road
network. PHEV-ERS and BEV-ERS are vehicles with the
required pantograph to enable them to draw charge from
ERS.
Economic terminology
Gross domestic GDP A monetary measure of the market value of all final
product goods and services produced in the national economy
Gross value GVA A measure of the total value of incomes generated from
added production (largely wages and gross profits); it is equal to
the difference between the value of output and the value
of bought-in goods and services (hence ‘value added’).
Other acronyms
Original OEMs Refers to equipment manufacturers of motor vehicles
equipment
manufacturers
Million/billion Mboe/Bboe A unit for measuring oil volumes
barrels of oil
equivalent
Total Cost of TCO Total cost of owning and operating (fuel etc) a vehicle
Ownership
Light Heavy LHGVs Heavy goods vehicles with a gross vehicle weight of 3.5-
goods vehicles 7.5 tonnes
Medium Heavy MHGVs Heavy goods vehicles with a gross vehicle weight of 7.5-
goods vehicles 16 tonnes
Heavy Heavy HHGVs Heavy goods vehicles with a gross vehicle weight of
goods vehicles greater than 16 tonnes
Operations and O&M Refers to the category of expenditure covering the
maintenance operations and maintenance to provide a good or
service.
Cambridge Econometrics 6Decarbonising road freight in Europe: A socio-economic assessment Hyrdogen HRS Refers to infrastructure for the dispensing of hydrogen refuelling station for motor vehicles Cambridge Econometrics 7
Decarbonising road freight in Europe: A socio-economic assessment

Executive summary

This report assesses the economic costs and benefits of decarbonising Heavy
Goods Vehicles (HGVs) in Europe. A scenario approach has been developed to
envisage various possible vehicle technology futures, and then economic
modelling has been applied to assess impacts.
Cambridge Econometrics was commissioned by the European Climate
Foundation (ECF) to assess the likely economic impacts and the transitional
challenges associated with decarbonising the European fleet of vans and
heavy goods vehicle in the medium term (to 2030) and the long term (to
2050).
This technical report sets out the findings from our analysis. It provides details
about the charging infrastructure requirements, technology costs and
economic impacts of the transition to low-carbon mobility in the freight
sector. A summary report, presenting the key messages from the study, is also
available7.
The study shows that, while there are potentially large economic and
environmental benefits associated with decarbonising road freight in Europe,
there are also transitional challenges which must be addressed if the benefits
are to be realised. Up until now there has been little effort from OEM and
policy makers to decarbonise vans and HGVs. But there are signs that the
market is about to change. In May 2018 the European Commission put
forward a proposal for the first ever European CO2 emission standards for
HGVs, buses and coaches8. Throughout 2017 and 2018, a number of OEMs
have unveiled prototypes of electric and hydrogen-fuelled propulsion systems
for HGVs.
The potential benefits if Europe embraces the transition are substantial:
•    Reduced use of oil and petroleum products will cut energy import
     dependence and bring about large reductions in carbon emissions.
•    There are net gains in value added and employment which increase as oil
     imports are reduced over time. By 2030, in each of the Zero-Emission
     Vehicle technology (ZEV) scenarios there is an increase in GDP of 0.07%
     compared to the ‘Business as Usual’ case, and an increase in employment
     of around 120,000 jobs.
•    The transition offers the opportunity of lower costs of road freight
     transportation, with lower total cost of ownership associated with BEV
     and ERS technologies, and FCEVs achieving cost parity with ICEs by 2050.
However, our modelling, in combination with insight from the Core Working
Group, also highlights a number of transitional challenges:
•    The implementation of a rapid charging infrastructure and hydrogen
     refueling stations will require investments reaching several billion euros

7
 See: https://www.camecon.com/how/our-work/trucking-to-a-greener-future
8
 European Commission (2018), Reducing CO2 emissions from heavy duty vehicles, Accessed 02/08/18
https://ec.europa.eu/clima/policies/transport/vehicles/heavy_en
Cambridge Econometrics                                                                                       8
Decarbonising road freight in Europe: A socio-economic assessment
per year from 2030 to 2050. All technology options require a determined
and joint effort of the industry, government and civil society to deploy
sufficient fueling and charging infrastructure. Timing, location, capability
and interoperability are key issues.
• The transition to low-carbon mobility causes a wide range of impacts in
employment across several sectors. Employment in the motor vehicles
sector in the ZEV scenarios at the start of the projected period is a little
higher than in the ‘Business as Usual’ case. But the growing importance of
the ZEV value chain involves a shift in the supply chain away from
traditional motor vehicle components and towards the producers of the
advanced powertrain technologies. Jobs are also created in the provision
of charging and refueling infrastructure while the shift away from oil to
lower-cost mobility leads to increased employment in services as
consumers benefit from lower-cost goods as transportation costs fall.
• The transition poses a significant challenge to maintain the
competitiveness and market share of the European auto industry, by
remaining at the cutting edge of clean technology innovation.
Cambridge Econometrics 9Decarbonising road freight in Europe: A socio-economic assessment
1 Introduction
1.1 Background
Low-carbon freight To meet climate goals of the Paris Agreement the European Commission’s
transport policy “Strategy on Low Emissions Mobility” envisages a shift away from the use of
petroleum towards greener energy sources. Policy is in place to promote this
in passenger transportation: the European Parliament and the Council of the
European Union set out legislation to limit the emissions of new passenger
cars. Until recently, road freight has lagged behind. But now change is on the
way; in May 2018, the European Commission put forward a proposal to the
European Parliament to introduce a set of emissions standards for HGVs,
buses and coaches. The proposal recognizes that all forms of HGVs need to be
included, but initially the regulation will be limited to large articulated trucks
and then in 2022 extended to other smaller trucks such as delivery vans in
cities, as well as buses and coaches. If accepted, there will be a mandatory
target for new heavy-duty vehicles to on average emit 15% fewer CO2
emissions in 2025 compared to 2019.
Ahead of these targets major HGVs manufacturers are developing new
product lines that are increasingly fuel efficient, and are also starting to
release vehicles with alternative powertrains, including electric drivetrains
and fuel cells. These announcements signify a push to keep up with potential
future emissions standards and help pave the way towards a decarbonised
freight sector.
Motivation for the There has been much debate about the potential role for, and impact of, the
study transition to ZEVs within the freight sector. The purpose of this study is to
shed light on the economic impacts and the transitional challenges of
decarbonising vans and HGVs for the European automotive industry and the
wider economy over the period to 2050. In doing so, it highlights some of the
key issues that policy makers should focus on, including;
• What is the scale and pace of investment in infrastructure required? Will
infrastructure act as a catalyst for sales of alternative powertrains; if so,
sufficient infrastructure needs to be in place before hauliers begin to
transition.
• How will government tax revenues be affected due to reduced fuel duty?
• In what areas of the economy should governments offer retraining
programs to ensure workers from ‘losing’ sectors can be redeployed?
• What will be the impact on the electricity grid, and peak electricity
demand, and how could this be better managed?
1.2 Methodology
For this study, a set of scenarios were defined in each of which it was assumed
that a certain low-carbon vehicle technology mix would be introduced and
taken up. The particular factors affecting hauliers’ decisions to purchase
alternative vehicle technologies were not assessed.
Cambridge Econometrics 10Decarbonising road freight in Europe: A socio-economic assessment
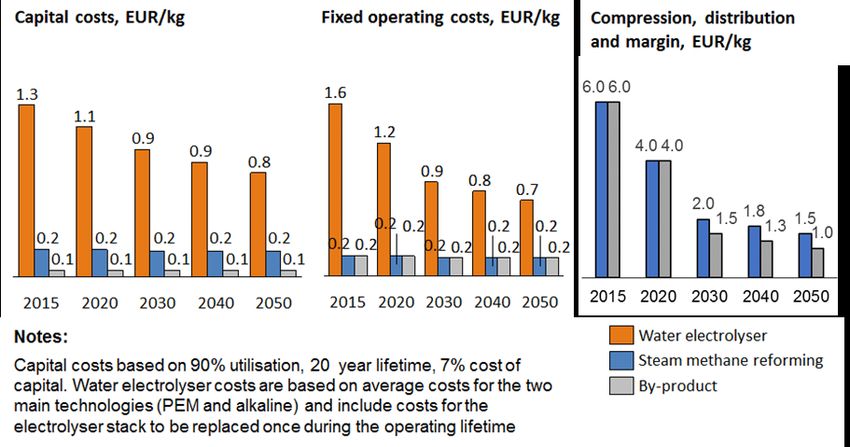
As shown in the graphic below, the methodology involved distinct stages:
1) Stakeholder consultation to define the scenarios and agree on the key
modelling assumptions.
2) An integrated modelling framework that involved (i) application of the
CE’s vehicle stock model to assess the impact of alternative low-carbon
vehicle sales mix on energy demand and emissions, vehicle prices,
technology costs and the total vehicle cost of ownership and (ii)
application of the E3ME model to assess the wider socio-economic effects
of the low-carbon vehicle transition.
Figure 1.1: Our approach
The two models that were applied in our framework are Cambridge
Econometrics’ Vehicle Stock Model and its E3ME model.
Vehicle Stock The vehicle stock model calculates vehicle fuel demand, vehicle emissions and
Model vehicle prices for a given mix of vehicle technologies. The model uses
information about the efficiency of new vehicles and vehicle survival rates to
assess how changes in new vehicles sales affect stock characteristics. The
model also includes a detailed technology sub-model to calculate how the
efficiency and price of new vehicles are affected, with increasing uptake of
fuel efficient technologies. The vehicle stock model is highly disaggregated,
modelling 16 different technology types across four different classes of
commercial vehicles (Vans, LHGV, MHGV, HHGV)9.
E3ME Outputs from the vehicle stock model (including fuel demand and vehicle
prices) are then used as inputs to E3ME, an integrated macro-econometric
model, which has full representation of the linkages between the energy
system, environment and the economy at national and global level. The high
regional and sectoral disaggregation (including explicit coverage of every EU
9
See Section 3, Table 3.1 for more details.
Cambridge Econometrics 11Decarbonising road freight in Europe: A socio-economic assessment
Member State) allows modelling of scenarios specific to Europe and detailed
analysis of sectors and trade relationships in key supply chains (for the
automotive and petroleum refining industries). E3ME was used to assess how
the transition to low carbon vehicles affects household incomes, trade in oil
and petroleum, consumption, GDP, employment, CO2, NOx and particulates.
For more information see www.e3me.com. A summary description of the
model is also available in Appendix A of this report.
Scope of the Much of the technical analysis presented in this report focuses on the HHGV
analysis and the segment; however, similar analysis has been carried out for vans, LHGV and
report MHGV segments. The focus is primarily placed upon HHGVs because these
deliver the vast majority of freight tonne kilometres, and as such dominate
the cost, economic and environmental impacts of the transition of road
freight.
1.3 Structure of the report
The report is structured as follows:
• Section 2 sets out the scenarios that were developed to inform the
analysis and are required to answer the questions raised by the Core
Working Group.
• The main modelling assumptions and technology cost data are set out in
Section 3.
• New infrastructure requirements are a key consideration for the
deployment of zero emission vehicles; these are considered in Section 4.
• Above all, a transition requires hauliers to adopt low and zero emission
vehicles. In Section 5 we look at the capital and fuel costs facing hauliers
in the future.
• The core analysis focuses on the macroeconomic impact of the different
scenarios. The net impacts and transitional challenges are set out in
Section 6.
• The main motivation for promoting adoption of low emissions freight
vehicles is to reduce the harmful impact that road transport has on the
environment. The contribution of road freight to CO2 emissions is set out
in Section 7.
• The report finishes with our conclusions in Section 8. These are the views
of the report’s authors and do not necessarily represent the views of the
European Climate Foundation or the members of the Core Working Group,
either individually or collectively.
Cambridge Econometrics 12Decarbonising road freight in Europe: A socio-economic assessment
2 Overview of scenarios
2.1 Scenario design
The analysis set out in this report is based on a set of scenarios developed by
the Core Working Group, each assuming a different new vehicle sales mix.
These represent a range of decarbonisation pathways and are designed to
assess the impacts of a shift towards low carbon powertrains; they do not
necessarily reflect current predictions of the future makeup of the European
heavy goods fleet. Uptake of each kind of vehicle is by assumption: implicitly
we assume that this change is brought about by policy. The five core scenarios
to be modelled for this study are summarised in the table below:
Table 2.1: Description of the five core modelling scenarios
Scenario Scenario description
REF • No change in the deployment of efficiency technology or the
(Reference) sales mix from 2018 onwards
• Some improvements in the fuel-efficiency of the vehicle stock,
due to stock turnover
TECH-ICE (Fuel • Ambitious deployment of fuel efficient technologies to improve
efficient the efficiency of ICE vehicle over the period to 2050 (e.g. light-
technologies weighting)
only) • No deployment of advanced powertrains
TECH-BEV • Ambitious deployment of fuel-efficient technologies in all new
(High vehicles over the period to 2050 (e.g. light-weighting)
Technology, • Deployment of advanced powertrains (predominately BEVs)
BEVs from 2025
dominate) • BEVs dominate the sales mix from 2040 onwards
TECH ERS (High • Ambitious deployment of fuel-efficient technologies in all new
Technology, vehicles over the period to 2050 (e.g. light-weighting)
ERS system • Deployment of advanced powertrains (predominately PHEV and
dominates) BEVs reliant on ERS infrastructure) from 2025
• Deployment of advanced powertrains is dominated by PHEV-
ERS vehicles until 2040, after which BEV-ERS sales begin to
accelerate, reaching 70% of sales by 2050
TECH FCEV • Ambitious deployment of fuel-efficient technologies in all new
(High vehicles over the period to 2050 (e.g. light-weighting)
Technology, • Deployment of advanced powertrains (predominately FCEVs)
Fuel cell from 2025
vehicles • FCEVs slow to deploy into new sales until 2030, but increase
dominate) rapidly to dominate the sales mix from 2040 onwards
2.2 Vehicle sales and stock
In this section we outline the sales mix by powertrain deployed across each of
the scenarios and vehicle size class. We then show the impact of these
assumed sales mixes on the resulting stock as calculated by the vehicle stock
model.
Reference scenario The reference scenario excludes any further improvements in new vehicle
efficiency after the last year of history, 2018. This is the baseline against which
Cambridge Econometrics 13Decarbonising road freight in Europe: A socio-economic assessment
all other scenarios are compared. In the absence of any existing EU fuel
standards for HGVs, this scenario shows the impact of ‘current policy’.
Vans and LHGVS The scenarios focus on the deployment of advanced powertrains into heavy
goods vehicles. For vans and LHGVS (Decarbonising road freight in Europe: A socio-economic assessment
HHGV powertrain In the TECH-ERS scenario, ERS-enabled vehicles emerge as the dominant
deployment in the technology, but take some time to emerge due to their dependence upon ERS
TECH-ERS scenario infrastructure being in place. PHEV-ERS and BEV-ERS vehicles combined are
only 12% of sales in 2030; however, their market share rapidly expands
thereafter, reaching 55% in 2040 and 80% in 2050. BEVs dominate the ERS
segment and are by themselves 70% of new sales in 2050. The slow build-up,
at least initially, means that less than 30% of the vehicle stock in 2040 are ERS-
enabled, and the stock remains dominated by ICEs at this point. However, by
2050 ERS-enabled vehicles are 60% of the stock, and ICEs have shrunk to only
32%.
Figure 2.3: Sales and Stock composition for HHGVs in TECH-PHEV
As the deployment of ERS roads increases (see Infrastructure section for more
detail), ERS-enabled vehicles become more attractive to hauliers. Vehicle
costs are relatively low (as compared to non-ERS advanced powertrains),
because the ERS variants do not need large batteries. The battery in an ERS-
enabled vehicle is assumed to be smaller in size (50kWh for PHEV-ERS and
200kWh for BEV-ERS) than the battery in a BEV (700kWh) in 2025.
Furthermore, as more ERS infrastructure is deployed, the size of the battery in
ERS-enabled vehicles falls, and so do the costs10.
HHGV powertrain In this scenario, BEVs reach 80% of new sales by 2050 (up from 12% in 2030),
deployment in the which translates to 60% of the stock in the 2050 (up from 5% of the stock in
TECH-BEV scenario 2030), enabled by improved battery technology and the deployment of rapid
recharging infrastructure.
Figure 2.4: Sale and Stock composition for HHGVs in TECH-BEV
In 2025, only 5% of total sales are BEVs. Those who purchase BEVs do so
because the technology is sufficient to meet their current requirements (e.g.
range between distribution centres can be met by one full charge of a BEV). In
the same year there is a small percentage of PHEVs sold, 4%, to fleet
operators who require the ability to travel longer distances.
10
For more detail on size and cost of batteries of PHEV-ERS and BEV-ERS see Section 3.3, Table 3.15 and Table 3.17.
Cambridge Econometrics 15Decarbonising road freight in Europe: A socio-economic assessment
However, as advances in battery technology are made, reducing the costs and
increasing the range of BEVs, the sales of PHEVs are replaced by BEVs, and by
2045 PHEVs no longer feature in sales. There is low-level penetration of PHEV-
ERS vehicles from 2025, with BEV-ERS entering the market soon after, but
neither establish a substantial market share.
HHGV powertrain In the TECH-FCEV scenario, FCEVs emerge as the dominate powertrain and by
deployment in the 2050 they make up 80% of new sales. Due to the relatively high starting costs
TECH-FCEV scenario for the technology, FCEV deployment does not start in earnest until 2030,
when it achieves 12% of sales. Under this scenario, vehicles with batteries
(BEVs and PHEVs) fail to establish a market share, and instead FCEVs achieve
rapid deployment from 2030 onwards, reaching 27% of the stock in 2040 and
60% in 2050.
Figure 2.5: Sale and Stock composition for HHGVs in TECH-FCEV
2.3 Fuel demand
Figure 2.6 shows the combined effects of efficiency improvements and
deployment of advanced powertrains on fuel consumption by the European
vehicle stock in the TECH scenarios. By 2030, we see a modest reduction in
demand for fuel, with an 8% reduction in fossil fuel demand relative to 2015
in the TECH-ICE scenario and a 20% reduction in demand in the TECH
scenarios. By 2050, the demand for fossil fuels in the advanced powertrain
scenarios will have fallen by 82% compared to 2015 levels. These reductions
are starker when compared to the reference case, where fossil fuel demand
increases by 23% over 2015-2050 due to increases in freight demand.
Cambridge Econometrics 16Decarbonising road freight in Europe: A socio-economic assessment Electricity and hydrogen demand grow in line with the rollout of the stock of the relevant advanced powertrains. By 2050, due to their higher efficiencies, their share of total energy demand is lower than their share of the vehicle stock. Figure 2.6: Stock fuel consumption of fossil fuels, hydrogen and electricity (Mtoe) Cambridge Econometrics 17
Decarbonising road freight in Europe: A socio-economic assessment

3            Modelling assumptions

This section sets out the key modelling assumptions underpinning the
analysis.
The scenarios are defined by (i) the new sales mix by vehicle powertrain type
and (ii) the uptake of fuel efficient technologies. Key assumptions that are
common to all scenarios and are briefly outlined in Table 3.1. The subsequent
sections provide information about our assumptions for technology costs and
deployment, battery costs, fuel cell vehicle and the power sector.

3.1          Common modelling assumptions
Table 3.1: Key assumptions used in stock model

                              Details of assumptions used
     Vehicle sales            •    Historical sales data for 2005-2016 taken from the ACEA new
                                   HGV registration statistics.
                              •    Total new registrations beyond 2016 are calculated to ensure
                                   the stock meet freight demand through accounting for both
                                   replacement demand and demand from growing freight
                                   demand.
     Mileage by age           •    We assume that average annual mileage falls gradually over the
     cohort                        lifetime of a vehicle and varies depending on size and
                                   powertrain.
                                                      11
                                   From the TRACCS database we have derived mileage factors
                                   which show the annual mileage of each vehicle. Mileage factors
                                   were calibrated to meet the total tonne kilometres travelled
                                   (exogenously defined).
     Total tonne km           •    Total tonne km travelled by road freight are increased in line
     travelled                     with the European Commission’s PRIMES 2016 reference
                                   scenario. This results in a 48% increase in total tonnes km
                                   travelled from 2015-2050.
     Vehicle survival         •    The survival rate was derived from analysis of the age
     rates                         distribution of the total EU HGV stock between 2005-2010
                                   (using stock data from the TRACCS database). Different survival
                                   rates are used for each size of HGV.
     Fuel prices              •    Historical data for fuel prices is taken from the European
                                   Commission’s Oil Bulletin.
                              •    For the central scenarios, we assume oil prices grow in line with
                                   the IEA World Energy Outlook Current Policies Scenario (and a
                                   constant percentage mark-up is applied to derive the petrol and
                                   diesel fuel price).
                              •    Prices exclude VAT, as this can be recovered by hauliers.
     Electricity prices       •    Electricity prices assume that additional capacity is provided to
                                   meet demand from EVs in the same mix as in the PRIMES 2016
                                   Reference Scenario.
                              •    The electricity price for EV users is assumed to be the same as
                                   that paid by industrial users.

11
  Transport data collection supporting the quantitative analysis of measures relating to transport and climate
change, European Commission, 2013.
Cambridge Econometrics                                                                                           18
Decarbonising road freight in Europe: A socio-economic assessment
Rest of world • The rest of the world assumptions on low carbon transport
policy affect the global oil price and are tested through
sensitivity analysis.
Value chains • In all scenarios, we assume that Member States capture a
consistent share of the vehicle value chain for conventional
ICEs. For the ZEV deployment scenarios, we assume that, for
EVs, battery modules and battery packs are assembled in the EU
but that the battery cells are manufactured in Asia, in line with
current practice.
Trade in motor • We assume the same volume of vehicle imports and exports in
vehicles each scenario. The price of vehicle imports and vehicle exports
changes in line with the change in domestic vehicle prices
(reflecting that transport policy is assumed to be consistent
across the EU).
Vehicle • We assume an annual depreciation rate of 20%.
depreciation
3.2 ICE efficiency gains
Fuel-efficient technologies for HGV segments were collected from four
different sources:
• Ricardo-AEA 2011, Reduction and Testing of Greenhouse Gas (GHG)
Emissions from Heavy Duty Vehicles – Lot 1: Strategy
• TIAX 2012, European Union Greenhouse Gas Reduction Potential for
Heavy-Duty Vehicles
• Ricardo-AEA 2012, A review of the efficiency and cost assumptions for
road transport vehicles to 2050 for UK CCC
• Ricardo-AEA 2017, Heavy Duty Vehicles Technology Potential and Cost
Study for ICCT Technology
Where there was overlap in technologies, data from the latest Ricardo-AEA
(2017) took precedence.
Cambridge Econometrics 19Decarbonising road freight in Europe: A socio-economic assessment
Technology costs and energy savings
Aerodynamic Three aerodynamic technologies from R-AEA (2017) have been included in the
technologies technology list for HGVs (see Table 3.2). These technologies include several
aerodynamic technologies, for example, aerodynamic bodies/trailers and box
skirts, which when deployed together give the percentage reduction in
aerodynamic drag. However, the report by R-AEA (2017) is not explicit in
terms of which specific aspects are included; aerodynamic technologies from
older studies have therefore been removed to avoid double counting.
Table 3.2: Aerodynamic technologies
Energy saving Cost (€, 2015)
LHGV MHGV HHGV LHGV MHGV HHGV
10% reduction in aerodynamic drag 0.6% - - 250 - -
15% reduction in aerodynamic drag - 6.3% - - 375 -
25% reduction in aerodynamic drag - - 10.6% - - 2000
Light-weighting Light-weighting technologies were taken from R-AEA (2017), most of this
technologies saving (R-AEA, 2017) occurs due to material substitution. Thus, material
substitution (TIAX, 2012) has been removed. Note that the light-weighting
technologies (light-weighting 1, 2 and 3) are additive, rather mutually
exclusive.
Table 3.3: Light-weighting technologies
Energy saving Cost (€, 2015)
LHGV MHGV HHGV LHGV MHGV HHGV
Light-weighting 1 0.5% 0.2% 0.3% 0 0 0
Light-weighting 2 0.03% - 0.1% 1 - 53
Light-weighting 3 0.7% 0.7% 0.3% 91 300 300
Tire and wheel Energy saving and costs for Low rolling resistance tires are from R-AEA (2017)
technologies whereas data on single-wide tires is from R-AEA (2012). Automatic tire
pressure adjustment is an uncertain technology, the payback period is
unknown and the impact on Total Cost of Ownership (TCO) is negative,
according to our calculation. Tire Pressure Monitoring System (TPMS)
supersedes it, since TPMS is far cheaper with only a small sacrifice in energy
saving reduction.
Table 3.4: Tire and wheel technologies
Energy saving Cost (€, 2015)
LHGV MHGV HHGV LHGV MHGV HHGV
Low rolling resistance tires 2.5% 4.8% 5.1% 644 1820 5880
Single wide tires 4.0% 4.0% 5.0% 866 866 1364
Automatic tire pressure
1.0% 1.0% 2.0% 10111 10111 14633
adjustment
Tire Pressure Monitoring System
0.4% 0.4% 0.4% 250 250 475
(TPMS)
Cambridge Econometrics 20Decarbonising road freight in Europe: A socio-economic assessment
Transmission and Transmission friction reduction (TIAX, 2012) and improved controls with
driveline aggressive shift logic and early lockup (TIAX, 2012) can be deployed alongside
technologies automated manual.
Table 3.5: Transmission and driveline technologies
Energy saving Cost (€, 2015)
LHGV MHGV HHGV LHGV MHGV HHGV
Transmission friction reduction 0.5% 1.3% 1.3% 204 204 204
Improved controls, with aggressive
2.0% - - 49 - -
shift logic and early lockup
Automated manual 7.0% 5.0% 1.7% 2300 2300 1500
Engine efficiency Improved diesel engine (TIAX, 2012) has been removed from our technology
technologies list as it overlaps with nearly all the other technologies included in this
category. In fact, the sum of all the other engine efficiency technologies (16%)
is roughly the same energy saving percentage as the improved diesel engine.
Mechanical and electrical turbocompound are mutually exclusive.
Table 3.6: Engine efficiency technologies
Energy saving Cost (€, 2015)
LHGV MHGV HHGV LHGV MHGV HHGV
Controllable air compressor - - 1.0% - - 199
Mechanical turbocompound 0.7% 0.7% 2.0% 2393 2393 1800
Electrical turbocompound 1.0% 1.0% 2.0% 6002 6002 1800
Turbocharging 1.9% 2.0% 2.5% 1050 1050 1050
Heat recovery 1.5% 1.5% 4.5% 9922 9922 5000
Unspecified FMEP improvements 3.7% 2.3% 1.4% 0 0 0
Variable oil pump 2.0% 1.5% 1.0% 90 90 90
Variable coolant pump 1.2% 0.8% 0.5% 90 90 90
Bypass oil cooler 0.8% 0.5% 0.2% 25 25 25
Low viscosity oil 2.0% 2.0% 1.0% 410 1550 0
Engine encapsulation 1.5% - - 25 - -
Hybridisation Enhanced stop/start (R-AEA, 2017) is deployed only in LHGVs and MHGVs as
technologies long-haul driving is more continuous. For long haul the dual model hybrid
electric system is deployed as an alternative.
Table 3.7: Hybridisation technologies
Energy saving Cost (€, 2015)
LHGV MHGV HHGV LHGV MHGV HHGV
Dual-mode hybrid electric 25.0% 30.0% 6.5% 23694 18997 8535
Enhanced stop/start system 4.5% 4.5% - 1160 1160 -
Management Vehicle improvements using driver aids from the TIAX (2012) only came with
technologies fuel saving - no costs were included. The cost was estimated by summing
similar technologies, route management and training and feedback from R-
AEA (2012).
Cambridge Econometrics 21Decarbonising road freight in Europe: A socio-economic assessment
Table 3.8: Management technologies
Energy saving Cost (€, 2015)
LHGV MHGV HHGV LHGV MHGV HHGV
Predictive cruise control - - 2.0% - - 640
Smart Alternator, Battery Sensor &
1.5% 1.5% 1.5% 548 548 986
AGM Battery
Vehicle improvements using driver
- - 10.0% - - 1144
aids
Reduction of Auxiliary components in the vehicle also have room for improvement. Electric
auxiliary cooling fans offer a greater amount of energy saving for a slightly smaller
(parasitic) loads cost.
Table 3.9: Reduction of auxiliary (parasitic) loads
Energy saving Cost (€, 2015)
LHGV MHGV HHGV LHGV MHGV HHGV
Electric cooling fans 0.5% 0.5% 0.5% 50 90 180
Electric hydraulic power steering 1.3% 0.8% 0.3% 95 180 360
High efficiency air conditioning 0.5% 0.3% 0.1% 55 105 210
ERS compatible To make a standard electric HHGV compatible with ERS (defined as a PHEV-
technologies ERS and BEV-ERS vehicles), technologies need to be added to the vehicle. For
a catenary wire system, a pantograph attached to the hood of the cab is
needed. Siemens have developed an ‘active pantograph’ which can connect to
the ERS-highway at speeds of 90km/h. Built in sensor technology adjusts the
pantograph to maintain contact with the catenary wires which would
otherwise be displaced from the trucks lateral movements in the lane. This
technology is assumed to cost €17,000 per vehicle in initial deployments, and
fall to roughly €11,000 due to market maturity12.
The cost of the pantograph is added to baseline cost of a PHEV-ERS and BEV-
ERS as it is a standard requirement of the vehicle to be compatible with the
ERS. The cost does not feature in the technology packages below.
Deployment rates
The deployment of technologies is broken down into four different
Technology Packages. Technologies are grouped based on the payback period
of technologies, with specific deployments drawn from R-AEA (2012). The
payback period measures how long it would take to pay off the technology in
terms of fuel expenditure saved. A technology is said to have a payback period
of one year if the fuel saving in the first year amounts to the up-front cost of
the technology. The deployment rates have been drawn from the 2012
Ricardo-AEA study, and adjusted to correspond broadly to the following aims:
• Technology Package 1 assumes that by 2025 there will be deployment of
new technologies into vehicles where they have a payback period of 2
years or less. This will not correspond to 100% coverage of sales, due to
the different use cases within each category (i.e. actual cost saving
depends upon total distance driven).
12
See Section 3.3, Table 3.15.
Cambridge Econometrics 22Decarbonising road freight in Europe: A socio-economic assessment
• Technology Package 2 assumes that over 2025-33 there will be
deployment in new vehicles of technologies in use cases where they have
a payback period of 3.5 years or less.
• Technology Package 3 assumes deployment in new vehicles over 2033-42
of technologies in cases where they have a payback period of 5 years or
less.
• Technology Package 4 assumes that by 2050 there will be full deployment
in new vehicles of all technologies where they have a positive impact on
the TCO.
For technologies with no available payback period, deployment rates in
previous studies were used instead.
Table 3.10: Deployment rates of technologies for LHGVs
Technology Packages, LHGVs
Technology
1 (2025) 2 (2033) 3 (2042) 4 (2050)
10% reduction in aerodynamic drag 0% 0% 50% 100%
Light-weighting 2 100% 100% 100% 100%
Light-weighting 3 30% 60% 100% 100%
Light-weighting 4 15% 30% 60% 100%
Low rolling resistance tires 50% 75% 50% 0%
Single wide tires 0% 25% 50% 100%
Tire Pressure Monitoring System (TPMS) 0% 0% 30% 100%
Transmission friction reduction 0% 100% 100% 100%
Improved controls, with aggressive shift
0% 100% 100% 100%
logic and early lockup
Mechanical turbocompound 0% 10% 30% 40%
Electrical turbocompound 0% 1% 15% 30%
Turbocharging 0% 0% 30% 100%
Heat recovery 0% 0% 5% 20%
Unspecified FMEP improvements 100% 100% 100% 100%
Variable oil pump 100% 100% 100% 100%
Variable coolant pump 100% 100% 100% 100%
Bypass oil cooler 100% 100% 100% 100%
Low viscosity oil 100% 100% 100% 100%
Engine encapsulation 100% 100% 100% 100%
Enhanced stop/start system 35% 25% 15% 0%
Full hybrid 20% 30% 50% 100%
Smart Alternator, Battery Sensor & AGM
20% 60% 100% 100%
Battery
Electric cooling fans 50% 100% 100% 100%
Electric hydraulic power steering 100% 100% 100% 100%
High efficiency air conditioning 20% 100% 100% 100%
Low rolling resistance tires and single wide tires cannot both be deployed on
the same vehicle – the total deployment of these two technologies cannot
exceed 100%. Low rolling resistance tires feature in 50% of all sales in
Technology package 1 because the costs and energy saving are both lower.
Purchasers invest a small amount (€644) and are compensated by small
energy savings (2.5%). The deployment increases to 75% by 2033, with the
Cambridge Econometrics 23Decarbonising road freight in Europe: A socio-economic assessment
remaining use cases including single wide tires, across 25% of new sales. By
2050 single wide tires make up all tire sales because of the large energy saving
potential.
The same is true of enhanced stop/start systems and full hybrid technologies.
Both cannot feature on a single vehicle. The cost of enhanced stop/start is
smaller, so it is implemented in a few business cases, covering 35% of new
sales. Full hybrid technology is more expensive but in the long-run the energy
savings are much higher (so it suits use cases which cover a larger mileage). It
only makes economic sense for 20% of sales in Technology package 1. By
2033, full hybrids begin to dominate as the potential TCO saving covers more
use cases, at the expense of enhanced stop/start. Moreover, the
implementation of a stop/start system is complex, requiring high torque and
durability requirements which may mean it is more likely hauliers invest in a
full hybrid system instead (R-AEA, 2017).
Table 3.11: Deployment rate of technologies for MHGVs
Technology Packages, MHGVs
Technology
1 (2025) 2 (2033) 3 (2042) 4 (2050)
15% reduction in aerodynamic drag 100% 100% 100% 100%
Lightweighting 1 100% 100% 100% 100%
Lightweighting 3 20% 50% 100% 100%
Lightweighting 4 0% 50% 100% 100%
Low rolling resistance tires 100% 100% 100% 100%
Tire Pressure Monitoring System (TPMS) 0% 50% 100% 100%
Transmission friction reduction 0% 0% 100% 100%
Mechanical turbocompound
0% 10% 30% 40%
Electrical turbocompound 0% 1% 15% 30%
Turbocharging 0% 0% 0% 100%
Heat recovery 0% 0% 5% 20%
Unspecified FMEP improvements 100% 100% 100% 100%
Variable oil pump 100% 100% 100% 100%
Variable coolant pump 100% 100% 100% 100%
Bypass oil cooler 100% 100% 100% 100%
Low viscosity oil 100% 100% 100% 100%
Enhanced stop/start system 100% 75% 50% 0%
Full hybrid 0% 25% 50% 100%
Smart Alternator, Battery Sensor & AGM
Battery 20% 60% 100% 100%
Electric cooling fans 100% 100% 100% 100%
Electric hydraulic power steering 100% 100% 100% 100%
High efficiency air conditioning 20% 60% 100% 100%
Table 3.12: Deployment rate of technologies for HHGVs
Technology Packages, HHGVs
Technology
1 (2025) 2 (2033) 3 (2042) 4 (2050)
25% reduction in aerodynamic drag 50% 100% 100% 100%
Lightweighting 1 50% 100% 100% 100%
Cambridge Econometrics 24Decarbonising road freight in Europe: A socio-economic assessment
Lightweighting 2 50% 100% 100% 100%
Lightweighting 3 50% 100% 100% 100%
Lightweighting 4 15% 30% 60% 100%
Single wide tires 50% 75% 100% 100%
Tire Pressure Monitoring System (TPMS) 50% 100% 100% 100%
Transmission friction reduction 100% 100% 100% 100%
Controllable air compressor
20% 50% 100% 100%
Mechanical turbocompound 50% 100% 100% 100%
Turbocharging 50% 100% 100% 100%
Heat recovery 0% 100% 100% 100%
Unspecified FMEP improvements 50% 100% 100% 100%
Variable oil pump 50% 100% 100% 100%
Variable coolant pump 50% 100% 100% 100%
Bypass oil cooler 50% 100% 100% 100%
Low viscosity oil 50% 100% 100% 100%
Dual-mode hybrid electric 0% 30% 50% 100%
Predictive cruise control 100% 100% 100% 100%
Smart Alternator, Battery Sensor & AGM
Battery 45% 50% 70% 100%
Vehicle improvements using driver aids 50% 75% 100% 100%
Electric cooling fans 100% 100% 100% 100%
Electric hydraulic power steering 25% 75% 100% 100%
Cambridge Econometrics 25Decarbonising road freight in Europe: A socio-economic assessment
Total impact of technology packages
Table 3.13 shows the total energy saving and cost of each technology package
to be deployed in ICE HGVs. The technology packages vary by powertrain
because not all technologies are applicable to all advanced powertrains. For
example, there will be no deployment of heat recovery in BEVs or FCEVs as
there is no internal combustion engine to recover heat from. The implication
is that the total energy saving and costs for each technology package decrease
as you move through powertrains from ICE to PHEV/PHEV-ERS and
PHEV/PHEV-ERS to BEV/FCEV.
Table 3.13: Technology Packages for ICEs
LHGV Energy Cost Incremental Incremental
saving energy saving Cost
Technology package 1 19.9% €4,254 19.9% €4,254
Technology package 2 26.3% €6,700 6.4% €2,446
Technology package 3 32.4% €11,858 6.1% €5,158
Technology package 4 45.0% €22,108 12.5% €10,250
MHGV Energy Cost Incremental Incremental
saving energy saving Cost
Technology package 1 22.3% €5,571 22.3% €5,571
Technology package 2 26.4% €9,454 4.1% €3,883
Technology package 3 31.6% €15,117 5.2% €5,663
Technology package 4 39.3% €24,714 7.7% €9,598
HHGV Energy Cost Incremental Incremental
saving energy saving Cost
Technology package 1 20.4% €5,992 20.4% €5,992
Technology package 2 35.9% €17,572 15.6% €11,580
Technology package 3 39.8% €20,082 3.9% €2,510
Technology package 4 42.2% €24,746 2.3% €4,663
A pattern seen across all powertrains in the HGV segment is the potential
energy savings in Technology package 1, which are considerably lower in the
other packages.
3.3 Vehicle costs
Baseline vehicle The cost of a baseline ICE HHGV was taken from a report was taken from CE
Delft (2013)13, and re-based to 2015. The cost of a tractor was calculated to be
€85,201, and €15,243 for a trailer.
All costs stated below are the production cost and exclude taxes and margins.
All costs are expressed in 2015 Euros. Note the cost engine, tractor and trailer
in the tables below exclude the cost of fuel efficient technologies.
Advanced The cost estimate for the advanced powertrain HHGVs was calculated by
powertrain costs subtracting the cost of the engine from the baseline ICE HHGV, and then
adding the cost of the advanced powertrain and other additional components.
13
Zero emissions trucks: An overview of state-of-the-art technologies and their potential, CE Delft (2013) ,Accessed
here on 11/12/2017
Cambridge Econometrics 26Decarbonising road freight in Europe: A socio-economic assessment
Hybrid vehicles add the cost of the additional powertrain and components to
the base ICE cost.
The tables below breakdown the size, marginal cost and total cost of each
component for each advanced powertrain.
Plug-in hybrid The cost of the ICE in the baseline vehicle is approximately €37,000. This was
(PHEV) calculated from the cost of the engine per kW (106 €/kW)14 multiplied by the
assumed engine sized (350 kW) from the archetype HHGV from R-AEA (2017).
The additional required battery electric systems are the electric systems
(power electronics, battery management systems, etc.) necessary to control
the power transfer (ICCT, 2017). They are scaled with the size of the electric
motor.
Table 3.14: Size and cost breakdown of PHEV
2025 2030 2040 2050
Engine size (kW) 322 322 322 322
Engine marginal cost (€/kW) 106 106 106 106
Cost of engine (€) 37224 37224 37224 37224
Battery pack (kWh) 165 165 165 165
Battery marginal cost (€/kWh) 113 90 82 70
Cost of battery pack (€) 18563 14850 13530 11550
Electric motor (kW) 350 350 350 350
Electric motor marginal cost (€/kW) 16 14 14 14
Additional system requirements (€/kW) 41 37 37 37
Cost of electric motor (€) 5477 4861 4861 4861
Cost of additional electric system
14511 12934 12934 12934
requirements (€)
Cost of tractor (excl. ICE) (€) 47977 47977 47977 47977
Cost of trailer (€) 15243 15243 15243 15243
Total cost of PHEV (€) 138995 133089 131769 129789
Battery costs The marginal cost estimates for a battery pack are from the OEM
announcement scenario of Element Energy’s (EE) work on Fuelling Europe’s
Future (2018). The marginal cost of the electric motor and additional system
requirements were taken from ICCT (2017)15. This report only considers the
costs to 2030; these costs are then assumed to hold constant out to 2050.
14
Transitioning to Zero-Emission Heavy-Duty Freight Vehicles, ICCT (2017). Accessed here on 5/12/2017
15
Transitioning to Zero-Emission Heavy-Duty Freight Vehicles, ICCT (2017). Accessed here on 5/12/2017
Cambridge Econometrics 27Decarbonising road freight in Europe: A socio-economic assessment
Figure 3.1: Battery cost per kWh estimates from E
PHEV-ERS In terms of components, there are two main differences between PHEV and
the PHEV-ERS vehicles. First, the battery is smaller in a PHEV-ERS. Second, a
PHEV-ERS includes an active pantograph, which enables compatibility with
ERS.
Table 3.15: Size and cost breakdown of PHEV-ERS
2025 2030 2040 2050
Engine size (kW) 350 350 350 350
Engine marginal cost (€/kW) 106 106 106 106
Cost of engine (€) 37224 37224 37224 37224
Battery pack (kWh) 50 50 50 50
Battery marginal cost (€/kWh) 113 90 82 70
Cost of battery pack (€) 5625 4500 4100 3500
Electric motor (kW) 350 350 350 350
Electric motor marginal cost (€/kW) 16 14 14 14
Additional system requirements (€/kW) 41 37 37 37
Cost of electric motor (€) 5477 4861 4861 4861
Cost of additional system requirements
14511 12934 12934 12934
(€)
Cost of active pantograph (€) 17670 10591 10591 10591
Cost of tractor (excl. ICE) (€) 47977 47977 47977 47977
Cost of trailer (€) 15243 15243 15243 15243
Total cost of PHEV-ERS 143727 133330 132930 132330
The marginal battery pack cost is calculated based on Element Energy’s cost
projections. The electric motor and additional system requirements costs are
from ICCT (2017). The cost of the active pantograph was supplied by Siemens.
BEV We assume an average battery size in a BEV of 700 kWh, based upon an
efficient vehicle consuming 1 kWh per km (1.6 kWh per mile, in line with the
lower end of efficiencies announced by Tesla (1.5 – 2 kWh per mile), and
assuming an 80% usable state of charge, a range of 580 km (in the middle of
Tesla’s stated ranges of 300 and 500 miles).
Cambridge Econometrics 28Decarbonising road freight in Europe: A socio-economic assessment
Table 3.16: Size and cost breakdown of BEV
2025 2030 2040 2050
Battery pack (kWh) 700 700 700 700
Battery marginal cost (€/kWh) 113 90 82 70
Cost of battery pack (€) 78750 63000 57400 49000
Electric motor (kW) 350 350 350 350
Electric motor marginal cost (€/kW) 16 14 14 14
Additional electric system requirements
41 37 37 37
(€/kW)
Cost of electric motor (€) 5477 4861 4861 4861
Cost of additional system requirements (€) 14511 12934 12934 12934
Cost of tractor (excl. ICE) (€) 47977 47977 47977 47977
Cost of trailer (€) 15243 15243 15243 15243
Total cost of BEV 161958 144015 138415 130015
The source for the marginal battery costs, electric motor and additional
system requirements is the same as the costs used for PHEV-ERS and PHEV
(the ICCT and EE’s OEM announcement scenario).
BEV-ERS Table 3.17 shows a detailed breakdown of the costs of a BEV-ERS. The
difference in cost between a BEV-ERS and PHEV-ERS is the cost of the internal
combustion engine.
Table 3.17: Size and cost breakdown of BEV-ERS
2025 2030 2040 2050
Battery pack (kWh) 200 200 200 200
Battery marginal cost (€/kWh) 113 90 82 70
Cost of battery pack (€) 22500 18000 16400 14000
Electric motor (kW) 350 350 350 350
Electric motor marginal cost (€/kW) 16 14 14 14
Additional system requirements (€/kW) 41 37 37 37
Cost of electric motor (€) 5477 4861 4861 4861
Cost of additional system requirements (€) 14511 12934 12934 12934
Cost of active pantograph (€) 17670 10591 10591 10591
Cost of tractor (excl. ICE) ($) 47977 47977 47977 47977
Cost of trailer (€) 15243 15243 15243 15243
Total cost of BEV-ERS 123378 109606 108006 105606
FCEV Table 3.18 shows the breakdown of components required in a FCEV. The size
of the individual components and the costs were taken from ICCT (2017). The
ICCT report assumes that the per kW cost of HHGV FCEV components is the
same as for passenger cars; this is supported by the announcement from
Toyota that their new fuel cell drayage will contain two Mirai fuel cell stacks
(as used in the Mirai passenger car), suggesting that such scaling of costs is a
reasonable assumption.
The size of the compressed H2 tank (63kg) is determined by the mid-point of
the estimated range of the Nikola One Semi Truck16, the energy efficiency of a
FCEV in 2025; 6 MJ/km, and an energy density of 120 MJ/kg.
16
Nikola One Semi Truck. Accessed here on 15/01/2018
Cambridge Econometrics 29Decarbonising road freight in Europe: A socio-economic assessment
Table 3.18: Size and cost breakdown of FCEV
2025 2030 2040 2050
Battery pack (kWh) 12 12 12 12
Battery marginal cost (€/kWh) 113 90 82 70
Cost of battery pack (€) 1350 1080 984 840
Electric motor (kW) 350 350 350 350
Electric motor marginal cost (€/kW) 16 14 14 14
Additional electric system requirements
41 37 37 37
(€/kW)
Cost of electric motor (€) 5477 4861 4861 4861
Cost of additional electric system
14511 12934 12934 12934
requirements (€)
Fuel cell (kW) 350 350 350 350
Fuel cell marginal cost (€/kW) 80 53 42 33
Additional fuel cell system requirements
28 25 25 25
(€/kW)
Cost of fuel cell (€) 28076 18612 14709 11407
Cost of additional system requirements (€) 9779 8833 8833 8833
Compressed H2 tank capacity (kg) 63 62 61 61
H2 tank marginal cost (€/kg) 630 570 507 475
Cost of compressed H2 tank (€) 39974 35603 31162 29181
Cost of tractor (excl. ICE) (€) 47977 47977 47977 47977
Cost of trailer (€) 15243 15243 15243 15243
Total cost of FCEV 162387 145142 136703 131276
3.4 Fuel costs
Petrol The price of petrol faced by hauliers in the EU excludes VAT (because this is
reclaimed) but includes fuel duty. Future petrol prices are projected to be
consistent with the oil price forecast in the IEA Current Policies Scenario
(2016).
Diesel The price of diesel faced by hauliers in the EU does not include VAT and in
eight of member states they can reclaim fuel duty. The impact of fuel duty on
the EU average price is calculated by Transport and Environment17 to be
€0.04/L. The diesel prices are adjusted to reflect this. Future diesel prices are
projected to be consistent with the oil price forecast by the IEA in their
Current Policies Scenario (2016).
Electricity The historical data for electric prices (excluding VAT and other recoverable
taxies/levies) for non-households from Eurostat18 is used in the model. The
price varies by consumption type; for this modelling the consumption Band IE:
20 000 MWh < Consumption < 70 000 MWh is used.
Table 3.19: Real electricity prices for non-households form Eurostat (Band IE)
2010 2011 2012 2013 2014 2015
Total (€/MWh, real 2015) 78 85 91 92 92 93
17
Transport and Environment. Europe’s tax deals for diesel. Accessed here on 11/01/2018
18
Data series: nrg_pc_205
Cambridge Econometrics 30Decarbonising road freight in Europe: A socio-economic assessment
Projected electricity prices are based on the growth rate of electricity prices
for final demand sectors from PRIMES reference scenario (2016)19 (see Figure
5.2).
Hydrogen Our assumptions for hydrogen production costs are based on work done by
Element Energy in Fuelling Europe’s Future (2018). The following text is drawn
from the technical report for that study.
Hydrogen Hydrogen production for the transport sector is expected to be dominated by
production costs water electrolysers, steam methane reforming (SMR) and by-product from
industrial processes (for example chloralkali plants). These sources form the
basis of the production mix in this study. Other potential sources include
waste or biomass gasification, or SMR with carbon capture and storage. These
additional routes could potentially provide low cost, low carbon hydrogen, but
are not yet technically or economically proven and have not been included in
the cost assumptions below.
Hydrogen production cost data was sourced from the UK Technology
Innovation Needs Assessment, and Element Energy and E4Tech’s
Development of Water Electrolysis in the European Union study. The capital
and fixed operating costs per kg of hydrogen produced are shown in
Figure 3.2. SMR and by-product technologies are already mature, and so
future cost reductions are assumed to be zero for this study. Current
electrolyser costs are relatively high, driven by low manufacturing volumes
and relative immaturity at the scale expected for hydrogen production (e.g.
500kg-5t/day). Compression, distribution and margin costs for SMR and by-
product are specific to each supplier, the number of stations served and the
geographical distribution of refuelling stations. Values for compression costs,
distribution and margin are consistent with observed prices in funded
demonstration projects (which also show significantly higher and lower costs)
and were agreed by industry participants for the French en Route Pour un
Transport Durable study.
19
European commission 2016: EU Reference Scenario, 2016 Energy, transport and GHG emissions Trends to 2050.
Accessed here 30/08/2016
Cambridge Econometrics 31Decarbonising road freight in Europe: A socio-economic assessment Figure 3.2 - Capital costs, fixed operating costs and compression, distribution and margin costs in EUR/kg The total production costs from each production route are shown in Figure 3.3. These costs include the feedstock costs assumptions for gas (30 EUR/MWh in 2015 rising to 40 EUR/MWh by 2030) and electricity (107 EUR/MWh in 2015 rising to 148 EUR/MWh in 2050). The results below show significantly higher costs for electrolyser hydrogen compared to SMR and by- product. This is due to the use of a standard electricity price in the baseline scenario that does not account for optimisation in terms of time of day usage or the provision of grid services. In some Member States such as France, electrolyser operators are able to access electricity prices of c. €65/MWh, which is sufficiently low to be competitive with hydrogen from SMR (once delivery costs for the latter are taken into account) The impact of lower electricity prices through optimised use of renewables in periods of low demand will be considered as a separate sensitivity, as this is a critical factor if electrolysers are to be competitive with other hydrogen sources in the future. The water electrolyser costs in Figure 3.3 also include a revenue of 1 EUR/kg from the provision of balancing services to the electricity grid. This is an indicative value based on discussions with RTE in France and the National Grid in the UK. Figure 3.3 - Total costs of hydrogen production, €/kg Cambridge Econometrics 32
You can also read