ATLAS OF MORTALITY AND ECONOMIC LOSSES FROM WEATHER, CLIMATE AND WATER EXTREMES - (1970-2012) WMO-No. 1123
←
→
Page content transcription
If your browser does not render page correctly, please read the page content below
ATLAS OF MORTALITY AND
               ECONOMIC LOSSES FROM WEATHER,
                CLIMATE AND WATER EXTREMES
                          (1970–2012)

WMO-No. 1123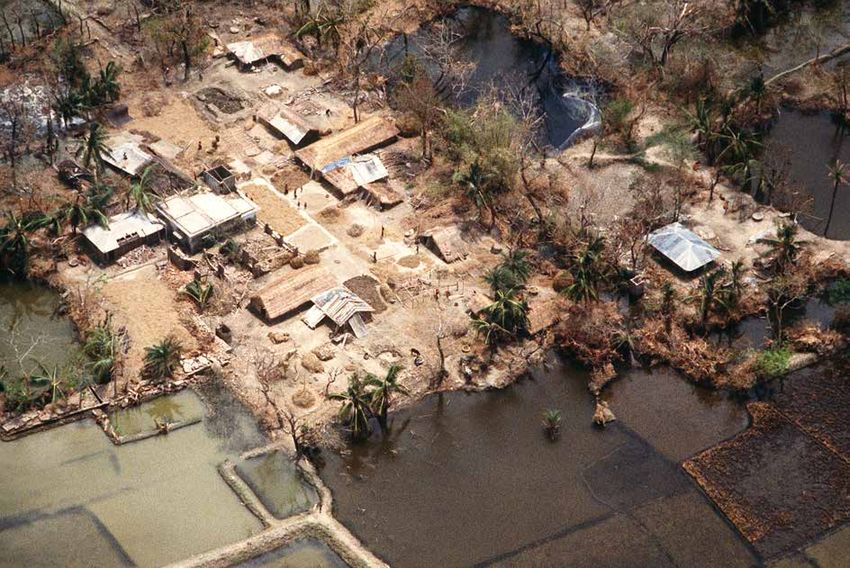
Cover: A lone house remains standing after Hurricane Ike (2008) devastated Gilchrist and Galveston, Texas,
United States of America. The house was rebuilt taking advantage of lessons learned from Hurricane Rita,
which struck the area in 2005. It was built on elevated ground and the pitch of the roof and the windows were
designed to withstand winds of up to 209 km per hour, thus surviving Hurricane Ike and its winds of 177 km
per hour.

Photo by Jocelyn Augustino/FEMA

WMO-No. 1123

© World Meteorological Organization, 2014

The right of publication in print, electronic and any other form and in any language is reserved by WMO. Short
extracts from WMO publications may be reproduced without authorization, provided that the complete source
is clearly indicated. Editorial correspondence and requests to publish, reproduce or translate this publication
in part or in whole should be addressed to:

Chairperson, Publications Board
World Meteorological Organization (WMO)
7 bis, avenue de la Paix                                                           Tel.: +41 (0) 22 730 84 03
P.O. Box 2300                                                                      Fax: +41 (0) 22 730 80 40
CH-1211 Geneva 2, Switzerland                                                      E-mail: publications@wmo.int

ISBN 978-92-63-11123-4

NOTE

The designations employed in WMO publications and the presentation of material in this publication do not imply the expression of any opinion
whatsoever on the part of WMO concerning the legal status of any country, territory, city or area, or of its authorities, or concerning the delimitation
of its frontiers or boundaries.

The mention of specific companies or products does not imply that they are endorsed or recommended by WMO in preference to others of a similar
nature which are not mentioned or advertised.

The findings, interpretations and conclusions expressed in WMO publications with named authors are those of the authors alone and do not
necessarily reflect those of WMO or its Members.

B
CONTENTS
Foreword . . . . . . . . . . . . . . . . . . . . . . . . . . . . . . . . . . . . 2
Background and methodology . . . . . . . . . . . . . . . . . . . . . . . . . . . . . 4
Background . . . . . . . . . . . . . . . . . . . . . . . . . . . . . . . . . 4
Disaster database used for the analysis . . . . . . . . . . . . . . . . . . . . . . . . 4
Methodology . . . . . . . . . . . . . . . . . . . . . . . . . . . . . . . . . 5
Outline . . . . . . . . . . . . . . . . . . . . . . . . . . . . . . . . . . . 5
Global . . . . . . . . . . . . . . . . . . . . . . . . . . . . . . . . . . . . . 6
Africa . . . . . . . . . . . . . . . . . . . . . . . . . . . . . . . . . . . . . 10
Asia . . . . . . . . . . . . . . . . . . . . . . . . . . . . . . . . . . . . . 14
South America . . . . . . . . . . . . . . . . . . . . . . . . . . . . . . . . . 18
North America, Central America and the Caribbean . . . . . . . . . . . . . . . . . . . . . 22
South-West Pacific . . . . . . . . . . . . . . . . . . . . . . . . . . . . . . . . 26
Europe . . . . . . . . . . . . . . . . . . . . . . . . . . . . . . . . . . . . 30
Regional intercomparisons . . . . . . . . . . . . . . . . . . . . . . . . . . . . . 34
Annexes . . . . . . . . . . . . . . . . . . . . . . . . . . . . . . . . . . . . 35
Annex I . . . . . . . . . . . . . . . . . . . . . . . . . . . . . . . . . . . . 36
About the World Meteorological Organization . . . . . . . . . . . . . . . . . . . . . 36
Weather and Disaster Risk Reduction Services Department . . . . . . . . . . . . . . . 36
Global Framework for Climate Services . . . . . . . . . . . . . . . . . . . . . . 37
About the Centre for Research on the Epidemiology of Disasters . . . . . . . . . . . . . . . 37
Objective . . . . . . . . . . . . . . . . . . . . . . . . . . . . . . . . 37
Focus . . . . . . . . . . . . . . . . . . . . . . . . . . . . . . . . . . 38
Annex II . . . . . . . . . . . . . . . . . . . . . . . . . . . . . . . . . . . . 39
Disaster loss and damage data sources and the CRED EM-DAT database . . . . . . . . . . . . 39
EM-DAT hazard classification . . . . . . . . . . . . . . . . . . . . . . . . . . 39
EM-DAT information . . . . . . . . . . . . . . . . . . . . . . . . . . . . . 40
EM-DAT event template . . . . . . . . . . . . . . . . . . . . . . . . . . . . 41
Country name changes . . . . . . . . . . . . . . . . . . . . . . . . . . . . 42
Annex III . . . . . . . . . . . . . . . . . . . . . . . . . . . . . . . . . . . . 43
List of WMO Regions and corresponding countries and territories as listed in EM-DAT . . . . . . . . 43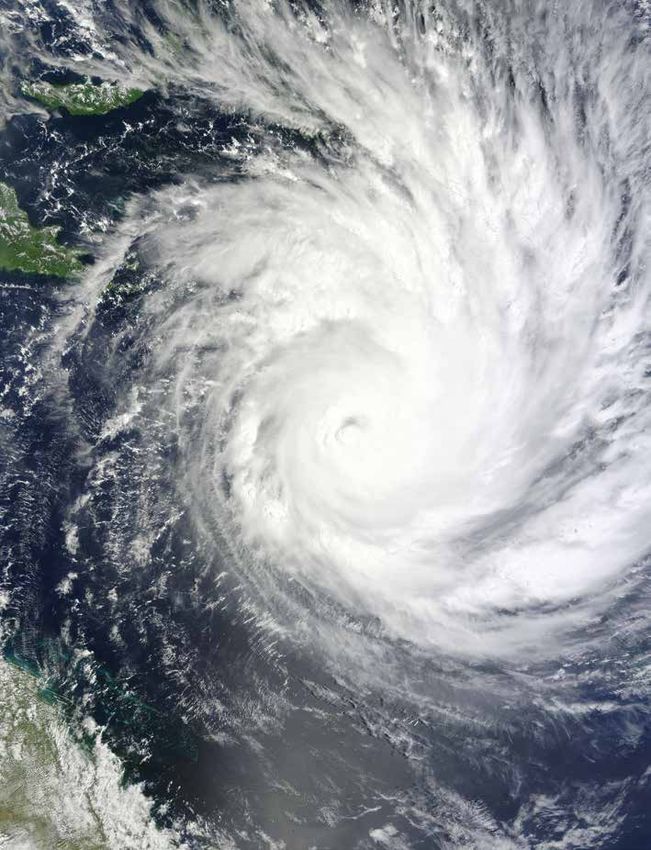
FOREWORD

                                                                 The full value of damage and loss data is best realized
                                                                 when such information is combined with meteorological,
                                                                 hydrological and other environmental data. By describing
                                                                 the location, severity or frequency of hazards, these data
                                                                 make it possible to analyse the historical and geographical
                                                                 patterns of cause and effect. They can also be used to
                                                                 improve the analysis of risks: some hazards are quite
                                                                 complex, such as when a tropical cyclone results in storm
                                                                 surges, flooding, landslides and wind damage, which can
                                                                 lead to confusion and double counting if damages are
                                                                 attributed both to the coastal storm and the inland flood.

                                                                 Another challenge for users of risk information has to do
                                                                 with the changing characteristics (frequency, location,
                                                                 severity) of weather-, climate- and water-related hazards.
Disasters caused by weather-, climate- and water-related         Natural climate variability is now exacerbated by long-
hazards are on the rise worldwide. Both industrialized           term, human-induced climate change, so that yesterday’s
and non-industrialized countries are bearing the burden          norms will not be the same as tomorrow’s. The Working
of repeated floods, droughts, temperature extremes and           Group I contribution to the Fifth Assessment Report of the
storms. The escalating impact of disasters is due not only       Intergovernmental Panel on Climate Change Climate Change
to their increasing frequency and severity but also to the       2013: The Physical Science Basis, released in September
growing vulnerability of human societies, especially those       2013, confirmed that rising atmospheric concentrations of
surviving on the margins of development.                         greenhouse gases have already changed weather patterns
                                                                 and the global water cycle. The climate will continue to
To appreciate fully the global effects of weather, climate       change throughout the twenty-first century and beyond.
and water extremes, we need to monitor the number of
lives lost or affected and the impact on economies and           The Atlas of Mortality and Economic Losses from Weather,
livelihoods. Historical, geo-referenced information about        Climate and Water Extremes (1970–2012) seeks to raise
deaths and damages can be used to estimate risks before          awareness of these and other challenges to collecting and
the next disaster occurs. It can support practical measures to   analysing disaster risk information. It presents a worldwide
reduce potential impacts, such as investing in early warning     analysis of extreme weather, climate and water events,
systems, retrofitting critical infrastructure or enforcing new   drawing on the Emergency Events Database (EM-DAT),
building codes. Information about past impacts can also be       compiled by the Centre for Research on the Epidemiology of
used to assess the resilience of a society.                      Disasters (CRED). The Atlas compares the reported impacts
                                                                 of meteorological, climatic and hydrological extremes (as
Gathering loss and damage data, however, is a major              categorized by CRED) on people and economies at both
challenge. Data from different countries are not always          global and regional levels.
comparable or even accessible, and smaller disasters
are often not recorded in official records. As a result, the     We hope that by highlighting the value of risk information,
United Nations Global Assessment Report on Disaster Risk         this Atlas will help to inspire stronger national and inter-
Reduction 2013 concluded that direct and indirect losses         national efforts to report, collect, standardize and analyse
from natural hazards of all kinds have been underestimated       data on weather-, climate- and water-related hazards and
by at least 50 per cent. Better reporting of disaster impacts    on how the resulting disasters affect people and their
is vital for strengthening disaster risk reduction. This is      livelihoods. We also view the Atlas as a tool for promoting
why the international community should help vulnerable           greater collaboration between the agencies that collect
countries improve their capacity for developing and main-        loss and damage data and information and the National
taining high-quality damage and loss databases.                  Meteorological and Hydrological Services (NMHSs) of

2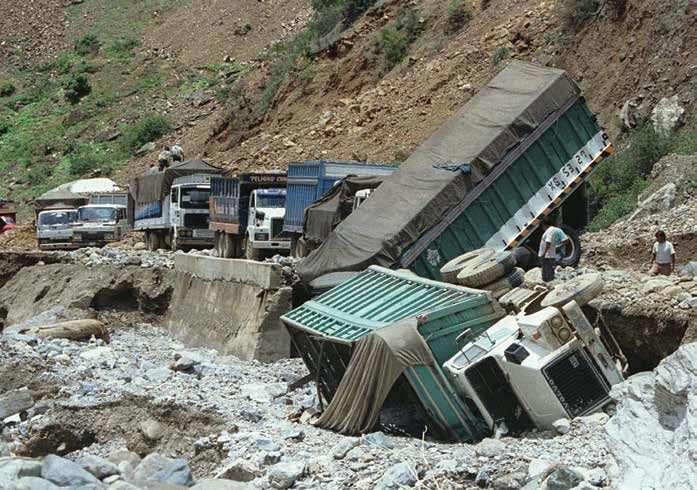
each Member. By working together, these organizations      partners to assist countries in developing their own climate
can produce geo-referenced information products that       services. These information products can also support
combine data on weather, climate and water with data on    activities and services inspired by the post-2015 United
human and economic losses due to disasters.                Nations Sustainable Development Goals, the second phase
                                                           of the Hyogo Framework for Action, the United Nations
Such products are invaluable because they can provide      Framework Convention on Climate Change and the United
decision-makers with actionable information for protect-   Nations Convention to Combat Desertification.
ing life and property. They can be delivered through the
WMO-led Global Framework for Climate Services (GFCS),      We invite your feedback and comments on the Atlas, and
which is mobilizing the United Nations system and other    we hope you find it useful.

                                      Michel Jarraud       Debarati Guha Sapir
                        Secretary-General of the World     Director of the Centre for Research on the
                          Meteorological Organization      Epidemiology of Disasters
                                                           Professor at the University of Louvain School
                                                           of Public Health

                                                                                                                      33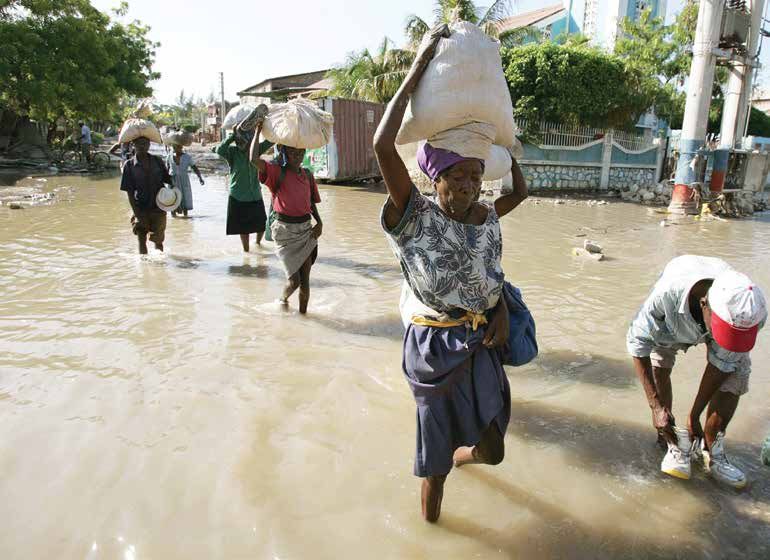
BACKGROUND AND METHODOLOGY

Background                                                         and disseminating data through two globally coordi-
                                                                   nated operational systems – the WMO Integrated Global
Every year, disasters related to weather, climate and              Observing System and the WMO Information System.
water hazards cause significant loss of life and set back          In addition, World Meteorological Centres, Regional
economic and social development by years, if not decades.          Specialized Meteorological Centres (including Regional
From 1970 to 2012, 8 835 disasters, 1.94 million deaths            Climate Centres) and NMHSs provide weather and climate
and US$ 2.4 trillion1 of economic losses were reported             analyses, warnings, forecasts and other information
globally as a result of droughts, floods, windstorms,              services through the WMO Global Data-processing and
tropical cyclones, storm surges, extreme temperatures,             Forecasting System on a 24/7 basis. These various centres
landslides and wildfires, or by health epidemics and               are also involved in other vital programmes and activities
insect infestations directly linked to meteorological and          to support meteorological, hydrological and climate
hydrological conditions. 2 This Atlas, a joint publication of      services for disaster risk reduction, such as the Tropical
the World Meteorological Organization (WMO) and the                Cyclone Programme, which facilitates the development
Centre for Research on the Epidemiology of Disasters               of operational tropical cyclone bulletins and information.
(CRED) of the Catholic University of Louvain in Belgium
(see Annex I), describes the distribution and impacts of           WMO projects such as the Severe Weather Forecasting
weather-, climate- and water-related disasters from 1970           Demonstration Project use the resources and modelling
to 2012. It also highlights the actions and programmes             capabilities of NMHSs to assist the severe weather fore-
led or coordinated by WMO to reduce the impacts of                 casting and warning services of less developed NMHSs,
such disasters.                                                    in particular in least developed countries and small
                                                                   island developing States. Other relevant WMO contribu-
Under the cross-cutting framework of its Disaster Risk             tions include activities for the monitoring and integrated
Reduction Programme, WMO has launched an initiative                management of floods and droughts, the forecasting of
to develop guidelines, recommended practices and stan-             storm surges and coastal inundation, climate prediction
dards for hazard definition and classification to support          organized by Regional Climate Centres (RCCs), coordi-
the geo-referencing of loss and damage data and risk               nation of El Niño-Southern Oscillation reports, and the
analysis. As part of the activities of this Programme, WMO         annual statements on the status of the global climate. All
is working in cooperation with its technical commissions           of these activities ensure delivery of reliable and timely
and programmes and the NMHSs of its 191 Members to                 meteorological, climate and other related environmental
develop statistical hazard mapping as well as forecasting          services and information on hazards to decision-makers
and forward-looking modelling tools and methodologies for          building on the WMO Strategy for Service Delivery.
meteorological, hydrological and climate-related hazards
to support loss and damage data collection and analysis            The Atlas of Mortality and Economic Losses from Weather,
and probabilistic risk modelling. This initiative, combined        Climate and Water Extremes (1970–2012) is a first step by
with national capacity development projects, will enable           the new partnership of WMO and CRED to engage their
countries to collect and develop hazard databases and              respective national and global networks in improving national
metadata, carry out systematic geo-referencing of related          disaster loss and damage databases by linking them to the
loss and damage data and support risk modelling at local,          hazard information collected by WMO and its Members.
national, regional and global scales.
                                                                   Disaster database used for the analysis
Underpinning this initiative is the significant capacity that
WMO and its 191 Members have developed for gathering               The analysis provided in this Atlas is based on the CRED
                                                                   EM-DAT database3, which contains data on disasters caused
                                                                   by several types of natural hazards – geophysical, meteo-
1
    US$ prices are adjusted to 2012.
                                                                   rological, climatological, hydrological and biological – and
2
    Guha Sapir, D., R. Below, P. Hoyois: EM-DAT – International
    Disaster Database. Catholic University of Louvain, Brussels,
    Belgium.                                                       3
                                                                       http://www.emdat.be/database

4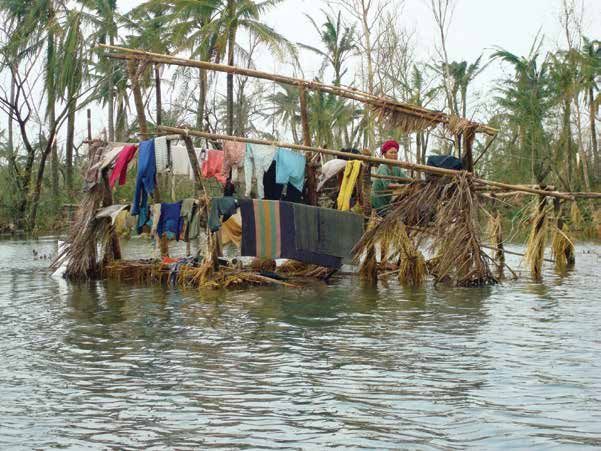
technological disasters dating back to the year 1900. Of       Methodology
the over 20 700 reported disasters listed in the database,
62 per cent were caused by natural hazards and 38 per          This publication provides statistical analyses of reported
cent were technological. The objective of developing and       disasters in the CRED EM-DAT database spanning the
maintaining this database is to provide evidence to support    43-year period from 1970 to 2012, inclusive. The analyses
humanitarian actions and the development of national and       have been carried out at the global scale and for each of
international programmes.                                      the six WMO Regions (see Annex III, Table 8). The reported
                                                               number of disasters, related deaths and economic losses
The disasters included in this report are classified as        are assessed for the 43-year period as well as by decade
meteorological (storms), climatological (droughts, extreme     (1971–1980, 1981–1990, 1991–2000, 2001–2010) to indicate
temperatures and wildfires) and hydrological (floods and       significant disasters and trends over time. Lists of the
mass movement wet, which includes subsidence, rock-            10 worst reported disasters in terms of human deaths and
falls, avalanches and landslides). These categories were       economic losses during the 43-year period are provided
developed by CRED along with a number of its partners          for each Region. According to EM-DAT, in some regions
engaged in collecting loss and damage data associated          multiple disasters could be listed under one event; however,
with natural hazards (see Annex II, Table 1).                  for the top 10 lists provided in this report, these cases
                                                               have been excluded and only disasters related to a single
Through the long experience of CRED in data collection and     event are included.
management, EM-DAT has provided a unique, public and
global reference database of reported disasters. It ensures    Outline
transparency through normative rules, clearly stated
definitions and methodologies and selective validation         The statistics for reported disasters related to meteoro-
methods and tools. Information sources were selected to        logical, hydrological and climatological hazard categories,
describe disasters and their related losses as accurately as   as defined by CRED (see Annex II, Table 1), are presented
possible in EM-DAT (Annex II, Table 2). All events reported    globally, followed by statistics for each of the six WMO
in EM-DAT should, moreover, meet the defined selection         Regions. The final section provides a comparison of these
criteria (Annex II, Table 5).                                  reported disasters among the six WMO Regions.

Over the years, data entry and delivery have become            Note: The depiction and use of boundaries, geographic
automated, making it easier to compare EM-DAT data             names and related data shown on maps and included in
across time and space. Thus, the quality and amount            lists, tables, documents and databases are not warranted
of loss and damage data from reported disasters have           to be error free nor do they necessarily imply official
increased over time.                                           endorsement or acceptance by WMO.

                                                                                                                          55
GLOBAL

From 1970 to 2012, 8 835 weather-, climate-
and water-related disasters were reported
globally. Together they caused the loss of
1.94 million lives and economic damages of
US$ 2.4 trillion. The 10 worst reported disas-
ters in terms of human lives lost represented
only 0.1 per cent of the total number of events,
                                                                                             Canada
but accounted for 69 per cent (1.34 million) of                  Costliest events were a drought in 1978 (US$ 10.6 billion)
                                                                          and a forest fire in 1989 (US$ 7.8 billion)
the total deaths. The 10 most costly disasters
accounted for 19 per cent (US$ 443.6 billion)
of overall economic losses. Storms, droughts,                                                           United States
floods and extreme temperatures all figure                                                Hurricanes Katrina (2005), Sandy (2012),
                                                                                          Andrew (1992), Ike (2008) and Ivan (2004)
on both lists of the worst disasters.                                                          among the 10 costliest events

                                                                                                                                     Caribbean
Storms and floods accounted for 79 per cent of                                    Central America                           Hurricanes had the most severe
                                                                            Hurricane Mitch in 1998 led to a             impact in terms of lives lost (notably
the total number of disasters due to weather,                                 high death toll in Honduras                  in Haiti and Dominican Republic)
water and climate extremes and caused 54 per                                      (14 600 deaths) and
                                                                               Nicaragua (3 332 deaths)
cent of deaths and 84 per cent of economic                                                                        Bolivarian Republic of Venezuela
                                                                                                                         A flash flood in 1999 caused
losses. Droughts caused 35 per cent of deaths,                                                                                30 000 deaths and
mainly due to the severe African droughts of                                                                                  cost US$ 4.4 billion

1975, 1983 and 1984.                                                                                                                            Brazil
                                                                                                                         Peru             Droughts and floods
                                                                                                                   Landslides (notably generated the highest
The 10 worst reported disasters in terms of                                                                       in 1971 and 1973) had    economic losses
                                                                                                                      a severe impact
lives lost occurred primarily in least devel-                                                                      in terms of lives lost
oped and developing countries, whereas
the economic losses occurred primarily in
                                                                                                                                    Argentina
developed countries and in countries with          The designations employed in WMO publications and the
                                                                                                                               Floods (notably those
                                                                                                                              in 1985 and 1983) led to
economies in transition.                           presentation of material in this publication do not imply the
                                                                                                                              highest economic losses
                                                   expression of any opinion whatsoever on the part of WMO
                                                   concerning the legal status of any country, territory, city or
                                                   area, or of its authorities, or concerning the delimitation of its
                                                   frontiers or boundaries.                                                                               STRINGER RUSSIA / REUTERS

                                                          A security guard walks near grass lit on fire by severe heat
                                                                              in Moscow, 2010.

6
Map highlighting major reported disasters linked to weather, climate and water extremes

                                                                             Russian Federation
                                                                             The 2010 heatwave led to
                                Europe                                          over 55 700 deaths
       Floods and storms were
        the costliest disasters      Eastern Europe                                       Central Asia                             Democratic People’s Republic of Korea
                                Economic losses were largely                     Floods and wet mass movement                            Floods in 2007 caused over 600 deaths,
                                                                                     had biggest effects on                             and nearly US$ 22.6 billion were attributed
          Europe                   caused by floods, while
                                                                                         human lives lost
 The 2003 summer heatwave         heat and cold waves had                                                                                           to flooding in 1995
 was reported in 15 countries        biggest impacts on
                                      human lives lost
                                                                                                                      China
  and caused 72 210 deaths                                                                         Floods (notably in 1998, US$ 42.3 billion),
                                                                                                   a cold wave in 2008 (US$ 22.5 billion) and                Japan
                          Morocco                             Islamic Republic of Iran                                                             A tropical cyclone in 1991
                                                                  Economic losses mainly              a drought in 1994 (US$ 21.3 billion)
Drought in 2000 cost                                                                                                                                    (US$ 16.9 billion)
                                                                 related to floods, notably                were the costliest disasters
   US$ 1.2 billion                                                                                                                                  was the costliest event
                                      Northern Africa          those of 1992 (US$ 4.9 billion)                                                             on record
                                    Number of deaths mainly
                                      related to droughts                                        Bangladesh
                                                              East Africa                 Cyclones in 1970 and
                                                     Droughts in 1975 (Ethiopia,            1991 caused a total                                     Philippines and Indonesia
                            Western Africa          Somalia) and in 1983 and 1984        of nearly 450 000 deaths         Thailand               Storms led to important human losses,
                     Floods and storms caused          (Mozambique, Ethiopia,                                            Floods in 2011       especially a tropical cyclone in the Philippines
                   the majority of human losses,      Sudan) caused more than                                         cost US$ 40.8 billion                in 1991 (5 956 deaths)
                                                           600 000 deaths
                                                                                                  Myanmar
                         notably in Nigeria                                                  Cyclone Nargis (2008):
                                                                                                138 366 deaths

                                                                    Madagascar
                                                                   A tropical cyclone
                                                              in 1977 cost US$ 1.3 billion
                                                                                                                                       Australia
                                                                                                                        A drought in 1981 (US$ 15.2 billion) was
                                                                  and killed 10 people
                                                                                                                          the costliest event, followed by the
                                             South Africa                                                                     2011 floods (US$ 7.5 billion)
                                           Drought in 1991 cost
                                              US$ 1.7 billion
 RICK WILKING / REUTERS

                                                                                                                                                                                                MSF

                            A police car is submerged in New Orleans, United                                              Victims of the East Africa drought,
                               States, after Hurricane Katrina hit in 2005.                                                          Sudan, 1984

                                                                                                                                                                                           77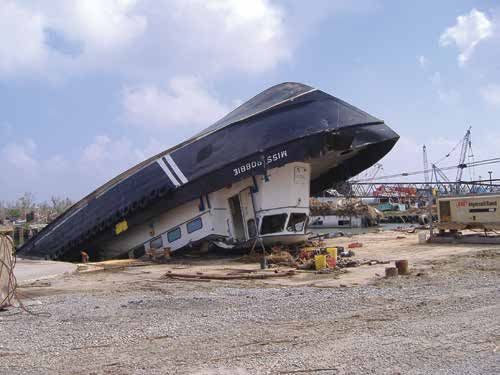
Disasters ranked according to reported (a) deaths and (b) economic losses,
                  globally (1970–2012). TC indicates disasters caused by tropical cyclones.

                                                                                                    Number of
        (a) Disaster type               Year    Country
                                                                                                       deaths
        1    Drought                    1983    Ethiopia                                              300 000
        2    Storm (TC ) a
                                        1970    Bangladesh                                              300 000
        3    Drought                    1984    Sudan                                                   150 000
        4    Storm (TC ) b
                                        1991    Bangladesh                                              138 866
        5    Storm (Nargis)             2008 Myanmar                                                    138 366
        6    Drought                    1975    Ethiopia                                                100 000
        7    Drought                    1983    Mozambique                                              100 000
        8    Extreme temperature        2010    Russian Federation                                       55 736
        9    Flood                      1999    Venezuela, Bolivarian Republic of                        30 000
        10 Flood                        1974    Bangladesh                                               28 700

                                                                                              Economic losses
        (b) Disaster type               Year    Country
                                                                                               (in US$ billion)
        1    Storm (Katrina)            2005 United States                                             146.89
        2    Storm (Sandy)              2012    United States                                              50.00
        3    Storm (Andrew)             1992    United States                                              43.37
        4    Flood                      1998    China                                                      42.25
        5    Flood                      2011    Thailand                                                   40.82
        6    Storm (Ike)                2008 United States                                                 31.98
        7    Flood                      1995    Democratic People's Republic of Korea                      22.59
        8    Extreme temperature        2008 China                                                         22.49
        9    Storm (Ivan)               2004 United States                                                 21.87
        10 Drought                      1994    China                                                      21.33
    a
            Otherwise known as Bhola; however, the name was given prior to 2004 when a recognized tropical cyclone
            naming system was introduced in the region.
    b
            Otherwise known as Gorky; however, the name was given prior to 2004 when a recognized tropical cyclone
            naming system was introduced in the region.                                                              UNHCR

              Cyclone Nargis survivors in the ruins of their destroyed home in Mya Ba Go village,
                                          Bogale township, Myanmar

8
Distribution of the reported (a) number of disasters,
(b) deaths and (c) total economic losses by hazard type,
globally (1970–2012)
Number of reported disasters by decade
Total = 8 835 disasters (1970–2012) 5 000
by hazard type (1971–2010)
4%
5%
4 000
6%
3 496
3 000
44%
2 386
2 000
1 534
1 000
35% 743
0
1971−1980 1981−1990 1991−2000 2001−2010
6%
Number of reported deaths by decade
Total = 1 944 653 deaths (1970–2012) 1 000 000
by hazard type (1971–2010)
9%
14%
800 000
2%
658 905
600 000
387 957
400 000
35%
329 597
241 748
200 000
40%
0
1971−1980 1981−1990 1991−2000 2001−2010
Reported economic losses by decade
Total = US$ 2 390.7 billion (1970–2012) 1 000.0
by hazard type (1971–2010)
3%
4% 864.0
8%
800.0 762.1
33%
600.0
400.0
308.9
200.0
156.2
1%
51% 0.0
1971−1980 1981−1990 1991−2000 2001−2010
(in US$ billion, adjusted to 2012) (in US$ billion, adjusted to 2012)
Floods Mass movement wet Storms Droughts Extreme temperature Wildfires
99AFRICA
In Africa, from 1970 to 2012, 1 319 reported
disasters caused the loss of 698 380 lives
and economic damages of US$ 26.6 billion.
Although floods were the most prevalent type
of disaster (61 per cent), droughts led to the
highest number of deaths, accounting for
FEISAL OMAR / REUTERS
some 96 per cent of all lives lost to weather-,
climate- and water-related disasters in the
region. The severe droughts in Ethiopia in 1975
and 1983 and in Mozambique and Sudan in
1983 and 1984 caused the majority of deaths.
Storms and floods, however, caused the high- A displaced woman repairs her makeshift shelter after heavy rains
est economic losses (78 per cent). flooded the region in Middle Shabelle, Somalia.
The 10 worst reported disasters in terms
of human deaths accounted for 97 per cent
(674 362) of the total number of lives lost. Disasters ranked according to reported (a) deaths and
The 10 biggest reported events in terms of (b) economic losses (1970–2012). TC indicates disasters caused by
economic losses accounted for 42 per cent tropical cyclones.
(US$ 11.3 billion) of all losses.
Number of
(a) Disaster type Year Country
deaths
1 Drought 1983 Ethiopia 300 000
2 Drought 1984 Sudan 150 000
3 Drought 1975 Ethiopia 100 000
4 Drought 1983 Mozambique 100 000
5 Drought 1975 Somalia 19 000
6 Flood 1997 Somalia 2 311
7 Flood 2001 Algeria 921
8 Flood 2000 Mozambique 800
9 Flood 1995 Morocco 730
10 Flood 1994 Egypt 600
Economic
(b) Disaster type Year Country losses (in
US$ billion)
1 Drought 1991 South Africa 1.69
2 Flood 1987 South Africa 1.55
3 Flood 2010 Madeira (PRT) 1.42
4 Storm (Emilie) 1977 Madagascar 1.33
5 Drought 2000 Morocco 1.20
6 Drought 1977 Senegal 1.14
7 Storm (Gervaise) 1975 Mauritius 0.85
8 Flood 2011 Algeria 0.79
9 Storm 1990 South Africa 0.69
10 Storm (Benedicte) 1981 Madagascar 0.63
10Map of reported disasters and their related deaths (1970–2012)
Algeria
42 floods reported;
a single event in 2001
Morocco caused more than
730 deaths due 900 deaths
Egypt
to a flood in 1995 600 deaths due
to a flood in 1994
East Africa
Droughts in 1975 (Ethiopia,
Somalia) and in 1983 and 1984
(Mozambique, Ethiopia and
Sudan) caused more than
600 000 deaths
Somalia
A flood in 1997 caused
over 2 300 deaths
Total number of
reported deaths
(1970–2012)
0 – 500
Mozambique
>500 – 1 200 A flood in 2000 led to
>1 200 – 22 000 800 deaths
>22 000 – 150 000
>150 000 – 410 000 The designations employed in WMO publications and the presentation of material in this
publication do not imply the expression of any opinion whatsoever on the part of WMO
No data or disputed
countries/territories concerning the legal status of any country, territory, city or area, or of its authorities, or
concerning the delimitation of its frontiers or boundaries.
Map of reported disasters and their related economic losses (in US$ billion, 1970–2012)
Algeria
Madeira (PRT) Losses of US$ 0.8 billion
Losses of US$ 1.4 billion related to a flood in 2011
due to a flood in 2010
Morocco
Losses of US$ 1.2 billion
related to a drought
in 2000
Senegal
A drought in 1977 cost
US$ 1.1 billion
Madagascar
Tropical cyclones were the
costliest events,
especially a storm
Total reported
in 1977 (US$ 1.3 billion)
economic losses
(1970–2012)
(in US$ billion)
Mauritius
0.0 – 0.1 The costliest event was
>0.1 – 0.6 a tropical cyclone in 1975
>0.6 – 1.2
South Africa (US$ 0.9 billion)
A drought in 1991 and a
>1.2 – 2.0 flood in 1987 cost over
>2.0 – 6.0 US$ 1.5 billion each, and The designations employed in WMO publications and the presentation of material in this
US$ 0.7 billion were associated
No data or disputed publication do not imply the expression of any opinion whatsoever on the part of WMO
with a tornado in 1990
countries/territories concerning the legal status of any country, territory, city or area, or of its authorities, or
concerning the delimitation of its frontiers or boundaries.
11
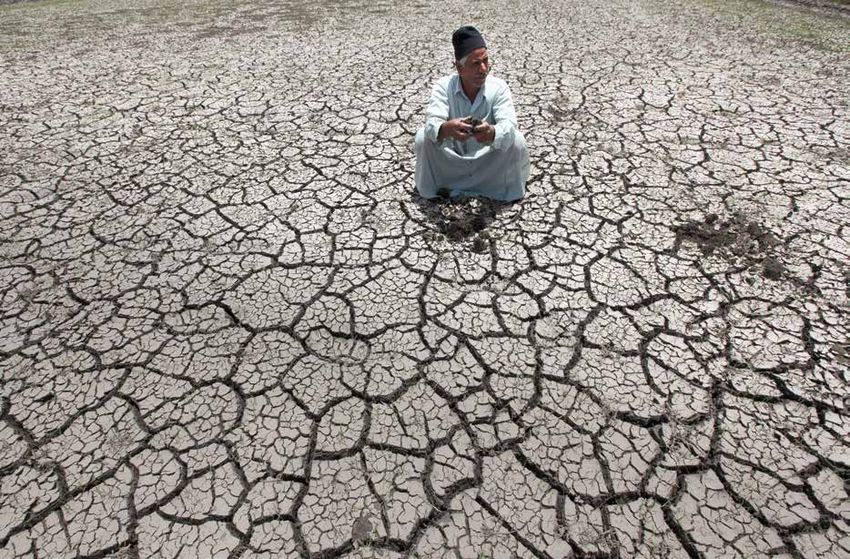
11Supporting drought risk management in Africa capacity development for seasonal climate prediction
in many parts of the globea. Recent advances in (sub-)
For more than 10 years, an innovative forum known as seasonal forecasting of droughts, combined with the
the Regional Climate Outlook Forum (RCOF), initiated WMO Integrated Drought Management Programmeb,
by NMHSs and Regional Specialized Meteorological are critical contributions that are helping Members
Centres (RSMCs) with the suppor t of the WMO improve monitoring, warning and mitigation of the
Secretariat, has been providing consensus-based impacts of droughts. This is accomplished by sharing
early warning seasonal climate information to help information, knowledge and good practices as the
reduce climate-related risks. Recognizing its vulner- basis for providing policy and management advice
ability to extreme hydrometeorological events and on the development of short- and long-term drought
climatic variability, Africa has been a pioneer in the management plans and actions. Improving drought
RCOF process. RCOFs have played a significant role in management is one of the priorities of the GFCSc .
a
For more information on RCOFs, see http://www.wmo.int/pages/publications/bulletin_en/archive/57_2_en/ogallo_en.html.
b
For more information on this Programme, see http://www.wmo.int/pages/prog/wcp/drought/idmp/.
c
For more information on the GFCS, see http://www.gfcs-climate.org/.
MOHAMED ABD EL GHANY / REUTERS
An Egyptian farmer squats down on cracked soil to show the dryness of the land due to
drought in a farm formerly irrigated by the river Nile.
12Distribution of the reported (a) number of disasters,
(b) deaths and (c) total economic losses by hazard type
in Africa (1970–2012)
Number of reported disasters by decade
Total = 1 319 disasters (1970–2012) 1 000
by hazard type (1971–2010)
2% 1%
800
18%
627
600
400
309
16%
61%
200 181
86
2%
0
1971−1980 1981−1990 1991−2000 2001−2010
Number of reported deaths by decade
Total = 698 380 deaths (1970–2012) 1 000 000
by hazard type (1971–2010)
1% 3%
800 000
600 000
554 981
400 000
200 000
120 708
10 194 10 598
0
1971−1980 1981−1990 1991−2000 2001−2010
96%
Reported economic losses by decade
Total = US$ 26.6 billion (1970–2012) 10.0
by hazard type (1971–2010)
2% 1%
19% 8.0
6.2 6.3
6.1
6.0 5.7
42%
4.0
2.0
36%
0.0
1971−1980 1981−1990 1991−2000 2001−2010
(in US$ billion, adjusted to 2012) (in US$ billion, adjusted to 2012)
Floods Mass movement wet Storms Droughts Extreme temperature Wildfires
13
13ASIA
In Asia, 2 681 disasters were reported in
the 1970–2012 period, resulting in the loss
of 915 389 lives and economic damages of
NASA
US$ 789.8 billion. Most of these disasters were
attributed to floods (45 per cent) and storms
(35 per cent). Storms had the highest impact Storm Nargis in 2008
on the number of deaths, causing 76 per
cent of the fatalities, while floods caused the
greatest economic loss (60 per cent). Three Disasters ranked according to reported (a) deaths and
tropical cyclones were the most significant (b) economic losses (1970–2012). TC indicates disasters caused by
events, striking Bangladesh and Myanmar tropical cyclones.
and leading to over 500 000 deaths. Economic
losses were caused primarily by disasters in
Number of
China, most notably by the 1998 floods. (a) Disaster type Year Country
deaths
1 Storm (TCa) 1970 Bangladesh 300 000
The 10 worst reported disasters accounted for
2 Storm (TC ) b
1991 Bangladesh 138 866
73 per cent (665 071) of the total deaths and
3 Storm (Nargis) 2008 Myanmar 138 366
29 per cent (US$ 227.5 billion) of economic
losses. The increase in mortality during the 4 Flood 1974 Bangladesh 28 700
periods 1991–2000 and 2001–2010 was mainly 5 Storm (TC) 1985 Bangladesh 15 000
due to two major tropical cyclones that caused 6 Storm (TC) 1977 India 14 204
significant loss of life in Bangladesh in 1991 7 Storm (TC) 1999 India 9 843
and Myanmar in 2008 (Cyclone Nargis). 8 Storm (TC) 1971 India 9 658
9 Flood 1980 China 6 200
10 Storm (Sidr) 2007 Bangladesh 4 234
Economic
(b) Disaster type Year Country losses (in
US$ billion)
1 Flood 1998 China 42.25
2 Flood 2011 Thailand 40.82
Democratic
People's
3 Flood 1995 22.59
Republic of
Korea
Extreme
4 2008 China 22.49
temperature
5 Drought 1994 China 21.33
6 Flood 2010 China 18.95
7 Flood 1996 China 18.45
8 Storm (Mireille) 1991 Japan 16.86
9 Flood 1991 China 12.65
10 Flood 1999 China 11.16
a
Otherwise known as Bhola; however, the name was given prior to 2004 when
a recognized tropical cyclone naming system was introduced in the region.
b
Otherwise known as Gorky; however, the name was given prior to 2004 when
a recognized tropical cyclone naming system was introduced in the region.
14Map of reported disasters and their related deaths (1970–2012)
China
Floods led to over
41 000 deaths,
India notably due to the event
Highest death tolls related to of 1980 (6 200 deaths)
tropical cyclones in 1977 (14 204 deaths),
1999 and 1971 (over 9 500 deaths each)
Total number of
reported deaths
(1970–2012)
0 – 2 000
Bangladesh
Severe flooding along the Myanmar >2 000 – 8 000
Brahmaputra river in 1974 Cyclone Nargis in 2008 led >8 000 – 60 000
caused 28 700 deaths to 138 366 deaths
>60 000 – 140 000
Bangladesh >140 000 – 520 000
Highest death tolls linked to devastating No data or disputed
cyclones, such as in 1970 (300 000 deaths), in 1991 countries/territories
(138 866), in 1985 (15 000) or Cyclone Sidr in 2007 (4 234)
The designations employed in WMO publications and the presentation of material in this publication do not imply the expression of any opinion whatsoever on the part of
WMO concerning the legal status of any country, territory, city or area, or of its authorities, or concerning the delimitation of its frontiers or boundaries.
Map of reported disasters and their related economic losses (in US$ billion, 1970–2012)
China
Among the 10 costliest disasters, 7 were
reported in China, mainly due to
floods (notably in 1998, US$ 42.3 billion),
Democratic People’s Republic of Korea
The flood in 1995 was the
but also to a cold wave in 2008 (US$ 22.5 billion)
costliest disaster (US$ 22.6 billion)
and a drought in 1994 (US$ 21.3 billion)
Total reported
economic losses
(1970–2012)
Japan
A tropical cyclone in 1991 (in US$ billion)
was the costliest event
(US$ 16.9 billion) 0.0 – 3.0
>3.0 – 17.0
India
A flood in 1993 cost >17.0 – 52.0
nearly US$ 11.1 billion >52.0 – 100.0
Thailand >100.0 – 380.0
Floods in the Bangkok area
No data or disputed
in 2011 cost US$ 40.8 billion
countries/territories
The designations employed in WMO publications and the presentation of material in this publication do not imply the expression of any opinion whatsoever on the part of
WMO concerning the legal status of any country, territory, city or area, or of its authorities, or concerning the delimitation of its frontiers or boundaries.
15
15The Bangladesh Cyclone Preparedness Programme: Bangladesh Meteorological Department to the authorities
saving lives through an early warning system for and the public at risk in coastal regions. Over the last
tropical cyclones 30 years, WMO has been working with its Members,
through its Tropical Cyclone Programme, to establish
In Bangladesh, following the tropical cyclones and storm RSMCs with expertise in tropical cyclone analysis and
surges in 1970 and 1991 that led to nearly 300 000 and forecasting to support NMHSs. The RSMC New Delhi
140 000 casualties, respectively, the Government worked works closely with countries at risk from tropical cyclones
together with the Bangladesh Red Crescent Society to in South Asia to provide bulletins and forecasts to help
implement the Cyclone Preparedness Programme. The NMHSs develop their respective warnings.
programme’s effectiveness was well demonstrated by
the much-reduced death toll – less than 3 500 lives lost Source: Arjumand, H., M. Shahidullah and A. Dilder, 2012:
– during the similar November 2007 Super Cyclone Sidr. The Bangladesh Cyclone Preparedness Programme. A Vital
The Cyclone Preparedness Programme uses a network Component of the Nation’s Multi-Hazard Early Warning System.
of over 42 000 volunteers, along with a transceiver In: Institutional Partnerships in Multi-Hazard Early Warning
telecommunications system, to ensure rapid and timely Systems (M. Golnaraghi, ed.), doi 10.1007/978-3-64225373-7,
delivery of tropical cyclone warnings produced by the Berlin, Heidelberg, Springer-Verlag.
U.S. AIR FORCE
Flooded village in Bangladesh after the 1991 storm
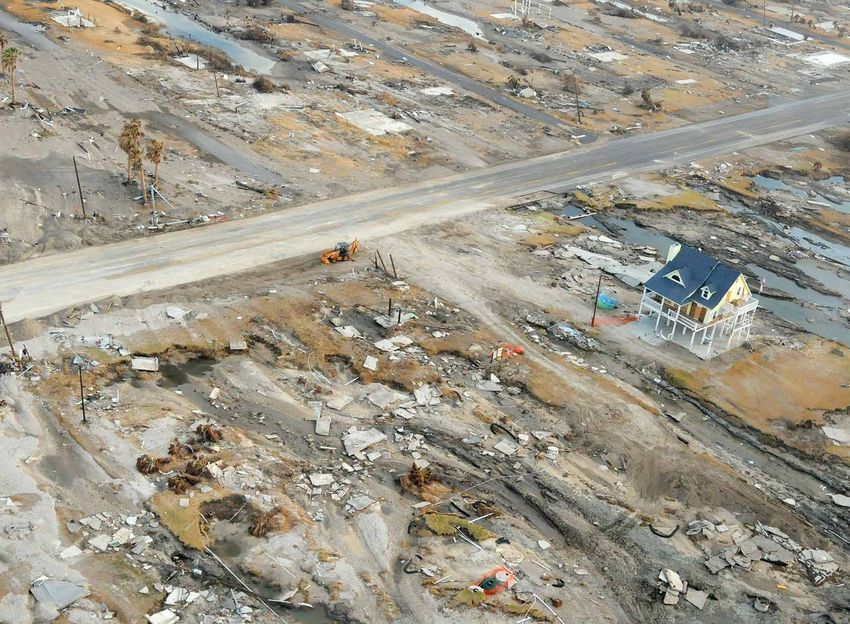
16Distribution of the reported (a) number of disasters,
(b) deaths and (c) total economic losses by hazard type
in Asia (1970–2012)
Number of reported disasters by decade
Total = 2 681 disasters (1970–2012) 2 000
by hazard type (1971–2010)
3%
5%
4%
1 600
1 200
1 038
45%
800 760
35%
454
400
247
0
1971−1980 1981−1990 1991−2000 2001−2010
8%
Number of reported deaths by decade
Total = 915 389 deaths (1970–2012) 500 000
by hazard type (1971–2010)
2%
20%
400 000
300 000
2%
238 051
203 365
200 000
100 000 90 587
73 954
76% 0
1971−1980 1981−1990 1991−2000 2001−2010
Reported economic losses by decade
Total = US$ 789.8 billion (1970–2012) 500.0
by hazard type (1971–2010)
3%
6%
400.0
337.4
300.0
241.1
30%
200.0
60%
100.0 87.2
34.3
0.0
1971−1980 1981−1990 1991−2000 2001−2010
(in US$ billion, adjusted to 2012) (in US$ billion, adjusted to 2012)
Floods Mass movement wet Storms Droughts Extreme temperature Wildfires
17
17SOUTH AMERICA
During the 43-year period of 1970 –2012,
CARLOS GARCIA RAWLINS / REUTERS
South America experienced 696 reported
disasters that resulted in 54 995 lives lost
and US$ 71.8 billion in economic damages.
Most of the reported disasters related to
weather, climate and water extremes involved
floods (57 per cent) and mass movement wet
(16 per cent). With regard to impacts, floods
caused the greatest number of casualties A woman reacts after her home was damaged in a flood in the
(80 per cent) and the most economic loss neighbourhood of Antimano, Caracas.
(63 per cent). The most significant event
during the period was a flood and wet mass
movement that occurred in the Bolivarian Disasters ranked according to reported (a) deaths and
Republic of Venezuela in late 1999 and caused (b) economic losses (1970–2012)
30 000 deaths. This single event skews the
loss of life statistics significantly for the Number of
(a) Disaster type Year Country
entire region. deaths
Venezuela,
The 10 worst reported disasters accounted for 1 Flood 1999 Bolivarian 30 000
63 per cent (34 688) of total deaths and 43 per Republic of
cent (US$ 30.7 billion) of economic losses. 2 Flood 2011 Brazil 900
3 Mass movement wet 1987 Colombia 640
4 Mass movement wet 1971 Peru 600
5 Flood 1998 Peru 518
6 Mass movement wet 1973 Peru 500
7 Flood 2010 Colombia 418
8 Extreme temperature 2010 Peru 409
9 Mass movement wet 1983 Peru 364
10 Extreme temperature 2003 Peru 339
Economic
(b) Disaster type Year Country losses (in
US$ billion)
1 Drought 1978 Brazil 8.10
Venezuela,
2 Flood 1999 Bolivarian 4.35
Republic of
3 Flood 1985 Argentina 2.77
4 Extreme temperature 1975 Brazil 2.56
5 Flood 1983 Argentina 2.30
6 Mass movement wet 1983 Peru 2.28
7 Flood 1984 Brazil 2.21
8 Flood 1984 Brazil 2.21
9 Flood 1988 Brazil 1.94
10 Drought 2005 Brazil 1.94
18Map of reported disasters and their related deaths (1970–2012)
Bolivarian Republic of Venezuela
A flash flood in December 1999
killed 30 000 people
Colombia
A landslide near Medellin in 1987
(640 deaths) and floods in 2010 (418 deaths)
were the two worst events
Peru
Landslides in 1971 (600 deaths) and
1973 (500 deaths), a flood in 1998 (518 deaths)
and a cold wave in 2010 (409 deaths) were
among the most severe disasters
Brazil
A flood in 2011 (900 deaths)
was the deadliest disaster
Total number of
reported deaths
(1970–2012)
0 – 215
>215 – 1 200
>1 200 – 5 700
>5 700 – 7 200
>7 200 – 31 000 The designations employed in WMO publications and the presentation of material
No data or disputed in this publication do not imply the expression of any opinion whatsoever on the part
countries/territories of WMO concerning the legal status of any country, territory, city or area, or of its
authorities, or concerning the delimitation of its frontiers or boundaries.
Map of reported disasters and their related economic losses (in US$ billion, 1970–2012)
Bolivarian Republic of Venezuela
A flash flood in December 1999
cost US$ 4.4 billion
Brazil
Peru Total losses of US$ 31.4 billion
A landslide in 1983 cost reported, notably due to a severe drought
nearly US$ 2.3 billion in 1978 (US$ 8.1 billion), a heatwave
in 1975 (US$ 2.6 billion) and
numerous floods
Total reported
economic losses
(1970–2012)
(in US$ billion)
Argentina
Nearly 97% of economic losses
0.0 – 0.8 related to floods, notably the Buenos Aires
flood of 1985 (US$ 2.8 billion)
>0.8 – 3.0 and the 1983 floods (US$ 2.3 billion)
>3.0 – 4.7
>4.7 – 16.0
>16.0 – 32.0 The designations employed in WMO publications and the presentation of material
No data or disputed in this publication do not imply the expression of any opinion whatsoever on the part
countries/territories of WMO concerning the legal status of any country, territory, city or area, or of its
authorities, or concerning the delimitation of its frontiers or boundaries.
19
19Impacts of the El Niño-Southern Oscillation in while droughts are reported in the mountainous and
South America Andean zones, engendering glacier retreat and water
availability issues. Precipitation patterns tend to be
Research conducted over recent decades has shed reduced in northern countries along the Atlantic coast
light on the role played by interactions between the (Colombia, Bolivarian Republic of Venezuela and
atmosphere and the ocean in the tropical belt of the Guyana), often leading to droughts in the Brazilian
Pacific Ocean. This interaction involves changes in north-east. In Argentina, Paraguay and Uruguay, rainfall
the sea-surface temperature and atmospheric pres- usually increases. The economic impacts of El Niño
sure (referred to as the El Niño-Southern Oscillation) can be considerable for fishing. The 1997–1998 event,
resulting in alterations in global weather and climate for instance, caused losses of up to US$ 4.5 billion
patterns, and particularly in the patterns of weather-, in Perua. The cessation of upwelling cold water cuts
climate- and water-related hazards. El Niño (when off the supply of nutrients, thus altering the marine
sea-surface temperatures in the central and eastern environment. This affects the capacity of ecosystems
tropical Pacific Ocean are substantially higher than to maintain the marine food chain and fish populations
normal) and La Niña (when sea-surface temperatures along the western coastline of South Americab. Since
in these regions are lower than normal) are strongly 2003, WMO has facilitated a process to provide El
linked to major climate fluctuations around the globe Niño/La Niña consensus-based updates, which are
and, once initiated, can last for 12 months or more, prepared on a quasi-regular basis (approximately once
leading to changes in weather patterns. For example, every three months) and are based on contributions
El Niño results in rainfall increases on the coasts of from leading centres around the world forecasting
South American countries (Ecuador, Peru and Chile), this phenomenonc .
a
For more information, see http://www.grida.no/publications/vg/lac/page/2753.aspx.
b
World Meteorological Organization, 1999: The 1997–1998 El Niño Event: A Scientific and Technical Retrospective (WMO-
No. 905). Geneva. http://library.wmo.int/pmb_ged/wmo_905_en.pdf.
c
For more information on these updates, see http://www.wmo.int/pages/prog/wcp/wcasp/enso_background.html.
REUTERS
Two trucks are overturned and others are stranded on a road after a mudslide caused
by heavy El Niño rains near Lima.
20Distribution of the reported (a) number of disasters,
(b) deaths and (c) total economic losses by hazard type
in South America (1970–2012)
Number of reported disasters by decade
Total = 696 disasters (1970–2012) 500
by hazard type (1971–2010)
4%
6%
400
7%
300
246
10%
200 183
57% 138
100
72
16%
0
1971−1980 1981−1990 1991−2000 2001−2010
Number of reported deaths by decade
Total = 54 995 deaths (1970–2012) 50 000
by hazard type (1971–2010)
4%
2%
40 000
14%
34 532
30 000
20 000
10 000
7 075
6 129
4 753
80% 0
1971−1980 1981−1990 1991−2000 2001−2010
Reported economic losses by decade
Total = US$ 71.8 billion (1970–2012) 50.0
by hazard type (1971–2010)
2% 5%
40.0
23%
30.0
24.8
20.0
14.7
12.7 12.9
1%
63% 10.0
6%
0.0
1971−1980 1981−1990 1991−2000 2001−2010
(in US$ billion, adjusted to 2012) (in US$ billion, adjusted to 2012)
Floods Mass movement wet Storms Droughts Extreme temperature Wildfires
21
21NORTH AMERICA, CENTRAL AMERICA
AND THE CARIBBEAN
In North America, Central America and the
Caribbean, the period from 1970 to 2012
saw 1 631 reported disasters that caused
the loss of 71 246 lives and economic dam-
ages of US$ 1 008.5 billion. The majority
of the reported hydrometeorological and
climate-related disasters in this region were
attributed to storms (55 per cent) and floods
(30 per cent). Storms were reported to be
NOAA
the greatest cause of casualties (72 per cent)
and economic loss (79 per cent). The most
significant events in terms of lives lost were Crew boat upside down after Hurricane Katrina,
Hurricane Mitch in 1998 (17 932 deaths), Louisiana, United States
which affected Honduras and Nicaragua,
and Hurricane Fifi in 1974 (8 000 deaths),
which affected Honduras. However, in terms
of economic damage, Hurricane Katrina in
2005 was the most costly disaster on record, Disasters ranked according to reported (a) deaths and
resulting in US$ 146.9 billion in losses. (b) economic losses (1970–2012)
The 10 worst reported disasters in terms Number of
(a) Disaster type Year Country
deaths
of human deaths accounted for 56 per cent
(39 879) of the total reported lives lost, and in 1 Storm (Mitch) 1998 Honduras 14 600
terms of economic damages, they accounted 2 Storm (Fifi) 1974 Honduras 8 000
for 38 per cent (US$ 388.2 billion) of all losses. 3 Storm (Mitch) 1998 Nicaragua 3 332
4 Mass movement wet 1973 Honduras 2 800
5 Storm (Jeanne) 2004 Haiti 2 754
6 Flood 2004 Haiti 2 665
7 Storm (Katrina) 2005 United States 1 833
8 Storm (Stan) 2005 Guatemala 1 513
9 Extreme temperature 1980 United States 1 260
10 Storm (Gordon) 1994 Haiti 1 122
Economic
(b) Disaster type Year Country losses (in
US$ billion)
1 Storm (Katrina) 2005 United States 146.89
2 Storm (Sandy) 2012 United States 50.00
3 Storm (Andrew) 1992 United States 43.37
4 Storm (Ike) 2008 United States 31.98
5 Storm (Ivan) 2004 United States 21.87
6 Drought 2012 United States 20.00
7 Storm (Charley) 2004 United States 19.44
8 Flood 1993 United States 19.08
9 Storm (Rita) 2005 United States 18.80
10 Storm (Wilma) 2005 United States 16.80
22Map of reported disasters and their related deaths (1970–2012)
United States
In terms of human losses, Hurricane Katrina (1 833 deaths)
and a heatwave in 1980 (1 260 deaths) were the worst events
Total number of
reported deaths Haiti
(1970–2012) Hurricanes Jeanne in 2004 (2 754
0 – 280 Guatemala deaths) and Gordon in 1994 (1 122),
Hurricane Stan in 2005 (1 513 deaths) and a flood in 2004 (2 665) were
>280 – 1 600 was the deadliest event the most severe events
>1 600 – 6 300
Nicaragua
>6 300 – 16 000 Hurricane Mitch in 1998 (3 332 deaths)
>16 000 – 27 000 caused the most deaths Honduras
Hurricanes Mitch in 1998 (14 600 deaths) and Fifi in 1974
No data or disputed
(8 000 deaths) were the two worst events in terms of human lives lost,
countries/territories
followed by a landslide in 1973 (2 800 deaths)
The designations employed in WMO publications and the presentation of material in this publication do not imply the expression of any opinion whatsoever on the part of
WMO concerning the legal status of any country, territory, city or area, or of its authorities, or concerning the delimitation of its frontiers or boundaries.
Map of reported disasters and their related economic losses (in US$ billion, 1970–2012)
United States
Apart from storms, a drought in 2012 (US$ 20.0 billion)
and floods in 1993 (US$ 19.1 billion)
reported the highest economic losses
Total reported
economic losses
(1970–2012)
(in US$ billion)
0 – 2.3
>2.3 – 5.3
>5.3 – 14.0
>14.0 – 38.0
>38.0 – 880.0 Hurricanes in the United States
No data or disputed Major hurricanes along the East coast
countries/territories such as Katrina (2005), Sandy (2012), Andrew (1992), Ike (2008), Ivan
or Charley (2004) account for highest economic losses of all time
The designations employed in WMO publications and the presentation of material in this publication do not imply the expression of any opinion whatsoever on the part of
WMO concerning the legal status of any country, territory, city or area, or of its authorities, or concerning the delimitation of its frontiers or boundaries.
23
23Building on 30 years of regional cooperation in and Emergency Management Agency and a number of
hurricane forecasting to strengthen support for international and regional partners to:
disaster risk management in the Caribbean and
Central Americaa • Strengthen national and regional institutional
capacities and cooperation among NMHSs, disaster
With over 30 years of regional cooperation in tropical risk management agencies and other stakeholders.
cyclone forecasting and warnings, facilitated by WMO,
the Central American and Caribbean regions have • Improve coordination among hydrometeorological
demonstrated the benefits of regional cooperation systems (for example, by building on the existing
to reduce the impacts of tropical cyclones and other regional coordination for tropical cyclones watch and
related hazards. For example, in the Caribbean region, warnings in the Caribbean), and among responsible
extensive cooperation in disaster risk management has agencies and early warning networks concerned with
been developed under the Comprehensive Disaster other hazards (such as tsunamis and the Caribbean
Management project of the Caribbean Disaster and Tsunami Warning Centre, under development by
Emergency Management Agency, underpinned by the the Intergovernmental Coordination Group for the
Hyogo Framework for Action 2005–2015b. Building on Tsunami and other Coastal Hazards Warning System
this, WMO is collaborating with the Caribbean Disaster for the Caribbean and Adjacent Regions).
a
For more information, see http://www.wmo.int/disasters/.
b
For more information, see http://www.unisdr.org/we/coordinate/hfa.
REUTERS
Women walk along a flooded street in Gonaives, Haiti.
24Distribution of the reported (a) number of disasters,
(b) deaths and (c) total economic losses by hazard type
in North America, Central America and the Caribbean
(1970–2012)
Number of reported disasters by decade
Total = 1 631 disasters (1970–2012) 1 000
by hazard type (1971–2010)
6%
3%
4% 800
30%
606
600
493
400
286
2%
200
117
55% 0
1971−1980 1981−1990 1991−2000 2001−2010
Number of reported deaths by decade
Total = 71 246 deaths (1970–2012) 50 000
by hazard type (1971–2010)
6%
16%
40 000
6% 30 000 28 179
20 000
17 653
15 816
10 000
7 638
0
72%
1971−1980 1981−1990 1991−2000 2001−2010
Reported economic losses by decade
Total = US$ 1 008.5 billion (1970–2012) 500.0
by hazard type (1971–2010)
452.9
3%
9% 3%
6%
400.0
300.0
236.6
200.0
100.0
78.4
70.2
0.0
1971−1980 1981−1990 1991−2000 2001−2010
79%
(in US$ billion, adjusted to 2012) (in US$ billion, adjusted to 2012)
Floods Mass movement wet Storms Droughts Extreme temperature Wildfires
25
25SOUTH-WEST PACIFIC
The South-West Pacific experienced 1 156
reported disasters in 1970–2012 that resulted
in 54 684 lives lost and US$ 118.4 billion
in economic losses. The majority of these
disasters were caused by storms (46 per cent)
ERIK DE CASTRO / REUTERS
and floods (38 per cent).
Storms were reported to be the greatest cause
of deaths (68 per cent). Economic losses were
more evenly distributed amongst the four
hazard types: storms (46 per cent), drought
(18 per cent), wildfire (14 per cent) and floods Children look out from a window of a roofless house destroyed at
(21 per cent). The most significant reported the height of Typhoon Bopha in the Philippines.
disasters with regard to lives lost were tropical
cyclones, mainly in the Philippines, including
the event of 1991, which took 5 956 lives. As Disasters ranked according to reported (a) deaths and
for economic damages, the 1981 drought in (b) economic losses (1970–2012). TC indicates disasters caused by
Australia caused US$ 15.2 billion in economic tropical cyclones.
losses and the 1997 wildfires in Indonesia
caused US$ 11.4 billion in losses. Number of
(a) Disaster type Year Country
deaths
The 10 worst reported disasters accounted 1 Storm (Thelma) 1991 Philippines 5 956
for 33 per cent (17 933) of the total deaths and 2 Storm (Bopha) 2012 Philippines 1 901
50 per cent (US$ 59.0 billion) of the economic 3 Storm (TC) 1973 Indonesia 1 650
losses. 4 Storm (Winnie) 2004 Philippines 1 619
5 Storm (Washi) 2011 Philippines 1 439
6 Storm (Durian) 2006 Philippines 1 399
7 Mass movement wet 2006 Philippines 1 126
8 Storm (Agnes) 1984 Philippines 1 079
9 Storm (Angela) 1995 Philippines 882
10 Storm (Nina) 1987 Philippines 882
Economic
(b) Disaster type Year Country losses (in
US$ billion)
1 Drought 1981 Australia 15.15
2 Wildfire 1997 Indonesia 11.44
United States
3 Storm (Iniki) 1992 8.18
(Hawaii)
4 Flood 2011 Australia 7.45
5 Storm (Tracy) 1974 Australia 3.72
6 Storm (Alby) 1978 Australia 3.52
7 Storm (Yasi) 2011 Australia 2.55
8 Drought 2002 Australia 2.55
9 Drought 1994 Australia 2.33
10 Storm 1999 Australia 2.07
26Map of reported disasters and their related deaths (1970–2012)
Indonesia and Philippines
More than half of South-West Pacific disasters were
reported in these two countries; over 46 000 deaths
were reported (93% of total people killed
in the South-West Pacific), mainly due to tropical cyclones such
as in the Philippines in 1991 (5 956 deaths) or
in Indonesia in 1973 (1 650 deaths)
Total number of
reported deaths
(1970–2012)
0 – 55
>55 – 355
>355 – 840
>840 – 12 000
>12 000 – 42 000
The designations employed in WMO publications and the presentation of material in this
publication do not imply the expression of any opinion whatsoever on the part of WMO No data or disputed
concerning the legal status of any country, territory, city or area, or of its authorities, or countries/territories
concerning the delimitation of its frontiers or boundaries.
Map of reported disasters and their related economic losses (in US$ billion, 1970–2012)
The designations employed in WMO publications and the presentation of material in this
publication do not imply the expression of any opinion whatsoever on the part of WMO
concerning the legal status of any country, territory, city or area, or of its authorities, or
concerning the delimitation of its frontiers or boundaries.
United States (Hawaii)
Indonesia Hurricane Iniki in 1992 cost
A forest fire in 1997 led US$ 8.2 billion
to losses of more
than US$ 11.4 billion
Total reported
economic losses
(1970–2012)
(in US$ billion)
0.00 – 0.05
>0.05 – 0.45
>0.45 – 1.90
Australia >1.90 – 18.2
More than 60% of overall economic losses
in South-West Pacific were reported in Australia, >18.2 – 68.0
including the 1981 drought (US$ 15.2 billion), No data or d isputed
the 2011 floods (US$ 7.5 billion) and several tropical cyclones countries/territories
such as in 1974 or in 1978 (more than US$ 3.5 billion each)
27
27Managing weather-, climate- and water-related and regional partners to strengthen technical and
disasters in the South-West Pacific operational capacities for early warnings of severe
weather and other water- and climate-related hazards
Building on the Integrated Regional Strategy for in the region. The aim is to assist NMHSs in provid-
Disaster Risk Management and Climate Change in the ing effective warnings to disaster risk management
Pacifica, WMO is working with a number of international authorities.
a
http://reliefweb.int/report/world/roadmap-towards-integrated-regional-strategy-disaster-risk-management-and-climate
NASA
Tropical Cyclone Yasi in 2011, over the Coral Sea
28You can also read