Modeling fish production in Lake Kariba to inform mitigation of adverse impacts of climate change
←
→
Page content transcription
If your browser does not render page correctly, please read the page content below
ACCFP Final Technical Report
           Modeling fish production in Lake Kariba to inform mitigation of
                            adverse impacts of climate change
                                  Mzime R. Ndebele-Murisa

Abstract
The climate around Lake Kariba and the water quality of the lake as well as the flora and fauna
(phytoplankton and fish production) in the lake were investigated. In comparison to past studies,
the data showed considerable change in the limno-chemistry and thermal state of the waters of
Lake Kariba as overall decreases of the major nutrients (nitrogen and phosphorous) as well
changes in some physico-chemical parameters namely pH, temperature, conductivity and Total
Dissolved Solids (TDS) suggesting that the lake is moving from an oligotrophic to a
mesotrophic-eutrophic state. In addition, the results reflect that there has been a shift in the
thermocline from 15 to 7 meters in the lake thereby reducing the optimal habitat for
phytoplankton in space. This was supported by decreased phytoplankton biomass levels. Also,
the assemblage of the phytoplankton in Lake Kariba suggests a progression towards a
community that is being altered by temperature and reduced nutrients particularly nitrogen
which is limiting in the lake. There has been an increase in the dominance of cyanobacterial
species particularly in the winter season. These changes were attributed to climate change and
in particular global warming as temperature changes in the Middle Zambezi, where Lake Kariba
is, are occurring at a faster rate than model predictions have projected. Therefore, it can be
concluded that the waters of Lake Kariba has warmed up in response to the warming of the air
temperatures, this leading to an altered phytoplankton community and subsequently, decreasing
fish production. There is an urgent need to circumvent the effects on the fish production in the
lake and mitigate against the climate changes if adequate mechanisms and remedial measures
are to be effectively implemented in the fishery management.

Acknowledgement
This project was funded through the African Climate Change Fellowship Program (ACCFP).
The ACCFP is supported by a grant from the Climate Change Adaptation in Africa (CCAA),
funded jointly by the International Development Research Centre (IDRC) of Canada and the
UK’s Department of International Development (DFID). The International START Secretariat is
the implementing agency in collaboration with the Institute of Resource Assessment (IRA) of the
University of Dar Es Salaam and the African Academy of Sciences (AAS).
Introduction
Climate change is likely to be exerting much influence on biotic interactions in aquatic
ecosystems (DeSanker and Magadza, 2001; Phoon et al., 2004; Komatsua et al., 2007; IPCC,
2007). Despite this, the link between climate, hydrological factors, plankton and fisheries has
not been documented widely in Lake Kariba and in most African aquatic systems in contrast to
the extensive research in the temperate regions and oceans whose research shows that climate
change has reduced phytoplankton productivity and fish production (Alheit and Niquen, 2004;
Atkinson et al., 2004; Barnard et al., 2004; Beardell and Raven, 2004; Hays et al., 2005;
Thompson et al., 2008; Taylor, 2008). However, a number of works (Hernes et al., 1995; Hulme
1996; Joubert et al., 1996; Joubert and Hewitson, 1997; Hewitson and Crane, 1998; Hewitson
and Joubert, 1998; Hulme and Viner, 1998; Hulme et al., 2001) have shown the precarious
extent to which climate changes may occur and therefore adversely influence freshwater
ecosystems in the African continent (Hulme, 1994; IPCC, 2007).
The Intergovernmental Panel on Climate Change (IPCC) has projected temperature
rises ranging from 1.4 to 5.8°C (IPCC, 2001) over the African continent whilst regional
assessments for southern Africa give a warming of 1.7 to 2.5°C by 2050 and 2 to 3°C by 2100
(Hulme et al., 2001; IPCC, 2001) and more recent projections give estimates of 1 to 3.5°C by
2100 (IPCC, 2007). Hulme et al. (2001) showed that areas over the Sahara and semi-arid parts
of southern Africa such as the Zambezi Valley, where Lake Kariba is located, will warm up by as
much as 2.5ºC by 2050 whilst the IPCC (2001) has shown how surface runoff will decrease in
the Zambezi Basin; this supported by evidence from Cambula (1991), Vörösmarty and Moore
(1991), Arnell (1999) as well as DeSanker and Magadza (2001). In addition to these forecasts,
present climate trends suggest a gradual reduction in river flow and velocity as well as in the
regularity and intensity of annual inundations of the Zambezi floodplain in the heart of the region
(Magadza, 1994), due to the level of precariousness already described; this potentially having
rapid and catastrophic impacts and implications for productivity of Lake Kariba.
In addition, climate and any changes in climate influence the properties of the lake
waters. The physical and chemical environment in tropical lakes is largely influenced by
temperature which determines the degree and extent of thermal stratification and internal
hydrodynamics in the waters. Stratification results in the separation of waters at differingdensities and consequently vertical profiles of physical and chemical attributes with factors like
temperature, conductivity, dissolved oxygen, dissolved solids concentration, pH, light intensity,
radiation and nutrients varying with depth. The concentration of these factors determines the
trophic status and health of the lake waters. Increased water temperature influences the thermal
stratification and internal hydrodynamics of lakes. In warmer years, surface water temperatures
are higher, evaporative water loss increases, summer stratification occurs earlier in the season,
and thermoclines become shallower (IPCC, 2007), thereby adversely affecting nutrient levels
and availability and consequently the production chain in the lakes. Also due to warming, many
tropical lakes exhibit prolonged stratification with decreases in surface layer nutrient
concentration and prolonged depletion of oxygen in deeper layers. High evaporation coupled
with decreased rainfall due to global warming means there will be reduced water flow and water
levels in the lakes and as a result, the nutrient concentrations in the waters are also reduced;
this reducing phytoplankton biomass. The reduction in primary production consequently, has
adverse, cascading impacts on the higher trophic levels’ production, such as fish. Evidence of
the impacts of climate changes expected in freshwater ecosystems and particularly those in the
tropics include changes in species composition, organism abundance, productivity and
phenological shifts, including earlier fish migration as a consequence of warming and the
subsequent high evaporation rates, reduced rainfall and water levels (IPCC, 2007). However,
despite on-going and past research efforts, direct linkages of the impacts of climate change on
African aquatic ecosystem functions have, up to now, not been documented widely (Ndebele-
Murisa et al., 2010).
Reduced depths of light transparent epilimnion, due to upward shifts in thermocline in
response to elevated temperatures, could potentially adversely affect primary production in
deep African lakes such as Kariba, Malawi, Tanganyika and Victoria. Increased water
temperatures associated with climate warming cause a shift in phytoplankton species
composition from Chlorophyta to Cyanophyta which are competitively superior at higher
temperatures. Microcosm studies have demonstrated that elevated temperatures suppress total
zooplankton biomass by altering phytoplankton community composition towards high
temperature-tolerant species, though total phytoplankton biomass is not usually altered (Doney,
2006). In the deep, meromictic Lake Tanganyika, warming has increased water column stability
and decreased vertical mixing thereby reducing nutrient loading to the upper mixed layer
(O’Reilly et al., 2003). Observations since 1974 in this lake document decreases in
phytoplankton abundance and increases in dissolved silica, both indicative of declining primary
production with negative implications for the pelagic fishery which accounts for more than 90%of all landings (O’Reilly et al., 2003; Stenuite et al., 2007). However, fishing effort continues to
rise and technologies have improved so that landings have increased during the warming period
making it difficult to decipher any impact on the fish productivity in response to warming and
phytoplankton shifts.
As water temperatures increase, algal succession follows a progression from diatoms
through to chlorophytes to cyanobacteria (Pliński and Jóźwiak, 1999). The preponderance of
cyanobacteria at higher water temperatures (> 25°C) has led to concerns that increased water
temperatures due to global warming could result in a decline in the production of palatable
chlorophytes leading to decreased zooplankton production and a consequent decline in fish
stocks. Indeed, fisheries data from Lake Tanganyika show significant correlations with climatic
(ENSO) data over the last 40 years (Stenuite et al., 2007). This suggests that moderate
warming could destabilize plankton dynamics, thereby potentially reducing water quality and
food resources for higher trophic levels such as planktivorous fish as seen in shallow cold-water
ecosystems (Strecker et al., 2004). Also, oxygen depletion and release of toxins caused by algal
bloom die-off may lead to massive fish mortalities, as reported in Lake Chivero (Moyo, 1997;
Mhlanga et al., 2006).
The link between climate, hydrological factors and fisheries has been noted and it is
clear that long-term changes in plankton will have significant knock-off effects on fish stocks.
The evidence for these impacts on the phytoplankton community and consequently fish
production has been documented for Lakes Kivu, Malawi, Tanganyika and Victoria (O’Reilly et
al., 2003; Bergamino et al., 2007; Stenuite et al., 2007; Awange et al., 2008).
However, the question is how sensitive Lake Kariba is to climate variability and more importantly
to what extent climate change will impact the phytoplankton community and ultimately the
fishery. This study investigated the trends in the climate, water levels, phytoplankton and
Kapenta fish production since the successful introduction of the sardine into Lake Kariba in
1968. An attempt was made to determine the influence of climate and water levels on the fish
production as well as to investigate the cause(s) to the declining fish stocks.
Study rationale
Lake Kariba is the third-largest man-made lake in the world and serves as a reliable source of
water for the surrounding catchment. It is of immense economical value as it is a source of
ecotourism, recreation, hydroelectric supply and commercial fisheries. The lake is of ecological
significance as a diverse number of aquatic organisms are supported within its ecosystem.
Despite the importance of Lake Kariba, little research has been conducted on the phytoplanktoncommunity and primary production and as a result there is a knowledge gap in that area. Only
two detailed studies have been conducted namely by Ramberg (1983-87) and Cronberg (1986-
90). Phytoplankton forms the base of the food web in the lake and therefore variations in
phytoplankton primary production can influence fish production. Fish production, particularly of
the sardine Limnothrissa miodon (Boulenger) has been decreasing in the past twenty years
(1987-2007) in Lake Kariba and this not only affects the livelihoods of the local people and the
commercial fishing industry but the ecological health of the lake. At the same time, variations in
fisheries yield may also be related to the community structure of the phytoplankton.
Concurrently, environmental variables such as river discharges and nutrient dynamics that
determine the phytoplankton community are related to climate which is also changing around
the lake. There is therefore a need to investigate the phytoplankton community and changes in
climate and determine the impacts such changes would have on the production in the lake in
order to mitigate against and/or adapt to climate change and in formulating management
strategies.
The study of phytoplankton communities enables us to understand energy flows and
food web dynamics in aquatic ecosystems. This is because phytoplankton assemblages form
the base of the food web and consequently, changes in phytoplankton biomass and variations in
primary production have implications for the whole community, including fish (Brett and Müller-
Navarra, 1997; Ahlgren et al., 2005). Phytoplankton form the vital energy source at the first
trophic tier as primary producers and have an important role in nutrient circulation in aquatic
ecosystems by controlling the growth, reproductive capacity and population characteristics of
aquatic biota. Furthermore, their standing crops exhibit variations that depend on several
factors, including the supply of major nutrients (mainly phosphorus and nitrogen); light
availability; grazing by zooplankton; water mixing regimes; and basin morphometry (Reynolds,
2001; Gurung et al. 2006). Evaluation of phytoplankton community structure is essential,
therefore, to evaluation of the water environment. Phiri et al. (2006) found that the epiphytic
diatoms associated with the macrophyte Vallisneria aethiopica in the margins of the Lake Kariba
to be highly sensitive to environmental changes including temperature variations thereby
proving that phytoplankton can be used as biological indicators of the environment in and
around the lake.
Studies of the primary production and phytoplankton biomass in Lake Kariba have been
few, dispersed and discontinuous. In contrast, the knowledge on zooplankton (Fryer, 1957;
Begg, 1976; Thomasson, 1965; Cochrane, 1978; Magadza, 1980; Marshall, 1980; Masundire,
1989, 1991, 1994, 1997; Mandima, 1999; Harding and Rayner, 2001) and fish biology (Jackson,1961; Bell-Cross and Bell-Cross, 1971; Begg, 1976; Cochrane, 1978, 1984; Marshall, 1984,
1985, 1988; Machena, 1988; Moyo, 1990,1994; Sanyanga, 1996; Mandima, 1999; Chifamba,
2000; Moyo and Fernando, 2000; Zengeya and Marshall, 2008) is vast and was promoted by
the introduction of the Tanganyika sardine, Limnothrissa miodon and subsequent development
of fisheries in the lake. The phytoplankton ecology of Lake Kariba is far from well known as
initially most of the studies were merely qualitative and only recorded the floristic composition.
The results of this study will not only update and complement the knowledge on phytoplankton
ecology of Lake Kariba but of tropical freshwater lakes and will be the first study that will attempt
to link climate directly to the primary production of the lake.
Activities
I have managed to conduct three short visits (July and October 2009; May 2010) to my Host
institution, the University of KwaZulu-Natal for one-week intensive sessions. During the
ACCFPP Doctoral Fellowship I have managed to cover the following activities:
• Collection of Kariba climate data from the Meteorological Department of Zimbabwe; the
data includes daily evaporation rates, rainfall and temperature (minimum and maximum)
levels
• Collection of Lake Kariba daily water levels data from the Zambezi River Authority (ZRA)
• Collection of fish catches data from the Lake Kariba Fishery Research Institute
During the visits I had the opportunity to work closely with my Host Supervisor and other experts
in my field who are based at UKZN namely Prof. Onisimo Mutanga, an expert in remote
sensing. In agreement with my Home Supervisor; we set up a working collaboration and a
scheme to write paper drafts and thesis chapters that form part of my thesis.
I also worked extensively in Cape Town at the University of the Western Cape where I am
registered for the PhD and this work included the analyses of water samples in the laboratory,
data entry and statistical analyses and the subsequent writing up of the thesis.
In addition, I had the opportunity to return to my Home Institution (University of
Zimbabwe) in December 2009 to February 2010. During these three months I worked with my
Home Supervisor on the thesis draft and in particular the thesis structure. I also set up some
temperature manipulation experiments which investigated the effects of temperature on thegrowth of algae. The idea was to try to mimic conditions in Lake Kariba by simulated
temperature treatments over and above the range found in the lake and measure the impact of
the temperature on the growth of phytoplankton.
Outcomes
Two peer-reviewed papers have been published from the work conducted during the fellowship
and these are:
1. Ndebele-Murisa M.R., Musil C., Raitt L. (2010) A review of phytoplankton dynamics in
tropical African lakes. South African Journal of Science, 106, 13-18.
2. Ndebele-Murisa M.R. et al (in press). The use of remote sensing in monitoring the
phytoplankton production of Lake Kariba. Geography
In addition, three manuscripts have been drafted from the research work and are presently
being reviewed in various journals. These manuscripts are entitled as following:
1. Ndebele-Murisa M.R., Mashonjowa E. and Hill T. The implications of a changing climate
on the Kapenta fish stocks of Lake Kariba. Submitted to Transactions of Royal Society of
South Africa
2. Ndebele-Murisa M.R. and Musil C. The physical and chemical characteristics of Lake
Kariba. Submitted to Limnology and Oceanography
In addition to the manuscripts and journal articles, I intend to publish my PhD thesis as a book
through the Lambert Academic Publishers (Germany). This will be done after the PhD thesis is
handed in November of this year (2010).
I have taken part in the organisation of workshops in Kariba (January 2010) where
consulation, debates and solutions to environmental problems in and around Lake Kariba are
discussed by engaging different stakeholders that include school children and local fishermen.
These workshops are annual events which are held at the University of Zimbabwe Lake Kariba
Research Station (ULKRS) where I was based during the field work phase of my PhD program.
I have also disseminated part of my research work through the media as I was invited to
discuss our journal article (Ndebele-Murisa et aI., 2010) by the Science Editor of the popular
South African Newspaper, The Mail and Guardian on the 29th of April 2010. Christina Scott
hosts a show every Thursday evening called ‘Science Matters” and in this particular session,
she interviewed lead authors of articles in the South African Journal of Science (SAJS) Jan/FebIssue as well as the Editor Prof. Michael Cherry. The idea of the show is to ‘break down the
science’ to a wide audience and get them excited about Science and this assisted me in
articulating my results in a simple way that the layman can understand.
I have incoperated my research findings and added knowledge in climate science
research into teaching material for Undergraduate courses. I lecture at the Universit of
Zimbabwe’s Biological Sciences Department in two Ecology courses. I have been offering the
climate change component in the course since I began my research in 2007 but with more
conclusive results and analyses I am more confident in delivering the lecture notes and
stimulating the students into healthy debates.
Methods
Study area
The study was conducted at Kariba, in Zimbabwe (16.5°S, 28.8°E; 518 m above sea level).
Kariba is predominantly semi-arid with mean annual temperatures of 26°C and mean annual
rainfall of 766 mm and evaporation exceeding 2 000 mm, respectively (Sayce, 1987). Kariba lies
wholly in Natural Region V (5) which is characterised by low and erratic rainfall. The rainfall
coefficient of variability for Kariba is about 30%, which shows how unreliable the rainfall is.
Field sampling
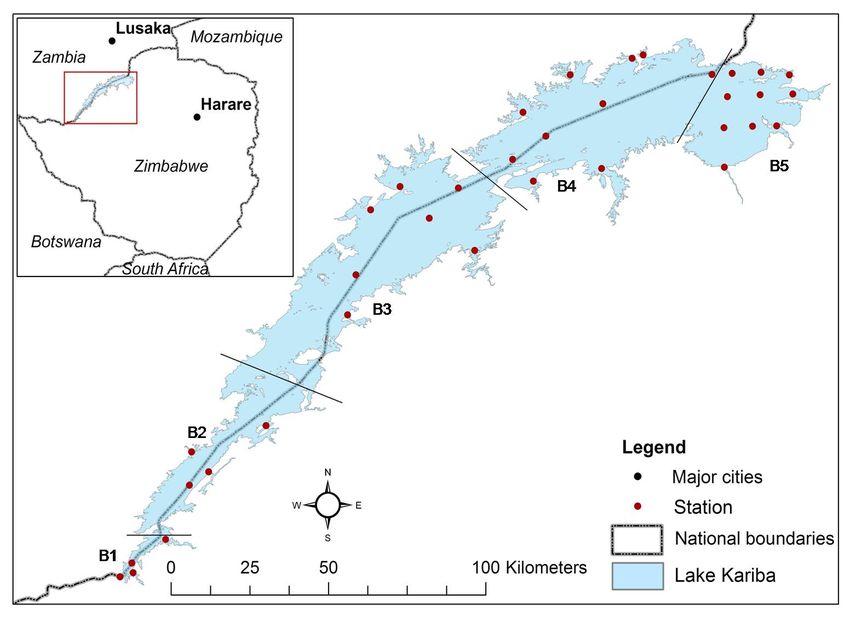
The experimental design comprised 35 sampling stations distributed along the lake (16-18°S,
27-29°E) from Basin 1 in the south west to Basin 5 in the north east (Figure 1). Four of these
sampling stations were located in Basin 1, four in Basin 2, seven in Basin 3 and 10 in Basin 4.
They were distributed along both the northern and southern lake margins in proximity to river
inflows and also in the centre of the lake. The remaining ten sampling stations were distributed
along three transects in Basin 5 (Sanyati Basin) where the majority of previous limnological
studies have been conducted (Begg, 1976; Magadza, 1980; Masundire, 1994; Lindmark, 1997).
Four of these stations in this basin were located along the lake margin in close proximity to the
Charara, Nyaodza, Gache-gache and Sanyati river inflows and designated riverine habitats. The
other six stations traversed the center of the basin and were designated lacustrine habitats. All
35 sampling stations were subdivided into 6 depth zones of 0m, 2m, 5m, 10m, 15m and 20m.
At all 35 sampling stations, physical and chemical measurements of lake water in all six
depth zones were performed on two separate occasions, namely during lake turnover in winter(July) and again during lake stratification in summer (February).
Physical and chemical properties of lake water
At each sampling station and in each depth zone, water temperature, pH, conductivity,
dissolved oxygen (DO) and water transparency to photosynthetically active radiation (PAR)
were measured under clear sky conditions two hours on either side of midday (1000 to 1400
hours) with sensors interfaced with portable meters (Hach Co., Germany; LiCor, Lincoln, NE,
USA). For chemical assays, 20l water samples were collected from each depth zone with a
Ruttner sampler and filtered through 0.5µm GF/F filters (Whatman, Germany). The filtered water
samples were transferred into 500ml polyethylene bottles, frozen and transported to the
laboratory.
Figure 1. Location of sampling stations in Lake Kariba’s five basins with those located in the
centre of the lake designated lacustrine and those located along the lake margin in proximity toriver inflows designated riverine. Basin delineation modified from the original description (Balon
and Coche, 1974)
Total nitrogen concentrations in the defrosted water samples were determined by the micro-
Kjeldahl distillation method (Volleinweider, 1969). Devardas alloy was added to catalyse the
reduction of NO3-N and NO2-N to NH4+-N. The total N concentrations as NH4+-N were
determined calorimetrically at 425 nm with a Hach spectrophotometer (DR010 Hach Co.,
Loveland, Colorado, USA) after the addition of potassium sodium tartrate and Nesslers reagent
which is suitable for the detection of low levels of nitrogen (between 0.02 and 5.0 mg NH4+ l¯¹).
Soluble reactive phosphorus (PO4-P) concentrations in the defrosted water samples
were determined calorimetrically by the molybdate colour reaction method (Volleinweider,
1969). Potassium persulphate was added to the samples which were then autoclaved and
thereafter molybdate antimony acid was added to the sample followed by the addition of
ascorbic acid. After allowing the development of colour (ten minutes), the sample’s absorbance
was read off a Hach spectrophotometer (DR010 Hach Co., Loveland, Colorado, USA) at 882
nm and the phosphate levels were calculated using known standards. Organic matter was
extracted from the water samples with inert glass fibre filters and their dissolved organic carbon
(DOC) concentrations determined from their measured reductions in mass following high
temperature catalytic combustion (Dafner and Wnagnsky, 2002).
Biomass measurements
Phytoplankton biomass measurements were taken twice in all five basins; once in July
2007 and in February 2009 at the 35 sampling stations from the most downstream (Basin 5) to
the most upstream basins (Basin 1). The Zambian side of the lake was sampled first and then
the Zimbabwean side last in order to ease the navigation of the waters and across the national
boundary. The first sampling trip was conducted from 4 to 25 July 2007; representing the lake at
turnover in the winter season whilst the second trip (from 07 to 21 February 2009) representing
the stratified period during the summer season.
Chlorophyll a concentration was used as an estimate of phytoplankton biomass and in
situ measurements were taken at each site using the phytoplankton analyzer (Schreiber, 1998).
The measurements were taken at each depth zone under clear sky conditions two hours on
either side of midday (1000 to 1400 hours). The effective quantum yield of photosystem II was
determined with a modulated portable fluorometer (Phyto-PAM, Heinz Walz GmbH, Effeltrich,
Germany) using the saturation pulse method. Fresh, unfiltered 2- 3 ml samples of watercollected from each depth zone with the Ruttner sampler were placed into the special 15 mm Ø quartz cuvettes optimized for low background signal corresponding to ca. 0.2 µg chlorophyll liter¯¹. The background signal was determined with filtered water and phytoplankton related signals corresponding to less than 0.1 µg chlorophyll l¯¹ were assessed. The Emitter-Detector Unit WATER-ED attached to the PAM control unit comprised a red LED-array (peak emission 645-750 nm) for fluorescence excitation, actinic illumination and saturation pulses, as well as far-red LEDs for preferential excitation of photosystem II. Fluorescence emission was measured at λ>710 nm with the highly sensitive photomultiplier detector. Different coloured filters were applied to determine the relative fluorescence responses of diatoms, Chlorophyta and cyanobacteria. The fluorometer was calibrated with pure cultures of diatoms, Chlorophyta and cyanobacteria that were cultured from Lake Kariba (2006). Statistical analysis All measurements were loge transformed before statistical analysis to reduce the inequality of variance in the raw data so these conformed more closely to normal distributions (Figure 2). As the experimental design was not fully balanced due to missing measurements, a REML (residual maximum likelihood) variance component analysis (repeated measures mixed model) was applied to test for significant differences using the Wald Х2 statistic generated by REML (GENSTAT Discovery Edition 3, VSL Lty, UK). The first REML analysis of all 35 sampling stations tested for significant differences in measured physical and chemical properties as well as the phytoplankton biomass and primary production of lake water between summer and winter months, lake basins and water depth and their interactions. Lake basins and water depth were fitted in the fixed model and month in the random model. Habitat and water depth were fitted in the fixed model and month in the random model. Differences exceeding twice the average standard error of differences were used to separate significantly different treatment means at P ≤ 0.05. This is based on the fact that for a normal distribution from REML estimates, the 5% two-sided critical value is two.
Figure 2. Normal distribution plots for A. untransformed and B. Loge transformed PAR
measurements

Collection of secondary data
Historical data were collected from various organisations and research groups that have been
investigating the climate, water levels and fisheries of Lake Kariba. In an attempt to cover the
period from when the lake was created to date, as much data from the earliest records which
could be obtained, was collected. This data included fisheries production levels of the artisanal
fish obtained from experimental gillnetting and Limnothrissa miodon (Kapenta) catches and the
Catch per Unit Effort (CPUE), daily climatic data (rainfall, evaporation rates and temperature)
and lake water levels. All the climate data was collected at the Kariba Weather Station.
       The pelagic Kapenta fishery is license-controlled, highly mechanised and performed by
light attraction and lift nets from pontoon rigs. On the Zimbabwean side of the lake, each
company returns monthly statistics with landings and numbers of nights fished. The Kapenta
catch is expressed in mean tons per boat-night which we then transposed to months and years
in catches. Catch per unit effort (CPUE) in the experimental fishery is expressed as catch (kg
wet weight) per standard unit per setting of individual panels (mesh sizes). The standard unit is
a net panel of 45.7 m long. It was assumed that the landings declared by the Kapenta fishermen
were reflective of fish production in the lake; albeit evidence that some fishermen declare less
catches than caught as they often trade illegally; selling off part of the stock before landing
(Madamombe, 2002) and the presence of poachers in the lake (Tendaupenyu, pers. com).
Similarly, the weekly experimental gillnet data accumulated at Lake Kariba Fisheries
Research Institute (LKFRI) from the Lakeside station sampling programme, is the longest and
probably one of the most reliable data series from Lake Kariba. The routine is well incorporated
in the activities of LKFRI and the sampling methodology and design have remained constant.
Thus, it was assumed that this substantial database truly represents the relative changes in the
artisanal fish populations in the lake. The Kapenta and artisanal fish catches data collected is up
to the year 2002, as the records after 2002 were inconsistent or could not be retrieved from old
computers that broke down at LKFRI (Siziba, pers. com; Tendaupenyu, pers.com).
The daily climatic data and lake level recordings from the Zimbabwe Meteorological
Services and the Zambezi River Authority (ZRA) must be considered reliable. Water levels were
measured daily at the dam site by ZRA whilst daily readings of the evaporation rates,
temperature and rainfall were taken at the Kariba Weather Station. Nonetheless, quality control
of the data was performed by testing for normality under the Anderson-Darling test. The
secondary data collected is summarised in Table 1. Permission to use all data for this study was
duly sought and granted.
Table 1. Sources of secondary data
Data Source Years
Fish and Kapenta catches (daily and monthly) Lake Kariba Fisheries Research Station 1974- 2002
Climate (daily *evaporation rates, total rainfall; Zimbabwe Meteorological Services; 1964- 2007
maximum and minimum temperature) Kariba Weather Station
Lake water levels (daily and monthly) Zambezi River Authority (ZRA); 1959- 2008
Hydrology Unit
Analyses of secondary data
All data was tested for normality and tested positive using the Anderson-Darling test before
applying any statistical tests. Seasonal rainfall anomalies were used to characterise years into
wet and dry years. The anomalies were calculated as standardised (division by standarddeviation) differences between annual rainfall amounts and their long-term averages according
to Tumbo (2007). That is:
Where
Xan, i is rainfall anomaly in year i, and Xi is rainfall for year i,
and σX are the long-term mean annual (or seasonal) rainfall and standard deviation of the
annual (or seasonal) rainfall totals for a station.
In addition, the coefficient of variation (CV) was calculated as:
Where symbols are as defined above. The anomalies were used to classify years according to
rainfall abundance or deficit. Plots of series of rainfall anomalies were visually analysed to
provide limits that appropriately define different levels of wetness and dryness of the year that
reflect actual observations. The procedure established five classes (Table 2).
Table 2. Criteria for characterisation of hydrological years from the normalised anomalies (after
Tumbo, 2007)
Criteria Level
Extreme wet year Xan > 2.0
Wet year 2.0 ≥ Xan > 1.0
Normal 1.0 ≥ Xan ≥-1.0
Dry year -1.0 > Xan ≥-2.0
Extreme dry year Xan < -2.0
Droughts were classified using the Standardized Precipitation Index (SPI) data calculated from
the monthly rainfall totals for Kariba (McKee et al., 1993, 1995; Edwards and McKee, 1997).
The SPI is an index that is used to provide assessment of drought severity and is based on the
probability of the observed cumulative precipitation deviating from the climatological average for
any time scale (1 month, 3 months, 6 months, 12 months, etc). In this study the time scalechosen was 12 months. The 12-month time scale avoids intra-annual frequency variations and allows the identification of the main hydrological droughts. A time series analysis was employed to ascertain any trends in the climate, water levels and Kapenta catches. Regression analyses were performed to investigate the relationships among the environmental factors and the fish catches. A general linear model (GLM) was used to predict Kapenta production levels using the environmental data. Linear regression attempts to model the relationship between two variables by fitting a linear equation to the observed data; in this case the environmental variables were the exploratory variables whilst the fish catches were the dependent variables; assuming that the relationship is linear. Homoscedasticity as well as independence of all variables from each other was assumed. Cluster Analysis by Principal Component Analysis was conducted to investigate the associations and determinant parameters on a spatial and temporal scale. All statistical analyses were performed in S-Plus (Version 45, Microsoft Corp., Redmond, WA, USA). Results and Discussion Whole lake physical and chemical properties All measured physical and chemical water properties displayed significant (P ≤ 0.001) differences between the winter and summer months, with the exception of DO and DOC, significant differences (P ≤ 0.05) between lake basins, with the exception of PAR and total N and significant differences (P ≤ 0.05) with increasing water depth, with the exception of conductivity, DOC, Total N and PO4-P (Table 3). Higher water temperatures, conductivities total N and PO4-P concentrations but lower water transmission of PAR and pH were evident during summer than winter months with water temperature, pH and water transmission of PAR also declining with increasing water depth. The decline in PAR and to a lesser extent in DO, with increasing water depth was more prominent during summer than winter months, this apparent from the significant (P≤ 0.001) interaction between month and water depth observed for PAR and DO. Also, there were significant (P≤ 0.001) interactions between month and lake basin for all measured physical and chemical water properties, except for PAR and PO4-P, the gradients in water temperature, conductivity, pH, DO, DOC and total N from lake basins 1 to 5 more prominent during winter turnover than during summer stratification.
Phytoplankton biomass-whole lake measurements
There were significant differences (P ≤ 0.001) in the biomass (chlorophyll a) and the chlorophyll
a emanating from the three groups of algae as well as the primary production between the
seasons (Table 4). The biomass and primary production also varied significantly among the
basins (P ≤ 0.001) and though significant differences (P ≤ 0.001) in the primary production were
found among the depths, no significant differences (P ≥ 0.05) in biomass were exhibited among
the depths. Significant interactions (P ≤ 0.001) were found between season and basin in the
total biomass as well as the chlorophyll a emanating from all three algal groups and in the
primary production. No significant interactions (P ≥ 0.05) were found in the other interactions
with the exception of the significant interaction (P ≤ 0.001) between season and depth in the
primary production (Table 4).
Table 3. Wald χ² statistics derived from REML (repeated measures mixed model) which tested for the effects of month, basin, water
        depth and their interactions on various physical and chemical properties of Lake Kariba. Values presented in bold significant
        at *P
Table 4. Wald χ² statistics derived from REML (repeated measures mixed model) which tested for the effects of month, habitat, water depth and their interactions on phytoplankton biomass (chlorophyll a) and primary production of lake water in the Sanyati Basin of Lake Kariba. Values presented in bold significant at *P
Figure 3 Variation of rainfall around Lake Kariba from 1964-2007, Data was obtained from the
Department of Meteorological Services (Zimbabwe); used by permission

In comparison to model estimates of the southern African region by Arnell (1999) of a -10 to
20% decline in precipitation and a -10 to 40% decrease in run-off, the rainfall data was
compliant with the predicted range, as a decrease of 3.67% over the 43 years with no particular
trend but a cyclic drought occurrence with a greater prepondence to an increase in the
frequency of drought in time. A total of 14 out of the 43 years had less than 600mm rainfall
representing 32.56% of the entire period as drought occurrences with severe dry spells
occurring in the periods 1966-68; 1982-84 and 1990-1995. It is important to note that whilst low
rainfall years have always occurred in the region and in this instance on a 5-year cycle post the
1960s, the frequency of dry years increased to a 2-3 year cycle post-1980.

Evaporation rates
Evaporation rates were obtained for the period 1963 to 1999 and varied from 0 to 23.4 mm per
day. On a monthly average, the rates ranged from 4.86 to 8.72 mm per day in each year with an
overall mean of 6.86 mm per day for the entire period analysed; giving a total of 2 216 mm loss
of water per year. The annual water loss is slightly below the range of 2 500 to 3 600 mm
recorded by Coche (1974). However, a regression of the evaporation rates in time shows that
on average, the rate has been increasing steadily since the early 1960s (r2= 0.28, P
currently in the range of 8 mm and above. This is because a time series analysis showed a 2
year moving average of 0.25mm per day representing an added 1596.86mm loss of water from
the lake during the 35 years studied. If we extrapolate this trend from 1999 onwards to date; we
would expect the evaporation rates of Lake Kariba to have reached 9.15mm per day to date and
that it would continue to rise if all conditions remain the same.

Figure 4 Variation of evaporation rates from Lake Kariba: 1964-1999, Data was obtained from
the Department of Meteorological Services (Zimbabwe); used by permission

When the evaporation data is split into two phases; one with a range from 0 to 7.5 mm and the
other from 7.5mm and above; hot, dry spell years and phases (1983-84; 1987-88; 1990-1995)
fall into the second category. This is expected, as temperature is positively correlated to
evaporation but the relationship between rainfall and evaporation rates is rather complex
(Vörösmarty et al., 2000). The relationships between rainfall, evaporation rates, temperature
and fish catches are discussed in the preceding sections. The highest evaporation rates
occurred during the hot dry season (August to November) and particularly in the month of
October; whose majority levels (>80%) exceeded 10mm on each day of this month in each
year. This is consistent with expectations of high evaporation rates associated with high
temperatures. However, another factor which influences evaporation rates during the dry
season is strong wind patterns. The windiest period around Lake Kariba is from September to
October, which is characterised by warm, gusty and strong winds (Ward, 1979).
Temperature
Air temperatures were high, ranging between 8.4 and 38.1°C with an average minimum of
18.7°c and a maximum of 31.1°C. The highest temperatures were recorded in the hot, dry
season (Aug-Oct) whilst the minimum temperatures were recorded in the winter period (May to
July). The hottest year was 1995 (32.6°C), closely followed by 2005 (32.5°C), then 1987, 1992
and 1983 (32.4°C). These were all drought years. A time series analysis showed a continual,
linear rise in both the minimum (r2= 0.31; n= 44) and particularly the maximum (r2= 0.52; n= 44)
yearly average since the mid-1960s (Figure 5). The rise in temperature n time was also
reflected as an increase in the yearly average of the maximum temperature from less than
30.7°C from 1963 to 1981 (with the exception of 1973) to averages above 31.1°C from 1982
onwards with the exception of three years (1985, 1986 and 1989). The temperature data
suggests detectable warming at an average increase of 3.58°C for the maximum and 3.29°C for
the minimum temperatures over the four decades, reflecting an average increase of 3.43°C over
the entire period and 0.78°C per decade. This is compliant with Unganai (1996)’s analysis of
Zimbabwe’s 60-year temperature records (1933 to 1993) which suggested a warming of up to
0.8°C. However, the current’s study’s levels are higher by nearly a factor of 2 than the predicted
average regional rise of 1.6 to 2.5°C by 2050 for the semi-arid regions of Africa (Hulme et al.,
2001; IPCC, 2007) suggesting that warming around Lake Kariba is occurring at a faster rate
(50%) than is predicted. At this rate there will be an increase of 3.7° C by 2050 if all conditions
remain the same. This increase is more compliant with Unganai (1996)’s predictions over
Zimbabwe of a 1 to 4° C temperature rise by 2050.

Water levels
Lake water levels varied between 458 and 487m from 1959 to 2008. However, if the initial levels
(1959- 1964) are treated as outliers considering that the lake was filling up in this period, the
variance in water levels is minimised and shows that the lake has ebbed between 477.1 and
486.6m since 1965 with an average water level of 482m. However, the last five years in the
water levels data (2003 to 2007) witnessed an unprecedented decrease in the water levels
(Figure 6) that is comparable to the 1981-85 declines. Low water patches coincide with hot
spells and low rainfall years that have plagued the region more frequently in the past 20 years.
However, it is important to note that rainfall effects are reflected in the lake water levels a
season after the rainy period and with the onset of the flooding regime of the Zambezi River.
Figure 5 Average annual maximum (solid line) and minimum (dotted line) temperature levels for
Kariba from 1963 to 2007. Data was obtained from the Department of Meteorological Services
(Zimbabwe); used by permission

This was often reflected in the water levels as increased levels from April to August of each
year. There is a 23 m range in the water levels reflecting a high variability associated with the
different sources of water; that is the contribution from precipitation (10%) and river discharge
(90%) and the flooding regime of the Zambezi River.

Figure 6 Water levels in Lake Kariba over time. Data was provided by the Zambezi River
Authority (ZRA) and is used with permission
Low water levels were recorded from 1982 to 1997 when some of the severest droughts were
experienced as highlighted in preceding sections. This was also noted by Madamombe (2002)
who reported that the lowest levels recorded were in December 1992 and January 1997 at 476
m and these years still hold the record for the lowest water level in the lake in the present study
(Figure 6). Since 1997 the lake levels have rose rapidly and the sluice gates were opened
thereafter for the first time in 19 years in 2000 and seven years after in 2007.

Kapenta catches
Since their successful introduction in 1968 and first commercial catches of 1974, Kapenta
production in general increased from 1974 to 1990 but production started declining from 1990 to
2001 (Figures 7 and 8). The sardine’s production followed a natural logarithmic growth curve
with an initial lag phase (1974-1979), preceding growth (1980-1989); and a decline (1990-2002)
as the maximum growth is reached. It is possible that this trend could explain the fish’s
development in the lake as a growth curve that has now reached the declining phase as
particular conditions like climate, hydrology and possibly food resources become a limiting
factors to the growth of Kapenta. Over the entire period from 1974 to 2002, the production has
declined by 85% since the sardine’s introduction (r2=0.85 logarithmic, p
Figure 7 Kapenta catches versus precipitation; 1974 to 2002

Figure 8 Kapenta catches versus maximum temperature; 1974 to 2002

Comprehensive fishing records from the Lake Kariba Fisheries Research Station show that
there has been a decrease in the number of vessels and fishermen involved in Kapenta fishing
by a factor of 2 from 1974 to 2002. The decrease was exacerbated by the slump in the
Zimbabwean economy in the late 1990s. Kapenta fishing is capital intensive and requires a
huge investment as well as daily inputs such as fuel. However, even though the number of
Kapenta fishermen have decreased in time, it has been noted that the catch per unit effort
(CPUE) of the Kapenta sardines has increased (r2=0.75 linear, p
Mtada (1987) found a very high negative correlation (r2= 0.94, n= 32) between thermal
       stratification and the monthly yields of the sardines and that fish catch is not uniform throughout
       the year, being reduced during periods of strong thermal stratification and increased during
       circulation in Lake Kariba. This was demonstrated in our analysis as Kapenta catches peaked
       around September- October of each year during the period just after the turn-over when the lake
       is mixed and during the latter months of the rainy season when strong winds and
       thundershowers tend to mix the lake. The increase in nutrients during these two periods has
       been documented as phosphorous increases; following overturn in winter indicating the release
       of nutrients from the deeper waters and in the rainy season (Magadza, 2006).

       Regression analysis
       General Linear Models were superimposed on the climatic parameters and fish catch data.
       Strong, linear relationships (r2 >0.90) were found between rainfall and temperature (both
       maximum and minimum) and between the two temperature ranges and the water levels (Table
       5). The maximum temperature had the highest correlation coefficients; being significantly and
       positively related to all the parameters. Rainfall was also positively and significantly related to all
       the values but to a lesser extent than the maximum temperature. The minimum temperature
       exerted the least influence on the Kapenta production and among the environmental variables
       but this was expected as the trend in the rise of the minimum temperature is not as discernable
       as in the maximum temperature (r2 0.52 vs. 0.31).

       Table 5. Regression matrix of climatic factors and fish catch characteristics showing r2 values,
       significant values are highlighted in bold
                     Evaporation                 Maximum       Minimum       Fish     Water    Kapenta     Kapenta
Parameters           rates           Rainfall    temp          temp          Catch    levels   Catch       CPUE

Evaporation rates    1
Rainfall             0.14            1
Max temp             0.05            0.92        1
Min temp             0.02            0.92        0.99          1
Fish Catch                           0.65        0.74          0.16          1
Water levels         0.22            0.93        0.99          0.19          0.05     1
Kapenta Catch        0.33            0.54        0.72          0.12          0.13     0.19     1
Kapenta CPUE                         0.50        0.68          0.14          0.23     0.21     0.81        1
Principal Component analysis
A principal component analysis (PCA) was performed to investigate the interactions between
the Kapenta fish catches, hydrological factors and climatic conditions (Table 6). The PCA
showed that there was one major axis that influenced the data which accounted for more than
half of the variance (58 %) in the Kapenta data and two minor axis (15 and 11%). These three
axes cumulatively account for 84% of the total variation in the Kapenta fish catches.
Table 6 Summary of PCA analysis
Axes 1 2 3 4 5 6
Eigen value 0.577 0.154 0.11.3 0.075 0.043 0.018
% Cumulative variance 58 73.1 84.4 93.0 98.2 100
Variance 0.58 0.73 0.84 0.94 0.98 1
A biplot of the Kapenta catches and environmental variables was drawn (Figure 10) and
illustrates that the hydrological factors (rainfall and lake water levels) are clumped in one
direction and influence the variation in a negative manner. These two factors are also close in
the biplot reflecting high correlation between them. This is compliant with the regression
analysis and the relationship between the two environmental factors is expected as rainfall
determines the amount of water received in the lake and therefore the lake water levels. The
biplot also reflects that both the minimum and maximum temperatures’ influence is in the same
direction and the two variables are close indicating high correlation between them. This is also
consistent with the regression analysis. The plot shows that the shortest distance from the
Kapenta is time (years) indicating that the fish catches varied widely over time and this reflecting
the influence of seasons in time. The maximum temperature is the closest variable to the
Kapenta after years; followed by minimum temperature, then rainfall and lake water levels. With
the exception of the minimum temperatures, these results are consistent with the regression
analysis.Figure 10 PCA distance biplot of the Kapenta and environmental data
Conclusion
The climate around Lake Kariba is changing; the temperatures are rising and this warming has
resulted in higher evaporation rates and an erratic rainfall regime with an overall declining trend
in precipitation. Climatic and lake hydrological factors correspondence closely with Kapenta fish
catches with the water levels influencing the sardine catches the most followed by maximum
temperature. However, temperature is the main driver of the climate around and water levels in
Lake Kariba and therefore the established rise in temperature could likely be the major cause of
the Kapenta fish declines in Lake Kariba. Concerning is the fact that continual warming around
the lake may continue to further the cumulative and adverse effects of the climate changes on
the Kapenta production.
Consequently, the limnology of Lake Kariba is being shaped by climatic factors and
particularly warmer temperatures, reduced rainfall levels and higher evaporation rates. These
factors have resulted in the greater stability of the stratification of the lake as well as a reduced
thermocline level. Such impacts, in turn have resulted in several effects in the lake which
include reduced nutrient levels, particularly nitrogen in the epilimnion and higher conductivityand dissolved concentrations. The phytoplankton biomass of Lake Kariba has remained fairly
low but the primary production has risen substantially.
The assemblage of the phytoplankton in Lake Kariba suggests a progression of a
community that is being altered by temperature and nutrients particularly nitrogen. These
recordings are consistent with the limnological data observed in the present study which show
that there is an upward shift of the thermocline and greater stability in the stratification of the
lake therefore, reducing the habitat and the nutrients available to the phytoplankton.
However, there remains a need to consistently monitor these levels in the lake in order
to understand the evolution as well as understand the patterns in the phytoplankton biomass
and primary production in order to circumvent the effects on the fish production in the lake and
mitigate against the climate changes if adequate mechanisms and remedial measures are to be
effectively implemented in the lake’s management.
Future directions
The way forward involves firstly, the completion of the PhD studies by the handing in of the PhD
thesis/dissertation to the University of the Western Cape. To this end, I have begun writing up,
re-analysing data, working with my supervisors and polishing up the thesis draft. We have
already managed to publish one journal article from the thesis which forms part of the
introduction and literature review. Three of the thesis chapters have been submitted to journals
for consideration and publication. After handing in the thesis, I intend to publish it as a
monogram and I have already established contacts with a prospective Publisher. This work will
be possible in 2011 and probably under a Post-Doctorate program as I am concentrating on
completing and handing in the PhD thesis in November of this year (2010).
Secondly, I need to consolidate and package my findings into a form that can be used
effectively for policy making, training, raising awareness and formulating management
strategies in and around Lake Kariba. To this end, I intend to summarize my thesis into a policy
brief/paper(s) which can be used to help implement policy. The first point of contact in
formulating the policy brief and presenting it to the appropriate organisations is to contact Prof.
Sarah Feresu, a board member of the Scientific Committee that reports and presents briefs to
the Ministry of Science and Technology in Zimbabwe. I shall initiate this contact as soon as
possible after I return back home.
Thirdly, I intend to continue working in climate change research in and around the
southern African region. I intend to expand the research that I started to the Zambian side of the
lake. Also, I intend to work with University students at Undergraduate and Masters level who willinvestigate various components; I will facilitate this work and act in a supervisory role if there is
a need. To this end, I have discussed these plans with the Director of the University Lake Kariba
Research Station (ULKRS) who has agreed to assist these students by providing the laboratory
space and equipment such as boats and sampling gear for the students’ disposal. In addition,
together with ULKRS, we are organizing an annual workshop in which the Research Station
invites various stakeholders such as the fishing community, school children, organisations
working in and around the lake, academics and researchers to debate, discuss and deliberate
environmental issues around the lake. In this forum, adaptation measures and strategies are
suggested from all stakeholders and we learn from each other. The next workshop is scheduled
for January 2011.
In addition, I intend to expand my knowledge and channel my research findings towards
adaptation within climate science. To this end I have enrolled into the short course ‘Adaptation
Academy Foundation Course’ being offered by The Climate Systems Analysis Group, at the
University of Cape Town, the Oxford office of the Stockholm Environment Institute, and the
Global Climate Adaptation Partnership the Stockholm Environment Institute, and the Global
Climate Adaptation Partnership this July (2010) in Cape Town, South Africa. The course will
enhance my knowledge in Adaptation discourse which is a missing component in my studies.
The course will assist me to think and structure adaptation measures for the Kariba community
in the wake of environmental changes.
References
Ahlgren J., Tranvik L., Gogoll A.M., Waldeba¨ CK, Markides K. and Rydin E. (2005). Depth
attenuation of biogenic phosphorus compounds in lake sediment measured by 31P
NMR. Environment, Science and Technology 39, 867-872.
Alheit J, Niquen M (2004) Regime shifts in the Humboldt Current ecosystem. Progress in
Oceanography, 60, 201-222.
Arnell NW (1999) Climate change and water resources. Global Environmental Change, 9, 31-
49.
Atkinson A, Siegel V, Pakhomov E, Rothery P (2004) Long-term decline in krill stock and
increase in salps within the Southern Ocean. Nature, 432, 100-103.
Awange JL, Sharifi MA., Ogonda G, Wickert J, Grafarend EW, Omulo MA (2008) The falling
Lake Victoria water level, GRACE, TRIMM and CHAMP Satellite Analysis of the Lake
Basin. Water Research Management, 22, 775-796.Balon E.K. and Coche A.G. (1974). Lake Kariba: A man-made tropical ecosystem in Central
Africa. Dr. W. Junk Publishers, The Hague.
Barnard R, Batten SD, Beaugrand G et al. (2004) Continuous plankton records, plankton atlas
of the North Atlantic Ocean (1958–1999). II. Biogeographical charts. Marine Ecological
Progress Series (Suppl.), 11-75.
Beardell J, Raven JA (2004) The potential effects of global climate change on microalgal
photosynthesis, growth and ecology. Phycologia, 43 (1), 26-40.
Begg G.W. (1976). The relationship between the diurnal movements of some of the
Zooplankton and the sardine Limnothrissa miodon in Lake Kariba. Limnology and
Oceanography 21 (4), 529-539.
Bell-Cross G. and Bell-Cross B. (1971). Introduction of Limnothrissa miodon and Limnocaridina
tanganyicae from Lake Tanganyika into Lake Kariba. Fish. Res. Bull. Zambia 5, 207-
214.
Bergamino N, Loiselle S. A, Cozarc A, Dattiloa AM, Bracchinia L, Rossia C (2007) Examining
the dynamics of phytoplankton biomass in Lake Tanganyika using Empirical Orthogonal
Functions. Ecological Modeling, 204, 156-162.
Brett M.T. and Müller-Navarra D.C. (1997). The role of highly unsaturated fatty acids in aquatic
foodweb processes. Freshwater Biology 38, 483-499.
Cambula P. (1991). Impacts of Climate change on water resources of Mozambique.
Unpublished Report of the Republic of Mozambique/U.S. Country Study Program Project
on assessment of the vulnerability of the economy of Mozambique to projected climate
change, Maputo, Mozambique.
Chifamba P.C. (2000). The relationship of temperature and hydrological factors to catch per unit
effort, condition and size of the freshwater sardine, Limnothrissa miodon, (Boulenger), in
Lake Kariba. Fisheries Research, 45, 271- 281.
Coche A.G. (1974). Limnological study of a tropical reservoir. In Lake Kariba, a man-made
tropical ecosystem in Central Africa. Biological Monographs 24, 1-247.
Cochrane K.L. (1978). Seasonal fluctuations in catches of L. miodon Boulenger in Lake Kariba.
Unpublished DPhil. Thesis. University of Rhodesia, Salisbury, Rhodesia.
Cochrane K.L. (1984). The influence of food availability, breeding seasons and growth rate on
commercial catches of Limnothrissa miodon (Boulenger) in Lake Kariba. Journal of Fish
Biology 24, 623-635.
Cronberg G. (1997). Phytoplankton in Lake Kariba. In, Moreau J. (ed). Advances in the ecology
of Lake Kariba, pp 66- 101, University of Zimbabwe Publications, Harare, Zimbabwe.You can also read


