BUILDING ON STRENGTH CLIMATE REPORT - 2019 CLIMATE REPORT | 1 - FREEPORT-MCMORAN
←
→
Page content transcription
If your browser does not render page correctly, please read the page content below
B UIL DING
        ON
STRENGTH
   Climate Report

      2019 Climate Report | 1
About Freeport-McMoRan
Freeport-McMoRan Inc. (together with its operating subsidiaries, Freeport-McMoRan,
FCX or the company) is a leading international mining company with headquarters in
Phoenix, Arizona. The company operates large, long-lived, geographically diverse
assets with significant proven and probable reserves of copper, gold and
molybdenum. Freeport-McMoRan’s portfolio of assets includes the Grasberg minerals
district in Indonesia, one of the world’s largest copper and gold deposits; and
significant mining operations in North America and South America, including the
large-scale Morenci minerals district in Arizona and the Cerro Verde operation in Peru.
Freeport-McMoRan is one of the world’s largest publicly traded copper producers. For
purposes of this report only, references to (1) Freeport-McMoRan Minerals
Corporation (FMC Mining) includes all mining operations in North and South America
(the Americas), (2) Freeport-McMoRan Corporation Downstream Processing (FMC
Downstream Processing) includes all operations downstream of mining in the
Americas and Europe and (3) PT Freeport Indonesia (PT-FI) includes our operations in
Papua, Indonesia.

                                                                                                                        Table of
Did You Know?                                                                                                           Contents
Copper is critical to achieving several of the United Nations Sustainable
Development Goals and enabling the global energy transition. It takes an average of                                     OUR APPROACH            4
4.1 metric tons of greenhouse gas (GHG) emissions to produce 1 metric ton of copper
cathode from cradle to gate.1 However, because of its effectiveness in electrical
applications, copper's GHG emissions can be mitigated by a factor of up to 1,500 to 1.
In fact, the International Copper Association2 estimates that by 2030, copper could                                     REDUCTION               6
help reduce global emissions by 16%. Furthermore, an investment in copper is a
good one as over two-thirds of copper produced since the 1900s is still in use today.3

                                                                                                                        RESILIENCE             14

Copper & Public Health
                                                                                                                        CONTRIBUTION           18
The COVID-19 global health pandemic has spotlighted the antimicrobial properties of
copper. The same properties that make copper a good conductor of electricity also
enable it to kill microbes. In fact, when copper comes into contact with microbes on a
surface, it destroys the whole cell – including its DNA – so it cannot mutate. These                                    WHAT'S NEXT            20
properties enable copper to reduce, and in certain cases significantly diminish, the
transmission of bacteria, viruses and other pathogens in health-care or general public
settings. In a hospital, this can be the difference between a patient leaving healthy or
acquiring an additional illness while admitted. The World Health Organization                                           TCFD REFERENCE TABLE   23
estimates that globally over $80 billion is spent on hospital acquired infections every
year. Copper can play an important role in reducing these infections and helping
improve the health and well-being of the global population, an important contribution
to sustainability. Learn more at www.copper.org                                                                         VERIFICATION STATEMENT 24

1 https://copperalliance.org/wp-content/uploads/2018/02/ICA-EnvironmentalProfileHESD-201803-FINAL-
  LOWRES-1.pdf
2 https://copperalliance.org/wp-content/uploads/2017/03/Copper_Circular-economy_20aug16.pdf,
  https://sustainablecopper.org/sustainable-development-goals/
3 Glöser, Simon; Soulier, Marcel; Tercero Espinoza, Luis A.(2013): Dynamic analysis of global copper lows. Global
  stocks, postconsumer material lows, recycling indicators & uncertainty evaluation. Environ. Sci. Technol., 2013, 47
  (12), pp 6564–6572 DOI: 10.1021/es400069b.
June 3, 2020

                                      Letter To Stakeholders
                                      Dear Stakeholders,

                                      Freeport-McMoRan’s dedication to responsible copper          In 2019, our management team undertook an extensive
                                      production is visible in everything we do, including our     analysis of our historical climate performance with the
                                      approach to climate change. We supply the world with         goal of establishing a climate strategy to address climate
       Richard Adkerson               responsibly produced copper, which includes operating        risks and opportunities. We are pleased to formalize our
      Vice Chairman of the Board,     in a way that manages and mitigates our greenhouse gas       climate change strategy, which is founded on three
President & Chief Executive Officer
                                      (GHG) emissions and other climate-related risks.             pillars:

                                      We recognize that climate change poses considerable          1. Reduction: We strive to reduce our GHG emissions by
                                      near and long-term challenges for society and to our own     15% per ton of copper cathode in the Americas by 2030
                                      operational and financial performance. Mining is             from our 2018 baseline.
                                      energy-intensive and generates significant GHG
                                                                                                   2. Resilience: We strive to enhance our resilience to the
                                      emissions that contribute to climate change.
                                                                                                   risks of climate change for our operations, our host
                                      However, copper plays an essential role in the               communities and local stakeholders by working
                                      technologies needed to develop and enable the energy         preventatively to analyze and prepare for extreme
                                      transition. As one of the world’s largest copper             weather events, water stress and other climate change
                                      producers, Freeport-McMoRan is uniquely positioned to        impacts.
                                      meet stakeholder expectations for both our contribution
                                                                                                   3. Contribution: We strive to be a positive contributor
                                      to, and our own alignment with, a 2-degree Celsius
                                                                                                   beyond our operational boundaries by responsibly
                                      climate scenario. This is because emissions related to
                                                                                                   producing copper and molybdenum for the energy
                                      converting copper cathode that we produce into usable
                                                                                                   transition and collaborating with partners in our value
                                      products like wire are minimal, and copper plays a
                                                                                                   chain.
                                      significant role in electrification, renewables and energy
                                      efficient technologies.                                      As a founding member of the International Council on
                                                                                                   Mining & Metals (ICMM), we are committed to
                                      Reducing our emissions and improving operational energy
                                                                                                   implementing the ICMM Climate Change Position
                                      efficiency provides us with cost savings and environmental
                                                                                                   Statement requirements as well as the Performance
                                      benefits within and beyond our operating boundaries. Over
                                                                                                   Expectations across the business. We also are
                                      the last five years, we have reduced our absolute GHG
                                                                                                   committed to aligning our climate strategy and related
                                      emissions by 17%. Of our total global GHG emissions, the
                                                                                                   disclosures with the recommendations of the Task Force
                                      Americas and Europe represent approximately 70% (62%
                                                                                                   on Climate-related Financial Disclosures (TCFD) in the
                                      from mining and 8% from processing) and Indonesia
                                                                                                   coming years.
                                      represents approximately 30%.
                                                                                                   As I write this letter, the world is continuing to deal with
                                      In the Americas, we have spent the last three decades
                                                                                                   major challenges associated with the COVID-19
                                      focused on developing and implementing mining and
                                                                                                   pandemic, which has impacted our own workforce and
                                      process innovations and grid decarbonization, which has
                                                                                                   host communities. The company is principally focused on
                                      resulted in lower costs and improved efficiency. We are
                                                                                                   maintaining safe and financially viable operations and
                                      pleased to report that our 2019 GHG emissions per ton of
                                                                                                   supporting the economic recovery of the communities
                                      copper cathode are 30% lower than projected.
                                                                                                   where we operate. As business conditions allow, we will
                                      At our PT-FI operations, we are focused on mining and        look for opportunities to invest in innovative mining and
                                      process innovation to decrease costs, increase               processing technologies to support our 2030 emissions
                                      efficiency and address climate-related risks. Given the      reduction goal. Over the long term, we are committed to
                                      remote nature of the mine and current limitation on          contributing positively to global climate change
                                      alternative energy sources, it is difficult and cost-        mitigation by supplying the world with responsibly
                                      prohibitive to shift away from the reliance on coal for      produced copper.
                                      electricity production in the short-to-medium term. We
                                                                                                   Freeport: Foremost in Copper.
                                      will continue to pursue opportunities to reduce emissions
                                      and improve energy efficiencies.
OUR APPROACH
                                         Freeport-McMoRan is committed to being a leader in the responsible production of the
                                         minerals and metals we produce. To be a responsible producer, we know it is imperative
                                         that we understand the risks and opportunities climate change poses to our operational
                                         and financial performance. We aim to manage and mitigate, to the extent possible, the
                                         climate-related risks we identify, and to be a positive contributor to climate change
                                         solutions through the production of responsible copper.

                                         As shown below, our 2019 absolute GHG emissions were 8,012,451 metric tons, which is
                                         21% lower than 2015. This 21% is comprised of two parts: (1) a 17% reduction in our
                                         emissions and (2) a 4% decrease due to improvements in how we calculate our emissions
                                         factors. Approximately 70% of our total emissions are generated by our Americas
                                         operations and 30% from our PT-FI operations on the Indonesian island of Papua. Our
                                         current estimates of Scope 3 emissions are relatively small as the majority of emissions in
                                         the copper life-cycle are generated upstream. A third-party GHG verification statement
                                         can be found at the end of this report.

                                         FCX GLOBAL (CO2E METRIC TONS)
                           REDUCTION
                                                           2015            2016          2017           2018           2019
                                          Scope 1       5,699,671        5,095,135    4,530,897      5,240,161      4,969,382

                                          Scope 2       4,436,423        4,201,061     3,691,117     3,164,821      3,043,069

                                          Total        10,136,094        9,296,196    8,222,014      8,404,983      8,012,451

                                          Scope 3        561,821         618,189       706,214        750,332        692,336

                           RESILIENCE
                                         Strategy
                                         Our work to identify and address climate-related risks and opportunities across our
                                         business has been underway for many years through our innovations in mining and
                                         processes, Sustainable Development Risk Register (Risk Register) process, governance
                                         framework, and annual GHG emissions disclosures. In 2019, our management team
                                         undertook an extensive analysis of our climate performance, establishing the following
                                         strategy, based on three pillars:
                                         1. Reduction: We strive to reduce our GHG emissions by 15% per ton of copper cathode in
                                         the Americas by 2030.

                                         2. Resilience: We strive to enhance our resilience to the risks associated with climate
                          CONTRIBUTION   change for our operations, our communities and our stakeholders.

                                         3. Contribution: We strive to contribute positively beyond our operational boundaries by
                                         responsibly producing copper and molybdenum for the energy transition and
                                         collaborating with partners in our value chain.
4 | 2019 Climate Report
Governance
The Freeport-McMoRan Board of Directors (Board) has four committees, each
                                                                                                      BOARD OF DIrectors
comprised of entirely independent directors who are responsible for providing
oversight to the company’s management team on specific matters. The Corporate                 Corporate Responsibility Committee
Responsibility Committee, on behalf of the Board, is responsible for providing
                                                                                         Nominating & Corporate Governance Committee
oversight on social and environmental matters, including climate-related risks and
opportunities across our business.                                                       Audit Committee      Compensation Committee

Our Chief Executive Officer (CEO) has ultimate responsibility for the company’s
sustainability performance. The company’s Sustainability Development Leadership
Team (SDLT) includes members of the management team tasked with defining the
                                                                                                Executive Leadership (Ceo/cfo)
sustainability strategy broadly – including climate risk – and implementing our
policies, systems and programs across the business. The SDLT regularly reports to
executive leadership, including our CEO and Chief Financial Officer, and members of
the SDLT report to the CRC on key ESG matters throughout the year.                         Sustainable development leadersHip team
The SDLT is sponsored by our Senior Vice President and Chief Administrative Officer         Business Unit        Corporate Administrative
and is led by our Vice President of Environmental Services and Sustainable                   Presidents                Group VPs
Development. Other members of the SDLT include our Chief Operating Officer,
business unit Presidents, and Vice Presidents or senior representatives from groups                  Subject matter experts
including safety, security, supply chain, human resources, sales, legal, compliance,
sustainability and finance functions. The SDLT regularly reviews, discusses and                     Site general managers
addresses climate-related and purchased-power matters in its scheduled meetings.

Through our Risk Register process, the business identifies and prioritizes the most
salient climate-related risks and opportunities on both a corporate - and site-level      Site-level sustainable development leaders
basis in order to manage and take appropriate actions. This iterative process includes
third-party validation of the ICMM Mining with Principles framework for our operations
and corporate functions, which includes both the ICMM Performance Expectations
and Position Statements and Copper Mark obligations at sites on a prioritized
schedule. ICMM obligations include implementing governance, engagement and
disclosure processes, advancing site-level adaptation and mitigation solutions,
engaging with host communities as well as others in our value chain, monitoring and
disclosing our Scope 1 and 2 GHG emissions, and working towards more aligned
reporting of Scope 3 GHG emissions.

                                                                                             For more information on the
                                                                                             company’s sustainability approach,
                                                                                             governance and Risk Register
                                                                                             process, please refer to our 2019
                                                                                             Annual Report on Sustainability,
                                                                                             which is available on our website.

                                                                                                                                            5
REDUCTION
                                         The cost of energy is material to our business. In 2019, energy represented
                                         approximately 20% of our copper mine site operating costs. We have spent the last
                                         three decades relentlessly investing in mining equipment and metals processing
                                         technologies that provide innovative, lower cost ways of producing copper. This
                                         focus on improving our processes has led to significant improvements in the energy
                                         efficiency and intensity of our technologies, while we continue to operate and grow
                                         our business in a disciplined and responsible manner.

                                         Mining Innovation
                                         Declining ore grades in long-lived, aging mines often leads to longer and steeper haul
                                         routes and moving more material per ton of copper produced, which increases GHG

          Over the last                  emissions. This is a common industry-wide challenge, and we have developed
                                         innovative approaches to managing this challenge. In the last decade, we have
                                         become leaders in asset optimization – maximizing the lives of our haul trucks and
          10 years...                    enabling each truck to operate beyond industry standards.

                                         Our haul trucks run an average of 100,000 hours before being rebuilt, which is
                                         significantly above the typical industry performance of 65,000 to 80,000 hours. Most

          70%              465           recent studies indicate that we can increase this time period by another 7%. By
                                         lengthening the life of these critical pieces of equipment, we estimate we avoided the
          reused           rebuilt       purchase of 12 new haul trucks that would have cost $60 million in 2019. Since 2008,
          components       haul trucks   we have rebuilt 465 haul trucks, 120 of which were used and/or retired trucks
                                         purchased from other companies. We rebuild engines, frames and truck beds,
                                         resulting in the reuse of approximately 70% of a typical haul truck. The net result is
                                         over $1 billion in capital avoidance and an estimated carbon emissions avoidance of
                                         325 metric tons of CO2 equivalent per truck rebuilt, reflecting more than 150,000
                                         metric tons of avoided emissions in the last decade.

                                         We also maintain an industry leading program on asset efficiency, with the goal of
                                         utilizing equipment as productively as possible. The program uses the Internet of
          150,000 & $1 Billion           Things to provide supervisors in remote control rooms with real-time insights to truck
                                         and driver performance as well as environmental conditions. This allows supervisors
          metric tons     new capital
                                         to intervene preventively, resulting in fewer failures and enabling us to operate our
          GHGs avoided    avoided        trucks 15% more hours each day than the industry standard, according to data from
                                         MineLens by McKinsey. This program has helped us avoid an additional 50 haul trucks
                                         in our fleet, by enabling a smaller fleet to do the same amount of work. Finally, we are
                                         constantly looking for ways to improve blasting efficiency because this has a direct
                                         correlation to our ability to deliver on mine plans and can impact processing.

6 | 2019 Climate Report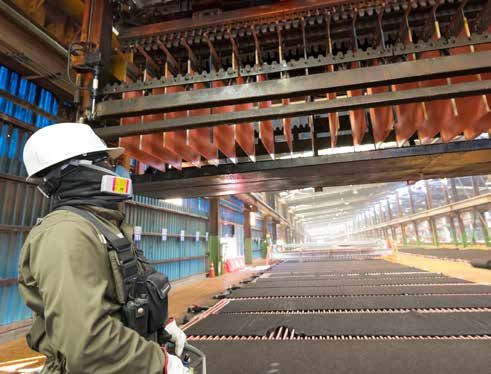
Processing Innovation
Our earliest successes in processing innovation were in the development of large-scale copper leaching and recovery through
solvent extraction/electrowinning (SX/EW) in the 1980s. SX/EW produces copper cathode without milling or smelting of
concentrates, saving 30% in energy consumption per ton of copper produced, with a similar reduction in GHG emissions. This
innovative process has revolutionized copper mining, enabling mines that would have been deemed uneconomic to extend their
lives. In 2019, 45% of our copper cathode production in the Americas was produced through the SX/EW process, bringing
significant benefits to our stakeholders and lower embedded carbon footprints to the products we put on the market.

Over the past decade, we have invested in new grinding technologies to enable our mill expansion projects to deliver significant
energy efficiency gains where SX/EW is not an option. These technologies use high-pressure rollers to reduce ore rock size
instead of traditional mills, which use steel balls to break down rock size. Essentially, these newer mills force the rocks against
each other at high pressure, breaking them into smaller and smaller rocks. The use of these high-pressure grinding mills, now in
place at Cerro Verde (2015) and Morenci (2014), is 20% more energy efficient than traditional grinding circuits, leading to
commensurate GHG emission reductions per ton of copper produced. In total, 60% of our annual copper milling in our Americas
operations is done through high-pressure grinding mills. Because of these investments, we will realize energy and carbon-saving
benefits for years to come.

In 2019, the El Abra Process
Automation team developed a
new approach to optimize
resources using automation
technology, resulting in higher
quality cathodes and a

20% reduction
in energy consumption for
electrowinning

                                                                                                                                      7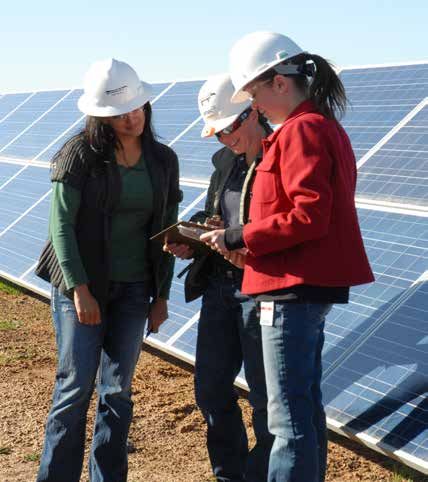
REDUCTIONS

          Similarly, over the past decade, we have invested in developing    More recently, in 2018, we embarked on our Americas’
          and demonstrating a new approach, utlizing electrowinning for      Concentrator program to combine Artificial Intelligence (AI)
          our sulfide concentrates instead instead of traditional smelting   machine learning with non-traditional team structures to
          and refining. This concentrate leach process not only              create opportunities to identify production bottlenecks and
          eliminates the need for smelting and refining of copper            propose and evaluate potential solutions in a rapid manner.
          concentrates but also can be used to process molybdenum            Our initial successes with this effort at our Bagdad operation in
          concentrates into an intermediate molybdenum product –             Arizona in 2018 indicated we could increase our copper
          molybdenum oxide – as opposed to shipping molybdenum               production in a material manner without increased capital
          sulfide concentrate to our roasting operations for conversion.     expenditures. Additional benefits included a 60% decrease in
          In addition to the avoided energy consumption and carbon           energy intensity of the added production, improved workforce
          emissions from the smelting process, this technology enables       culture and improved safety performance. There also are
          us to produce a more highly refined product directly from the      significant benefits from being able to extend the capacity of
          mine as opposed to shipping it to smelters, which are often        an existing operation rather than establishing a new greenfield
          overseas. It also provides an on-site source of sulphuric acid     project, resulting in significantly lower GHG emissions involved
          for our oxide leaching operations, which reduces shipping          in construction and operating activities.
          costs and related emissions. We are one of only a few copper
          mining companies in the world using this technology, and we
          own the intellectual property for processing molybdenum and
          copper in this way.

                                                                                                  At Cerro Verde in Peru,
                                                                                                  we operate the largest
                                                                                                  copper concentrating
                                                                                                  facility in the world,
                                                                                                  utilizing high-pressure
                                                                                                  grinding mills which
                                                                                                  significantly reduce our
                                                                                                  energy and greenhouse
                                                                                                  gas emissions intensity

8 | 2019 Climate
         ClimateReport
                 Report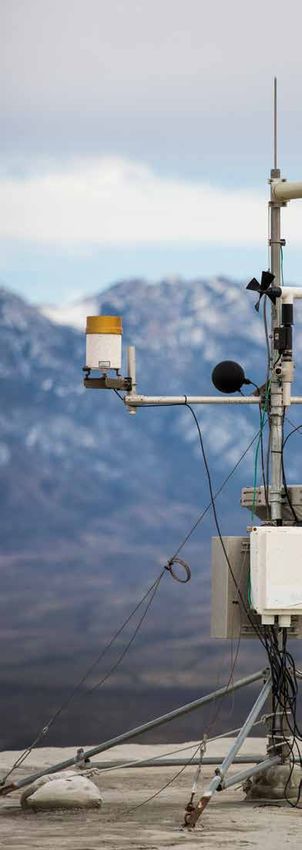
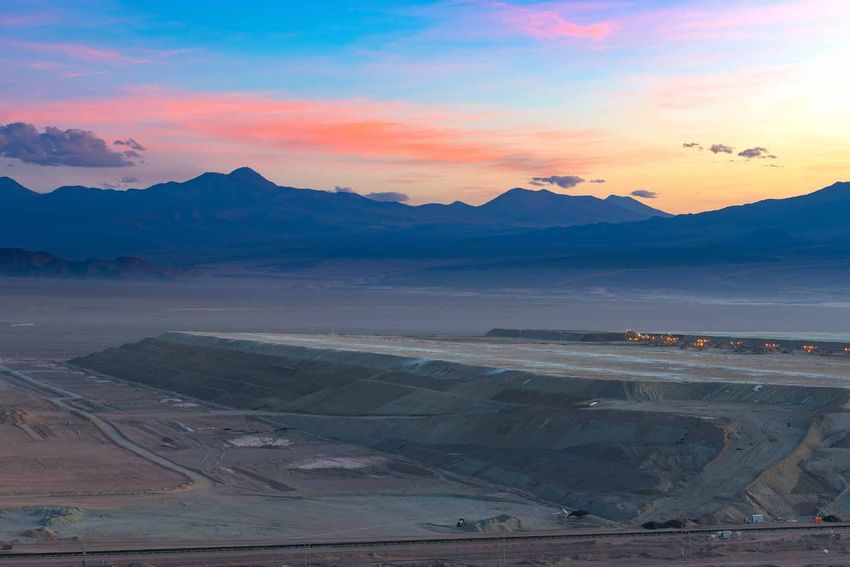
Our Energy Transition
While we are a major retail customer of several utilities in the    Electricity for our remote PT-FI operations in the eastern
southwestern United States, we are responsible for directly         Indonesian province of Papua remains reliant on coal-fired
delivering more than 80% of our electrical energy needs             power for electricity and alternative sources of energy are not
globally. Over the past two decades we have spent significant       currently reasonably available. PT-FI invests in projects to
resources to both execute agreements specifying renewable           improve energy efficiency and engages on an ongoing basis to
energy resources in various locations and to develop and            identify alternative sources of energy but the physical and
report on the carbon profile of our electricity sources using       economic challenges are significant. The Paniai Regency of
more detailed market-based and contract-specific                    Papua, which borders the Mimika Regency where PT-FI is
information.                                                        located, holds the potential for large-scale hydropower
                                                                    projects and a significant natural gas resource is located in
In late 2004, our Cerro Verde operation near Arequipa, Peru,
                                                                    West Papua. Access to these resources or the development of
entered into a public-private partnership with Electric
                                                                    renewable energy sources would enable PT-FI to shift to lower
Generation Company of Arequipa S.A. (EGASA) to raise the
                                                                    carbon electricity over the longer term.
Bamputañe and Pillones Dams. The agreement included
increasing the water storage capacity of Bamputañe Dam by           In recent years, we have evaluated our historical efforts to use
40 million cubic meters and Pillones Dam by 80 million cubic        lower carbon sources such as renewables in our portfolio. This
meters, with the work completed in 2010. This significantly         has included understanding emerging commercial structures
increased the hydroelectric energy production of EGASA’s            of these projects and studying opportunities for the
electricity generation assets, operating downstream of the          integration of renewable energy resources into our mining
dams, by a total of 267 gigawatt hours annually.                    operations, energy procurement and environmental strategies.
                                                                    In 2018, we retained Rocky Mountain Institute to assist us in
In 2009, we set a target to establish two renewable energy
                                                                    identifying a pipeline of conceptual projects, ranging from
facilities on mining-related property by 2014, which we
                                                                    hosting renewable projects on our land to driving the
achieved in 2011. These facilities include a 15 megawatt (MW)
                                                                    development of these projects for our own energy needs. As
solar facility at our Bagdad, Arizona, mine site and a 4MW
                                                                    we move forward, we will evaluate these opportunities in line
facility constructed at our discontinued operation in Ajo,
                                                                    with our operational needs for the coming decade.
Arizona. Subsequently, we have signed an agreement to
purchase up to 14MW of wind energy from a facility in
Wyoming for use at our Morenci mine in Arizona. We also have
an agreement to partner with our utility provider on a solar
facility that will provide approximately 5% of the annual
electrical requirements of our Miami smelter in Arizona,
beginning in 2021.

Like many companies, we have historically relied on EPA
United States Environmental Protection Agency (EPA) eGRID
published data for emission factors when calculating Scope 2
emissions for purchased electricity. In 2018, we began to
transition to market-based factors specific to our contracted
resources – the resource make-up of our suppliers with whom
we have long-term purchase power agreements – and our
retail utilities providers. This approach has led to emission
factors that better reflect our actual electrical GHG emission
intensity and enables us to demonstrate the choices we have
made more accurately. In 2018, this led to reporting our
absolute emissions 4% lower than if we had continued using
traditional grid-based factors for the year. In addition, as part
of our 2019 reporting efforts we aligned historical location-
based Scope 2 emissions factors with updated US EPA eGrid
factors. This true-up was verified by our auditors and is
included with our verification statement at the end of the
report.

                                                                       A 15MW solar facility located at our Badgad operations
                                                                                                                                       9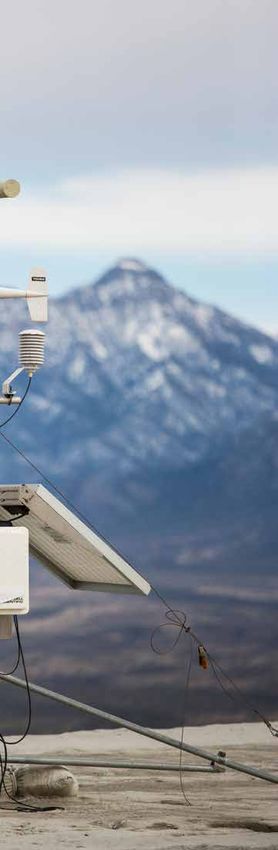
REDUCTIONS

              Performance
              Our five-year trend for absolute GHG emissions is detailed in the global data table below. In 2019, our GHG emissions were
              8,012,451 metric tons, which is 21% lower than 2015. This 21% is comprised of two parts: (1) a 17% reduction in our emissions
              and (2) a net 4% decrease due to improvements in how we calculate our emissions factors. Approximately 70% of our total
              emissions are generated by our FMC operations (including FMC Mining and FMC Downstream Processing) and 30% from PT-FI.
              Purchased power by source for our FMC Mining operations have achieved a significant decrease in coal and other fossil fuels
              since 2015. Our FMC Downstream Processing operations purchased-power sources have remained relatively unchanged since
              2015 with the exception of a 2% increase in renewables.

                                               GLOBAL GHG REDUCTION BY FIVE-YEAR TREND
                                               12000
          TOTAL METRIC TONS CO2E (THOUSANDS)

                                               10000

                                                8000
                                                                                                                          2019
                                                                                                                      EMISSIONS (%)
                                                6000

                                                4000

                                                                                                                  FMC Mining           62%
                                                2000
                                                                                                                  PT-FI                31%
                                                                                                                  FMC Processing       7%
                                                   0
                                                          2015         2016     2017        2018      2019
                                                       FMC Mining Scope 1                FMC Mining Scope 2
                                                       FMC Processing Scope 1            FMC Processing Scope 2
                                                       PT-FI Scope 1

                                                                                                                          2019
                                                           Our global GHG emissions have                            PURCHASED POWER
                                                                                                                       BY SOURCE

                                                           reduced by more
                                                           than 17%                                               Natural Gas          35%
                                                           over the last five years                               Hydro                32%
                                                                                                                  Coal, Other Fossil   18%
                                                                                                                  Nuclear              9%
                                                                                                                  Solar, Wind,
                                                                                                                  Geothermal           5%

10 | 2019 Climate Report
                                                                                                                  Other                1%
ANNUAL GHG EMISSIONS (METRIC TONS)
2015 2016 2017 2018 2019
FMC MINING1
Scope 1 2,040,012 1,772,308 1,763,407 2,049,720 2,241,039
Scope 2 2 4,007,548 3,834,801 3,349,819 2,774,994 2,705,132
PURCHASED POWER BY SOURCE
Natural Gas 37% 36% 36% 39% 36%
Hydro 14% 20% 21% 33% 35%
Coal, Other Fossil 25% 25% 25% 18% 17%
Nuclear 16% 14% 13% 7% 7%
Solar, Wind, Geothermal 7% 4% 5% 3% 4%
Other 1% 2% – – –
FMC DOWNSTREAM PROCESSING 3
Scope 1 275,451 240,647 239,102 254,961 264,083
Scope 2 2 428,875 366,260 341,298 389,827 337,937
PURCHASED POWER BY SOURCE
Natural Gas 29% 27% 27% 31% 28%
Hydro 8% 8% 8% 14% 9%
Coal, Other Fossil 25% 27% 27% 23% 24%
Nuclear 20% 22% 22% 17% 23%
Solar, Wind, Geothermal 13% 12% 12% 10% 15%
Other 4% 4% 4% 6% 2%
PT-FI
Scope 1 3,384,208 3,082,180 2,528,388 2,935,480 2,464,261
Scope 2 – – – – –
FCX GLOBAL
Scope 1 5,699,671 5,095,135 4,530,897 5,240,161 4,969,382
Scope 2 4,436,423 4,201,061 3,691,117 3,164,821 3,043,069
Scope 1 + 2 Total 10,136,094 9,296,196 8,222,014 8,404,983 8,012,451
Scope 3 561,821 618,189 706,214 750,332 692,336
Note: Some figures and percentages may not add up to the total figure or 100% due to rounding
1 FMC Mining includes Bagdad, Cerro Verde, Chino, Climax, El Abra, Henderson, Morenci, Safford, Sierrita and Tyrone
2 2015-2017 Scope 2 emissions were calculated using a location-based method; 2018-2019 Scope 2 emissions were calculated using a market-based method
3 FMC Downstream Processing includes Atlantic Copper Smelter and Refinery, Bayway Rod and Wire, Ft. Madison Moly Special Products, Kokkola Cobalt Refinery, Miami Smelter and Rod,
Norwich Rod, Rotterdam, Stowmarket and El Paso Refinery and Rod
PT-FI
PT-FI’s GHG emissions are primarily Scope 1, resulting from coal use to generate electricity on-site for milling and other
processes, as well as diesel and other fuels used in the mine. In 2017, there was a significant emissions reduction primarily
associated with reduced production following the issuance of new regulations by the Indonesian government in early 2017 (in
effect at the time) which resulted in a temporary suspension of PT-FI’s concentrate exports from February 10, 2017, through
April 21, 2017. In 2019, another significant emissions reduction occurred as a result of ramping down our open-pit operation as
we continued transitioning to underground operations. Although PT-FI’s emissions have decreased by 27% since 2015, we
expect emissions to increase in 2020 and 2021 as we continue to ramp-up production and complete the transition to
underground mining.
11REDUCTIONS
AMERICAS COPPER PRODUCTION AMERICAS COPPER GHG REDUCTION PERFORMANCE
In 2019, we undertook an in-depth analysis of our GHG
7,000 6
emissions performance in copper mining, smelting and
METRIC TONS CO2E/METRIC TON COPPER
TOTAL METRIC TONS CO2E (THOUSANDS)
refining in the Americas. This data set comprises 60%
of our total global GHG emissions – a subset of the data 6,000 5
presented in the global data table on page 11. The goal
of the analysis was to better understand our progress to 5,000
date and what we are capable of in the future. The 4
analysis included our active copper mines, smelter and 4,000
refinery in the Americas. It did not include operations 3
downstream of cathode production or new projects 3,000
such as our Lone Star copper leach development
project in Arizona, where we broke ground in 2018 but 2
2,000
have not started producing cathode.
As illustrated in the graph to the right, GHG emissions 1
1,000
for this subset have remained relatively steady for the
last decade at around 5 million metric tons of GHG
0 0
emissions, with Scope 2 dominating but reducing over
2012 2013 2014 2015 2016 2017 2018 2019
time as we have implemented the projects described
above, electricity sources have decarbonized and we
have switched to market based reporting (also Actual - Absolute Business as Usual - Absolute
described previously). While Scope 2 GHG emissions
Actual - Production Intensity New 2030 Target
have decreased, Scope 1 GHG emissions have
increased as a result of lower ore grades and longer Business as Usual - Production Intensity
haulage routes in our mines.
CO2e = carbon dioxide equivalent
In 2014, our first significant processing improvement for
the time period (2012-2019) was realized with the
Metcalf mill construction completed at our Morenci
mine in Arizona. This increased the production capacity of This led to a decrease in Scope 1 GHG emissions due to
the site and significantly reduced the amount of electricity deferred stripping and higher grades of ore being delivered to
required per ton of product, shown in the solid dark blue for processing, which improved efficiency. In the latter half of
trend line. In 2016, emissions intensity continued declining 2017, and in 2018, we returned to normal stripping rates at our
as a result of Cerro Verde completing the addition of its new active mines, increasing Scope 1 GHG emissions. This was
mill. The new mill had two significant effects: (1) doubling somewhat offset by switching to market-based emission
production at the site, leading to increased demand for factors as described above.
electricity and fuels for mining, and (2) improving the energy
The solid blue line in the graph above represents actual GHG
efficiency per ton of copper produced.
emissions intensity while the dashed light blue line represents
During the economic downturn in 2016, we deferred Business as Usual (BAU). BAU was modeled assuming we had
stripping waste rock at our Americas mines and continued with the prior approach to truck maintenance and
purposefully sought out higher grade ore. utilization, industry standard process technologies and
purchased electricity emission factors. As indicated, GHG
emissions intensity decreased over this time period by 18%,
On an intensity basis, our 2019 or 30% when compared to BAU. In addition, our absolute
emissions (dark green bar) are 30% lower than BAU in 2019, as
GHG emissions in the Americas are indicated by the lighter green bar above. Finally, the chart
includes our newly established 2030 target to reduce GHG
30% lower than projected emissions by 15% on a 2018 baseline, or 3.1 metric tons of
GHG emissions per metric ton of copper cathode produced.
due to successful innovations in
mining, processing and reporting
12 | 2019 Climate ReportATLANTIC COPPER SMELTER AND REFINERY
Our Atlantic Copper (AC) operations in Spain processes over 1 million tons of copper concentrate annually. In a Wood McKenzie
study conducted in 2007, AC was benchmarked as one of the most energy efficient smelters in the world, despite being built in
the 1970s. AC was the first copper smelter globally to be certified to ISO 50001 Energy Management System in 2011. Over the
past decade, through a series of energy improvement projects, AC has improved it’s already industry leading energy efficiency
by almost 20% per ton of material processed. Projects implemented to achieve this reduction include redesign of refining
furnaces, reduction of fuel oil consumption, increased recovery and reuse of energy from the smelting process, and
improvement of power plant efficiency. AC is included in the FMC Downstream Processing emissions in the global data table on
page 11 and reported 2019 total emissions of only 125,211 metric tons, representing only 1.5% of our total global GHG emissions.
AC's 2019 GHG emissions were 15% lower than in 2015. In 2019, AC signed the first of two long-term energy purchase contracts
through a platform for large industrial consumers in Spain to help develop renewable energy projects in Spain.
MOLYBDENUM OPERATIONS
Freeport-McMoRan is vertically integrated for 100% of molybdenum production, with two primary molybdenum mines in
Colorado and by-product molybdenum production from multiple copper mines (Cerro Verde, Morenci, Sierrita and Bagdad).
By-product molybdenum production has been increasing over the 2013-2019 time frame, particularly as we doubled production
at Cerro Verde when the new concentrator came online in 2015. Given the cost advantages from by-product production, we have
decreased the output from our primary mines in Colorado over this same time period. We roast molybdenum concentrates at our
Sierrita operation in Arizona and our Fort Madison facility in Iowa, with roasting and subsequent conversion at our Rotterdam
facility in the Netherlands. We produce a ferro-molybenum product at a plant in Stowmarket, England. The total 2019 GHG
emissions for our primary molybdenum mines plus our downstream processing facilities is approximately 400,000 metric tons.
Molybdenum increasingly
is used in new solar
technologies to lower
costs of power generation
by enabling thinner, more
flexible panels
Molybdenum also is being
used to advance hydrogen
energy capture
technology
Our Climax operations in Colorado is one of two primary
molybdenum mines in our portfolio.
13RESILIENCE
Some of Freeport-McMoRan’s operations are located in challenging environments,
where being resilient is part of our daily routine. This can include the health, safety
and production risks of heavy rains, arid environments at risk for water stress or
heat-related occupational illness, as well as others. In order to prepare our
operations for potential severe weather events in the future, we take a holistic
approach to risk management and preventive planning.
Risk Management
Company-wide processes to address climate-related risks and opportunities cover
the full life cycle of our assets – from our pre-project sustainability review process
to our Risk Register process to resiliency planning for reclamation and closure. Our
mines are generally long-lived, and at the operating-level, each active mining and
metals processing facility evaluates climate-related risks and opportunities through
its Risk Register process. This includes reviewing the potential for physical or other
climate risks that could jeopardize the resiliency of revenue generating operations
(e.g., water availability and impacts from extreme precipitation events), regulatory
matters that could have direct or indirect financial impacts as well as source trends
in regional electricity grids that could affect our Scope 2 GHG emissions and
operating cost structure.
From a climate policy and regulatory perspective, we do not currently operate in
jurisdictions where existing mechanisms for carbon pricing signal a material
increase to our costs. However, as countries implement programs to meet
objectives of the COP 21 Agreement and the Nationally Determined Contributions,
we may experience increased costs relating to changes in energy sources for, and
GHG emissions from, our operations. In certain jurisdictions, however, we expect to
enter into favorably priced power contracts with utilities as economic, renewable
sources represent larger percentages of generation capacity.
In 2019, we began utilizing third-party data and risk indices to further inform our
operating-level forecasts of potential impacts, including those to critical
infrastructure. These impacts include those which could interrupt deliveries of good
and services as well as distribution of our products to markets. The data also include
indices to assist with monitoring regulatory changes in a range of jurisdictions
(assuming a 2-degree Celsius scenario) as governments adopt measures to curb
GHG emissions, which could both reduce our Scope 2 GHG emissions and affect our
operating costs while driving demand.
14 | 2019 Climate ReportIn 2019, the European Commission released is new legislative framework called the European Green Deal which it describes as its
roadmap for making the EU economy sustainable. The Deal outlines a new growth strategy that aims to transform Europe. It will
be implemented through a number of different initiatives, such as a Climate Law, a Circular Economy and Raw Materials alliances.
While early in its development, the Green Deal presents both opportunities and risks for copper. Opportunities for copper will
come via significant market demand for clean energy technologies, in which copper plays a significant role. In addition,
electrification of vehicles and green buildings will drive demand. Risks could come in the form of the newly described Carbon
Border Adjustment Mechanism (CARB) or market penalties/preferences for low carbon products. We are working closely with
industry associations and business partners in Europe to monitor and provide input as initiatives are developed.
Salient Climate-related Risks
To date, we have identified the following risks that warrant continued or additional planning and management:
• Physical impacts from weather events (intensity and frequency) and chronic changes in precipitation patterns
• Localized impacts such as flash flooding that can potentially jeopardize the health and safety of the workforce and local
communities
• Operational and reclaimed facilities at risk of damage or inaccessibility resulting in temporary production
curtailments and increased costs
• Continuing our occupational health program for managing heat stress in the workforce at our copper mining and
processing operations in North and South America, which are all located in desert environments
• Offsite releases of impacted operational water as a result of acute, extreme precipitation events
• Physical impacts to transportation infrastructure affecting availability of operating supplies and our ability to ship
product, including climate-related episodes of high-seas events which can also affect timing of product shipment
• Longer-term drought conditions, particularly in the Colorado River basin of the United States, which can affect the
physical availability of water to our operations and/or put our rights to certain water sources at risk
15RESILIENCE
Weather-related
Operational Impacts
Our operations have experienced significant
episodic weather events in the past. When these
events materially impact our operating results, we
disclose the nature of the impacts in our Annual
Reports on Form 10-K and quarterly reports on
Form 10-Q filed with the United States Securities
and Exchange Commission. As we move forward
with scenario analysis, we will incorporate data
related to future weather stress into our analysis.
SUSTAINABLE ENERGY SOLUTIONS IN COMMUNITIES
In 2019, to enhance Indonesian family income
and raise them above the poverty line in
support of achieving the SDGs, PT-FI, Freeport-
McMoRan and the Arizona State University’s
School of Sustainability implemented two
sustainable energy activities in Papua,
Indonesia.
The objectives of the first project were to
reduce fish storage costs and improve quality
by producing ice via a solar panel system.
Sustainability of the activity relies on the
participation of a local Catholic-affiliated
cooperative, Maria Bintang Laut (MBL), that
operates the system.
The Amungme and other indigenous groups
grow, harvest, process and sell cacao with the
assistance of local cooperatives to stimulate
economic growth and reduce dependence on
PT-FI. Cacao farmers were losing a sizable
portion of their harvest during the drying stages
because Papua is very humid and wet with
limited amounts of direct sunlight. The partners
developed a simple, effective cacao
greenhouse dryer constructed from local
materials. This reduced losses and provided a
simple sustainable solution requiring no
electricity.
16 | 2019 Climate ReportCommunity Resilience
and Adaptation
The increased frequency of weather events and general climatic
changes can cause damage to infrastructure and impact
vulnerable communities. Aiding communities in adapting
involves supporting their efforts in building their climate
resilience and increasing the ability to withstand events such as
droughts and floods. Adaptation measures help people live with
the effects of rising global temperatures and the resulting
impacts over time.
A major flood event that struck El Abra operations in early 2019
caused extensive damage throughout the Alto El Loa region of
the Atacama Desert. Already vulnerable, indigenous
communities were particularly impacted as the heavy rainfall
washed out local roads and destroyed homes and
infrastructure.
Working with the affected communities, an emergency
response plan was quickly developed, supporting immediate
actions to address basic needs including transport, shelter and
access to food and water. While restoring its operational
infrastructure, El Abra prioritized community support by
assisting with clearing and repairing roads, as well as providing
construction materials for damaged homes. After the
immediate response to the flood event, El Abra supported tasks
that included removing flood debris, filling sinkholes, repairing
homes, rehabilitating irrigation channels, and enhancing
drinking water systems.
At our Cerro Verde operation in Arequipa, Peru, similar efforts
have been implemented to enhance resiliency during the rainy
season. Working with nearby vulnerable communities and civic
leaders, Cerro Verde implemented relief actions in response to
the impact of the 2019 rainy season to the Arequipa region.
Support included the delivery of drinking water when the local
water supply was inactive and the repair of damaged water
piping infrastructure. Berms and retaining walls were
constructed to reduce flooding risk to nearby homes. Cerro
Verde also resourced the cleaning of fluvial channels by
donating approximately 5,000 gallons of fuel to support the
clearing of river and road debris that impacted agricultural and
other livelihood activities. Agriculture is very important to the
local economy and Cerro Verde has long supported local
farmers with efficient irrigation systems as an adaptation
measure for reduced water availability. Cerro Verde is now
coordinating with INDECI, the National Institute of Civil Defense,
and municipal leadership to develop a response and recovery
Weather monitoring station at our plan for future extreme weather events.
Sierrita operations in Arizona.
17CONTRIBUTION
Copper is key to the energy transition as it is the main material used globally to
conduct electricity. Freeport-McMoRan is one of the largest publically traded
producers of copper with an estimated 7% of total worldwide mined copper
Copper Utilization production. As a leading copper producer for global markets, we know that we play
an important role in providing copper the world needs. The market for copper has a
Key to Global robust future, and we know that stakeholders are demanding that we produce and
deliver the red metal in a responsible manner.
DeCarbonization
Opportunities
Up to 4x We believe copper will continue to contribute significantly to new technologies for
energy efficiencies that advance communications and enhance public health.
more copper Identified products that will require additional copper in the medium to long term
include: (1) high-efficiency motors, which consume up to 75% more copper than a
vs. internal standard motor and, (2) electric vehicles, which consume up to four times the
amount of copper in terms of weight compared to vehicles of similar size with an
combustion internal combustion engine and (3) require copper-intensive charging station
engines infrastructure to refuel, and (4) wind and solar renewable energy generation
facilities, which consume four to five times the amount of copper compared to
traditional fossil fuel generated power. More specifically, by 2027, an estimated 27
million electric vehicles will be on the road, up from 3 million in 2017. This will raise
copper demand in electric vehicles from 185,000 metric tons in 2017 to 1.74 million
metric tons in 2027. In addition, each electric vehicle charger will add 0.7 kilograms
of copper – and fast chargers can add up to 8 kilograms of copper each.1 As one of
the world's largest producers of copper, we know we play a crucial role in delivering
4-5x more this demand to the market.
We are confident in the fundamentals and long-term demand outlook for mined
copper vs. copper, our primary product. We believe that mined copper will remain the primary
source of copper for many decades as recycling, either in the form of scrap or
fossil fuel circular economy materials, will not be able to meet the anticipated long-term global
power demand by itself.
generation Our portfolio of copper assets is large and high quality, with strong and established
franchises in North America, South America and Indonesia. Our production profile is
growing, which will boost our margins and cash flows. Our company’s assets are
long lived and durable with embedded organic options for reserve and resource
growth. Our proven track record for navigating volatile market conditions provides
confidence in our ability to maintain strength during uncertain economic times. We
Source: International Copper Association remain focused on executing our plans to provide long-term value to global markets.
18 | 2019 Climate Report 1 Copperalliance.orgThe graphic below describes how we
implement responsible production at
Scope 3 Emissions Freeport-McMoRan, from Vision to
Action.
Scope 3 emissions for copper are minimal and in some cases negative, and we believe it is important that these data are known and
understood. For us, this means we need to better understand the Scope 3 emissions generated by the copper we produce, and we
partner with our industry peers to define what responsible production means to stakeholders.
Freeport-McMoRan is vertically integrated for approximatelyGO 50%
VERNofANour
CE overall copper concentrate production, with our Miami
smelter in Arizona processing approximately 850,000 metric tons of internally produced concentrate per year, and our Atlantic
Copper smelter in Huelva, Spain, processing approximately 600,000 metric tons of our concentrate per year (as noted earlier, this
facility also processes approximately 400,000 metric tons of INTERNAL
concentrate purchased from other sources). Our copper refineries in
El Paso, Texas, and at Atlantic Copper in Spain also operate toPOLICIES
upgrade copper anode to 99.99% copper cathode. We also operate
& PRACTICESto manufacture copper rod products. In fact, 65% of our
rod plants in Miami, Arizona; El Paso, Texas, and Norwich, Connecticut,
internal cathode production is processed at our own rod mills. This puts us in a unique position to be able to provide rod customers
with a secure supply produced as efficiently as possible. It also enables us to estimate Scope 3 emissions for customers of our
concentrate or cathode products globally, which helps us understand
RISK REGISTERthe environmental life cycle profile of our copper. Finally, it
helps global copper users make better decisions for market development
PROCESS and policy frameworks.
+
The Scope 3 emissions reflect the estimated amount of GHG emissions to process our sold copper concentrates to cathode
ACTION
products, based on the average energy intensity of our own integrated production. Also included are refining of anodes, air travel
+
and upstream lime production. Scope 3 emissions to further manufacture copper rod products into copper wire products for use in
MEASUREMENT, REPORTING
products ranging from appliances to automobiles to consumer electronics are not material, in comparison with producing copper
cathode. Published and peer-reviewed Life Cycle & EXTERNALstudies
Assessment THIRD-PARTY
have confirmed this.
STAKEHOLDER ASSURANCE VOLUNTARY
ENGAGEMENT
In the coming years, we will be focused COMMITMENTS
on participating in dialogues with global stakeholders on calculating and communicating
Scope 3 emissions. We also will work towards a more comprehensive and precise approach.
2019 SCOPE 3 EMISSIONS BY SOURCE
VISION & VALUeS
Metric tons
Source CO2e SCOPE 3
EMISSIONS
Production of Lime used (FCX sites) 364,396
Smelting & Refining (Non-FCX sites) 300,456
Business Air Travel 14,606
Production of Lime Used (FCX sites) 54%
Refining Anodes (Non-FCX sites) 123 Smelting/Refining (Non-FCX sites) 44%
Business Air Travel 2%
Total 679,581
Refining Anodes (Non-FCX sites) 0%
19WHAT'S NEXT
We believe we have the opportunity, and obligation, to supply the world with
responsibly produced copper, which includes operating in a way that manages and
mitigates our GHG emissions and other climate-related risks. With the recent decline
in the global economy due to the COVID-19 pandemic, we are focused in the near-
term on maintaining safe and financially viable operations during uncertain times. In
the short term, we are committed to work towards completing our alignment with
TCFD recommendations in our strategy and disclosures. Over the long term, we
remain committed to investing in innovative technologies that support making
progress on our commitments. This section outlines our current metrics, targets and
actions planned for each pillar of our strategy.
REDUCTION RESILIENCE CONTRIBUTION
Reduction
Freeport-McMoRan is committed to managing and mitigating our GHG emissions,
We are targeting to both to support overall climate change mitigation efforts and the performance of our
business. As noted previously, the cost of energy for the business is material to the
achieve a 15% reduction business, at 20% of our operating costs. As our long-lived mines continue to mature,
ore grades will decline and haulage profiles in our open pits are getting longer and
in GHG emissions per steeper. As a result, our fuel use (reflecting Scope 1 emissions) will be prone to
metric ton of copper increase. Our continued focus on asset life cycle and efficiency at our mines will help
to mitigate this.
produced in the In addition, our attention on energy efficiency and innovation in our processing
Americas by 2030, using equipment will continue to have a positive impact on our Scope 2 emissions, as it has
over the last decade. We strive to make improvements over the next decade as we
a 2018 baseline continue transitioning our electricity profile, either through renewable projects of our
own or with partners.
20 | 2019 Climate ReportThe graphic below describes how we
implement responsible production at
Freeport-McMoRan, from Vision to
Action.
In the next decade, we are targeting to achieve similar success to the last decade, with a minimum improvement of 15% reduction in
carbon intensity per ton of copper cathode produced in the Americas by 2030, based on a 2018 baseline. To do so, our emissions
reduction approach for the next decade is focused on three key levers:
1. Energy Transition: Reducing our carbon intensity throughGthe
OVERfurther
NANCE integration of renewable energy projects into the energy
supplies of our mines.
2. Innovation in New Technology: Continuing innovation in our processes through advancing new technologies, including
INTERNAL
concentrator technology which could lead to significant further improvements in energy efficiency.
POLICIES
& PRACTICES
3. Refining our Existing Technology: Achieving increased copper production for the global energy transition through our
Americas’ Concentrator program, which combines Artificial Intelligence with innovative ways of working while increasing the
energy efficiency of our existing production processes. In addition, we will continue our truck rebuild program and evaluate
additional innovation options. RISK REGISTER
PROCESS
+
Resilience ACTION
+
Resilience is crucial to a strong and thriving businessMEASUREMENT, REPORTING
and a sustainable future. Freeport-McMoRan’s preventive planning and risk
management have been a part of our operational discipline& EXTERNAL THIRD-PARTY
for many years. Weather-related events can disrupt operations,
negatively impact production volumes STAKEHOLDER ASSURANCE
and financial performance, VOLUNTARY
and cause environmental damage with lasting impacts on local
ENGAGEMENT COMMITMENTS
communities. Climate change can exacerbate water stress in arid environments, where copper mines are often located.
We aim to take a holistic approach to risk management and preventive planning to prepare our operations and neighboring
communities for the risks of climate change such as the potential impacts from weather events, disruptions or degradation of
resources, health effects, and more. Our ability to remain resilient in the face of changing weather and resource patterns at our sites
in arid environments where the vacillation between drought and rainfall can be significant is critical.
We commit to the following actions to enhance our resiliency:
• Continue implementation of our Safe Production Matters
VIS
ION programeS
& VALU to actively improve our safety culture and drive down
incidents, which is a critical component to our resilience, especially in the case of future severe-weather events
• Develop company-wide climate scenarios and integrate the findings into our practices in line with the recommendations of
the TCFD
• Publish our first stand-alone Water report in 2020, aligning with ICMM’s Water Stewardship Position Statement and
complementing our ongoing and previous efforts, including over a decade of GRI reporting and previous Carbon Disclosure
Project disclosures
• Maintain operating discipline around production costs, particularly in light of the currently changing operating plans and
potential long-term economic uncertainties which allows us to be nimble in the event of uncertain weather conditions
• Continue to identify corporate and site-level risks and opportunities through our Risk Register process and use critical
controls to prevent or mitigate risks
• Assist local stakeholders and communities with preventive measures for potential impacts from climate change
21WHAT'S NEXT
Contribution
Copper is an important contributor to the energy transition and a decarbonized world as a result of its role in electrification and
renewable technologies. We strive to produce and deliver our products responsibly while working to encourage circular economy
frameworks including reuse and recycling of copper. From a value chain perspective, we do this in three key ways: (1) working to
identify and mitigate risks in our supply chains through our responsible sourcing efforts, (2) assessing and communicating the risks
of our products and by-products in use to support our customer’s good management practice, and (3) working to leverage the
benefits of our products along the value chain. Going forward, we commit to the following to support the Contribution component
of our strategy:
• Deliver responsibly produced copper and molybdenum to the market to enable the energy transition
• Improve mapping of Scope 3 emissions to understand and support the copper and molybdenum value chains, lowering their
footprints and contributing to a circular economy
• Follow the progression of the European Green Deal to provide input to decision makers to assist in meeting energy transition
and circular economy targets, which we believe will positively impact copper and molybdenum demand
• Continue to use and share our life cycle inventories for the products we produce with our industry associations for the
development of common datasets and with customers or other stakeholders to advance collaborations
A Bright Future
Copper, which is 100% recyclable, helps abate greenhouse gas (GHG )
emissions and reduces the energy required to produce electricity. A recent
study conducted by the World Bank, The Growing Role of Minerals and
Metals for a Low Carbon Future, estimates significant growth in demand for
both copper and molybdenum as a result of the increase in alternative
energy solutions.1 For example, wind turbines use copper for grounding
wires, power cables, transformers, inverters, lightning protection and as
part of generators and control systems. Copper is also a key component of
solar energy systems, increasing the efficiency, reliability and performance
of photovoltaic cells and modules. Finally, up to four times as much copper
is required in an electric plug vehicle than an internal combustion engine
vehicle. A study conducted by IDTechEx for the International Copper
Association estimates that by 2027, an estimated 27 million electric
vehicles will be in service – that’s 24 million more than in 2017.2
In addition, molybdenum increasingly is used in new solar technologies to
lower costs of generation by enabling thinner, more flexible panels.
Molybdenum also is being used to advance hydrogen energy capture
technology.
1 Arrobas, Daniele La Porta; Hund, Kirsten Lori; Mccormick, Michael Stephen; Ningthoujam, Jagabanta; Drexhage, John Richard.
2017. The Growing Role of Minerals and Metals for a Low Carbon Future (English). Washington, D.C. : World Bank Group.
http://documents.worldbank.org/curated/en/207371500386458722/The-Growing-Role-of-Minerals-and- Metals-for-a-
Low-Carbon-Future
2 https://copperalliance.org/wp-content/uploads/2017/06/2017.06-EMobility-Factsheet-1.pdf
22 | 2019 Climate
Climate Report
ReportYou can also read