Carbon Footprint 101: A GUIDE FOR FOOD RETAILERS
←
→
Page content transcription
If your browser does not render page correctly, please read the page content below

Carbon Footprint 101:
A G U I D E F O R F O O D R E TA I L E R S

                                R E S O U R C E S
C A R B O N    F O O T P R I N T     1 0 1

  Acknowledgements
The Food Marketing Institute (FMI) Sustainability Task Force thanks the authors (see About the
Authors) for creating an exceptional Carbon Footprint 101 Toolkit for the industry, including this report,
an accompanying presentation and a carbon footprint calculator – all available free on the FMI website at
www.fmi.org/sustainability/. The Task Force and authors especially thank Paul Hepperla and Verisae
for their financial analysis data and calculator for the Toolkit.

We also thank the following people for offering their expertise, content, survey answers, encouragement
and feedback:

Matt Banks                    World Wildlife Fund
Scott Buehler                 Buehler Food Markets, Inc.
Ed Estberg                    Raley’s Family of Fine Stores
Suzanne Forbes                Wakefern Food Corporation
Patrick Guillermety           Unified Grocers, Inc.
Andy Harig                    Food Marketing Institute
Michael Hewett                Publix Super Markets, Inc.
Sujeesh Krishnan              The Carbon Trust
Tom McIntyre                  SUPERVALU INC.
Joella Seymour                Food Marketing Institute
Bob Sheppard                  Clean Air-Cool Planet
Mike Smith                    Hy-Vee, Inc.
Dan Sugg                      Verisae
Jason Wadsworth               Wegmans Food Markets, Inc.
Deborah White                 Food Marketing Institute

Finally, we thank Jeanne von Zastrow at FMI and Bob Garrity at Giant Eagle, Inc., whose Task Force
leadership makes this all possible.

Copyright © 2009
Food Marketing Institute

All rights reserved. This publication may not be reproduced, stored in any information or retrieval system or transmitted in whole
or in part, in any form or by any means — electronic, mechanical, photocopying, recording or otherwise — without the express
written permission of the Food Marketing Institute.

Food Marketing Institute (FMI) conducts programs in public affairs, food safety, research, education and industry relations on
behalf of its 1,500 member companies — food retailers and wholesalers — in the United States and around the world. FMI’s U.S.
members operate approximately 26,000 retail food stores and 14,000 pharmacies. Their combined annual sales volume of $680
billion represents three-quarters of all retail food store sales in the United States. FMI’s retail membership is composed of large
multi-store chains, regional firms and independent supermarkets. Its international membership includes 200 companies from
more than 50 countries. FMI’s associate members include the supplier partners of its retail and wholesale members.

                                                                                                                                 1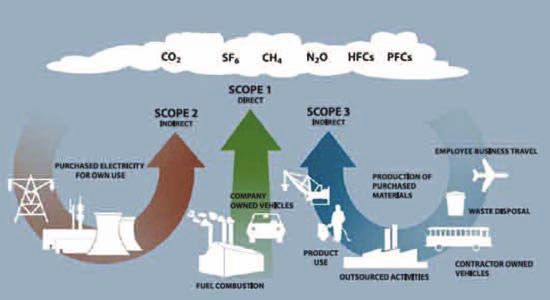
C A R B O N   F O O T P R I N T   1 0 1

  About the Authors

FMI would like to thank the following people for contributing in-depth research for Carbon Footprint
101: A Guide for Food Retailers. They were all MBA students at The Pennsylvania State University’s Smeal
College of Business during this project and we are grateful for their time, commitment and dedication:

Matthew Holtry, Project Manager
matthewholtry@psu.edu

Christopher Anderson
csa137@psu.edu

Brian Conry
bmc257@psu.edu

Jared Freer
drf207@psu.edu

Andrew Helfst
ach218@psu.edu

Ryan Sheetz
res927@psu.edu

                                                                                                           2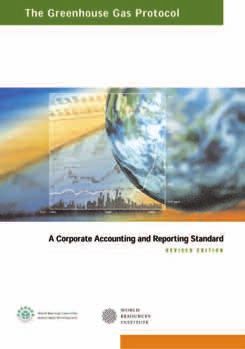
C A R B O N   F O O T P R I N T   1 0 1

  FMI Sustainability Task Force
Bob Garrity, Chair           Megan Hellstedt              Dawn Reeves
Giant Eagle, Inc.            Hannaford Bros. Co.          Harris Teeter, Inc.

Tom McIntyre, Vice-Chair
                             Harriet Hentges              Sandy Sandahl
SUPERVALU INC.
                             Ahold USA, Inc.              Target Corporation

Wesley Bean
                             Michael Hewett               David Smith
Winn-Dixie Stores, Inc.
                             Publix Super Markets, Inc.   Sobeys Inc.

Scott Buehler
                             Scott Hollar                 Michael Smith
Buehler Food Markets, Inc.
                             Food Lion, LLC               Hy-Vee, Inc.

Jeanne Colleluori
                             Walter Kraus                 William Sweet
Wegmans Food Markets, Inc.
                             Loblaw Companies Limited     Price Chopper Supermarkets

Brendon Cull
                             Peter Larkin                 Joanie Taylor
The Kroger Co.
                             Save Mart Supermarkets       Schnuck Markets, Inc.

John Domino
                             Karen Meleta                 Jason Wadsworth
SUPERVALU INC.
                             Wakefern Food Corporation    Wegmans Food Markets, Inc.

Suzanne Forbes
                             Marsha Miller                Jeanne von Zastrow
Wakefern Food Corporation
                             Unified Grocers, Inc.        Food Marketing Institute

Kate Heiny
                             George Parmenter
Target Corporation
                             Hannaford Bros. Co.

                                                                                               3
C A R B O N F O O T P R I N T 1 0 1
Executive Summary
reenhouse gas (GHG) emissions and their potential impact on global climate change are drawing
G increased attention among lawmakers, regulators, businesses and consumers. Many companies are
calculating and tracking their carbon footprint as one measure to gauge the effectiveness of
sustainability initiatives to reduce these emissions.
Customers respond well to sustainability programs. In fact, 60 percent said it is important for supermarkets
to have recycling and sustainability initiatives, according to FMI’s U.S. Grocery Shopper Trends 2009 report.
In addition, 19 percent said this is a very important factor when selecting their primary store.
This report seeks to show food retailers how to develop proactive greenhouse gas-management strategies
that reduce emissions and benefit the environment and the bottom line. It is divided into three sections:
Section 1: Calculating Your Corporate Carbon Footprint — Defines the components of a
carbon footprint and presents a five-step process to calculate your company’s greenhouse gas
emissions.
Section 2: Industry Benchmarking and Snapshot — Shows how to set aggressive carbon
emissions reduction goals that are used by some in the retail food industry.
Section 3: Legislative and Regulatory Approaches to Controlling Greenhouse Gas
Emissions — Outlines legislative efforts, such as cap-and-trade measures and carbon taxes,
designed to reduce greenhouse gas emissions and explores how these could affect the industry. To
learn the most current information about these laws and regulations, visit www.fmi.org.
Additional resources, including a carbon calculator that facilitates efforts to measure a company’s
footprint, are available on the Sustainability page of the FMI website (www.fmi.org/sustainability/).
4C A R B O N F O O T P R I N T 1 0 1
Contents
Section 1. Calculating Your Carbon Footprint.................................................................................6
Components of a Carbon Footprint ...............................................................................................6
Carbon Dioxide Equivalent Units of Measurement .......................................................................6
What One Metric Ton of CO2-e Looks Like ................................................................................7
Communicating the Environmental Impact of Reductions............................................................7
Current International Standard for GHG Emissions Reporting ...................................................8
The Five-Step Process to Calculate a Carbon Footprint ................................................................8
Mini Case Study: Tesco’s Carbon Footprint Management...........................................................11
Using Offsets and Credits to Reduce a Carbon Footprint............................................................11
Outside Help: Partnerships...........................................................................................................12
Section 2. Industry Benchmarking and Snapshot.............................................................................13
Establishing a Baseline Year..........................................................................................................13
Reduction Goals: Absolute vs. Relative Emissions .......................................................................13
Reduction Goals: Retailer Examples ............................................................................................14
Mini Case Study: Tesco’s GHG-Reduction Goals.......................................................................14
Mini Case Study: Safeway and the Chicago Climate Exchange ..................................................15
Providing the Right Incentives .....................................................................................................15
Section 3. Legislative and Regulatory Approaches to
Controlling Greenhouse Gas Emissions ...........................................................................................17
Legislative Limits on Greenhouse Gas Emissions in the United States.......................................17
Cap and Trade...............................................................................................................................18
A Carbon Tax ...............................................................................................................................19
Regulatory Efforts at Controlling Emissions ...............................................................................19
State and Local Efforts.................................................................................................................20
Voluntary and Private Programs ...................................................................................................21
Appendix: Food Retailer Case Studies ...............................................................................................22
Case Study: Shaw’s Supermarkets ................................................................................................22
Case Study: The Stop & Shop Supermarket Company................................................................23
5SECTION 1: C A R B O N F O O T P R I N T 1 0 1
Calculating Your
Corporate Carbon Footprint
he definition of “carbon footprint” varies. In this guide, the term refers to the quantity of
T greenhouse gas (GHG) emissions directly and indirectly caused by a company’s operations. This
includes the emissions released when burning fossil fuels for transportation, heating and electricity,
as well as the leakage of refrigerants into the environment. A carbon footprint is one measure of a
company’s impact on global climate change.1
Figure 1: Greenhouse Gases
COMPONENTS OF
A CARBON FOOTPRINT Carbon
Dioxide
(CO2)
While six gases are internationally recognized Fossil Fuel Methan
Nitrous
Oxide
Consumption (CH4)
by the Kyoto Protocol as greenhouse gases for (N20)
Greenhouse
emissions-reporting purposes (see Figure 1), Gases
(GHGs)
only four are relevant to most food retailers:
PFCs
Refrigerant HFCs
• Carbon dioxide (CO2) Loss
• Methane (CH4) SF6
• Nitrous oxide (N2O)
• Hydroflourocarbons (HFCs)
The first three are byproducts of burning
fossil fuels. HFCs are the gases that make up a growing portion of refrigerants.2 Perfluorocarbons (PFCs)
and sulfur hexafluoride (SF6) are typically associated with electronics and manufacturing.
Global Warming Potential (GWP)
CARBON DIOXIDE EQUIVALENT (CO 2 -E)
Carbon Dioxide (CO2) 1 UNITS OF MEASUREMENT
Methane (CH4) 21
Nitrous Oxide (N2O) GHGs have different abilities to trap heat (infrared radiation)
310
HFC-134a (HFC) 1,300 in the atmosphere, including the amount they absorb and
HFC-23 (HFC) 11,700
length of time for which the heat is absorbed. A “global
warming potential” (GWP) number is assigned to each and
converted to carbon dioxide equivalent (CO2-e) units. For
example, methane can trap atmospheric heat 21 times more effectively than carbon dioxide. Therefore,
methane’s GWP is 21. In other words, releasing one pound of methane into the air is considered to have
the same GWP as releasing 21 pounds of carbon dioxide (21 pounds of CO2-e). The table below shows
some greenhouse gases and their associated GWPs.3
1 Carbon Footprint Ltd., “What is a Carbon Footprint?” www.carbonfootprint.com/carbonfootprint.html.
2 The Montreal Protocol encourages retailers to convert to refrigerants with lower ozone-depleting potential, such as HFCs, which ironically have a higher global
warming potential.
3 Environmental Protection Agency (EPA), Inventory of U.S. Greenhouse Gas Emissions and Sinks: 1990-2006, Executive Summary, April 2008,
http://epa.gov/climatechange/emissions/downloads/08_ES.pdf.
6C A R B O N F O O T P R I N T 1 0 1
Companies can use the FMI Carbon Calculator, developed by Verisae, to derive comparable GWPs for
the emissions in their carbon footprint. To use this tool, go to www.fmi.org/sustainability/ and click on
“FMI Carbon Calculator.”
WHAT ONE METRIC TON OF CO 2 -E LOOKS LIKE
A carbon footprint is typically measured in metric tons of CO2-e (MT CO2-e) to maintain consistency
with international standards. Even small locations can produce significant emissions. Figure 2 lists
activities and energy use that generate GHG emissions equaling one MT CO2-e:4
Figure 2: One Metric Ton CO2-e
Emissions from Exhaust from Release of 1.07 Power plant Exhaust from
burning driving 2,670 pounds of HFC- emissions to driving 581 miles
18,405 standard miles in a passen- 404a refrigerant generate 1,406 in a tractor (5.9
cubic feet of ger car (23.4 into the atmosphere kilowatt hours of miles per gallon)
natural gas miles per gallon) due to leakage electricity
Conversely, even relatively small reductions can have a big impact. For example, reducing HFC-404a
refrigerant leakage by a single pound is equivalent to reducing the GHGs in the atmosphere by the
amount of exhaust that is produced by a 2,670 mile car trip.
COMMUNICATING THE ENVIRONMENTAL IMPACT OF REDUCTIONS
Since most consumers do not discuss or even understand the CO2-e, how can you explain the
environmental impact of your emission-reduction efforts?
The Greenhouse Gas Equivalencies Figure 3: CO2-e Environmental Equivalencies
Calculator developed by the
Environmental Protection Agency Reduction of 1 Metric Ton CO2-e equals:
(EPA) provides a solution. It is an
• Planting 25.7 tree seedlings and growing for 10 years
online tool that converts GHG • 41.7 propane cylinders from home barbeques
emission reductions into commonly
understood terms that can be used for
internal and external communications. 5 Reduction of 100 Metric Ton CO2-e equals:
• Annual emissions of 18.3 passenger cars
For example, reducing carbon • Annual energy emissions of 8.8 US households
emissions by one MT CO2-e has the • Annual carbon “consumed” by 22.7 acres of pine forest
same impact as planting 25.7 tree
seedlings and letting them grow for
10 years (trees consume these emissions). Figure 3 shows more examples.
4 These estimates are based on EPA’s Calculator for Low Emitters, available at EPA, Climate Leaders: Climate Change Management Tools for Low Emitters,
www.epa.gov/stateply/resources/lowemitters.html.
5 These estimates are based on EPA’s Greenhouse Gas Equivalencies Calculator, available at www.epa.gov/cleanenergy/energy-resources/calculator.html.
7C A R B O N F O O T P R I N T 1 0 1
CURRENT INTERNATIONAL STANDARD FOR GHG EMISSIONS
REPORTING
Like financial accounting, greenhouse gas emissions accounting has standard principles that define which
and how emissions should be counted.
To determine credible GHG emissions data, an inventory should follow recognized international
standards, such as those of The Greenhouse Gas Protocol: A Corporate
Accounting and Reporting Standard (Figure 4).6 The standards in this Figure 4: GHG Protocol
protocol were developed by the World Resources Institute (WRI) and the
World Business Council for Sustainable Development (WBCSD) in 2001.
They are used globally by governments, businesses and third-party
greenhouse gas registries (including The Climate Registry and California
Climate Action Registry). The guidance below is based on the Greenhouse
Gas Protocol.
THE FIVE-STEP PROCESS TO CALCULATE A
CARBON FOOTPRINT
Since food retailers are diverse in size and type, each company must create
its own GHG inventory management plan. Any food retailer or wholesaler
may calculate its carbon footprint following the five steps below.
Step 1: Establish an Organizational Boundary
An organizational boundary defines where to measure emissions based on operations that a company
legally owns or controls. Since these can vary among retailers, organizational boundaries can be
established using either the “control” or “equity share” approach.
Through the control approach, 100 percent of the emissions are counted for operations over which a
company has either full control (i.e., authority to implement operational policies) or financial control (i.e.,
authority to set financial policies and benefit from the performance).
Through the equity share approach, a portion of emissions equivalent to the percentage ownership (or
equity share) of a joint venture/partnership/subsidiary is counted. For example, if retailer A owns 70
percent of retailer B, then retailer A would count 70 percent of B’s emissions as its own.
6 The full version is available at http://pdf.wri.org/ghg_protocol_2004.pdf.
8C A R B O N F O O T P R I N T 1 0 1
Step 2: Define an Operational Boundary
An operational boundary consists of the specific activities (such as refrigerant loss) that comprise a
company’s GHG emissions inventory. Emissions are grouped into three “scopes,” based on a company’s
ability to control particular emissions, the source of the emissions and the ownership of the source. They
are defined as follows:
Scope1. Direct Emissions — from activities controlled completely by the company, such as burning
natural gas in a store, consuming fuel in a company-owned car or truck or refrigerants leaking from a
freezer.
Figure 5: Emission Scopes
Scope 1 (Direct) Scope 2 (Indirect) Scope 3 (Optional)
Scope 2. Indirect
Emissions — from • Natural Gas • Purchased Electricity • Waste Disposal
activities a company • Refrigerant Loss • Employee Commute
• Logistics Fleet • Customer Travel
can influence but
• Corporate Fleet • Inbound Deliveries
cannot control directly,
such as using
electricity from power plants owned by a utility. A retailer can help reduce these emissions by cutting
electricity use, but the utility controls the plant and how GHGs are released into the atmosphere.
Scope 3. Optional Emissions — from
Figure 6: Sample GHG Scopes
sources a retailer has little ability to
control, such as the distance customers or
employees travel and the type of
transportation they use.
The typical carbon footprint of any
organization includes Scope 1 and 2
emissions for reporting purposes.
Scope 3 emissions are optional for most
GHG reporting purposes, but are
sometimes included to show the
greenhouse gas reduction benefits of specific initiatives. For example, an employee working from home
once a week would reduce a company’s Scope 3 commute emissions for this person by approximately 20
percent.
9C A R B O N F O O T P R I N T 1 0 1
Step 3: Collect Necessary Data
While data collection requirements vary slightly from one retailer to the next (for example, depending on
the amount of manufacturing it does), the following graph shows the data that every food retailer should
collect annually to create a complete carbon footprint:
Figure 7: Scope 1 and 2 Data
• Cubic feet of natural gas combusted
Scope 1 (Direct) • Actual/calculated pounds of refrigerant lost for each type of refrigerant
• Amount of vehicle fuel consumed and types of vehicles
• Annual kilowatt hour energy consumption for all locations
Scope 2 (Indirect) • Electricity grid (eGRID) factors for each utility company/location*
• Type of green power purchased and its emission factor
* The EPA’s electricity grid (eGRID) factors compensate for different power generation methods in different parts of the country. For example, coal-intensive
regions like Ohio generate more CO2-e per kilowatt-hour than renewable-intensive regions like the Pacific Northwest. To download maps of the eGRID
regions and to view summary tables showing the CO2-e/kWh conversions, visit: http://www.epa.gov/cleanenergy/energy-resources/egrid/index.html
Step 4: Convert the Data Into a Carbon Footprint
Once emissions levels are collected, the raw data must be converted into CO2-e values. Companies should
use a single system to convert emissions to CO2-e values. While the Intergovernmental Panel on Climate
Change (IPCC) and the EPA define proper conversion factors, software-based calculations will save
significant time and allow for timely and consistent emissions tracking.7
A Simple Tool: FMI Carbon Calculator for Food Retailers
The FMI Carbon Calculator can be used to make basic calculations, such as converting raw data
(refrigerant use, fossil fuel consumption and electricity use) into carbon emissions equivalents. (See
www.fmi.org/sustainability/ and click on the “FMI Carbon Calculator”).8
Step 5: Establish a Baseline Year and Set an Emissions-Reduction Goal
The baseline year is the first year in which GHG data can be completely and confidently determined.
Reduction goals are then created for each subsequent year. Since the retail food industry has not
established formal guidelines for setting GHG reduction goals, Section 2 of this report suggests how to
design an aggressive reduction goal for your company.
7 IPCC Synthesis Report: http://www.grida.no/publications/other/ipcc_tar/?src=/CLIMATE/IPCC_TAR/vol4/
8 The FMI Carbon Calculator was developed by Verisae, a private consulting firm, that offers more sophisticated analytical tools as well. See, eg, at
http://www.verisae.com/enterprise-emissions-tracking.html.
10C A R B O N F O O T P R I N T 1 0 1
MINI CASE STUDY: TESCO’S CARBON FOOTPRINT MANAGEMENT
Tesco began measuring its Figure 8: Tesco’s Emissions Boundary
carbon footprint in 2005.9
Boundary for Direct Carbon Footprint
With help from a consultant
Tesco
and in accordance with the Offices/
International Buildings
Greenhouse Gas Protocol, Freight
Refrigerant Business
Tesco has quantified its Scope Emissions Travel
1 and Scope 2 emissions. Tesco Consumption
Production Tesco Stores
of Goods Distribution & Disposal
Centres One Stop
of Goods
Within the operational
boundary outlined in red Primary Tesco Home
Customer
Supplier Distribution Transport
Delivery
(Figure 8), Tesco calculated Transport
that it emitted approximately
Asset Waste
Recycling & Employee
4.13 million MT of CO₂-e in Sites
Disposal Commuting
2007. Over time, Tesco has
expanded its business while
reducing its GHG emission intensity. For example, Tesco’s emissions from 2006 to 2007 remained
constant even though sales and selling area increased by 10.9 percent and 17.4 percent, respectively.
In addition, Tesco has used the information from its carbon footprint measurements to set a goal of
reducing electricity use in 2010 by 50 percent (against a year 2000 baseline). Tesco intends to use more
efficient lighting and HVAC systems, to phase out HFCs from its large-scale refrigeration systems to
boost the fuel efficiency of its distribution system and to create a green building blueprint for the
construction of all new stores.
USING OFFSETS AND CREDITS TO REDUCE A CARBON FOOTPRINT
While increasing operational
Figure 9: Examples of Offsets and Credits
efficiencies is the most direct way
Renewable • Invest in renewable energy to displace to reduce GHG emissions, offsets
Energy Credits electricity generated from fossil fuels and credits are another method
(Figure 9). Purchasing an offset or
Methane • Capture and combust methane from
Reduction Credits landfills and farm animals renewable energy credit (REC)
consists of investing in a GHG
Forestry and Land- • Prevent deforestation and promote reduction project that someone
Use Change Projects soil management
else will perform. These tools were
established under the Kyoto
Protocol as a way for companies to “pay to pollute” if they were unable to meet the legally binding
requirements of a cap-and-trade program such as Europe’s Emissions Trading Scheme. GHG offset
projects will only be eligible for credits if they meet the criteria of the given program. One common
criterion is based on the principle of “additionality,” meaning it is reducing emissions beyond business as
9 Tesco, “Measuring Our Carbon Footprint,” http://www.tesco.com/climatechange/carbonFootprint.asp.
11C A R B O N F O O T P R I N T 1 0 1
usual. Independent certifications such as The Gold Standard ensure projects are third-party verified and
use “renewable energy and energy efficiency technologies that promise sustainable development for the
local community.”10 Information about RECs can also be found by consulting with state regulatory utility
commissions.11
OUTSIDE HELP: PARTNERSHIPS
Collecting data to track, measure and manage a GHG inventory can be difficult and time-intensive.
However, many government agencies, nonprofits and consultants have the expertise to help companies
develop a carbon management strategy. Two examples are discussed below.
For a comprehensive list of partnership organizations and resources, see the “Carbon Footprint Resource
List,” which can be downloaded free from the FMI website (www.fmi.org/sustainability/).
Government Partnerships: EPA Climate Leaders
The Climate Leaders Program is an EPA-sponsored Figure 10: EPA Climate Leaders Free Assistance
partnership through which companies develop and
execute a GHG Inventory Management Plan (IMP).12
Similar to EPA’s GreenChill Program (for refrigerant loss)
and ENERGY STAR Partnerships (for energy management),
60 Hours of Free Assistance:
Climate Leaders is free to join and includes 60 hours of free • Identify data needed for inventory
technical assistance.13 • Define operational and
organizational boundaries
An EPA Climate Leaders partnership is an easy way to • Conduct baseline year inventory
establish credibility for GHG reduction actions and receive • Set a long-term reduction goal
free publicity through the EPA’s frequent marketing of
partner success stories in press releases and case studies. Emissions are reported annually to the EPA using
a free Microsoft Excel-based calculation tool, which is available at the EPA Climate Leaders website.14
Environmental Organization Partnerships: World Wildlife Fund Climate Savers
The World Wildlife Fund’s Climate Savers program partners with large corporations to develop industry-
leading absolute emissions reduction goals.15 Experts will work with a corporation to develop an inventory
plan, identify energy-saving (and carbon-cutting) investments and activities and measure progress toward
ambitious goals.
Collectively, Climate Savers partners cut 14 million MT of CO2-e annually, the equivalent of removing
2.5 million cars from the road.16
10 The Gold Standard Foundation. “Frequently Asked Questions”. http://www.cdmgoldstandard.org/faqs.php
11 Links to state commission websites are on the “State Commissions” page of the National Association of Regulatory Utility Commissioners site,
http://www.naruc.org/commissions.cfm. Click on the state on the U.S. map.
12 For Climate Leaders Program Guide with detailed information, see EPA, “A Program Guide for Climate Leaders,” March 2007,
www.epa.gov/stateply/documents/cl_programguide_508.pdf.
13 Comprehensive list of technical resources can be found at EPA, “Climate Leaders: Technical Resources.” December 2008.
www.epa.gov/stateply/resources/index.html.
14 This calculator is available for free download at: EPA. “Climate Leaders: Climate Change Management Tools for Low Emitters.”
www.epa.gov/stateply/resources/lowemitters.html.
15 WWF. “Climate Savers – Mobilizing Companies to cut carbon dioxide.” http://www.worldwildlife.org/climatesavers.
16 Ibid.
12SECTION 2: C A R B O N F O O T P R I N T 1 0 1
Industry Benchmarking and
Snapshot
ESTABLISHING A BASELINE YEAR
baseline year provides a snapshot in time of a company’s energy usage and is used as the
A standard against which future progress is measured. The baseline year should be the earliest
year in which Scope 1 and Scope 2 emissions were reliably measured.
Ideally, a baseline year will be at least three to five years in the past so you can:
• Show how significantly your annual emissions have historically been increasing or decreasing.
• Analyze how past performance will help you set aggressive but achievable reduction goals.
• Use past energy efficiency investments as a barometer for understanding how future investments will
impact progress toward established goals.
REDUCTION GOALS: ABSOLUTE VS. RELATIVE EMISSIONS
Reduction goals can fall into one of two categories: absolute or relative (intensity-based). The proper
method for a company will depend on the nature of its emissions strategy and goals. For example, retailers
that want to communicate their emissions reductions to consumers may prefer the absolute method, while
companies that want to compare locations with one another may prefer the relative method. The key
characteristics of each method are summarized below:17
Table 2: Absolute vs. Relative Emissions Reduction Goals
Absolute Relative (Intensity Based)
Definition Reduce absolute annual emissions Reduce ratio of annual emissions relative to a
from a baseline year. business metric from a baseline year.
Process to Calculate all emissions for all sites Start with absolute emissions and then divide by
Determine within your boundary for a baseline a normalizing factor such as the total square
year and all subsequent years. feet of all operations.
Measurement Metric Tons of CO2-e (MT CO2-e). Metric Tons of CO2-e per square foot.
Unit
Advantages Goals and reductions made are Emissions can be compared among locations
easier to communicate to and against competitors to measure energy use
consumers and media. efficiency.
Challenges More challenging to achieve since Purchasing new locations that were historically
baseline year is not adjusted for high emitters will immediately increase
growth or new construction. emissions intensity for that year.
17 For a more comprehensive explanation of the advantages and disadvantages of absolute versus relative emissions, see the following article: EPA, “Comparing
Absolute and Intensity Targets,” www.epa.gov/stateply/resources/comparing.html.
13C A R B O N F O O T P R I N T 1 0 1
REDUCTION GOALS: RETAILER EXAMPLES
The majority of food retailers have not formulated concrete goals, and many are still in the early stages of
conducting a baseline inventory. Below are some examples of published benchmarks (Table 3).18
Industry Goal-Setting Benchmarks Table 3: Retailer Reduction Goals
The following are examples of benchmarks
Reduction Goal
for some individual retailers who have
published them. Best Buy 8% per square foot from 2005 to 2012
In addition, Giant Eagle, Publix Super Gap 11% per square foot from 2003 to 2008
Markets, Target and Whole Foods are Safeway 6% absolute from 2000 to 2011
working with EPA Climate Leaders to
Staples 7% absolute from 2001 to 2010
measure their carbon emissions and develop a
Tesco 50% absolute from 2006 to 2020
reduction goal. Under the EPA Climate
Leaders program, a typical goal is usually a 1 Tetra Pak 10% absolute over the next 5 years
percent to 1.5 percent per year reduction for Wal-Mart 20% absolute from 2005 to 2012
five consecutive years and an aggressive goal
might be a 2 percent per year reduction for 5-
10 years. The EPA works directly with retailers to set either an absolute or relative goal that is specific to
their operations and starting level of efficiency.
As with all organizations that are seeking change, goals should be aggressive but realistic. Aggressive
stretch goals motivate better than weak ones, and greater operational efficiencies may lead to bigger
bottom-line savings. Since every company starts at its own level of energy-intensity efficiency, its goals
will be unique. Third-party assistance can be very helpful in setting the right.
MINI CASE STUDY:
TESCO’S AGGRESSIVE
GHG-REDUCTION GOALS 19 Table 4: Tesco Emissions Reduction Goals
Tesco has been a forerunner of retailer Existing Building Decrease by 5% in 2009
Emissions (from 2008)
sustainability efforts. The company’s GHG
reduction goals are among the most Fleet Emissions Decrease by 10% in 2009
aggressive in the industry. In response to (per case delivered) (from 2008)
inquiries from the Carbon Disclosure All Buildings and Decrease by 50% by 2020
Project, an independent nonprofit Fleet Emissions (from 2006 baseline)
organization that requests emissions Energy Use Decrease by 50% by 2010
(per square foot) (from 2006 baseline)
18 These goals have been compiled from the following sources:
EPA, “Climate Leaders Partners,” www.epa.gov/stateply/partners/index.html; Doug Cogan, et. al., “Corporate Governance and Climate Change: Consumer and
Technology Companies.” Ceres, Inc., December, 2008, www.ceres.org/Document.Doc?id=398; WWF. “Climate Savers-Mobilizing Companies to Cut Carbon
Dioxide,” www.worldwildlife.org/climatesavers. We recommend that you check the sources directly for more information on these goals, how they were determined
and the steps the companies intend to use to achieve them.
19 Carbon Disclosure Project 2008, “CDP6 Greenhouse Gas Emissions Questionnaire – Tesco,”
www.cdproject.net/responses/public/Tesco_9107_Corporate_GHG_Emissions_Response_CDP6_2008.asp.
14C A R B O N F O O T P R I N T 1 0 1
information for public disclosure, Tesco explained its short- and long-term goals (Table 4). Tesco’s goal of
a 50 percent emissions reduction by 2010 is unusual and may be the most aggressive publicly disclosed
goal in the retail food industry.
In addition, the Carbon Disclosure Project reports Tesco has committed more than £650 million20 over
the next five years for energy efficiency projects, a Sustainable Technology Fund to promote wind and
biomass energy development and the Sustainable Consumption Institute at Manchester University to
accelerate research promoting a low-carbon society.
MINI CASE STUDY: SAFEWAY AND THE CHICAGO CLIMATE EXCHANGE
Figure 12: Safeway and the CCX Safeway is the first retailer to join the Chicago Climate
Exchange (CCE) (Figure 12). As a CCE member, Safeway
has agreed to reduce its greenhouse gas emissions by 6
percent from its year 2000 baseline emissions, by the year
To achieve its emissions goal, 2011, which will mean a reduction of an estimated 390,000
Safeway:
tons of CO2 per year (equivalent to the emissions from the
• Became California’s largest
corporate wind energy buyer electricity used by almost 47,000 US homes in one year).21 If
• Implemented LED and high- Safeway does not reach its target goals each year, it will
efficiency lighting purchase GHG emissions offsets or credits to make up the
• Installed no-heat freeze case doors
difference.22
PROVIDING THE RIGHT INCENTIVES TO THE TEAM
Some firms have been able to reduce their carbon footprint by giving employees incentives to reduce
carbon emissions for the benefit of the company.
The Carbon Disclosure Project’s 2008 Report found that nearly 29 percent of S&P 500 survey
respondents “have begun building environmental responsibility and climate awareness into executive
incentives.”23 These companies cite economic savings (via improved efficiency), investor risk disclosure,
product differentiation and pending legislation as their key motivations for linking GHG emissions with
executive compensation.
Panasonic: The Top Down Approach
Panasonic has implemented an “environmental performance system,”
which relies on a mix of GHG emissions, sales volume and cost controls to determine management pay
and bonuses. Linking compensation to carbon emissions at more than 297 manufacturing sites is part of
the company’s goal to reduce annual greenhouse gas emissions by 50 percent between now and 2050.24
20 The equivalent of $970 million, using the currency conversion rate on April 16, 2009.
21 EPA, “Clean Energy: Greenhouse Gas Equivalencies Calculator,” www.epa.gov/cleanenergy/energy-resources/calculator.html.
22 CSR Wire, “Safeway Leads Retail Sector in Fighting Greenhouse Gas Emissions,” www.csrwire.com/News/7341.html.
23 Anne Moore Odell, “Executive Bonuses for Making the CO2 Cut,” ClimateBiz. December 2008, www.climatebiz.com/feature/2008/12/11/executive-bonuses-
those-who-make-co2-cut
24 Associated Press. “Emissions goals to determine Panasonic managers’ pay.” The Japan Times Online. http://search.japantimes.co.jp/cgi-bin/nb20081213a5.html.
15C A R B O N F O O T P R I N T 1 0 1
Walmart: The Bottom Up Approach
Walmart’s Personal Sustainability Project (PSP) initiative is a voluntary
initiative that provides training and encouragement for all associates to
integrate sustainability into their personal lives and communities.25 Associates
develop personal goals and work as a group to monitor progress. To show the benefits of engaging
associates in sustainability and energy-efficiency programs, Walmart literature cites the following story:
Darryl Meyers, from Burlington, NC, noticed that the vending machines in the breakrooms glowed with
lights around the clock. He suggested to Walmart’s energy division that those lights be removed to reduce
energy consumption. Darryl not only made a suggestion that was good for the environment, but his idea
also helped the company save nearly $1 million in electricity bills every year.26
That reduction of more than 10,800,000 kWh per year is the equivalent of 7,685 metric tons of CO2—
the same impact as planting 197,000 trees and letting them grow for 10 years.27
25 Walmart, “The Personal Sustainability Project.” http://walmartfacts.com/reports/2006/sustainability/associatesPersonal.html.
26 Walmart, “Walmart Associates Develop Personal Sustainability Projects,” www.walmartstores.com/download/2254.pdf.
27 Based on EPA Estimates, “Clean Energy: Greenhouse Gas Equivalencies Calculator,” www.epa.gov/cleanenergy/energy-resources/calculator.html.
16SECTION 3: C A R B O N F O O T P R I N T 1 0 1
Legislative and Regulatory
Approaches to Controlling
Greenhouse Gas Emissions
INTRODUCTION
Over the past three decades, concerns about the potential role greenhouse gas emissions (GHG) may play
in climate change and their overall impact on the environment have moved beyond the scientific
community where they originated and into the larger public arena. The discussion surrounding this issue
has evolved to include the media, governments, NGOs, businesses and the public-at-large.28 It seems
unlikely that this attention will fade any time soon.
Many industries (including the supermarket industry) have proactively engaged in this debate and worked
to reduce their overall footprint for both competitive and public interest reasons. But even as these efforts
have won praise, legislators and regulators have stepped-up their involvement in the issue and begun to
push for a more centralized effort to reduce the overall level of emissions on a national basis.29 This pushes
the debate surrounding the impact of carbon footprints permanently out of the realm of company-level
competitiveness into the arena of public policy. The potential impact of a significantly expanded
government role in regulating what are, in many cases, the unavoidable byproducts of business operations,
significantly changes the complexion of efforts at emission reductions and holds the opportunity for fresh
pitfalls and opportunities. Within this new paradigm, understanding and accurately calculating a carbon
footprint takes on a new importance.
LEGISLATIVE LIMITS ON GREENHOUSE GAS EMISSIONS IN THE
UNITED STATES 30
The United States Congress has passed a number of pieces of legislation over the years to help reduce air
pollution and to promote the development of new technologies. The Clean Air Act of 1963 was the first piece
of national legislation to provide for comprehensive controls on air pollution. Congress followed up seven
years later with the Clean Air Act of 1970, which “authorized the development of comprehensive federal and
state regulations to limit emissions from both stationary (industrial) sources and mobile sources.”31
By the late 1970s, Congress had begun to explicitly address the role of carbon and other greenhouse gases in
global warming. The National Climate Program Act of 1978 was the first serious attempt to wrestle with the
impact of climate change and it directed the Department of Commerce to conduct “assessments of the effect
of climate change on the natural environment, agricultural production, energy supply and demand, land and
28 An interesting examination of this increasing public sector awareness of climate change can be found in Rabe, Barry G. 2004. Statehouse and Greenhouse: The
Emerging Politics of American Climate Change Policy. Washington, D.C.: Brookings.
29 These efforts actually date as far back as 1970, with the passage of the Clean Air Act. See the Environmental Protection Agency’s “History of the Clean Air Act” at
http://www.epa.gov/air/caa/caa_history.html.
30 For up-to-the-minute updates of environmental and carbon related legislation, please visit the FMI website at www.fmi.org.
31 See “History of the Clean Air Act”.
17C A R B O N F O O T P R I N T 1 0 1
water resources, transportation, human health and national security.”32 This was followed by a host of other
pieces of legislation including the Global Climate Protection Act of 1987 and the Global Change Research
Act of 1990. Each of these laws are landmark pieces of legislation that have been periodically updated over the
years33, but critics argue that they have failed to keep up with the state of climate science and the changing
structure of the U.S. economy. Many legislators seem inclined to agree and want to move beyond the current
regulatory structure’s focus on overall pollution, increased efficiency and voluntary programs to limit directly
and comprehensively the amount of GHGs released by the United States every year. Senator Joseph
Lieberman (ID-CT) summed up this new legislative determination in a 2005 op-ed:
Consider the costs and consequences of inaction, for they will ruin the economy with a far more destructive
certainty than any greenhouse-gas control programme ever could…Our nation and, indeed, our planet cannot
wait for us to stumble toward an answer. The consequences and costs of inaction are too great. We know there
is a long and menacing shadow marching toward our shores – toward our cities and towns. But we know that
if we act now, global warming is not a conqueror to be feared – but a challenge to be met.34
As the debate about limiting GHGs has evolved from if to how, myriad proposals for the best means of
achieving this goal have been put forward. Over the past decade, it has hardened into a focus on two very
distinct approaches:
• A cap and trade system;
• A carbon tax.
Cap-and-Trade
A cap and trade approach to restricting GHGs is based on several other successful programs run by the
EPA, including the acid rain reduction program.35 It begins with the U.S. government placing a firm limit
(“the cap”) on the amount of greenhouse gases that may be emitted by all US-based entities. While in
theory this cap could extend from the largest industrial emitters all the way down to individuals, in
practice, most proposals have taken a “trickle down” approach that focuses on large upstream emitters like
power generators and heavy manufacturing.
Once the cap has been set, the remaining amount of GHGs that may be emitted in a given year are
monetized into tradable credits (i.e. 1 mt of CO2e = 1 credit). These credits can than be auctioned off or
distributed to the regulated industry sectors (or a combination of both). Each regulated business is
responsible for accumulating credits equal to its total emissions. Companies that are able to reduce their
emissions below current levels are able to either save money (by not having to purchase additional
auctioned credits) or in some cases make money (companies can sell off extra credits in a carbon credit
market).
32 John C. Dernbach, “U.S. Policy”, Global Climate Change and U.S. Law, American Bar Association, pp. 75.
33 The last significant update to the Clean Air Act was in 1990, though there have been other pieces of energy and environment-related legislation that impact on the
Clean Air Act.
34 Senator Joseph Lieberman, “No Procrastination on Climate Change,” Our Planet, February 25, 2005. Available at
http://www.unep.org/ourplanet/imgversn/154/lieberman.html.
35 See the EPA’s Cap and Trade homepage at http://www.epa.gov/captrade/index.html.
18C A R B O N F O O T P R I N T 1 0 1
The government ratchets the cap downward on an annual basis, reducing the amount of emissions and
making the act of emitting more expensive. This creates incentives to lower overall emission levels.
Proponents of cap and trade often focus on the fact that it uses a market-based structure to create the
“right” price for emissions, instead of an arbitrary figure set by Congress or a regulatory agency.36 Critics
have countered that it also creates the possibility for wildly fluctuating prices and even market
manipulation.37
A Carbon Tax
Congress has also, at times, considered pursuing a carbon tax as a possible means of regulating greenhouse
gas emissions. A carbon tax is a direct tax placed at the point where the emissions are put into the stream
of commerce, so large-scale emitters, like power generators, bear the brunt of the impact.38 In most
legislative proposals, the tax is placed directly on emissions on a “per pound” basis.
Again, the goal of this proposal is to find the “right price” for carbon emissions – i.e., one that takes into
account not only the cost of generating them but also their long-term downstream impact on the
environment and public health. A number of economists have cited it as the most direct and efficient
means of reducing emissions, and one that easily builds upon existing structures for collecting revenues.
Critics of the tax have countered that it does not necessarily reduce overall emissions levels – companies
hit by the tax can merely pass on added costs to consumers without having to undertake any serious
efficiency measures. Ultimately, for a carbon tax to be successful, the rate of the tax needs to be set high
enough that passing it through will impact consumers to the point that they use less energy and thus have
the net effect of reducing consumption.39 Whether Americans would ultimately accept a tax being
imposed at the necessary levels remains at the center of the debate surrounding a carbon tax.
Regulatory Efforts at Controlling Emissions
The existing statutes (discussed above) were written before the impact of greenhouse gases on the
environment was fully understood, consequently, EPA has limited authority to regulate the use and
emission of these substances. Nonetheless, the Supreme Court recently interpreted a provision of the
Clean Air Act to require EPA to determine the impact of GHGs on climate change and public health,
thereby setting the regulatory table for EPA regulation of GHG emissions from motor vehicles. In
addition, this year EPA proposed to establish GHG reporting and recordkeeping obligations on heavy
GHG emitters. Even the most aggressive interpretation of existing legislative authorities, however, will
not permit EPA to establish the type of comprehensive regulation of GHGs that is envisioned under
pending legislation.
Regulatory agencies like the EPA and Department of Energy, in addition to implementing and enforcing
Congress’ legislative approach to emissions, have also been active in promoting awareness of climate
change and ways to combat it. Joint industry-government projects, such as the Energy Star program, are
focused on reducing energy use through increasing the efficiency of homes and businesses. With roots
36 See, e.g., Pew Center on Global Climate Change and the Pew Center on the States, Climate Change 101: Understanding and Responding to Global Climate
Change 2008. Available at http://www.pewclimate.org/docUploads/Cap-Trade-101-02-2008.pdf.
37 Ben Stein, “The Dangers of Cap and Trade,” The New York Times, February 21, 2009. Available at http://www.nytimes.com/2009/02/22/business/22every.html.
38 See the Carbon Tax Center’s “What is a Carbon Tax?” available at http://www.carbontax.org/introduction/#what for more information.
39 World Resources Institute, “The Bottom Line on Carbon Taxes,” June 2008. Available at http://pdf.wri.org/bottom_line_carbon_taxes.pdf.
19C A R B O N F O O T P R I N T 1 0 1
reaching all the way back to 1992, over 4,100 commercial facilities and manufacturing plants now bear the
Energy Star label, and it is widely considered one of the most successful voluntary programs in place
today.40
In addition to emissions themselves, the federal government also regulates the claims that businesses can
make about their emissions. In particular, the Federal Trade Commission Act prohibits unfair or deceptive
trade practices. “Green” claims, including claims regarding carbon offsets and marketing energy
certificates RECs, must be crafted carefully to ensure that they are not false or misleading and that they
are adequately substantiated. The FTC is conducting ongoing proceedings to determine the acceptable
basis and scope of “green” claims in the GHG emissions context.
STATE AND LOCAL EFFORTS
Despite the federal government’s legislative and regulatory actions on the issue of greenhouse gases, states
have often been frustrated by what they perceive as inadequate efforts. A number of them have responded
by taking on an active role in combating greenhouse gas emissions and developing plans to lower their
overall carbon footprints. For example, in 2006, California passed the Global Warming Solutions Act
which sets a goal of returning overall state emissions to 1990 levels by 2020 (a 25 percent overall
reduction).41
States have also formed regional initiatives that operate as mini-cap and trade zones. The three largest of
these – the Regional Greenhouse Gas Initiative, the Midwestern Regional GHG Reduction Accord and
the Western Climate Initiative – collectively cover more than half the population of the U.S. and Canada.
All of them set ambitious GHG reduction goals and several follow a cap and trade model complete with
enforcement provisions.42
But even states that have decided to forego hard targets have taken action to begin mitigating the impact
of GHGs. In 1999, Tennessee published an extensive policy proposal that laid out a series of steps ranging
from conservation to telecommuting.43
Taken in combination, laws and regulations at the federal, state and regional level have already begun to
impact the business conditions faced by our industry every day. As noted at the beginning of this section,
food retailers have a history of engaging on this issue and working aggressively to reduce their carbon
footprint. But it is clear that the government is going to play a more active role in this area and that a new
round of regulation is on the way. Under the new restrictions that are likely to emerge, past successes will
need to be augmented by new and sometimes costly efficiency and mitigation regimes. The first step to
moving forward is knowing where your company stands now. Capturing a broad-based and accurate
carbon footprint on a company-wide basis can be an important tool in making this evaluation.
40 For more information on the program visit http://www.energystar.gov/.
41 A summary of the bill can be found at http://gov.ca.gov/press-release/4111/.
42 Alan Durning, “Cap and Trade 101: A Climate Policy Primer,” Sightline Institute, September 2008, http://www.climatebiz.com/files/document/Cap-
Trade_online.pdf.
43 “Tennessee Greenhouse Gas Emissions: Mitigation Strategies,” April 1999. Available at http://www.tennessee.gov/ecd/pdf/greenhouse/entiredocument.pdf.
20C A R B O N F O O T P R I N T 1 0 1
VOLUNTARY AND PRIVATE PROGRAMS
Forward-thinking organizations and businesses are also taking steps to remain competitive in the future
low-carbon economy. Two such efforts are highlighted below
Chicago Climate Exchange44
The Chicago Climate Exchange (CCX) is the only cap-and-trade program covering all of North
America. Its 350 members include municipalities, corporations, universities and other organizations.
Membership is voluntary, but once an entity joins, it commits to a legally binding agreement to reduce
GHG emissions below absolute annual targets. Each year, emissions are third party-verified by the
Financial Industry Regulatory Authority (FINRA), and entities that emit less than their targets can sell
excess allowances.
U.S. Climate Action Partnership (USCAP)
Made up of an alliance between BP, DuPont, GE, Johnson & Johnson, PepsiCo, other major businesses
and environmental advocacy groups, the U.S. Climate Action Partnership (USCAP) is lobbying the
federal government for national GHG cap-and-trade legislation. USCAP asserts such actions “will create
more economic opportunities than risks for the U.S. economy” and advocates an 80 percent GHG
reduction by 2050.45
44 Chicago Climate Exchange, “Overview,” www.chicagoclimatex.com/content.jsf?id=821.
45 US Climate Action Partnership. “A Call For Action.” www.us-cap.org/about/report.asp.
21APPENDIX C A R B O N F O O T P R I N T 1 0 1
Grocery Retailer Case Studies
he following case studies are adapted from partnership
T reports by Clean Air-Cool Planet (CA-CP), a New
Hampshire-based nonprofit dedicated to “developing
economically efficient and innovative climate policies and
mobilizing civic engagement to implement practical climate solutions.”46 These reports explain how
Shaw’s Supermarkets and The Stop & Shop Supermarket Company improved operational efficiencies and
received positive publicity for forming greenhouse gas reduction partnerships with CA-CP.
CASE STUDY: SHAW’S SUPERMARKETS 47
This New England retailer has made significant advancements in
reducing its carbon footprint over the last decade. The company
started small and formulated a plan to scale up to companywide
Computerized Energy Monitoring and Lighting Retrofits.
Computerized Energy Monitoring
Shaw’s began by simply monitoring monthly energy bills. This simple practice allowed the firm to collect
historical data and develop a plan. Next, Shaw’s installed sub-metering equipment to collect data daily on
multiple circuits on a per-store basis. The system monitored electrical use by tracking multiple variables in
conjunction with consumption (for example, historical data, retail volume by day and weather tracking).
Ultimately, the system sent an alert if utility use jumped outside of an average defined level. This allowed
management to diagnose the problem and decide whether the problem could be remedied by software or
required a maintenance call.
Lighting Retrofit
Shaw’s recognized the tremendous opportunity for improvement in lighting usage. First, they replaced
existing lighting fixtures with T-8 lamps and electronic ballasts in aisles where lighting could be dimmed when
foot traffic decreased. Second, Shaw’s installed lighting retrofits in cooler units and found that the lamps used
less electricity and generated less heat than previous equipment, which reduced cooling energy costs.
Results
The CA-CP web site does not provide estimates for the costs associated with these initiatives but CA-CP
estimates that the two initiatives will save approximately 43 million kWh of electricity per year across all
of their stores.
46 Fore more information about this organization, see Clean Air-Cool Planet “About CA-CP,” www.cleanair-coolplanet.org/about/.
47 Clean Air-Cool Planet, “Shaw’s Supermarkets: A Comprehensive Environmental Commitment,” www.cleanair-coolplanet.org/information/pdf/shaws-
supermarkets.pdf.
22C A R B O N F O O T P R I N T 1 0 1
Key Finding
Start small and operate within your means, but be ambitious. Formulating a plan and getting senior-
management buy-in are keys for success. To facilitate its efforts, Shaw’s hired an energy & environmental
manager, a new position that bridged gaps between real estate, store operations and merchandising while
working closely with equipment vendors to request more efficient lighting, compressors and coolers. As a
result, a simple practice of monitoring monthly bills evolved into a corporatewide initiative with a
significant bottom-line impact.
CASE STUDY: THE STOP & SHOP SUPERMARKET COMPANY 48
Stop & Shop’s “All In” plan demonstrated a significant commitment to
push the industry forward. Through a LESS (Low Energy Super Stores)
construction and building strategy, Stop & Shop saw tremendous results
and highlighted a promising future in eco-friendly building design.
Low-Energy Superstore
Stop & Shop’s efforts started with a cross-functional team composed of members representing
management, construction, design and operations. The team formulated an action plan and focused on
three main areas
• Indoor Environment / Air Quality
• Energy Conservation / Efficiency
• Waste Reduction / Minimized Damage to the Natural Environment
After modeling small prototypes in a vacant building to demonstrate proof-of-concept to key
stakeholders, the team executed its strategy in 2001 with the opening of the industry-leading Foxboro,
Massachusetts location. The site featurs light tubes, solar panels, fuel cells, expansive sky lights and
building materials made of high recycled content. The refrigeration practices are designed to the needs of
individual products. For example, cold cases used energy-saving doors, anti-sweat heaters and efficient
lighting practices.
Results
Stop & Shop estimates that the Foxboro store cost an additional $500,000 to built but it will use 27
percent less electricity (saving 800,000 kWh per year) compared with a traditional location
Key Finding
Stop & Shop believes that its cross-functional team — which conducted extensive planning and modeled
new technologies to key stakeholders to show proof-of-concept — was the key to this initiative’s success.
The company realized it could move the entire industry forward, and the group could devote the
necessary attention and resources for the project.
48 Clean Air-Cool Planet, “Stop & Shop Supermarkets – LESS is more…,” www.cleanair-coolplanet.org/information/pdf/StopShop.pdf.
23You can also read