The White House and the Kyoto Protocol: Double Standards on Uncertainties and Their Consequences
←
→
Page content transcription
If your browser does not render page correctly, please read the page content below
The White House and the Kyoto
                      Protocol: Double Standards on
                         Uncertainties and Their
                              Consequences
                           Philippe Tulkens and Henry Tulkens

                             NOTA DI LAVORO 89.2006

                                         JUNE 2006
                    CCMP – Climate Change Modelling and Policy

                 Philippe Tulkens, TERI School of Advanced Studies
               Henry Tulkens, CORE, Université Catholique de Louvain

                        This paper can be downloaded without charge at:

                 The Fondazione Eni Enrico Mattei Note di Lavoro Series Index:
                 http://www.feem.it/Feem/Pub/Publications/WPapers/default.htm

                  Social Science Research Network Electronic Paper Collection:
                               http://ssrn.com/abstract=910811

  The opinions expressed in this paper do not necessarily reflect the position of
                        Fondazione Eni Enrico Mattei
Corso Magenta, 63, 20123 Milano (I), web site: www.feem.it, e-mail: working.papers@feem.it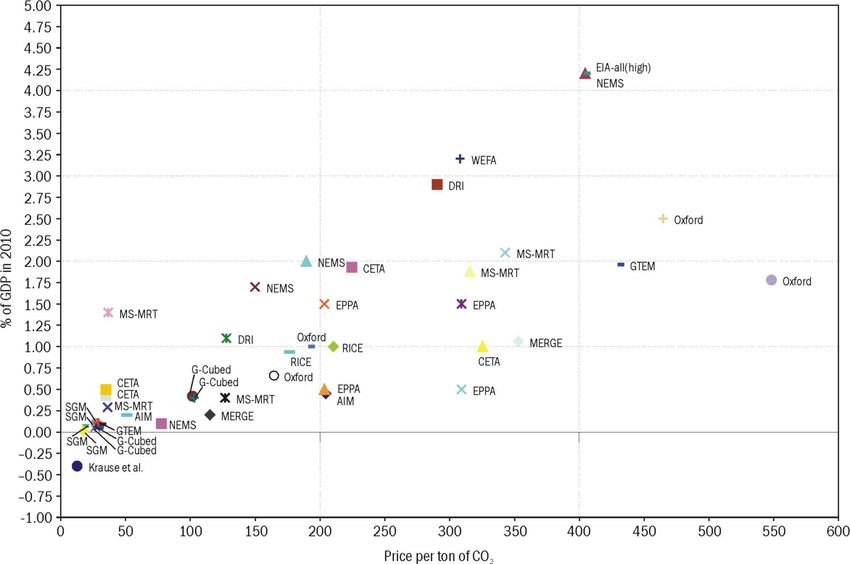
The White House and the Kyoto Protocol: Double Standards on
Uncertainties and Their Consequences

Summary
This paper compares the level of uncertainty widely reported in climate change
scientific publications with the level of uncertainty of the costs estimates of
implementing the Kyoto Protocol in the United States. It argues that these two
categories of uncertainties were used and ignored, respectively, in the policy making
process in the US so as to challenge the scientific basis on the one hand and on the other
hand to assert that reducing emissions would hurt the economy by an amount stated
without any qualification. The paper reviews the range of costs estimates published
since 1998 on implementing the Kyoto Protocol in the US. It comments on the
significance of these cost estimates and identifies a decreasing trend in the successive
estimates. This implies that initially some of the most influential economic model-based
assessments seem to have overestimated the costs, an overestimation that may have
played a significant role in the US decision to withdraw from the Protocol. The paper
concludes with advocating that future economic estimates always include uncertainty
ranges, so as to be in line with a basic transparency practice prevailing in climate
science.

Keywords: United States, Kyoto Protocol, Cost Estimates, Uncertainties

JEL Classification: Q5, Q54, Q58, C82

This paper is also circulated as Environmental Economics and Management
Memorandum # 47, Chaire Lhoist Berghmans, CORE, Université catholique de
Louvain, Belgium.

The authors thank Vincent van Steenberghe and Thierry Bréchet for valuable comments
on an early draft of this paper and Stephen J. DeCanio and Saon Ray for relevant
references.

Addresses for correspondence:

Philippe Tulkens
TERI School of Advanced Studies
New Delhi
India
E-mail: philippe@teri.res.in
Tulkens & Tulkens,                                                                                 2
The White House and the Kyoto Protocol: Double standards on uncertainties and their consequences

 “The Kyoto treaty would have wrecked our economy, if I can be blunt.”
George W. Bush, President of the United States,
interview to ITV, July 4, 2005
                                    “Many people have falsely assumed that you have to choose between
                              protecting the environment and protecting the economy. Nothing could be
                                      farther from the truth. In California, we will do both. (…) Pollution
                              reduction has long been a money saver for businesses. It lowers operating
                           costs, raises profits and creates new and expanded markets for environmental
                                                                                               technology.”
                                                        Arnold Schwarzenegger, Governor of California,
                                                                             The Independent, July 3, 2005

1. Introduction and Plan of the Paper

    On the eve of the 2005 G-8 Summit in Gleneagles, the President G.W Bush seems to have
admitted - 13 years after his father, who signed and got ratified the United Nations
Framework Convention on Climate change (UNFCCC) - that the scientific basis of climate
change was sound and that it is time for some action. Besides downplaying scientific
assessments during five years on grounds of remaining large uncertainties, the US federal
administration hampered the political process towards the Kyoto Protocol ratification on
grounds of economic analysis results. The rationale behind the US stance can be summarized
as follows:

    1) Developing countries are not assigned targets in the Kyoto Protocol; this puts the US
         economy at a disadvantage as compared to competitors from developing countries,
         especially China, India and Brazil.
    2) The domestic economic impact of implementing, by 2012, the 7% reduction of
         emissions relative to 1990 emission level required by the Kyoto Protocol is too costly
         for the US economy.

Notwithstanding the rationale for the exemption given to developing countries at this stage of
the process2, it is surprising that those who argued for years that uncertainties about the
science of climate change were a good reason for delaying action did not refer to any
uncertainties that might conceivably affect the economic assessment underlying the above
mentioned positions.

2
 Explicit in the UNFCCC. See the principle of “common but differentiated responsibilities” in the Convention
and the principles of Art. 3.1 on leadership from developed countries.
Tulkens & Tulkens, 3
The White House and the Kyoto Protocol: Double standards on uncertainties and their consequences
This paper compares, in Sections 2 and 3, the orders of magnitude of these two kinds
of uncertainties: those dealt with in the scientific assessment of projected global temperature
change and those associated with the cost assessments of implementing the Kyoto Protocol in
the US. While such comparison deals with variables of totally different nature (global
temperature vs emissions reduction costs) and relating to different time scales (100 years vs
10 years, respectively) the comparison is nevertheless logically feasible, as we shall show. It
is also instructive if only to reiterate the importance of rendering explicit, in the policy
making process, the levels of uncertainty associated with model-based projections in both
climate physics and economics.
In Section 4, we discuss various aspects of the cost estimates of greenhouse gas emission
reductions, and offer some suggestions as to how the estimates should be communicated. In
Section 5, the paper reviews the published range, since 1998, of costs estimates of
implementing the Kyoto Protocol in the US. It identifies a trend showing that initially, the
economic model-based assessments have overestimated these costs and that such
overestimation played a significant role in the US decision to withdraw from the Protocol. In
section 6 we conclude with further suggesting that the cost of implementing the Kyoto
Protocol in the US be reassessed on the basis of updated models and data, and that the
associated uncertainties be made public.
2. The range of scientific uncertainties
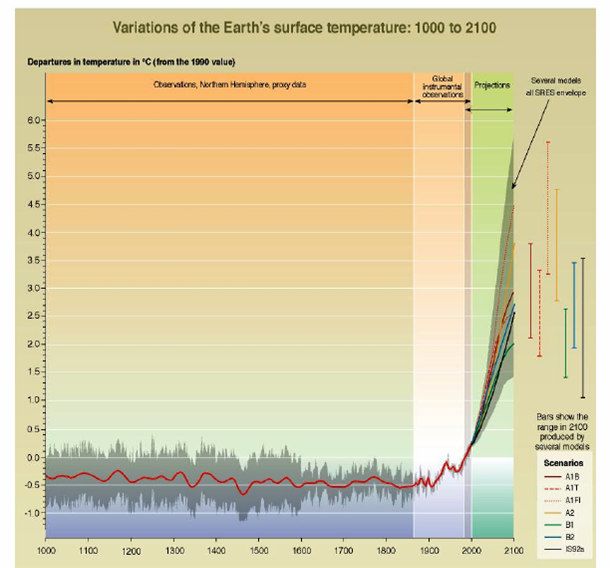
The IPCC Third Assessment Report (IPCC, 2001a) indicates that for an emission path
consistent with a stabilisation level of 550 parts per million (ppm) of carbon dioxide in the
atmosphere (B1 family of emission scenarios), the Earth global temperature rise in 2100
would be ranging from about 1.4°C to 2.6°C3 relative to 1961-1990 mean observations. For
emissions scenarios with larger emissions (A1FI family of scenario), the Report indicates
results that range from 3.3°C to 5.6°C4 (cfr. Figure 1 and Table 1). These estimates of
uncertainties on global temperature change illustrate differences in results obtained with
alternative climate models for given GHG concentrations.
3 IPCC-SYR, Figure SPM-10b, p.34. The figures given in IPCC, 2001, WG I Report, p. 70. figure 22 are slightly different (1.5°C to 3°C)
because the set of model used is not identical.
44 IPCC-SYR, Figure SPM-10b, p.34. The figures given in IPCC, 2001, WG I Report, p. 70. figure 22 are slightly different (3.5°C to 6.1°C)
because the set of model used is not identical.Tulkens & Tulkens, 4
The White House and the Kyoto Protocol: Double standards on uncertainties and their consequences
Figure 1: Simple climate model results. Global mean temperature projections for
the six illustrative SRES scenarios (IPCC, 2000) using a simple climate model
tuned to a number of complex models with a range of climate sensitivities. IS92a
results are taken from previous IPCC estimates (IPCC, 1995). The darker shading
represents the envelope of the full set of thirty five SRES scenarios using the
average model results. Source : IPCC, 2001a. IPCC-SYR, Figure SPM-10b, p.34.
When these model-based uncertainties are combined with the uncertainties on
emission scenarios, the range of simulated global temperature changes for all IPCC-SRES
(2000) scenarios is estimated to be from 1.5°C to 5.8°C5 for the year 2100. The IPCC (2001a)
report did not specify any likelihood considerations on these estimates. This range turned out
to revise the top-range value which was previously 3.5°C in IPCC Second Assessment
Report. Schneider (2001) and Reilly et al. (2001) argued that the absence of any probability
assignment would lead to confusion, as users select arbitrary scenarios or assume
equiprobability. As a remedy, Reilly et al. estimated that the 90% confidence limits were 1.1
to 4.5°C. Using different methods, Wigley and Raper (2001) found 1.7 to 4.9°C for this 1990
to 2100 warming.
5 IPCC, 2001, WG I Report, p. 527.Tulkens & Tulkens, 5
The White House and the Kyoto Protocol: Double standards on uncertainties and their consequences
Standard
Min Max Mean Coefficient of
deviation
(°C) (°C) (°C) variation
(°C)
Temperature change:
scenarios compatible with 550 ppm 1.4 2.6 2.0 0.85 42
CO2 stabilisation level
Temperature change:
scenarios compatible CO2 3.3 5.6 4.45 1.63 37
stabilisation level above 1000 ppm
Temperature change:
1.5 5.8 3.65 3.04 83
All scenarios SRES scenarios
Range estimated in Reilly et al.
1.1 4.5 2.8 2.40 86
(2001) with 90% confidence
Range estimated in Wigley and
1.7 4.9 3.3 2.26 69
Raper (2001)
All scenarios 1.1 5.8 3.45 3.32 96
Table 1: IPCC projected global average temperature change in 2100 relative to 1961-1990
observations and simple uncertainty estimation. The mean and standard deviations are computed from
the extreme Min and Max values mentioned. Therefore, they are somewhat overestimated in
comparison with uncertainty estimates that would be based on the full set of model outputs. Sources:
IPCC (2001), Reilly et al. (2001) and Wigley and Raper (2001).
In previous IPCC assessment reports, projections for global average temperature by
2100, have been estimated from 1°C to 5°C6 in the First Assessment Report (IPCC, 1990) and
from 1 to 3.5°C in the Second Assessment Report (IPCC, 1995). The publication of IPCC
Fourth Assessment report is due in 2007. On the basis of published model projections since
2001, the range of projected global temperature change should not differ much from the
estimates published in the Third Assessment Report.
3. The range of cost uncertainties
Assessments of the total annual cost of implementing the Kyoto Protocol in the US
range from US$ -63 billion to 508 billion in 20107. Figure 2 shows the total abatement cost
estimates of the Kyoto Protocol implementation in the USA. The extreme scenarios are
displayed with respect to trading flexibility and all scenarios meet the US Kyoto target. All
models show that emissions trading substantially reduces the overall cost of meeting the
Kyoto target. Cost estimates in scenarios without trading range from 41 to 508 billions US$,
whereas scenarios with trade estimates range from -63 to 241 billion US$. In terms of Gross
Domestic Product (GDP) loss relative to a business as usual projection, figures range from -
6The “business as usual” estimate projected is 3°C increase but the extreme BAU scenario reaches up to 5°C.
7 In this paper, costs estimates have been converted into US$ 2004 using GDP deflator from Williamson (2005).Tulkens & Tulkens, 6
The White House and the Kyoto Protocol: Double standards on uncertainties and their consequences
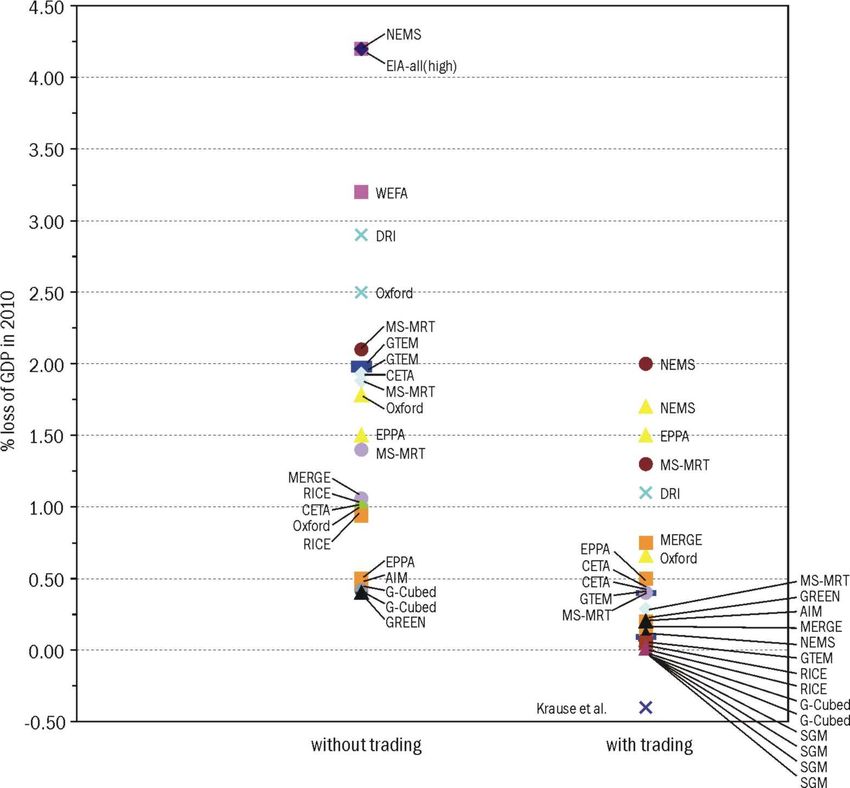
0.4% to 4.2% for the year 2010 (Figure 3). The price versus GDP impact of the Kyoto target
is shown in Figure 4. It reveals the dispersion of model based marginal abatement costs and
shows that for most models the estimate of the overall cost is below 2% of GDP. The US
President claimed in February 2002 that implementing the Protocol would cost US$ 400
billion (US$1992) and 4.9 millions jobs to the US economy by 2012 (Bush, 2002). However,
no indication was provided neither on the model and the relevant scenario that generated these
figures nor on the uncertainties attached to them.
Figure 2: Total abatement cost estimates of the Kyoto Protocol implementation
in the USA (billions of US $ 2004). For each model (listed on the abscissa),
black bars show cost estimates in scenarios without emission trading while grey
bars show estimates from scenarios with the widest trading accounted for in the
scenarios’ description. For some models, published estimates vary by the source
(as reported when several bars appear on the figure - details are given in the
source spreadsheet mentioned below) in spite of identical trading conditions.
All models show that emission trading substantially reduces the overall cost of
meeting the Kyoto target. Cost estimates in scenarios without trading range
from -63 to 508 billions US$, whereas scenarios with trading range from 1 to
241 billion US$. Sources: Data collected from Weyant and Hill (1999), IPCC
(2001b), EIA (1998), CEA (1998), Bush (2002), Lasky (2003), Krause et al
(2002) and authors’ calculations, as reported on a spreadsheet downloadable
from http://homepage.mac.com/ph.tulkens/Work/FileSharing20.html.Tulkens & Tulkens, 7
The White House and the Kyoto Protocol: Double standards on uncertainties and their consequences
Figure 3: Total abatement cost estimates of the Kyoto Protocol implementation in
the USA expressed in terms of GDP loss. As in the previous figure, the scenarios are
displayed in two categories: those with no trading and those with extreme trading
flexibility. All models show that emission trading substantially reduces the overall
cost of meeting the Kyoto target. Cost estimates in scenarios without trading range
from 0.4 to 4.2% of US GDP in 2010 whereas scenarios with trade estimates range
from - 0.4 to 2.0 % of US GDP in 2010. Sources: same as Figure 2
The uncertainties that are associated with these cost estimates for the year 2012 are of
course of a quite different nature from those affecting the projections of global temperatures
at the end of the 21st century. Therefore a comparison of these uncertainties formulated
directly in terms of the above figures would not be appropriate. However, the orders of
magnitude of the uncertainties (expressed in a relevant statistical form) in both types of
assessments can validly be compared. The aim is not to show that uncertainties on climate
variables are lower than on economic variables. The magnitude of the uncertainties depends
very much on which variables are chosen in the climate and in the economic models.Tulkens & Tulkens, 8
The White House and the Kyoto Protocol: Double standards on uncertainties and their consequences
Figure 4: Model estimates of permit price and percent loss of GDP in 2010 resulting
from implementing the Kyoto Protocol in the USA. Estimates from scenarios with trading
and without trading are shown. The figure shows that most of the model-based estimates indicate
an overall cost below 2% of GDP. Sources: same as for Figure 2
The uncertainty estimates are given in Tables 2 and 3 in terms of total cost and of
percentage of GDP loss respectively9. Accounting for the full set of projections available,
uncertainties on cost estimates of Kyoto emission reductions diverge by a factor of about 500
(and not all estimates show an economic loss) whereas trends in global temperature diverge
by a factor of about 4 (but all indicate a warming trend). Statistically speaking, the standard
deviation and the coefficient of variation10 indicate, in a normalised form, how large the
uncertainties are for each set of scenarios and for all scenarios taken together. Such results
showing very large uncertainties on costs estimates should encourage inquiry into and
communication on economic uncertainties in at least as much as is done for scientific
uncertainties.
9 The cost estimates for the USA depend on several factors explained in details in EIA (1998) and also commented in Lasky (2003), Barker
and Ekins (2004) and Fisher and Mogernstern (2005). The point here is not to describe the reason for uncertainties but just to evaluate the
level of uncertainty.
10
That is, the standard deviation divided by the mean and multiplied by 100.Tulkens & Tulkens, 9
The White House and the Kyoto Protocol: Double standards on uncertainties and their consequences
Table 2: Range and uncertainty of cost estimates for the year 2010 in billions of US
dollars of the Kyoto Protocol implementation in the USA
Total cost Standard Coefficient
Min Max Mean
(billions US$ 2004) deviation of
variation
Scenarios without trade 41 508 231 167 72
Scenarios with trade -63 241 76 88 116
All scenarios -63 508 146 153 105
Sources: see bottom of Figure 2
Lasky (2003) summarises the uncertainties on the cost of Kyoto in the USA to be in
the range of 0.5 to 1.2% of GDP in 2010. Based on the same set of model studies from the
Energy Modelling Forum (EMF-16), Fisher and Morgenstern (2005) estimate the
uncertainties to be of a factor of five or more. But our review of the literature gathering
scenarios with and scenarios without emission trading indicates a significantly wider range of
uncertainty (from -0.4 to 4.2% of GDP in 2012). Among the high cost estimates, it is a figure
in line with the highest estimate from the Energy Information Administration (EIA, 1998) that
has been used by the US President in his address. There is no reason to leave it out of the set
of estimates accounted for in an uncertainty analysis, just as estimates showing a negative cost
should not be excluded either.
Table 3: Range and uncertainty of GDP percent loss in 2010 for the Kyoto Protocol
implementation in the USA.
Total cost Standard Coefficient
Min Max Mean
(% of GDP loss deviation of
in 2010) variation
Scenarios without trade 0.4 4.2 1.75 1,14 65
Scenarios with trade -0.4 2.0 0.46 0.57 124
All scenarios -0.4 4.2 1.04 1,07 103
Sources: see bottom of Figure 2.
The $400 billion figure11 is significantly higher than the highest estimate on total cost
found in the peer-reviewed literature published in Weyant et al. (1999). Supposedly, the
figure derived from a particular scenario that did not take into account the substantial cost
lowering arising from emission trading and the implementation of the other flexibility
mechanisms agreed upon in the Kyoto Protocol. However, the Marrakech Accords had been
finalised since December 2001, in which extensive cost minimizing measures from global
11
This figure was taken from estimates in US$1992. It corresponds to 508 billion US$2004 using a GDP
deflator.Tulkens & Tulkens, 10
The White House and the Kyoto Protocol: Double standards on uncertainties and their consequences
trading had been adopted. All economic models available at the time showed significant cost
reduction (about 50%) in scenarios where emission trading had been accounted for. The
White House estimate of 2002, if made on the assumption that no trading would take place in
the Kyoto agreement, was derived from a basis that was no longer relevant12.
Theses misleading facts and figures show that a balanced approach in dealing with the
two uncertainties on the science and on the economics of the issue was not followed in the
White House communication about the Kyoto Protocol and the existence of anthropogenic
climate change. Costs estimates higher than estimates from academic studies and based on a
biased selection of scenarios were given to the public and the media, without any form of
qualification. This has likely contributed to the opinion-building favouring the rejection of the
Kyoto Protocol by the US.
4. Ambiguities in the presentation the cost estimates of greenhouse gas mitigation.
The President’s address does not specify whether the 400 billion US$ correspond to an
annual cost during the Kyoto first commitment period (2008-2012) or to the cumulative costs
to reach the target of minus 6% emissions relative to 1990 levels. Considering that the US
GDP increases currently by about 300 billion US$ per year, Kyoto looks indeed as a potential
threat to the economy that would even bring the US to a negative growth! Recently however,
in their detailed look at the Energy Information Administration report (EIA, 1998), Barker
and Ekins (2004) just quoted also reveal that in the scenario computed by the EIA, the
emissions cut to reach the Kyoto target is assumed to be implemented over the four years
2005-2008 only, without emission trading and with a high baseline growth of CO2 emissions
from 1990 to 2005. Under these conditions, which are far from corresponding to the final
Kyoto agreement, it is not surprising that a high cost estimate was produced.
But is this the right way to interpret the figures? The same Energy Information
Administration (EIA, 1998 p. xii, table ES5) reports that implementing Kyoto in the US
12
According to Baker and Ekins (2004), “the highest costs in the EIA study [that inspired the President speech in
2002] come from the worst-case assumption of a 6% cut in CO2 emissions below 1990 levels by 2010”.
Moreover, the same authors note that “this result was not intended by the authors of the EIA report to be seen as
the outcome of the proposed legal commitment of the Kyoto Protocol, which allows for multiple gases and
flexible mechanisms, including international permit trading. It was intended to be a standardized scenario to be
compared with the results of other modeling exercises, such as those by the EMF-16.”Tulkens & Tulkens, 11
The White House and the Kyoto Protocol: Double standards on uncertainties and their consequences
would entail a GDP loss of 4.2% in 201013. In other words, in 2010, the projected GDP would
be 4.2% lower than in the reference case. In terms of annual economic growth over the period
2005-2010, the rate under Kyoto is 1.2% whereas the projected reference growth rate is 2.0%
Thus, in the scenario that contains the highest cost estimate of all economic models reviewed
in this study and where benefits from emission trading are not taken into account, Kyoto
would cost the US 0.8% of annual growth rate over the period 2005-2010. And the GDP in
2010 would be indeed about 400 billion US$1992 below its level in the reference case.
It is however misleading to say that it would cost 400 billion US$ in 2010 to the US
economy because the way the cost impacts the economy is in fact much more complex than a
direct cost immediately imputed to the GDP of the year considered. The net economic cost
does indeed depend to a large extent on how the revenue of the emissions reduction policy is
being recycled into the national economy. The EIA (1998) report includes a scenario where
some type of revenue recycling is being considered and under that scenario, the overall cost
drops to from 4.2% to 1.9% of GDP in 2010; the annual growth loss is then estimated as 0.4%
instead of 0.8% in the Kyoto scenario without revenue recycling. It is very unfortunate that
the results of this last scenario, although issued in the same study and with identical emission
reductions targets, were not mentioned in the President’s address.
Beyond this discussion of cost evaluation, in all cases the estimates of growth loss
need to be interpreted in the right context. In the EIA 1998 growth scenario, the US economy
would grow by 36% between 1996 and 2010. Would a growth of 31.8% instead, under the
most pessimistic of the EIA scenarios, have wrecked the US economy? Current data and
projections (EIA, 2006) show that over the period 1998-2012 the US GDP is likely to grow
by 51 %. This means that over the same period, a scenario where in 2010 the GDP would be
4.2% lower would have implied an average annual growth rate of 2.67% instead of 3.03% in
the reference case. Put this way, even the misleading high cost estimate given for the cost of
Kyoto would not have done much harm to the US economy.
Few papers in the economic literature specify how cost estimates are being distributed
over time. Most papers give an annual cost but fail to specify over which period the cost is
13
The total cost of implementing the Kyoto objective in the Unites States is in most publications given in US$
(with reference to a particular year) or in percentage of US GDP in 2010. The latter metric avoids the discount
rate problem and allows easier comparison of costs across years (Barker and Ekins, 2004)Tulkens & Tulkens, 12
The White House and the Kyoto Protocol: Double standards on uncertainties and their consequences
being felt. However, time distribution of this cost matters. If the total cost of meeting the
Kyoto Protocol target is imputed to the five year commitment period, it is very likely to be
higher than if that cost were distributed over a longer period with early mitigation action
taken. This is simply because of the well known differences between short run and long run
costs. Allowing for time allows for cost saving adjustments that are hardly negligible.
Evidence of cost savings associated with early action are reported in the literature Barker and
Ekins (2004) and Kallbekken and Rive (2005). Again, providing precise information on how
costs would be distributed over time would have improved the understanding of the nature of
the issues involved.
In his lucid book, DeCanio (2003) raises criticisms and caution on the interpretation of
economic model results used for cost assessments of GHG emissions reduction. His detailed
analysis argues that all current modelling frameworks are biased towards overestimating the
costs of ameliorating climate change. His conclusion is not that model projections are not
useful for cost assessment. Rather, it calls the attention to the low confidence level that can be
attached to point wise estimates and the ensuing necessity of presenting ranges.
The above facts on lack of explicit information on costs assessments and on their meaning
have left room for the misleading interpretation referred to above. This is a strong reason for
recommending that cost estimates be communicated with uncertainty ranges and in the
relevant context to ensure proper interpretation of the models’ output. Recent evidence that
the Kyoto agreement is still presumed costly (witness, The Economist 200514) shows that
experts in the field did not communicate sufficiently or effectively over the proper
interpretation of their claimed results. These have therefore been susceptible of political
manipulation — a situation that everyone in science would like to see prevented in the
future15.
14
“The Kyoto protocol, which is the subject of a big international meeting in Montreal this week and next, is
costly and unlikely to achieve its stated aims.” December 3, 2005.
15
The thoughtful explanations given in Baker and Ekins (2004) on cost assessments and their interpretation are
an example that should inspire future studies of greenhouse gas emission reduction costs assessments.Tulkens & Tulkens, 13
The White House and the Kyoto Protocol: Double standards on uncertainties and their consequences
5. Actual and potential gains from model updates
5.1. Economic model-based studies
Beyond the issue of the political use in the US of costs assessments related to the
Kyoto Protocol, some lessons emerge from this much debated story for economic modelling
in the context of international negotiations on a possible future climate policy regime beyond
Kyoto. Some but only very few publications post US Kyoto rejection looked at uncertainty
estimates. Moreover, among the models involved in EMF-16 (Weyant, 1999), only Manne
and Richels (2001) have included the provisions adopted in the Marrakech Accords in a
modelling exercise to reassess the costs estimates for the US post US withdrawal from the
agreement. Their cost estimate was of 0.75% of GDP in 2010. More recently Krause et al.
(2002) found that an integrated least-cost strategy for mitigating US greenhouse gas emissions
would produce an annual net output gain of roughly 0.4% of GDP in 2010 instead of a GDP
loss. This result further extends the uncertainty of costs estimates to the basic question
whether reducing greenhouse gas emissions hurt of benefits the economy.
Lasky (2003), reviewed cost assessments published from 1998 to 2000 and
thoughtfully presented the figures in a consistent manner. Fisher and Morgenstern (2005)
used meta-analysis on the EMF-16 model outputs to examine the importance of structural
modelling choices in explaining differences in cost estimates. More recently, the US Senate
(EIA, 2005) examined the cost of different proposed GHG policy programmes and compared
the cost of those new proposals to the cost of implementing Kyoto. The Kyoto scenario was
no longer an option in the process but merely a baseline for assessing the relative cost of other
proposals. Interestingly, for the Kyoto scenario and without using the relevant model to re-
compute the costs, (the estimate given is based on a scenario computed in EIA, 1998) the
figure given amounts to 41 billion which corresponds to a factor of 10 lower than the cost
estimated in 1998 and communicated in 2002.
The evolution of cost estimates expressed in percentage of GDP loss as published
since 1999 is summarized in Table 4. Because complying with the Kyoto Protocol is,
policywise, an outdated issue in the US, modelling projections on the cost of the Kyoto
Protocol in the US has, to our best knowledge, no longer been undertaken since the study of
Manne and Richels (2001) and Krause et al. (2002). This is unfortunate because, should thisTulkens & Tulkens, 14
The White House and the Kyoto Protocol: Double standards on uncertainties and their consequences
reassessment be made today, with the Protocol finalised as in the Marrakech Accords of 2001
and the subsequent Climate Conference of the Parties decisions (that is, accounting with
multi-gas emission reduction programmes, carbon uptake in forests, updated knowledge on
marginal abatement costs and trading benefits), it is very likely that the overall cost estimate
projected, with the same set of models as used in the late nineties, would be much lower than
previously foreseen. And, equally likely, the uncertainty margins of the estimates would be
significantly reduced — if they had been stated.
Table 4: Summary of the range of GDP loss estimates of the Kyoto Protocol
implementation in the USA for the year 2010, according to various sources.
Total cost EIA, Manne and Krause et EIA,
EMF-16,
(% of GDP loss in 2010) 1998 Richels, al., 2005
1999
2001 2002
Maximum 4,2 3.2
0.75 -0.4 0,004
Minimum 0,01 0,1
5. 2. Climate model-based studies
A few years ago, when climate modellers noticed that their models tended to
overestimate global warming because the aerosols representation was missing in their models
(Mitchell and Johns, 1997), climate models were modified to take that phenomenon into
account. New simulations results were compared to the most recent data sets available to
assess the quality of the new sets of simulations. Climate modellers repeatedly compute
climate projections for this century and beyond, with different versions of their models. In
doing so, they not only use up-dated GHG concentration projections as input, they also
reassess earlier climate change estimates with new model versions and compare their findings
with their former results and with those of other modelling teams in organised model inter-
comparison frameworks. Over the last decade, extensive climate model inter-comparison
projects have been realised such as CMIP, AMIP, OCMIP and PMIP (cfr. relevant web sites
references). Practice in model validation and verification in climatology has significantly
improved, inspired directly by practices in weather forecasting. The concept of “ensemble
simulation” has become a standard method to account for model sensitivity to initial
conditions and key parameters. Some of these practices are transposable to modelling
exercises in other fields.Tulkens & Tulkens, 15
The White House and the Kyoto Protocol: Double standards on uncertainties and their consequences
In economic modelling, simulation protocols and inter-comparison projects such as
done in the Energy Modelling Forum are an appropriate framework for model comparisons
studies. However, our review leaves us with the impression that most economic papers
published until now on the cost of Kyoto for the USA, with the exception of Lasky (2003), do
not provide the full set of information necessary for in depth understanding of the results. In
addition, by working systematically on different sets of scenarios, the current practice of
economic modelling makes it difficult to compare results rigorously between models and
between models and data sets. The adoption of experimental setups such as those in place for
climate model inter-comparison projects would bring a significant improvement in economic
modelling practice. In this spirit an obviously interesting exercise would be to repeat, today,
an inter-comparison on the cost of implementing the Kyoto Protocol in the USA. The
outcome of such exercise would give indications on the progress made in the discipline.
5.3. New data
With the implementation of emission reduction programmes (voluntary or mandatory)
in various part of the world, including the US, large sets of data on observed costs are made
available and could be used for a better validation of the results of the economic models.
The information so obtained is sometimes surprising. Thus, from the industry sector, -
the one whose representatives have asserted for years that emission limitation would hurt
business and create unemployment - some programmes recently implemented have revealed
that observed costs were much lower than what had been estimated. For instance, British
Petroleum saved money in its emission reduction programme within its plants. Witness John
Brown, Chief executive of BP, who writes: “Counter intuitively, BP found that it was able to
reach its initial target of reducing emissions by 10% below its 1990 levels without cost.
Indeed, the company added around $650 million of shareholder value, because the bulk of the
reductions came from the elimination of leaks and waste. Other firms -- such as electricity
generator Entergy, car manufacturer Toyota, and mining giant Rio Tinto -- are having
similar experiences. The overwhelming message from these experiments is that efficiency can
both pay dividends and reduce emissions (Brown, 2004)
In Europe, the factual data that emerge from the recently implemented carbon market
are as follows. On the carbon credit market, credits are exchanged between 10 and 33 $/tonTulkens & Tulkens, 16
The White House and the Kyoto Protocol: Double standards on uncertainties and their consequences
CO2 (Point Carbon, 2006a). Project-based credits from the Clean Development Mechanism
(CDM) (from developing countries) are negotiated around 6 to 27 $/tC02 (Point Carbon,
2006b). Those data are not yet representative of the real cost of reducing emissions, however.
The size of the market (in terms of the amount of credits traded) as well as its liquidity are
insufficient for the recorded prices to reflect marginal abatement costs accurately. Moreover,
the link between the European carbon credit market and the world market for Kyoto-based
projects is also not yet in place (Lecocq and Capoor, 2005). When a sufficiently large and
liquid market will operate, the current EU carbon credit market prices might change
significantly. It is thus premature to conclude that the higher figures will keep prevailing.
The emerging data showing real costs should help in assessing the affordability of
emission policies even in the Kyoto context. They should also assist economic modellers in
better validating their forecasting tools. Figure 4 illustrates the carbon prices in the US and
the GDP impact of implementing Kyoto as projected in the studies referred to in this review.
Although no direct comparison of the carbon price with observed carbon prices can be made,
the orders of magnitude are indicative of the range of uncertainties, among projections and
between model outputs and observations.
There are precedents of overestimation of the cost of emission reduction programmes
by economic models, the most conspicuous one being the case of SO2 emission reductions in
the US. In the case of SO2, the overestimation was considerable, as evidenced by Joskow et
al., 2000. Smith et al. (1998) warn on how cautious one should be when comparing costs
estimates with allowance prices and on the limits of such comparisons.
Another example seems to be the implementation of the Montreal Protocol on ozone
depleting substances. No systematic assessment of the overall cost of the Montreal Protocol
implementation has been done, to the best of our knowledge. However, evidence in the
direction of costs overestimation is provided by DeCanio (2003, p. 146-147) and DeCanio
and Norman (2005). Harrington et al. (2000) compared ex ante and ex post cost estimates for
regulatory policies and found that the 28 studies taken into account had a predominant
tendency to overestimate the cost ex ante.
Of course, the case of GHG is different and the causes for a potential overestimation
of abatement costs programmes are likely not to be the same. However, because of theTulkens & Tulkens, 17
The White House and the Kyoto Protocol: Double standards on uncertainties and their consequences
precedents just mentioned, the hypothesis of an overestimation of GHG emission reduction
costs deserves close scrutiny.
6. Summary and Conclusion
The two quotations given at the beginning of this paper illustrate interpretations by
politicians can differ on economic assessments, even when they belong to the same party.
Such opposite views are, at best, a qualitative indicator of the uncertainties associated with the
cost assessment of GHG emission reductions.
In the case of the Kyoto Protocol, the message conveyed by the White House was only
that implementing the Protocol would cost 400 billion US$ per year by 2012 and that such
cost would be harmful to the economy. We show that these figures of costs estimates were
based on outdated scenarios, higher than the highest estimate available in the literature, and
that the figures were not accompanied by appropriate information for a proper interpretation.
One may therefore plausibly think that such biased messages conveyed to the media and the
public have played a role in gaining popular support for the US rejection of the Protocol in
2001.
This review also shows that scientific evidence from economic modelling exercises
performed to date does not show that the implementation of the Kyoto Protocol would have
“wrecked” the US economy. Data and studies recently made available show that some of the
published estimates have entailed large overestimations of the costs.
Since communicating deliberately high cost estimates obviously has political effects,
researchers in this context should insist upon systematically communicating the uncertainty
ranges on projected estimates and on explaining how the results should be interpreted.
Economic modelling researchers in this field should take advantage of the experience
acquired by climate science modellers. Systematic backcasting exercises (Schwartz et al.,
2002) and ensemble simulations (Murphy et al, 2004) instead of a few model runs are current
practice in climate modelling that may be relevant to assessing uncertainties in economic
modelling. The use of similar tools for uncertainty analysis in climate and economicTulkens & Tulkens, 18
The White House and the Kyoto Protocol: Double standards on uncertainties and their consequences
modelling would not only contribute to knowledge gains, it would also greatly facilitate the
communication of uncertainties to decision makers16.
Preparing and publishing revised assessments of the cost to the US of implementing
the Kyoto Protocol is not only a matter of good scientific practice: it would also have an
important impact on developing countries who also fear the burden of costs and tend to use
the same argument as the US to postpone discussions on action from their side.
Politically, a major shift in US international policy on climate change under this
presidency remains unlikely. Scientifically however, a better acknowledgment of the
uncertainties associated with cost estimates of GHG emission reductions would give the
economic estimates an increased credibility. Such improvement would be helpful to the
worldwide policy process currently under way.
Aknowledgments
The authors thank Vincent van Steenberghe and Thierry Bréchet for valuable comments on an
early draft of this paper and Stephen J. DeCanio and Saon Ray for relevant references.
16
Some further recommendations to economic modellers are given in Peterson (2006).Tulkens & Tulkens, 19 The White House and the Kyoto Protocol: Double standards on uncertainties and their consequences References Atmospheric Model Intercomparison Project (AMIP), http://www-pcmdi.llnl.gov/projects/amip/index.php Barker T. and P. Ekins, 2004, The costs of Kyoto for the US economy. The Energy Journal, 25(3), 53-71. http://www.econ.cam.ac.uk/dae/people/barker/pdf/v3ej_k.pdf Browne John, 2004, Beyond Kyoto, Foreign Affairs, Vol 83, Number 4. http://www.foreignaffairs.org/20040701faessay83404/john-browne/beyond-kyoto.html Bush George, 2002, Clear Skies & Global Climate Change Initiatives, speech, February 14, 2002. NOAA, Maryland, USA. http://www.whitehouse.gov/news/releases/2002/02/20020214-5.html Coupled Model Intercomparison Project (CMIP), http://www-pcmdi.llnl.gov/projects/cmip/index.php DeCanio, Stephen J., 2003, Economic Models of Climate Change: a critique, Palgrave MacMillan, New York. 203 pp. Energy Information Administration (EIA), 1998. Impacts of the Kyoto Protocol on U.S. Energy Markets and the US Economy, National Energy Information Center, US Department of Energy. http://www.eia.doe.gov/oiaf/kyoto/kyotorpt.html and http://www.eia.doe.gov/oiaf/kyoto/pdf/sroiaf9803.pdf Energy Information Administration (EIA), 2005. Impacts of Modeled Recommendations of the National Commission on Energy Policy (NCEP), National Energy Information Center, US Department of Energy. http://www.eia.doe.gov/oiaf/servicerpt/bingaman/index.html Energy Modeling Forum. http://www.stanford.edu/group/EMF/ Fisher and Mogernstern, 2005. Carbon Abatement Costs, Why the wide range of estimates?, RFF DP 03-42 Rev, Resources for the Future, Washinghton DC. http://www.rff.org/Documents/RFF-DP-03-42-REV.pdf Intergovernmental Panel on Climate Change (IPCC), 1990, JT Houghton, GJ Jenkins and JJ Ephraums (Eds). First Assessment Report (FAR), Scientific Assessment of Climate change – Report of Working Group I , Cambridge University Press, p. xxii of summary for policy-makers. Intergovernmental Panel on Climate Change (IPCC), 1995, JT Houghton, LG Meira Filho, BA Callender, N Harris, A Kattenberg and K Maskell (Eds). Second Assessment Report (SAR), Climate Change 1995: The Science of Climate Change – Contribution of Working Group I , Cambridge University Press, p. 6 of summary for policy-makers Intergovernmental Panel on Climate Change (IPCC), 2000, Nebojsa Nakicenovic and Rob Swart (Eds.), Emissions Scenarios 2000, Special Report, Cambridge University Press, UK. pp 570. Intergovernmental Panel on Climate Change (IPCC), 2001a, Third Assessment Report (TAR), Climate Change 2001: The Scientific Basis, Cambridge University Press, .pp. 881. http://www.ipcc.ch Intergovernmental Panel on Climate Change (IPCC),2001b, Third Assessment Report (TAR), Climate Change 2001: Mitigation, Cambridge University Press, .Table 8.7, p. 537. http://www.ipcc.ch Intergovernmental Panel on Climate Change (IPCC), 2004, IPCC Working Group I Workshop on Climate Sensitivity, Workshop Report, http://ipcc-wg1.ucar.edu/meeting/CSW/product/CSW_Report.pdf Joskow Paul L., Ellerman A. Denny, Schmalensee Richard, Montero Juan-Pablo, Bailey Elizabeth M. 2000. Markets for clean air: the U.S. acid rain program, Cambridge University Press, UK. pp. 352. Krause F., S. DeCanio, J. A. Hoerner and P. Baer 2002, Cutting carbon emissions at a profit (part I): opportunities for the United States, Contemporary Economic Policy, vol. 20. 4, 2002, 339-365.
Tulkens & Tulkens,                                                                                 20
The White House and the Kyoto Protocol: Double standards on uncertainties and their consequences

Kallbekken, S. and N. Rive, 2005, Why delaying climate action is a gamble, Avoiding Dangerous Climate
Change conference, Exeter, February 1-3. http://www.stabilisation2005.com

Lasky M., 2003. The Economic Costs of Reducing Emissions of Greenhouse Gases: A Survey of Economic
Models, Technical Paper Series, Congressional Budget Office, Washington DC.
http://www.cbo.gov/ftpdocs/41xx/doc4198/2003-3.pdf

Lecocq, F. and K. Capoor, 2005, State and Trends of the Carbon Market 2005, Washington DC, World
Bank/International Emissions Trading Association (IETA).
http://carbonfinance.org/docs/CarbonMarketStudy2005.pdf

Manne A.S. and R. G. Richels, 2001, US rejection of the Kyoto Protocol: the impact on compliance costs and
CO2 emissions, http://www.stanford.edu/group/MERGE/kyoto.pdf

Mitchell J.F.B. and T.C. Johns, 1997, On modification of global warming by sulfate aerosols, J. Climate, 10,
245-267.

Murphy J.M, D.M. H. Sexton, D. Barnett, G. Jones, M. Webb, M. Collins and D. Stainforth, 2004.
Quantification of modelling uncertainties in a large ensemble of climate change simulations, Nature, Vol 340, p.
768-772.

Ocean Carbon Model Intercomparison Project (OCMIP), http://www.ipsl.jussieu.fr/OCMIP/

Point Carbon, 2006a. .http://www.pointcarbon.com/Home/Market+prices/Historic+prices/category390.html

Point Carbon, 2006b. CDM & JI Monitor, 21 March,
http://www.pointcarbon.com/wimages/CJM03212006JM_1.pdf

Paleo Model Intercomparison Project (PMIP), http://www-lsce.cea.fr/pmip/

Peterson S. 2006. Uncertainty and economic analysis of climate change: A survey of approaches and findings,
Environmental Modeling and Assessment, 11:1-17.

Reilly, J., P.H. Stone, C.E. Forest, M.D. Webster, H.D. Jacoby, and R.G. Prinn, 2001: Uncertainty and climate
change assessments. Science, 293 (July 20), p. 430-433.

                               dangerous'climate change? Nature, 411(May 3), p 17-19.
Schneider, S.H., 2001: What is '

Schwartz S. E., T. M. Smith, T. R. Karl and R.W. Reynolds 2002. Uncertainty in Climate Models, Science,
2139-2140.

Smith, Anne E., Jeremy Platt and Denny Ellerman (1998), The Costs Of Reducing Utility SO2 Emissions -- Not
As Low As You Might Think, Journal of Environmental Economics And Management. 36, 26-45.

The Economist, 2005, The sound of distant howling, December 3 issue , p. 11.
http://www.economist.com/displaystory.cfm?story_id=5246617

United Nations Framework Convention on Climate Change, 1992. http://www.unfccc.int

Weyant John P. and Hill Jennifer N., 1999. Introduction and overview, Special Issue of The Energy Journal,, p.
vii-xliv.

Wigley, T.M.L., and S.C.B. Raper, 2001: Interpretation of high projections for global-mean warming. Science,
293, pp. 451-454.

Williamson Samuel H., 2005. What is the Relative Value? Economic History Services, URL:
http://www.eh.net/hmit/compare/
NOTE DI LAVORO DELLA FONDAZIONE ENI ENRICO MATTEI
Fondazione Eni Enrico Mattei Working Paper Series
Our Note di Lavoro are available on the Internet at the following addresses:
http://www.feem.it/Feem/Pub/Publications/WPapers/default.html
http://www.ssrn.com/link/feem.html
http://www.repec.org
http://agecon.lib.umn.edu
NOTE DI LAVORO PUBLISHED IN 2006
Anna ALBERINI: Determinants and Effects on Property Values of Participation in Voluntary Cleanup Programs:
SIEV 1.2006
The Case of Colorado
Valentina BOSETTI, Carlo CARRARO and Marzio GALEOTTI: Stabilisation Targets, Technical Change and the
CCMP 2.2006
Macroeconomic Costs of Climate Change Control
CCMP 3.2006 Roberto ROSON: Introducing Imperfect Competition in CGE Models: Technical Aspects and Implications
KTHC 4.2006 Sergio VERGALLI: The Role of Community in Migration Dynamics
Fabio GRAZI, Jeroen C.J.M. van den BERGH and Piet RIETVELD: Modeling Spatial Sustainability: Spatial
SIEV 5.2006
Welfare Economics versus Ecological Footprint
Olivier DESCHENES and Michael GREENSTONE: The Economic Impacts of Climate Change: Evidence from
CCMP 6.2006
Agricultural Profits and Random Fluctuations in Weather
PRCG 7.2006 Michele MORETTO and Paola VALBONESE: Firm Regulation and Profit-Sharing: A Real Option Approach
SIEV 8.2006 Anna ALBERINI and Aline CHIABAI: Discount Rates in Risk v. Money and Money v. Money Tradeoffs
CTN 9.2006 Jon X. EGUIA: United We Vote
CTN 10.2006 Shao CHIN SUNG and Dinko DIMITRO: A Taxonomy of Myopic Stability Concepts for Hedonic Games
NRM 11.2006 Fabio CERINA (lxxviii): Tourism Specialization and Sustainability: A Long-Run Policy Analysis
Valentina BOSETTI, Mariaester CASSINELLI and Alessandro LANZA (lxxviii): Benchmarking in Tourism
NRM 12.2006
Destination, Keeping in Mind the Sustainable Paradigm
CCMP 13.2006 Jens HORBACH: Determinants of Environmental Innovation – New Evidence from German Panel Data Sources
KTHC 14.2006 Fabio SABATINI: Social Capital, Public Spending and the Quality of Economic Development: The Case of Italy
KTHC 15.2006 Fabio SABATINI: The Empirics of Social Capital and Economic Development: A Critical Perspective
CSRM 16.2006 Giuseppe DI VITA: Corruption, Exogenous Changes in Incentives and Deterrence
Rob B. DELLINK and Marjan W. HOFKES: The Timing of National Greenhouse Gas Emission Reductions in
CCMP 17.2006
the Presence of Other Environmental Policies
IEM 18.2006 Philippe QUIRION: Distributional Impacts of Energy-Efficiency Certificates Vs. Taxes and Standards
CTN 19.2006 Somdeb LAHIRI: A Weak Bargaining Set for Contract Choice Problems
Massimiliano MAZZANTI and Roberto ZOBOLI: Examining the Factors Influencing Environmental
CCMP 20.2006
Innovations
SIEV 21.2006 Y. Hossein FARZIN and Ken-ICHI AKAO: Non-pecuniary Work Incentive and Labor Supply
Marzio GALEOTTI, Matteo MANERA and Alessandro LANZA: On the Robustness of Robustness Checks of the
CCMP 22.2006
Environmental Kuznets Curve
NRM 23.2006 Y. Hossein FARZIN and Ken-ICHI AKAO: When is it Optimal to Exhaust a Resource in a Finite Time?
Y. Hossein FARZIN and Ken-ICHI AKAO: Non-pecuniary Value of Employment and Natural Resource
NRM 24.2006
Extinction
Lucia VERGANO and Paulo A.L.D. NUNES: Analysis and Evaluation of Ecosystem Resilience: An Economic
SIEV 25.2006
Perspective
Danny CAMPBELL, W. George HUTCHINSON and Riccardo SCARPA: Using Discrete Choice Experiments to
SIEV 26.2006 Derive Individual-Specific WTP Estimates for Landscape Improvements under Agri-Environmental Schemes
Evidence from the Rural Environment Protection Scheme in Ireland
Vincent M. OTTO, Timo KUOSMANEN and Ekko C. van IERLAND: Estimating Feedback Effect in Technical
KTHC 27.2006
Change: A Frontier Approach
CCMP 28.2006 Giovanni BELLA: Uniqueness and Indeterminacy of Equilibria in a Model with Polluting Emissions
Alessandro COLOGNI and Matteo MANERA: The Asymmetric Effects of Oil Shocks on Output Growth: A
IEM 29.2006
Markov-Switching Analysis for the G-7 Countries
KTHC 30.2006 Fabio SABATINI: Social Capital and Labour Productivity in Italy
ETA 31.2006 Andrea GALLICE (lxxix): Predicting one Shot Play in 2x2 Games Using Beliefs Based on Minimax Regret
Andrea BIGANO and Paul SHEEHAN: Assessing the Risk of Oil Spills in the Mediterranean: the Case of the
IEM 32.2006
Route from the Black Sea to Italy
Rinaldo BRAU and Davide CAO (lxxviii): Uncovering the Macrostructure of Tourists’ Preferences. A Choice
NRM 33.2006
Experiment Analysis of Tourism Demand to Sardinia
Parkash CHANDER and Henry TULKENS: Cooperation, Stability and Self-Enforcement in International
CTN 34.2006
Environmental Agreements: A Conceptual Discussion
IEM 35.2006 Valeria COSTANTINI and Salvatore MONNI: Environment, Human Development and Economic Growth
ETA 36.2006 Ariel RUBINSTEIN (lxxix): Instinctive and Cognitive Reasoning: A Study of Response TimesETA 37.2006 Maria SALGADO (lxxix): Choosing to Have Less Choice
Justina A.V. FISCHER and Benno TORGLER: Does Envy Destroy Social Fundamentals? The Impact of Relative
ETA 38.2006
Income Position on Social Capital
Benno TORGLER, Sascha L. SCHMIDT and Bruno S. FREY: Relative Income Position and Performance: An
ETA 39.2006
Empirical Panel Analysis
Alberto GAGO, Xavier LABANDEIRA, Fidel PICOS And Miguel RODRÍGUEZ: Taxing Tourism In Spain:
CCMP 40.2006
Results and Recommendations
Karl van BIERVLIET, Dirk Le ROY and Paulo A.L.D. NUNES: An Accidental Oil Spill Along the Belgian
IEM 41.2006
Coast: Results from a CV Study
CCMP 42.2006 Rolf GOLOMBEK and Michael HOEL: Endogenous Technology and Tradable Emission Quotas
Giulio CAINELLI and Donato IACOBUCCI: The Role of Agglomeration and Technology in Shaping Firm
KTHC 43.2006
Strategy and Organization
Alvaro CALZADILLA, Francesco PAULI and Roberto ROSON: Climate Change and Extreme Events: An
CCMP 44.2006
Assessment of Economic Implications
M.E. KRAGT, P.C. ROEBELING and A. RUIJS: Effects of Great Barrier Reef Degradation on Recreational
SIEV 45.2006
Demand: A Contingent Behaviour Approach
C. GIUPPONI, R. CAMERA, A. FASSIO, A. LASUT, J. MYSIAK and A. SGOBBI: Network Analysis, Creative
NRM 46.2006
System Modelling and DecisionSupport: The NetSyMoD Approach
Walter F. LALICH (lxxx): Measurement and Spatial Effects of the Immigrant Created Cultural Diversity in
KTHC 47.2006
Sydney
KTHC 48.2006 Elena PASPALANOVA (lxxx): Cultural Diversity Determining the Memory of a Controversial Social Event
Ugo GASPARINO, Barbara DEL CORPO and Dino PINELLI (lxxx): Perceived Diversity of Complex
KTHC 49.2006
Environmental Systems: Multidimensional Measurement and Synthetic Indicators
Aleksandra HAUKE (lxxx): Impact of Cultural Differences on Knowledge Transfer in British, Hungarian and
KTHC 50.2006
Polish Enterprises
Katherine MARQUAND FORSYTH and Vanja M. K. STENIUS (lxxx): The Challenges of Data Comparison and
KTHC 51.2006
Varied European Concepts of Diversity
Gianmarco I.P. OTTAVIANO and Giovanni PERI (lxxx): Rethinking the Gains from Immigration: Theory and
KTHC 52.2006
Evidence from the U.S.
KTHC 53.2006 Monica BARNI (lxxx): From Statistical to Geolinguistic Data: Mapping and Measuring Linguistic Diversity
KTHC 54.2006 Lucia TAJOLI and Lucia DE BENEDICTIS (lxxx): Economic Integration and Similarity in Trade Structures
Suzanna CHAN (lxxx): “God’s Little Acre” and “Belfast Chinatown”: Diversity and Ethnic Place Identity in
KTHC 55.2006
Belfast
KTHC 56.2006 Diana PETKOVA (lxxx): Cultural Diversity in People’s Attitudes and Perceptions
John J. BETANCUR (lxxx): From Outsiders to On-Paper Equals to Cultural Curiosities? The Trajectory of
KTHC 57.2006
Diversity in the USA
KTHC 58.2006 Kiflemariam HAMDE (lxxx): Cultural Diversity A Glimpse Over the Current Debate in Sweden
KTHC 59.2006 Emilio GREGORI (lxxx): Indicators of Migrants’ Socio-Professional Integration
Christa-Maria LERM HAYES (lxxx): Unity in Diversity Through Art? Joseph Beuys’ Models of Cultural
KTHC 60.2006
Dialogue
Sara VERTOMMEN and Albert MARTENS (lxxx): Ethnic Minorities Rewarded: Ethnostratification on the Wage
KTHC 61.2006
Market in Belgium
KTHC 62.2006 Nicola GENOVESE and Maria Grazia LA SPADA (lxxx): Diversity and Pluralism: An Economist's View
Carla BAGNA (lxxx): Italian Schools and New Linguistic Minorities: Nationality Vs. Plurilingualism. Which
KTHC 63.2006
Ways and Methodologies for Mapping these Contexts?
KTHC 64.2006 Vedran OMANOVIĆ (lxxx): Understanding “Diversity in Organizations” Paradigmatically and Methodologically
Mila PASPALANOVA (lxxx): Identifying and Assessing the Development of Populations of Undocumented
KTHC 65.2006
Migrants: The Case of Undocumented Poles and Bulgarians in Brussels
KTHC 66.2006 Roberto ALZETTA (lxxx): Diversities in Diversity: Exploring Moroccan Migrants’ Livelihood in Genoa
Monika SEDENKOVA and Jiri HORAK (lxxx): Multivariate and Multicriteria Evaluation of Labour Market
KTHC 67.2006
Situation
Dirk JACOBS and Andrea REA (lxxx): Construction and Import of Ethnic Categorisations: “Allochthones” in
KTHC 68.2006
The Netherlands and Belgium
KTHC 69.2006 Eric M. USLANER (lxxx): Does Diversity Drive Down Trust?
Paula MOTA SANTOS and João BORGES DE SOUSA (lxxx): Visibility & Invisibility of Communities in Urban
KTHC 70.2006
Systems
Rinaldo BRAU and Matteo LIPPI BRUNI: Eliciting the Demand for Long Term Care Coverage: A Discrete
ETA 71.2006
Choice Modelling Analysis
CTN 72.2006 Dinko DIMITROV and Claus-JOCHEN HAAKE: Coalition Formation in Simple Games: The Semistrict Core
Ottorino CHILLEM, Benedetto GUI and Lorenzo ROCCO: On The Economic Value of Repeated Interactions
CTN 73.2006
Under Adverse Selection
CTN 74.2006 Sylvain BEAL and Nicolas QUÉROU: Bounded Rationality and Repeated Network Formation
CTN 75.2006 Sophie BADE, Guillaume HAERINGER and Ludovic RENOU: Bilateral Commitment
CTN 76.2006 Andranik TANGIAN: Evaluation of Parties and Coalitions After Parliamentary Elections
Rudolf BERGHAMMER, Agnieszka RUSINOWSKA and Harrie de SWART: Applications of Relations and
CTN 77.2006
Graphs to Coalition Formation
CTN 78.2006 Paolo PIN: Eight Degrees of Separation
CTN 79.2006 Roland AMANN and Thomas GALL: How (not) to Choose Peers in Studying GroupsYou can also read