University of Toronto Department of Economics - Migration Costs, Sorting, and the Agricultural Productivity Gap
←
→
Page content transcription
If your browser does not render page correctly, please read the page content below
University of Toronto
                 Department of Economics

                              Working Paper 693

Migration Costs, Sorting, and the Agricultural Productivity Gap

        By Qingen Gai, Naijia Guo, Bingjing Li, Qinghua Shi and Xiaodong
                                      Zhu

                                 April 17, 2021
Migration Costs, Sorting, and the Agricultural Productivity Gap
           Qingen Gai             Naijia Guo     Bingjing Li                     Qinghua Shi
                                         Xiaodong Zhu∗
                       First version: January 2020†       This version: April, 2021

                                                Abstract
          We use a unique panel dataset and a policy experiment as an instrument to estimate
      the impact of policy-induced migration cost reductions on rural-to-urban migration and
      the associated increase in labor earnings for migrant workers in China. Our estimation
      shows that there exist both large migration costs and a large underlying productivity
      difference between rural agricultural and urban non-agricultural sectors in China. More
      than half of the observed labor earnings gap between the two sectors can be attributed
      to the underlying productivity difference, and less than half of the gap can be attributed
      to sorting of workers. We also structurally estimate a general equilibrium Roy model
      and use it to quantify the effects of reducing migration costs on the observed sectoral
      productivity difference, migration, and aggregate productivity. If we implement a hukou
      policy reform by setting the hukou liberalization index in all regions of China to the
      level of the most liberal region, the observed agricultural productivity gap would decrease
      by more than 30%, the migrant share would increase by about 9%, and the aggregate
      productivity would increase by 1.1%. In contrast, in a partial equilibrium in which the
      underlying productivity difference does not change with migration cost, the hukou policy
      reform would reduce the observed agricultural productivity gap by only 9%, the migrant
      share would increase by more than 50%, and the aggregate productivity would increase
      by 6.8%.
    JEL Classification: E24, J24, J61, O11, O15
   Keywords: Migration cost; sorting; agricultural productivity gap; panel data; China; general
equilibrium Roy model
    †
      The first version of the paper was entitled “Selective Migration and Agricultural Productivity Gap: Evi-
dence from China”.
    ∗
      Gai: Shanghai University of Finance and Economics, email: gai.qingen@shufe.edu.cn; Guo: Chinese
University of Hong Kong, email: guonaijia@cuhk.edu.hk; Li: National University of Singapore, email: ec-
slib@nus.edu.sg; Shi: Shanghai Jiaotong University, email: shq@sjtu.edu.cn; and Zhu: University of Toronto,
email: xiaodong.zhu@utoronto.ca. We would like to thank Kory Kroft, David Lagakos, Rachel Ngai, Albert
Park, Chris Pissarides, Diego Restuccia, Todd Schoellman, Aloysius Siow, Daniel Trefler, Yuanyuan Wan, Lin
Zhong, and the seminar participants of the London School of Economics, Jinan University, Peking University,
Tsinghua University, University College London, and University of Toronto, and conference participants of the
2019 Asian Meeting of the Econometric Society, China and World Economy 2019 Annual Meeting, 2019 Interna-
tional Symposium on Contemporary Labor Economics, 2020 China Economics Summer Institute, 2020 European
Economics Association Congress, and 2021 STEG Annual Conference for their constructive comments. Qingen
Gai and Qinghua Shi acknowledge the financial support of the National Natural Science Foundation of China
(71773076, 71973094, and 72073087). Xiaodong Zhu acknowledges financial support from the Social Science
and Humanity Research Council of Canada.
1 Introduction
There are large gaps in value-added per worker between the agricultural and non-agricultural
sectors in developing countries, a phenomenon known in the literature as the agricultural pro-
ductivity gap (APG). Sectoral labor productivity gaps remain sizeable, even after controlling
for observable sectoral differences in worker characteristics, such as human capital and working
hours (Gollin et al., 2014). Because a large portion of the labor force in poor countries work
in agriculture, the APG is also the main reason for the large disparity in aggregate labor pro-
ductivity between rich and poor countries (Gollin et al., 2002; Caselli, 2005; Restuccia et al.,
2008). Therefore, understanding the sources of the APG is important for understanding why
developing countries lag behind in aggregate productivity, and for designing policies that may
help reduce income disparities between developing and developed countries.
There are two competing explanations for the large APG in developing countries. One
explanation refers to differences in unobserved worker characteristics and sorting.1 Another ex-
planation focuses on barriers to worker mobility between the two sectors, which prevent farmers
from migrating to the more productive non-agricultural sector.2 In the former case, efficient
sorting implies that there is little room for policy makers to improve welfare by reallocating
workers out of agriculture. In contrast, in the latter case, the APG reflects a combination of
the underlying sectoral productivity gap and barriers to switching sectors, and policies that
reduce the barriers could help improve aggregate productivity in the developing countries.
Of course, these two explanations are not mutually exclusive. As pointed out by Lagakos
(2020) and Donovan and Schoellman (2020), it is likely that both sorting and mobility barriers
are important in accounting for the observed APG, and the research challenge is to identify these
two sources empirically and to quantitatively estimate their contributions to the APG. We tackle
the challenge in this paper. First, we use a unique large panel dataset and a policy experiment
in China to empirically estimate the average migration cost of marginal workers affected by the
policy and the underlying average labor productivity difference between the two sectors without
imposing strong functional form assumptions. These estimates can tell us not only if there exist
significant migration barriers, but also how much of the observed APG can be attributed to
sorting and the underlying sectoral productivity difference, respectively. These reduced-form
estimates, however, cannot tell us why there exists an underlying sectoral productivity difference
and how barriers to migration affect the productivity difference and sorting. To address these
1
See, e.g., Beegle et al. (2011), Lagakos and Waugh (2013), Young (2013), Herrendorf and Schoellman (2018),
Alvarez (2020), and Hamory et al. (2021).
2
See, e.g., Restuccia et al. (2008), Bryan et al. (2014), Munshi and Rosenzweig (2016), Lagakos et al. (2018),
Ngai et al. (2019), Tombe and Zhu (2019), Hao et al. (2020), Lagakos et al. (2020), Imbert and Papp (2020).
1questions, we then use the same panel dataset to structurally estimate a general equilibrium
Roy model, which we use to determine the relative contributions of migration costs and sorting
to the observed APG, and to quantify the effects of reducing migration costs on the underlying
sectoral productivity difference, migration, and aggregate productivity.
China is an excellent case study for three reasons. First, both the sectoral income gap and
the explicit policies restricting rural-to-urban migration are well documented (Ngai et al., 2019;
Tombe and Zhu, 2019; and Hao et al., 2020). Second, there is a unique large panel dataset,
the annual National Fixed Point Survey (NFP) of agriculture, that tracks around 80,000 rural
agricultural workers and rural-to-urban migrant workers from 2003 to 2012. Finally, there has
been a policy change that serves as a policy experiment to help identify the effect of changes
in migration costs empirically.
Specifically, the policy experiment is the gradual county-by-county roll-out of the New Rural
Pension Scheme (NRPS) between 2009 and 2012. Existing studies show that the new pension
scheme increases elderly consumption of healthcare services and reduces their reliance on the
eldercare provided by their children (Zhang and Chen, 2014; Eggleston et al., 2016; Chen et al.,
2018). The studies also show that the new pension scheme reduces elderly labor supply in farm
work and increases their time spent with their grandchildren (Jiao, 2016; Huang and Zhang,
2020). Through these two channels, the new pension scheme helps reduce the migration costs of
the elderlies’ adult children, but has no direct impact on their labor earnings in the two sectors.
Therefore, the policy experiment can serve as an instrument for estimating the migration returns
of workers who switched sectors due to the policy – the local average treatment effect (LATE).
Our estimation yields a LATE estimate of 79 log point difference in annual earnings between the
non-agricultural and agricultural sectors. We show theoretically that this LATE estimate also
provides an estimate of the average migration cost (as a percentage of non-agricultural earnings)
for those migrant workers who were affected by the policy on the margin. So, the estimation
result also implies that, prior to the implementation of the new rural pension scheme, these
migrant workers faced migration costs that were around 55% of their potential non-agricultural
earnings.
Having the policy experiment as the instrument, we can also use the control function ap-
proach suggested by Card (2001) and Cornelissen et al. (2016) to estimate the average treatment
effect (ATE) of migration. This estimate corresponds theoretically to an increase in the labor
productivity for an average rural worker if she moves from the agricultural sector to the non-
agricultural sector in an urban area. We call this increase in productivity the underlying APG.
Our control function estimation yields an underlying productivity difference that ranges from
38 to 46 log points. The results suggest that there is a substantial underlying labor productivity
2gap between the agricultural and non-agricultural sectors in China that is not due to worker
sorting. In comparison, the OLS estimation of the APG that controls for observed worker char-
acteristics but not selection based on unobserved characteristics yields an estimate of 68 log
points. So, our estimation results also imply that sorting of workers based on unobserved char-
acteristics accounts for less than half of the observed APG in China, with the rest accounted
for by the underlying productivity difference.
In summary, our reduced-form estimation using the panel data and a policy experiment as
the instrument shows that, in China, rural residents face significant barriers to migration from
the rural agricultural sector to the urban non-agricultural sector, and there is a large under-
lying labor productivity difference between the two sectors. It also shows that the underlying
productivity difference accounts for more than half of the observed APG in China.
Why is there a large underlying sectoral productivity difference? What are the sources
of the migration barriers? How would reductions in migration barriers affect the underlying
productivity difference, sorting, and aggregate productivity? To address these questions, we
then develop and structurally estimate a general equilibrium Roy model. Since our dataset is an
origin-based survey of rural residents, we model these individuals’ sectoral choices carefully, but
assume that urban residents always work in the non-agricultural sector. Like the standard Roy
model, we assume rural residents have heterogeneous comparative advantage with respect to
working in the two sectors. In the model, a rural resident who decides to migrate to the urban
non-agricultural sector faces a migration cost. We allow for heterogeneous migration costs
across individuals and assume that migration costs are time-invariant functions of location,
policies, and individual characteristics such as gender, age, and education level. We consider
two measures of policies. One is a dummy variable that indicates if the NRPS had been
implemented in the individual’s county of residence, and the other is an index that measures
how easy it is to get (hukou) residency status in the potential destinations. We conjecture that
individuals living in a rural county that had already implemented the new rural pension scheme
and have elderly in the family, or living close to cities with a less stringent hukou policy are
likely to face lower migration costs. Finally, we allow for idiosyncratic shocks to migration costs
and human capital in the two sectors that are i.i.d. across individuals and time to capture rich
income and migration dynamics observed in the panel data.
We use the maximum likelihood method to estimate the structural model. The structural
estimation yields similar results to those from our reduced form estimation. The estimated
underlying productivity gap is 59 log points and the average proportional migration cost faced
by all workers with rural hukou is 39% of their potential non-agricultural earnings. More
important, our structural estimation reveals significant heterogeneity in migration costs across
3locations and individuals with different characteristics. It shows that the migration costs are
lower for men, highly educated workers, younger workers, and workers with an elderly family
member above age 60 in the household. Our estimation also shows that hukou policy and
the NRPS both have a significant negative effect on migration costs. A rural individual living
in a county with a higher hukou liberalization index or with an elderly in the household and
the NRPS implemented in the village faces much lower migration costs than the average rural
resident. We also find that abilities are more dispersed in agriculture than in non-agriculture.
We next extend our model into a general equilibrium framework to allow for changes in the
underlying productivity gap in the counterfactual analysis. If we implement a hukou reform
by setting the hukou liberalization index in all regions of China to the level of the most liberal
region, the observed APG would decrease by more than 30%, the migrant share would increase
by about 9%, and the aggregate productivity would increase by 1.1%. In contrast, in a partial
equilibrium in which the underlying productivity difference does not change with migration
cost, the hukou policy reform would reduce the observed agricultural productivity gap by only
9%, increase the migrant share by more than 50%, and increase the aggregate productivity by
6.8%. Our results suggest that taking into account the general equilibrium effect of reductions in
the rural-to-urban migration cost on the relative price of agriculture is important for evaluating
their impact on the observed APG, migration, and aggregate productivity. We also quantify the
impact of hypothetical reductions in the average migration cost faced by all rural individuals
and find similar differences in their effects between partial and general equilibrium. Finally, we
quantify the impact of sectoral productivity changes and find that quantitatively, the change
in agricultural productivity is important for migration, but the change in non-agricultural
productivity is important for aggregate productivity.
Our study contributes to the literature that examines the roles of labor mobility barriers
and sorting in accounting for the observed agricultural productivity gap. See Lagakos (2020)
for a recent survey of this literature. In particular, Lagakos and Waugh (2013), Tombe and
Zhu (2019), and Hao et al. (2020) use general equilibrium Roy models to quantify the role of
selection and migration barriers in accounting for the observed APG. To do so, they impose
strong and restrictive assumptions about the distributions of unobserved individual abilities or
preferences. Thus the quantitative results could be sensitive to functional form assumptions.
To get around this, Herrendorf and Schoellman (2018), Alvarez (2020), Lagakos et al. (2020),
and Hamory et al. (2021) try to control for the selection effect by using individual fixed effect
regressions to estimate the migration returns of those who did migrate. However, Pulido and
Świecki (2018) points out that controlling for individual fixed effects does not solve the selection
problem if individuals’ unobserved abilities are different in the two sectors and they sort into
4the two sectors according to their comparative advantage. They propose a Roy model of
comparative advantage and sectoral choice and structurally estimate the model using panel
data. Their identification, however, still depends heavily on their functional form assumptions.
One of our paper’s main contributions is that it exploits a quasi-natural policy experiment as
an instrument to solve the identification problem and estimate the average treatment effect
(ATE) of migration and the average migration cost of the treated individuals (LATE) without
imposing strong functional form assumptions.3 The empirical methods we use are well known
in the labor literature (see, e.g., Heckman and Honore (1990), Card (2001) and Cornelissen
et al. (2016)), but have so far not been applied in the APG literature. Our paper helps to
bridge the gap.
Another main contribution of our study is estimating a general equilibrium Roy model that
incorporates migration costs that vary across locations, individual characteristics, and policy
environment. Both Lagakos et al. (2020) and Schoellman (2020) argue that heterogeneous
migration costs are important to reconcile different pieces of evidence on the returns to migration
in the literature. We show, using Chinese data, that migration costs are indeed heterogeneous
and vary systematically with policy environment and individuals’ gender, age, education level,
and family structure. By linking migration cost to policy environment, we can also quantify
the effects on aggregate real income and productivity of counterfactual policies that reduce
rural-to-urban migration costs in China. By using detailed micro-data to discipline the general
equilibrium model of migration, our paper is also related to Lagakos et al. (2018), which uses
results from a micro field experiment to calibrate its general equilibrium model of migration in
Bangladesh.
Finally, our study is also related to the literature on misallocation and aggregate produc-
tivity in China. See, e.g., Hsieh and Klenow (2009), Song et al. (2011), Brandt et al. (2013),
Adamopoulos et al. (2017), Ngai et al. (2019), and Tombe and Zhu (2019). In particular,
Adamopoulos et al. (2017) also uses the NFP panel data and a general equilibrium Roy model
to examine misallocation in China. Their focus, however, is on how the frictions within agricul-
ture affect the occupational choices of workers, while our focus is on the effects of rural-to-urban
migration costs. Another difference is that they use the household-level data prior to 2003, while
we use the data on individual migrant workers for the 10-year period starting from 2003.
The remainder of the paper proceeds as follows. Section 2 discusses the institutional back-
ground and. Section 3 presents a generalized Roy model and discusses our empirical strategy
3
There are a small number of recent papers that employ field and natural experiments to identify the return
to migration, such as Bryan et al. (2014) and Nakamura et al. (2016). Our study complements these papers,
but also highlights how to make use of quasi-experimental variation to identify the underlying agricultural
productivity gap.
5for dealing with selection bias. Section 4 and 5 move onto the reduced-form empirical analysis
and structural estimation, respectively. Finally, Section 6 embeds our structural model into a
general equilibrium Roy model and conducts quantitative analysis. Section 7 concludes.
2 Institutional Background and Data
2.1 The Hukou System and Origin-based Hukou Index
Under China’s household registration system, each Chinese citizen is assigned a hukou (regis-
tration status), classified as “agricultural (rural)” or “non-agricultural (urban)” in a specific
administrative unit that is at or lower than the county or city level. The system is like an
internal passport system, where individuals’ access to public services is tied to having local
hukou status. Individuals need approval from local governments to change their hukou’s cate-
gory (agricultural or non-agricultural) or location, and it is extremely difficult to obtain such
approval. Due to these institutional barriers, most rural-to-urban migrant workers are without
urban hukou and therefore have limited access to local public services, such as health care,
schooling and social security. Consequently, many migrant workers leave their children and el-
ders behind in the rural areas. In recent years, there have been some policy reforms that relaxed
the restrictions imposed by the hukou system, but the degree and timing of the liberalization
varies across cities.4
For our empirical analysis, we construct an origin-based annual Hukou Index for all pre-
fectures in China for the period of 2003-2012. Fan (2019) constructed a destination-based
prefecture-level Hukou Reform Index for the period of 1997-2010, with a higher value of the
index reflecting better prospects of long-term settlement for migrant workers at a particular
destination city in a particular year. We follow his methodology and extend his index to 2012.
We then construct our origin-based Hukou Index as follows: For each origination prefecture,
we use the pre-determined out-migration flows to weight the Hukou Reform Index across all
destinations. The information of pre-determined bilateral migration flows among prefectures
are obtained from the 2000 Population Census. Our Hukou Index measures how easy it is for
migrant workers from a particular prefecture to settle in cities, and it is negatively related to
the migration barriers faced by migrant workers from the prefecture.
Table 1 shows that, from 2003 to 2010, both the average and maximum Hukou Indexes
are increasing over time, suggesting a general trend of hukou policy liberalization. After 2010,
4
Chan (2019) provides a detailed and up-to-date discussion of the system and its reforms, and Hao et al.
(2020) presents an up-to-date summary of the internal migration patterns in China based on China’s population
census data.
6Table 1: Hukou Index: Summary Statistics
Year Mean Std Min Max
2003 0.098 0.056 0.013 0.342
2004 0.120 0.075 0.013 0.475
2005 0.120 0.075 0.013 0.475
2006 0.123 0.076 0.013 0.475
2007 0.137 0.090 0.017 0.603
2008 0.136 0.086 0.017 0.579
2009 0.142 0.086 0.017 0.580
2010 0.153 0.099 0.024 0.678
2011 0.137 0.074 0.025 0.424
2012 0.144 0.075 0.025 0.406
however, both the average and maximum Hukou Indexes fall back from their peak 2010 values.
In these later years, many first-tier cities tightened their hukou policy restrictions in an attempt
to control their city’s booming population. There are also large variations in hukou policy across
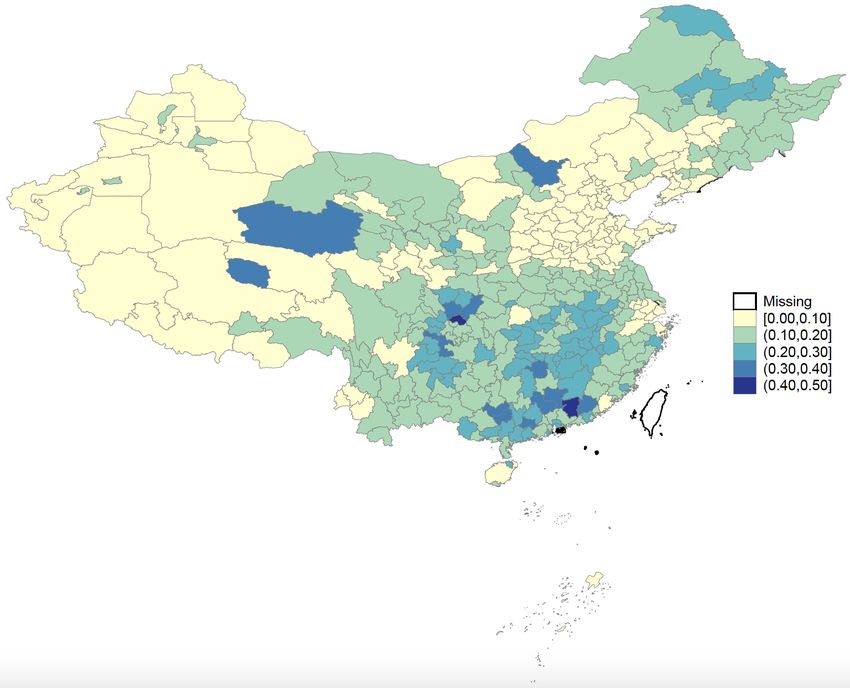
prefectures in China. Figure 1 plots the geographic distribution of the Hukou Index in 2012,
which ranges from 0.025 for Ngari prefecture in Tibet to 0.406 for Heyuan prefecture in the
coastal province of Guangdong. Note that the values of the Hukou Index in areas near Beijing
and Shanghai are generally low due to the stringent population control polices in these two
first-tier cities.
2.2 The New Rural Pension Scheme
No pension system was in place for rural China until September 2009, when the Chinese gov-
ernment began to gradually roll out the New Rural Pension Scheme (NRPS) across the country.
By the end of 2012, the NRPS was introduced to all rural counties in mainland China. Huang
and Zhang (2020) compiled the data on the timing of NRPS coverage across counties in China.
Based on their data, Figure 2 plots the NRPS’s county coverage rate over time across villages
in our sample.
Upon the introduction of the NRPS to a county, all people aged 16 years or older with rural
hukou in the county can participate in the scheme on a voluntary basis. All of the enrollees
aged 60 years or older at the start of the NRPS are eligible to receive the basic pension benefit
of 660 RMB (about 108 USD) per year, regardless of previous earnings or income. Enrollees
aged 45 and above need to pay the premiums continuously until they reach age 60 and enrollees
under age 45 need to pay the premiums continuously for at least 15 years, before they can
claim any pension benefits. Participants can choose from 100, 200, 300, 400 or 500 RMB as the
7Figure 1: Geographic Distribution of Hukou Index in 2012
level of their annual contribution. Pensioners can claim the pension benefits after age 60 and
the pension benefits consist of two parts: one is from the accumulated fund in the individual’s
account and the other is the basic pension benefit.
Since many migrant workers leave their children and elders behind in their rural homes,
the introduction of the NRPS lowers the intangible migration cost faced by working-age ru-
ral workers through the eldercare and childcare channels. The existing literature shows that,
with the new pension plan, the elders increase healthcare service consumption and rely less on
the eldercare provided by their children (Zhang and Chen, 2014; Eggleston et al., 2016), and
reallocate time from farm work to non-farm home production and to taking care of their grand-
children (Jiao, 2016; Huang and Zhang, 2020). These channels in effect reduce the migration
costs associated with dependent care and non-farm home production. We will use the data on
the timing of the introduction of the NRPS as an indicator of policy shocks for our empirical
analysis.
8Figure 2: NRPS Coverage Rate
1
.8
NRPS coverage rate
.4 .2
0 .6
2003 2004 2005 2006 2007 2008 2009 2010 2011 2012
Year
2.3 Origin-based Panel Data on Migration and Income
2.3.1 Description of the NFP Data
The main data we use in this paper is the annual National Fixed Point (NFP) Survey conducted
by the Research Center of Rural Economy (RCRE) of the Chinese Ministry of Agriculture
and Rural Affairs. The survey covers rural households in more than 300 villages from all 31
mainland provinces. The villages were selected for their representativeness based on region,
income, cropping pattern, population, and so on.5 It is designed to be a longitudinal survey,
following the same households over time, and has been conducted annually since 1986, with the
exceptions of 1992 and 1994 due to funding difficulties. The data have recently been used by
several researchers studying China’s agriculture. See, e.g., Adamopoulos et al. (2017), Kinnan
et al. (2018), Chari et al. (2020), and Tian et al. (2020). Benjamin et al. (2005) provide a
detailed description of the data and suggest that the data are of good quality.
The survey contains village-level, household-level, and, since 2003, individual-level question-
naires. At the village level, it collects information that includes population, collective assets,
village leader, etc, and at the household level, it surveys households’ agricultural production,
consumption, asset accumulation, employment, and income. Most existing studies use the
data for the years prior to 2003, which do not include detailed information about individual
household members. Due to the restrictions imposed by the hukou system, rural-urban migra-
5
In Table A.1, we show that the workers in the 2005 wave of the NFP share similar characteristics with the
workers with rural hukou in the 2005 China 1% Population Sampling Survey (mini census).
9tion in China is mostly temporary in nature and few households migrate to cities as a whole.
It is therefore critical to have information about individual household members for studying
rural-urban migration in China.
Unique to this study, we have access to annual waves of the data between 2003 to 2012 that
include an individual-level questionnaire in the survey. It asks for information on individuals’
age, gender, schooling attainment, industry of work, working days, etc. Most important, it
asks whether an individual migrated outside the township of her/his hukou residence for work
during each year of the survey. For those who answered yes, the survey also asks about their
earnings from working as a migrant worker. In each year of our sample period, the survey
covers approximately 20,000 households and 80,000 individuals from 350 villages in mainland
China.
For studying rural-urban migration, the NFP data have several advantages over other data
that are commonly employed in the studies on internal migration in China. Relative to repeated
cross-sectional data, such as the population census, the panel structure of the NFP better serves
identification purposes. Another advantage of the NFP over the population censuses is that
the NFP provides detailed information on individual income, whereas only the 2005 population
census includes income information. Different from other longitudinal surveys, such as the
Longitudinal Survey on Rural Urban Migration in China (RUMiC) and the China Family Panel
Study (CFPS), the NFP has a much more comprehensive sample coverage in both geographic
and time dimensions. It tracks both rural residents and migrants annually over 10 years. In
particular, given that it is an origin-based survey, its attrition rate is relatively low. In the raw
NFP data, 30% can be tracked for one year, 14% for two years, 10% for three years, 8% for
four years, and 38% for five or more years.6 In contrast, destination-based surveys of migrants
such as the RUMiC have very high attrition rates.
One drawback of the NFP data is that they include limited information on migration des-
tinations. We can only know whether a migrant is within home county, within home province,
or outside home province. For the surveys after 2009, we know the destination provinces but
not the destination cities. Hence, our analysis focuses on migration from the rural agricultural
sector to the urban non-agricultural sector, instead of spatial movements among provinces and
cities. For analyzing spatial allocation of labor, population census data are more suitable.
2.3.2 Construction of Key Variables
Now, we formally introduce some key variables constructed from the NFP data that are im-
portant to our analysis. More details are provided in Appendix A.
6
See Table A.2 for details.
10Sector of Employment and Migration. We define an individual as working in the non-
agricultural (na) sector in a particular year if she/he worked more than 180 days out of town
during that year, and working in the agricultural (a) sector otherwise. This classification aligns
with the definition of migrant workers by the National Bureau of Statistics (NBS) of China.
For workers who worked in town , but reported working in the non-agricultural sector, the NFP
unfortunately does not have information about their non-agricultural earnings. We thus treat
them as agricultural workers with the implicit assumption that a rural worker earns the same
wage in agriculture and local non-agriculture. Given our definition, we shall use “migration”
and “working in the non-agricultural sector” interchangeably throughout the paper.
Nominal Agricultural Earnings. The NFP survey provides detailed information on house-
hold agricultural production, including all inputs and output at the crop level. We compute the
gross output for each type of crop as the production multiplied by the corresponding market
price in that year. Intermediate inputs such as fertilizers and pesticides are also valued by
their market prices. We subtract expenditures on intermediate inputs from the gross output
to obtain the value-added for each type of crop. We aggregate the value-added of all crops to
the household level, which is then allocated to each household member based on the formula
below:
Individual’s working days in a
Individual earnings in a = × Household’s value-added from a
HH’s working days in a
Specifically, we construct individual earnings from agricultural production by apportioning
household agricultural earnings to each household member according to the number of working
days they each allocated to agricultural production. The annual income of rural workers is the
product of individual agricultural daily earnings and total within-town working days.
Nominal Non-agricultural Earnings. The NFP survey also asks each household member the
number of days they worked out of town and the corresponding earnings. Non-agricultural
annual earnings is defined as the earnings made when individuals work outside of their home
town.
Real Earnings. We deflate all nominal earnings into 2003 Beijing prices using province-level
spatial price deflators constructed by Brandt and Holz (2006), so that the measures reflect the
real incomes from different sectors. For workers in agriculture, we deflate their annual earnings
by the rural price index of the province in which their village is located. For workers in the
out-of-town non-agricultural sector, their migration destination is unobserved during the period
of 2003-2008. To deflate their incomes, we proceed as follows. First, we use the 2000 Population
Census to calculate the shares of out-migrants to different provinces for each prefecture. Second,
11we map the villages to prefectures, and based on the predetermined migration shares, construct
the weighted average of urban price indices across different destination provinces for each village.
The annual earnings of out-migrants is deflated by this weighted urban price index. For the
remainder of the paper, all earnings refer to real annual earnings unless stated otherwise. The
total annual income is the sum of the earnings from agriculture and non-agriculture.
2.3.3 Basic Facts
Our analysis focuses on the sample of individuals aged between 20 and 54 with no more than 12
years of schooling, and who appear at least two times in our sample period of 2003 to 2012. We
make the age restriction because we want to focus on those of the working-age population who
have finished schooling but are not close to the eligible age (60) for receiving the rural pension
income. We also exclude individuals with more than 12 years of schooling because there are
very few of them in the data. We additionally restrict the sample to those who can be observed
for at least two years, as our individual fixed-effect model requires repeated observations. After
the restriction, we obtain 51,688 individuals with 234,031 individual-year observations. Among
them, 25% are tracked for two years, 18% for three years, 14% for four years, and 43% for
five or more years. We trim the sample at the top 1% and bottom 1% of the annual income
distribution in the agricultural and non-agricultural sector, respectively.
Table 2 reports summary statistics of the data. About 30% of workers in our sample
migrated out of town to work in non-agriculture at some time during the sample period. The
means of log annual earning in agriculture and non-agriculture are 8.63 and 9.26, respectively,
which implies that the raw average income gap between the agricultural workers and migrant
workers in the non-agricultural sector is 63 log points. The variance of log annual earnings
is smaller for the migrant workers than that for the agricultural workers. Note that we are
comparing agricultural workers to migrant workers who were born in rural areas, not to the
whole population of non-agricultural sector workers, which would also include urban residents.
Most of these migrant workers work in low-skill manufacturing and service jobs,7 which may
explain the lower dispersion of their earnings.
Table 2 also shows that, in general, migrant workers are younger and healthier, have higher
educational attainment, and and are more likely to be male and have an elderly household
member aged 60 or above. The differences between agricultural and migrant workers suggest
that there is sorting of workers along these observable individual and household characteristics.
It is likely that there is also sorting along other unobserved or hard-to-measure characteristics.
We next present an empirical framework for dealing with the issue of worker sorting or selection
7
See Figure A.2 in Appendix A.
12in estimating the underlying APG.
Table 2: Summary Statistics
Sample: All Non-agri Agri
ln Daily wage 3.499 3.571 3.468
(0.906) (0.628) (1.002)
ln Annual income 8.827 9.265 8.635
(1.001) (0.628) (1.078)
Total working days 237.387 303.441 208.493
(101.408) (44.075) (105.777)
Share of working days in:
Within-town agri production 0.554 0.036 0.780
(0.435) (0.078) (0.318)
Within-town non-agri production 0.122 0.006 0.173
(0.258) (0.032) (0.294)
Out-of-town 0.324 0.958 0.047
(0.443) (0.086) (0.163)
Age 37.981 31.855 40.660
(10.091) (8.865) (9.403)
Years of Schooling 7.277 8.149 6.895
(2.431) (2.045) (2.488)
Female 0.469 0.330 0.530
(0.499) (0.470) (0.499)
Poor health status 0.012 0.003 0.015
(0.107) (0.057) (0.122)
Agricultural Hukou 0.976 0.962 0.983
(0.151) (0.192) (0.129)
Arable land per capita 2.184 1.394 2.530
(2.855) (1.674) (3.178)
Household with an elderly aged ≥60 0.279 0.343 0.251
(0.448) (0.475) (0.433)
Number of observations 234031 71218 162813
Share of workers 1 0.304 0.696
Notes: Standard deviation in parentheses.
3 A Framework for Empirical Analysis
This section presents a generalized Roy model of rural agriculture to urban non-agriculture
migration that will serve as a framework for our empirical analysis of migration costs, sorting,
and the APG. Some of the propositions that we state in this section are not new and well-known
in the literature on generalized Roy models. However, we think it is useful to present them in
our context to clarify what objects of interests are estimated by different empirical methods,
13respectively, in the APG literature. Furthermore, we clarify how the selection bias is affected
by migration costs.
3.1 Technologies and Labor Earnings in the Two Sectors
There are two sectors, agricultural and non-agricultural, which are denoted by a and na, re-
spectively. The production technologies of the two sectors are:
Ya = Aa Ha , Yna = Ana Hna . (1)
Here Hj represents the total efficiency units of labor in sector j = a, na. The real wage per
efficiency unit of labor in the two sectors are:
w a = pa A a , wna = pna Ana , (2)
where pj is the price of the sector-j good relative to the price of consumption, j = a, na.
Each worker is endowed with a vector of observed characteristics X, and a vector of unob-
served “individual productivity” denoted by U = (Ua , Una ). The latter represents the innate
abilities of being a worker in the agricultural and non-agricultural sectors, respectively. Without
loss of generality, we normalize the mean of U to zero. We assume that an individual worker’s
efficiency units of labor in the two sectors are given by the following human capital functions:
ha (X, U ) = exp(Xβ + Ua ), hna (X, U ) = exp(Xβ + Una ). (3)
So, the worker’s real potential earnings in the two sectors are:
ya (X, U ) = wa exp(Xβ + Ua ), yna (X, U ) = wna exp(Xβ + Una ). (4)
3.2 Productivity Differences, Migration Costs and Sorting
The agricultural and non-agricultural sectors are located in the rural and urban areas, respec-
tively.8 A worker can always choose to work in the agricultural sector. If she chooses to work
in the non-agricultural sector, however, she has to pay a migration cost that is proportional to
her wage in the non-agricultural sector. So, her net income is (1 − θ)yna (X, U ), where θ is the
proportional migration cost. Let Mc = − ln(1 − θ) be a monotonic transformation of θ. We
8
We ignore non-agricultural production in rural areas because the NFP data do not have good information
about worker earnings from rural non-agricultural jobs. We introduce rural non-agricultural production in our
general equilibrium analysis in Section 6.
14assume that it takes the following form:
Mc = m(X, Z),
where Z is an observable vector that represents the policy environment the worker faces. Hence-
forth, we shall refer to m(X, Z) simply as the migration cost.
A worker will choose to migrate to the non-agricultural sector if the following inequality
holds:
(1 − θ)yna (X, U ) = yna (X, U ) exp(−m(X, Z)) > ya (X, U ),
and stays in the agricultural sector otherwise. Let R = ln (wna /wa ) be the underlying real wage
difference between the agricultural and non-agricultural sectors, which we will simply refer to
as the underlying APG. Then, from equation (4), the inequality above is equivalent to
Una − Ua > m(X, Z) − R. (5)
Migration condition (5) says that a rural worker will migrate to the non-agricultural sector if
and only if her comparative advantage in the non-agricultural sector is higher than the net
migration cost m(X, Z) − R.
We assume that U is i.i.d. across individual workers and independent of (X, Z). We also
assume that V = Una − Ua has a continuous and strictly increasing distribution function. Let
F (·) be the CDF of V . Conditional on (X, Z), the proportion of workers who migrate to the
non-agricultural sector is
πna (X, Z) = 1 − F (m(X, Z) − R) , (6)
and the aggregate proportion of workers who migrate to the non-agricultural sector is
π̄na = 1 − E [F (m(X, Z) − R)] . (7)
3.3 Selection Bias of Observed APG
The observed log earnings are given by
ln y(X, U ) = ln(wa ) + 1(j = na)R + Xβ + Ua + 1(j = na)(Una − Ua ). (8)
15Let ROLS be the observed difference in average log earnings of agricultural and non-agricultural
workers, or observed APG. We have
ROLS = E [ln (yna (X, U )) |V > m(X, Z) − R] − E [ln (ya (X, U )) |V ≤ m(X, Z) − R] .
Again, from (4), we have,
ROLS = R + E [Una |V > m(X, Z) − R] − E [Ua |V ≤ m(X, Z) − R] . (9)
| {z }
selection bias
Due to heterogeneous innate abilities and sorting, the observed APG is generally different from
the underlying APG. The last two terms in equation (9) show the selection bias or the effect
of sorting on the deviation of the observed APG from the underlying APG. The following
proposition shows how the migration cost affects the selection bias.
Proposition 1: If E[Una |Una − Ua > x] and E[Ua |Ua − Una > x] are both increasing functions
of x for x ∈ (−∞, ∞), then the selection bias ROLS − R is increasing with m(X, Z) − R.
Proof: All proofs of propositions in this paper are in Appendix B.
Intuitively, the assumption in Proposition 1 requires that an individual’s comparative ad-
vantage and absolute advantage are positively correlated for both sectors. This assumption
holds, for example, if (exp(Ua ), exp(Una )) has a bi-variate Fréchet
n distribution
o or (Ua , Una ) has
a bi-variate normal distribution and Corr(Ua , Una ) < min σσna a
, σσna
a
. Under this assumption,
the selection bias term in (9) is increasing with the net migration cost. Therefore, the larger the
net migration cost, the more likely it is that the observed APG is higher than the underlying
APG.
If Ua and Una have a symmetric joint distribution, as is often assumed in the quantitative
migration literature (e.g. Bryan and Morten, 2019; Tombe and Zhu, 2019; and Hao et al.,
2020), we can further characterize the selection bias as follows.
Proposition 2: If the joint distribution of Ua and Una are symmetric with respect to Ua and
Una , then the selection bias is zero if the net migration cost m(X, Z)−R is zero. If, in addition,
the assumption in Proposition 1 holds, then, the selection bias ROLS − R is positive, zero, or
negative if and only if net migration cost m(X, Z)−R is positive, zero, or negative, respectively.
Note that the symmetry assumption in Proposition 2 has a very strong implication that the
16observed APG has a selection bias if and only if there is non-zero net migration cost. Therefore,
a positive observed APG implies that either the underlying APG is positive or the net migration
cost is positive.
Finally, if (Ua , Una ) follows a bi-variate normal distribution, we have the following well-
known expression for the selection bias (see, e.g., Heckman and Honore, 1990).
φ( R−m(X,Z)
σv
) φ( R−m(X,Z)
σv
)
ROLS − R = σna ρna,v + σa ρa,v , (10)
Φ( R−m(X,Z)
σv
) 1 − Φ( R−m(X,Z)
σv
)
where σa , σna , and σv are the standard deviations of Ua , Una , and V = Una − Ua , respectively,
and ρa,v and ρna,v are the correlations of V with Ua and Una , respectively. In the special case
where m(X, Z) = R, equation (10) becomes:
r r
2
2 2 σna − σa2
ROLS − R = (σna ρna,v + σa ρa,v ) =
π π σv
So, in the case of zero net migration cost, the observed APG has a positive bias if and only
if the dispersion of innate abilities is larger in the non-agricultural sector than in the agricul-
tural sector. If the dispersion is actually larger in the agricultural
n sector,o the observed APG
σna σa
underestimates the underlying APG. If Corr(Ua , Una ) < min σa , σna , the assumption of
Proposition 1 holds. In this case, if the net migration cost is sufficiently large, the observed
APG will overestimate the underlying APG.
In summary, the selection bias depends critically on both the distribution of abilities and
the net migration costs faced by individuals. Next, we turn to the empirical methods for dealing
with the selection bias problem.
3.4 Empirical Methods
In the literature on APG, there are two commonly used methods in dealing with the selection
bias problem. The first method assumes that the distribution of (Ua , Una ) or (exp(Ua ), exp(Una ))
takes a particular functional form, e.g., a multivariate Fréchet or multivariate normal distribu-
tion, and uses the moment matching method to estimate the distribution parameters, underlying
APG, and migration costs. See, e.g., Lagakos and Waugh (2013), Adamopoulos et al. (2017),
Pulido and Świecki (2018), Tombe and Zhu (2019), and Hao et al. (2020). As pointed out
by Heckman and Honore (1990), however, the identification of Roy models is not robust to
alternative distribution assumptions, and the estimation results are also not robust, depending
critically on the functional form assumptions.
17More recently, several authors have adopted a second method, using the observed labor
returns of new migrant workers or sector switchers in panel data as estimates of the APGs.
See, e.g. Herrendorf and Schoellman (2018), Alvarez (2020), and Hamory et al. (2021). While
this method does not rely on strong functional form assumptions, it is not clear what the
observed labor returns of sector switchers really measure. Both Pulido and Świecki (2018) and
Lagakos et al. (2020) provide examples showing that these returns may over- or under- estimate
the underlying APGs if the shocks that caused workers to switch sectors are correlated with
individual comparative advantages. Also, Schoellman (2020) argues heuristically that, if the
income or migration cost shocks are independent of individual comparative advantages, the
estimated return to migration for switchers is not the underlying APG but a measure of the
average migration cost faced by the switchers before the shocks hit.
So, neither of the two commonly used methods in the APG literature is ideal for dealing
with the selection bias problem. We consider a different method in this paper. The model
we presented belongs to a class of models that are called generalized Roy models. There is
an extensive literature in labor economics and applied econometrics on the identification and
estimation of generalized Roy models. See, e.g., Card (2001), Eisenhauer et al. (2015), and
Cornelissen et al. (2016). We apply the insights from this literature for identification and
estimation of our model. Using the terminology of this literature, the underlying APG is the
average treatment effect (ATE) of migration:
R = E [ln (yna (X, U )) − ln (ya (X, U ))] .
To control for selection bias, the literature suggests using either field or natural experiments. For
the case of China, we will use the gradual implementation of the NRPS as a policy experiment
and a control function approach to estimate the ATE or the underlying APG. Specifically, we
estimate equation (8) controlling for proxies for the selection terms E[Ua |1(j = na), X, Z] and
E[(Una − Ua )|1(j = na), X, Z]. The basic idea is to make some assumptions about the nature
of the covariances between unobserved components Una and Ua and the observable variables
1(j = na), X, and Z.9 Following Card (2001) and Cornelissen et al. (2016), the proxies are the
transformations of the residuals obtained from the selection equation with the policy variable
Z as the excluded cost shifters. If we assume a joint normal distribution for U, the approach
9
Equation (8) implies that
E[ln y(X, U )|1(j = na), X, Z] = ln(wa ) + 1(j = na)R + Xβ
+ E[Ua |1(j = na), X, Z] + 1(j = na)E[(Una − Ua )|1(j = na), X, Z].
With the controls for E[Ua |1(j = na), X, Z] and E[(Una − Ua )|1(j = na), X, Z], one may identify R by OLS
estimation and obtain the ATE.
18can also be modified by explicitly accounting for the binary nature of the endogenous variable
and replacing the selection terms by a generalized residual based on the inverse Mills ratio from
a first stage probit regression (Wooldridge, 2015).10 We will present the results of the control
function approach with and without the normality assumption.
Using the policy experiment, we also estimate the local average treatment effect (LATE) that
reveals the average labor return of workers whose migration decisions are marginally affected
by the policy. We can show that, under the exclusion assumption of the policy instrument, the
LATE estimate of return to migration is also an estimate of the average migration cost faced
by these marginal workers. To see this, consider a change in policy variable Z that reduces the
migration cost and satisfies the exclusion restriction; i.e., ∆m = m(X, Z) − m(X, Z 0 ) > 0 is
independent of U . Then, the LATE estimate of the return to migration can be formally written
as follows:
RLATE = E [ln (yna (X, U )) − ln (ya (X, U )) |m(X, Z) − R − ∆m < V < m(X, Z) − R] .
(11)
We prove the following proposition in Appendix B.
Proposition 3: If the migration cost change ∆m is independent of individual comparative
advantage in the non-agricultural sector, V = Una − Ua , then,
E [m(X, Z)f (m(X, Z) − R)]
lim RLATE = , (12)
∆m→0 E [f (m(X, Z) − R)]
where f (.) is the PDF of V .
Intuitively, a small migration cost change only induces workers who are ex-ante indifferent
between the a and na sectors to migrate. When they switch sectors, the change in income
reveals their baseline migration cost.
10
Specifically, with the joint normal assumption of U ,
E[Ua |1(j = na), X, Z] + 1(j = na)E[(Una − Ua )|1(j = na), X, Z]
φ( R−m(X,Z)
σv ) φ( R−m(X,Z)
σv )
= σa ρa,v (1 − 1(j = na)) + σna ρna,v 1(j = na) .
1 − Φ( R−m(X,Z)
σv ) Φ( R−m(X,Z)
σv )
194 Reduced-Form Analysis
Having laid out the empirical framework, we now turn to the empirical analysis of rural-to-
urban migration in China. We start with a simple cross-sectional comparison of the labor
productivity in the two sectors.
4.1 Cross-Sectional Estimation of Returns to Migration
We estimate the following regression equation:
ln yihjt = γ1 N onAgriihjt + Xihjt γ2 + ϕj + ϕpt + νihjt , (13)
where yihjt denotes the year-t annual earnings of individual i who belongs to household h in
village j; N onAgriihjt is a binary indicator for employment in sector na. Xihjt is a vector of
individual and household characteristics, including four age group dummies (20-29, 30-39, 40-
49, and 50-54), four educational attainment group dummies (illiterate, primary school, middle
school, and high school), a dummy for gender, a dummy for poor health, arable land per capita,
type of hukou, a dummy indicating whether there is an elderly aged 60 or above residing in the
household, and the share of months in year t that the NRPS has been in effect; ϕj denotes the
village fixed effects, which absorbs all time-invariant village-specific determinants of income;
we also include province×year fixed effects ϕpt , which flexibly control for unobserved income
shocks at the province level. Standard errors are clustered at the village×year-level to account
for unobserved shocks that are correlated across individuals residing in the same village in the
same year.
Table 3 reports the OLS regression results. We find in column (1) that, unconditional on
inidividual characteristics, annual earnings in sector na are on average 64 log points higher
than those in sector a. As is shown in Column (2), the estimate changes slightly to 68 when
the individual controls are included. Columns (3) includes three indicator variables which are
defined based on the migration status in period t−1 and t: a-to-na switchers, na-to-a switchers,
and sector-na stayers. The stayers in sector a constitute the omitted group. Therefore, the
estimates reflect the income gaps relative to the stayers in agriculture. The income gap is 60 log
points for a-to-na switchers, and 68 log points for sector-na stayers. This finding suggests that
a large portion of the income gains is realized upon migration. Interestingly, relative to sector-a
stayers, na-to-a switchers have a lower annual income, suggesting that there are factors other
than income, such as idiosyncratic shocks to migration costs or preferences, that also affect
workers’ migration decisions.
20Table 3: Sector of Employment and Annual Earnings: OLS
Dep. Var.: ln Annual Earnings (1) (2) (3)
NonAgri 0.6449*** 0.6814***
(0.0122) (0.0119)
a-to-na switchers 0.5979***
(0.0145)
na-to-a switchers -0.0405**
(0.0183)
Sector-na stayers 0.6757***
(0.0140)
Individual and household controls N Y Y
Province× Year FE Y Y Y
Village FE Y Y Y
Observations 234,025 234,025 157,985
R-squared 0.3422 0.3904 0.3868
Notes: Individual controls include four age group dummies (20-29, 30-39, 40-49, and
50-54), four educational attainment group dummies (illiterate, primary school, middle
school, and high school), a dummy for gender, a dummy for poor health, arable land
per capita, type of Hukou, a dummy indicating whether there is an elderly aged 60
or above residing in the household, and the share of months in year t that the NRPS
has been in effect. Robust standard errors are clustered at the village×year level. ***
pTable 4: Sector of Employment and Annual Earnings:
Individual Fixed Effects
Dep. Var.: ln Annual Earnings (1) (2)
NonAgri 0.6916***
(0.0137)
a-to-na switchers 0.6221***
(0.0184)
na-to-a switchers 0.0084
(0.0189)
Sector-na stayers 0.6998***
(0.0185)
Individual and household controls Y Y
Province× Year FE Y Y
Individual FE Y Y
Observations 234,025 144,049
R-squared 0.6810 0.6920
Notes: Individual controls include four age group dummies (20-29, 30-
39, 40-49, and 50-54), four educational attainment group dummies (il-
literate, primary school, middle school, and high school), a dummy for
gender, a dummy for poor health, arable land per capita, type of Hukou,
a dummy indicating whether there is an elderly aged 60 or above residing
in the household, and the share of months in year t that the NRPS has
been in effect. Robust standard errors are clustered at the village×year
level. *** pthe shocks hit. Hence one interpretation of the difference in the results between China and
the other countries studied in the literature is that migration costs are larger in China than in
these other countries due to China’s rigid hukou system that explicitly restricts rural-to-urban
migration.
A caveat of the above interpretation is that sectoral switch could be endogenous, and hence
the FE estimate would be biased. More specifically, if workers have heterogeneous comparative
advantage and if (for example) the reductions in migration costs are larger for individuals with
a higher comparative advantage in the non-agricultural sector, then, sector switchers are more
likely to have a higher return to migration. In such a case, the FE estimate captures neither the
underlying APG nor the baseline average migration cost. To address this problem, we need to
find exogenous shocks to migration costs that are uncorrelated with migrant workers’ potential
earnings. The gradual county-by-county implementations of the NRPS in China constitute
such shocks.
4.3 The NRPS and IV Estimation of Migration Costs
As is discussed in Section 2, the migration costs of the younger household members may be
altered due to the NRPS through the channels of eldercare or childcare. Moreover, the effect of
the NRPS on sector choice may vary by household depending on the presence of elderly aged
60 or above who are entitled to the NRPS pension benefits. Therefore, our IV strategy employs
Elder60hjt × N RP Sjt to generate exogenous variation in N onAgriihjt ,
The first-stage regression is:
N onAgriihjt = β1 Elder60hjt × N RP Sjt + Xihjt β2 + ϕj + ϕpt + νihjt , (14)
where N RP Sjt captures the share of months in year t that the NRPS covers the elderly in
village j. Elder60hjt is an indicator variable that equals one if there is an elderly aged 60 or
above residing in the household. Note that Xihjt contains N RP Sjt and Elder60hjt to account
for their independent effects on sectoral choice. The second-stage of the IV estimation is:
ln yihjt = γ1 N onAgri
d ihjt + Xihjt γ2 + ϕj + ϕpt + uihjt , (15)
where N onAgri
d ihjt is predicted value from the first-stage regression in the IV framework.
Conceptually, instrumenting for the sector of employment with the interaction term Elder60hjt ×
N RP Sjt is similar to a triple-difference estimation strategy. A simple difference-in-difference
estimation would capture the change in the likelihood of non-agricultural employment induced
23You can also read