A Mechanistic Site-Of-Action Model: A Tool for Informing Right Target, Right Compound, And Right Dose for Therapeutic Antagonistic Antibody Programs
←
→
Page content transcription
If your browser does not render page correctly, please read the page content below
ORIGINAL RESEARCH
                                                                                                                                   published: 03 September 2021
                                                                                                                                   doi: 10.3389/fbinf.2021.731340

                                             A Mechanistic Site-Of-Action Model: A
                                             Tool for Informing Right Target, Right
                                             Compound, And Right Dose for
                                             Therapeutic Antagonistic Antibody
                                             Programs
                                             Georgi I. Kapitanov 1*, Jeffrey R. Chabot 1, Jatin Narula 1, Mahua Roy 1, Hendrik Neubert 2,
                                             Joe Palandra 2, Vahid Farrokhi 2, Jay S. Johnson 2, Robert Webster 1 and Hannah M. Jones 1
                                             1
                                               BioMedicine Design, Pfizer Worldwide R&D, Cambridge, MA, United States, 2BioMedicine Design, Pfizer Worldwide R&D,
                                             Andover, MA, United States

                                             Quantitative modeling is increasingly utilized in the drug discovery and development
                                             process, from the initial stages of target selection, through clinical studies. The
                           Edited by:        modeling can provide guidance on three major questions–is this the right target, what
                       Morgan Craig,
       University of Montreal, Canada
                                             are the right compound properties, and what is the right dose for moving the best possible
                        Reviewed by:
                                             candidate forward. In this manuscript, we present a site-of-action modeling framework
                       Yanguang Cao,         which we apply to monoclonal antibodies against soluble targets. We give a
University of North Carolina at Chapel       comprehensive overview of how we construct the model and how we parametrize it
                    Hill, United States
                    Patrick Glassman,        and include several examples of how to apply this framework for answering the questions
           University of Pennsylvania,       postulated above. The utilities and limitations of this approach are discussed.
                          United States
                                             Keywords: site of action, PKPD, QSP, modeling and simulation, LC-MS
                 *Correspondence:
                  Georgi I. Kapitanov
         georgi.kapitanov@pfizer.com
                                             INTRODUCTION
                   Specialty section:        Modeling and simulation tools have become an essential part of the drug development process
        This article was submitted to
                                             (Norris et al., 2000; Lalonde et al., 2007; Barrett et al., 2008; Edginton et al., 2008; Mager and Jusko,
    Drug Discovery in Bioinformatics,
              a section of the journal
                                             2008; Rajman, 2008; Jones et al., 2009; Allerheiligen, 2010; van der Graaf and Benson, 2011; Zhao
           Frontiers in Bioinformatics       et al., 2011; Jones et al., 2012a; Knight-Schrijver et al., 2016; Danhof et al., 2018; Nijsen et al., 2018).
                                             Applying quantitative analyses early in the drug discovery can be very informative for selecting and
            Received: 02 July 2021
        Accepted: 23 August 2021
                                             de-selecting those programs with the best/least chance of clinical success. Traditional
     Published: 03 September 2021            pharmacokinetics/pharmacodynamics (PKPD) models, while still widely utilized (Meibohm and
                                             Derendorf, 1997; Derendorf and Meibohm, 1999; Rajman, 2008), have gradually given place to
                              Citation:
  Kapitanov GI, Chabot JR, Narula J,
                                             increased mechanistic modeling complexity, with the intent to achieve higher predictive accuracy
       Roy M, Neubert H, Palandra J,         and mechanistic insights. These mechanistic modeling techniques include systems biology (SB)
  Farrokhi V, Johnson JS, Webster R          (Kitano, 2005; Kohl et al., 2010; Benson et al., 2011), quantitative systems pharmacology (QSP)
 and Jones HM (2021) A Mechanistic           (Hopkins, 2008; Allerheiligen, 2010; van der Graaf and Benson, 2011; van der Graaf, 2012; Jusko,
     Site-Of-Action Model: A Tool for        2013; Rogers et al., 2013; Peterson and Riggs, 2015; Knight-Schrijver et al., 2016; Danhof et al., 2018;
         Informing Right Target, Right
                                             Nijsen et al., 2018; Cucurull-Sanchez et al., 2019), and physiologically based pharmacokinetics
      Compound, And Right Dose for
              Therapeutic Antagonistic
                                             (PBPK) (Baxter et al., 1994; Andersen, 1995; Baxter et al., 1995; Hoang, 1995; Arundel, 1997; Blakey
                   Antibody Programs.        et al., 1997; Nestorov et al., 1998; Grass and Sinko, 2002; Aarons, 2005; Jones et al., 2006a; Jones et al.,
           Front. Bioinform. 1:731340.       2006b; Cai et al., 2006; Barton et al., 2007; Nestorov, 2007; Edginton et al., 2008; Loizou et al., 2008;
      doi: 10.3389/fbinf.2021.731340         Jones et al., 2009; Chabot et al., 2011; Jones et al., 2011; Jones et al., 2012a; Jones et al., 2012b; Bouzom

Frontiers in Bioinformatics | www.frontiersin.org                                 1                                    September 2021 | Volume 1 | Article 731340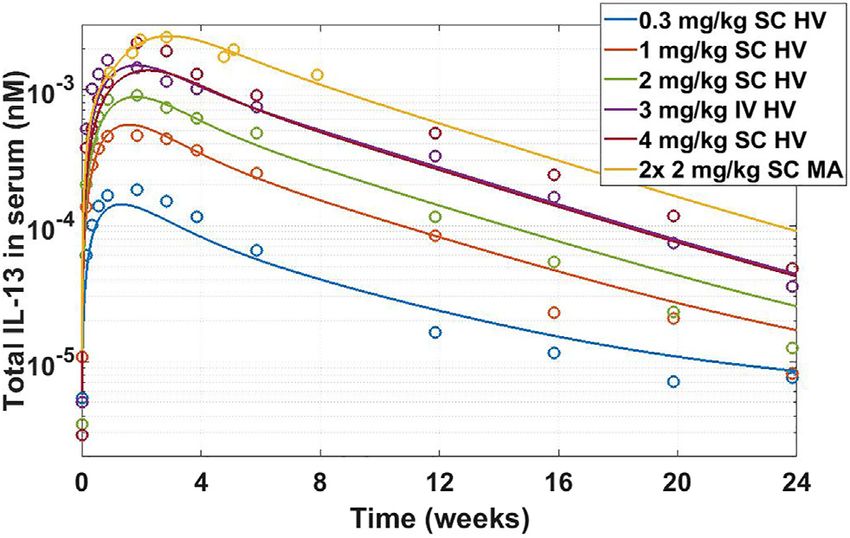
Kapitanov et al.                                                                                     Site-Of-Action Model for Antagonistic Antibodies

et al., 2012; Huang and Rowland, 2012; Rostami-Hodjegan et al.,           SoA Model Methodology of this manuscript will be
2012; Shah and Betts, 2012; Zhao et al., 2012; Jones et al., 2013).       demonstrating its utility by several real-world examples. The
Traditional empirical PKPD models are useful in predicting                modeling work is highly dependent on robust assays to inform
dosing and estimating pharmacology/efficacy in later stage                 the parametrization of the model (biomeasures), which is yet
clinical development and translation from pre-clinical animal             another important expansion to the work presented in Tiwari
models to humans. However, an extensive amount of pre-clinical            et al. 2016a. We have listed the typical assays and input data
PKPD data is needed to utilize them which limits their ability to         used in the Target Parameters section. For the purposes of this
be used to make early pre-clinical recommendations, before lead           article, we will focus on soluble targets. Membrane targets
candidates are defined. In contrast, the mechanistic models, while         deserve to be covered in a separate manuscript, both in
often complex and computationally intensive, appear more                  terms of the modeling approach, as well as in terms of
suitable for overall disease and molecule modality                        utilizing the range of biomeasure assays and tools for
recommendations.                                                          supporting the modeling efforts.
    Early stage biologics drug discovery programs concern
themselves with three main questions: (1) is the proposed
target biologically relevant and is hitting the target feasible;          MODEL STRUCTURE AND METHODS OF
(2) what are the drug characteristics that would allow for                PARAMETRIZATION
biomarker modulation or efficacy; (3) what is the efficacious
dose in humans? These three questions can be summarized as                The model is an extension of a drug-target mechanistic binding
three components to each project: right target, right                     two-compartment model that accounts for the relevant disease
compound, right dose. Considering the high number of                      tissue, which is referred to as site of action (SoA). Free plasma
potential new targets, a flexible mechanistic modeling                     drug (with concentration DP in plasma volume VP ) distributes
framework is needed that can be used to perform                           into non-specific (peripheral with volume VT ) and SoA
sensitivity analysis on a discrete number of parameters.                  (disease-specific with volume VS ) compartments. In plasma
This approach would quickly pinpoint gaps in knowledge                    and at the SoA, the drug binds reversibly to target protein
that can be tested experimentally and make timely                         (with concentrations TP and TS , respectively) to form a drug-
recommendations for each of the three components of                       target complex (with concentrations CP and CS , respectively).
project development. Therefore, for this purpose, one                     The binding kinetics are characterized by a second-order
needs a model that is on the spectrum of complexity                       association (kon ) and first-order dissociation (koff ) rate
somewhere between the traditional PKPD and the                            constants. The model assumes target synthesis and
multiscale systems biology models. We propose a site-of-                  degradation both in the central and the SoA compartments
action (SoA) model for assisting in the discovery and                     (expressed by the zero order rates ksynS , and ksynP and first
development of biologics.                                                 order rates kdegTp and kdegTs , respectively), target distribution
    The site-of-action model extends a two compartment PKPD               between plasma and the SoA (kpsT and kspT ), and drug - target
model by including the mechanistic interactions of the drug               complex distribution between plasma and SoA (kpsC and kspC )
and its target (e.g., binding, unbinding and drug-target                  and elimination in plasma only (kelC ). The modeling
complex clearance), the relevant properties of the target, as             equations are:
well as a separate compartment that models the tissues in                          dDP             VS       VT
which the disease progresses (a so-called site of action)                               A + ksp DS + ktp DT − kps DP − kpt DP
                                                                                    dt             VP       VP
(Brodfuehrer et al., 2014). Such a model can be                                                                                                  (1)
implemented rapidly since it captures only the relevant
                                                                                            + koff CP − kon DP TP − kel DP
biology and is expressed through a discrete number of
differential equations, variables, and parameters, which
                                                                                     dDS         VP
allows for extensive sensitivity analysis to identify the                                 kps DP − ksp DS + koff CS − kon DS TS                 (2)
important parameters and biological assumptions that need                             dt         VS
to be investigated further. Hence, this model should be
                                                                                               dDT         VP
considered a starting point from which to build out specific                                         kpt DP − ktp DT                             (3)
models of the biology of different targets, its main utility being                              dt         VT
in early stage projects.
                                                                              dCP          VS
    A previous iteration of the model has been described by                        kspC CS − kpsC CP + kon DP TP − koff CP − kelC CP            (4)
Tiwari et al. 2016a and used for assessing sensitivity of the                  dt          VP
projected target neutralization to target concentrations (Tiwari
                                                                                    dCS          VP
et al., 2016a) and antibody affinity (Tiwari, et al, 2017). The                           kpsC CP − kspC CS + kon DS TS − koff CS                (5)
                                                                                     dt          VS
current iteration makes minor changes to the old model
structure and goes into more detail in explaining the reasons              dTP          VS
for certain modeling and parameter value choices. We have                       kspT TS − kpsT TP + koff CP − kon DP TP + ksynP − kdegTp TP
                                                                            dt          VP
implemented this approach successfully since, and, beyond the
theoretical treatment in Tiwari et al. 2016a, in Applications of                                                                           (6)

Frontiers in Bioinformatics | www.frontiersin.org                     2                                 September 2021 | Volume 1 | Article 731340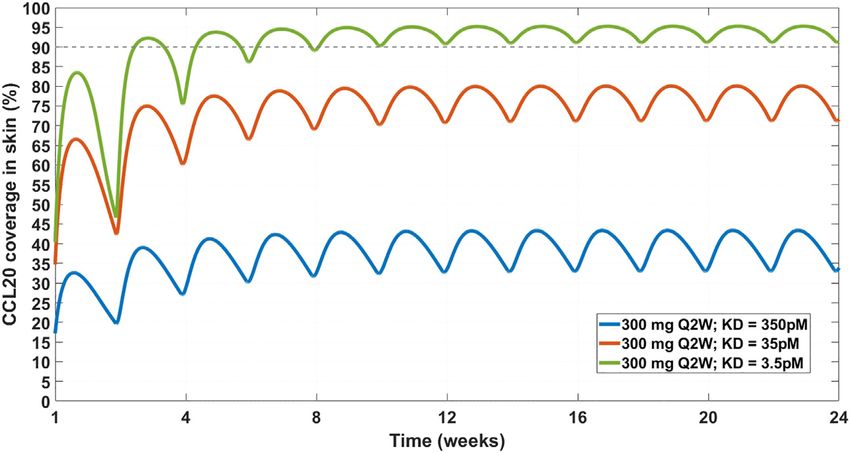
Kapitanov et al.                                                                                                 Site-Of-Action Model for Antagonistic Antibodies

   dTS          VP
        kpsT TP − kspT TS + koff CS − kon DS TS + ksynS − kdegTs TP
    dt          VS
                                                                    (7)
where Di , Ci and Ti represent the concentrations of free drug,
drug-target complex, and free target in plasma (i  P), or SoA
(i  S) compartment, respectively. DT is the free drug
concentration in the peripheral tissue compartment. A is the
drug influx function, which is administration dependent.
    A schematic of the modeling reactions is shown in Figure 1.
Table 1 lists the variables and parameters contained in the system
of differential equations, with explanations.
    The initial conditions of the variables above appear with a 0
after the subscript: DP0 is initial drug concentration in the plasma,
TS0 is initial target concentration at the SoA, etc.                           FIGURE 1 | SoA Model Scheme: A diagram describing the distribution
                                                                               and elimination of the mAb (denoted by D), synthesis, distribution and
    Table 2 presents the value of A and initial conditions related to          elimination of the target (denoted by T) and the interactions between the mAb
the drug variables dependent on administration route. Other                    and target and the distribution and elimination of the resulting mAb:
administration routes can be incorporated as well.                             target complex (denoted by C). Subscripts describe the compartments - p for
                                                                               plasma, t for peripheral tissues, s for the site of action. Detailed descriptions of
                                                                               all variables and parameters are in Model Structure and Methods of
                                                                               Parametrization and Table 1.
PARAMETER DETERMINATION
The next few sections will discuss how the different parameters                  The following method can account for any ratio deemed
are estimated and suggest typical assumptions for their values.               appropriate for the particular project.
Initial parametrization of the model may be obtained from the                    The calculations for the drug distribution constants presented
literature or data repositories. However, when such information is            here have two simultaneous aims: to retain mAb plasma PK and
unavailable, experimental determination of key model                          maintain the average concentration ratio (expressed as the
parameters may be required. Some of the experimental                          parameter ratio) between the SoA and the plasma
methods discussed here may not be applicable, appropriate, or                 compartments (ratio of areas under the curve (AUCs) is
even possible for particular targets. A conversation among                    equivalent). The following relationships are derived based on
modelers, biologists, and biomeasure analysts would determine                 steady state analysis of total mAb concentration
the most appropriate path to appropriate parametrization of                   pharmacokinetics:
the model.
                                                                                                                                VS
                                                                                                              kps  ratio ksp                                         (8)
Drug Distribution Parameters                                                                                                    VP
Monoclonal antibody (mAb) PK typically shows biphasic                                                                Q
behavior and such data can be modeled using two-                                                               kpt     − kps                                         (9)
                                                                                                                     VP
compartmental models, resulting in the estimation of 4 PK                                                             VP kpt
parameters (e.g., V1, Cl, Q and V2) (Betts et al., 2018). A                                                     VT          ,                                   (10)
                                                                                                                        ktp
question then arises–what is the concentration of antibody at
the SoA? There have been several preclinical studies that have                where
been performed to measure concentrations in tissues relative to                                                                 Q
blood across different antibodies (Vugmeyster et al., 2008;                                                    ksp  ktp          .
                                                                                                                                V2
Vugmeyster et al., 2010; Shah and Betts, 2013; Li et al., 2017;
An et al., 2020). Antibodies distribute predominantly in the                     There is an important distinction between V2 and VT which
interstitium of tissues (Janeway and Walport, 2001), therefore                warrants further elaboration. Fixing the ratio of average drug
the concentration ratio needs to be adjusted for the interstitial             concentration at the SoA vs the plasma, while preserving plasma
volume of the tissue of interest. Generally, the volume of the                PK, necessitates an extra degree of freedom in the calculations.
interstitium is around 1/3 of the total tissue volume (Poulin and             Since drug concentrations in the peripheral tissue are rarely of
Theil, 2002) (which includes peripheral blood and cells), unless              interest, the peripheral tissue volume is a convenient (and
one deals with certain specific organs like muscles or the brain               mathematically sound) choice. However, the calculations of
(Shah and Betts, 2013). The ratio of total tissue to serum                    the drug distribution rates are done with the peripheral tissue
concentration for most organs in preclinical species is around                volume of distribution from the PK parameter estimates, V2 (see
10% (Shah and Betts, 2013; Vugmeyster et al., 2010). Therefore,               Table 1). In our practice, VT is not used and peripheral mAb
our recommendation is to use 30% (10%/1/3) as a standard ratio               concentrations not tracked (as opposed to SoA concentrations),
parameter for non-brain and non-muscle tissue SoAs.                           but understanding of the mathematics behind the model would

Frontiers in Bioinformatics | www.frontiersin.org                         3                                          September 2021 | Volume 1 | Article 731340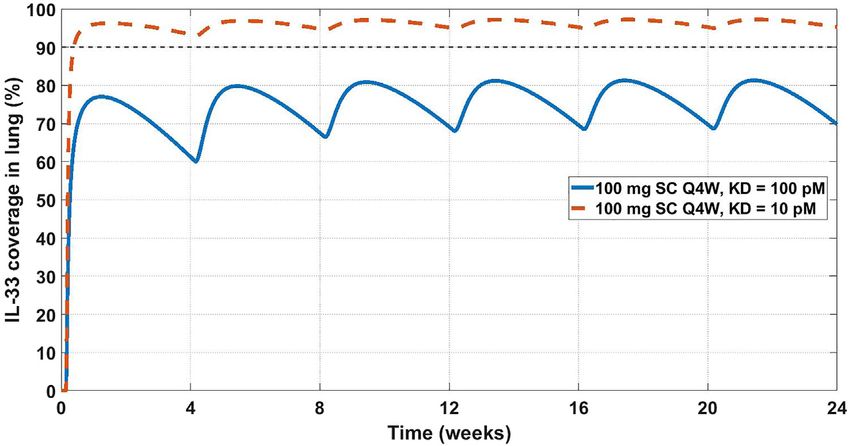
Kapitanov et al. Site-Of-Action Model for Antagonistic Antibodies
TABLE 1 | Definition of parameters used in SoA model.
Parameter Description Value Units
VP Central compartment volume (plasma) Drug specific L
Q Drug distributive clearance rate Drug specific L/day
Cl Drug elimination clearance rate Drug specific L/day
VS Volume of SoA interstitial space Tissue specific L
VT Peripheral tissue volume (calculated) Model specific L
V2 Peripheral tissue volume (from two-compartment PK) Drug specific L
D0 Dose Study specific Nanomole
ka Rate of absorption post subcutaneous drug administration Drug specific 1/day
F Bioavailability post subcutaneous drug administration Drug specific Dimensionless
Qtarget Target distributive clearance rate Target specific L/day
ratio Ratio of plasma versus SoA drug concentrations at steady state SoA specific Dimensionless
kon Drug-target concentration-dependent association rate Drug specific nM−1day−1
kps Rate constant of drug distribution from plasma to SoA ratio p VQ2 p VVPS 1/day
Q
ksp Rate constant of drug distribution from SoA to plasma V2 1/day
V2 − kps
Q
kpt Rate constant of drug distribution from plasma to peripheral tissue 1/day
Q
ktp Rate constant of drug distribution from peripheral tissue to plasma V2 1/day
Qtarget
kpsT Rate constant of target distribution from plasma to SoA VP 1/day
kspT Rate constant of target distribution from SoA to plasma Calculated to ensure target equilibrium in absence of drug 1/day
kpsC Rate constant of complex distribution from plasma to SoA kps 1/day
kspC Rate constant of complex distribution from SoA to plasma ksp 1/day
Cl
kel Rate constant of drug elimination from plasma VP 1/day
kdegTp Rate constant of target elimination from plasma Target specific 1/day
kdegTs Rate constant of target elimination from SoA Target specific 1/day
kelC Rate constant of complex elimination from plasma For soluble target can be assumed kel , unless data are avalable 1/day
koff First-order dissociation rate constant of antibody kon p KD 1/day
ksynP Zero order target synthesis rate in plasma Calculated to ensure target equilibrium in absence of drug nM/day
ksynS Zero order target synthesis rate in SoA Calculated to ensure target equilibrium in absence of drug nM/day
dCP
TABLE 2 | Expressions for A depending on route of drug administration. . . . + 2 kon DP TP − koff CP − kon CP TP + 2 koff CP2 (13)
dt
Route of administration Expression for A Drug-related
dCS
initial conditions . . . + 2 kon DS TS − koff CS − kon CS TS + 2 koff CS2 (14)
dt
Intravenous bolus A0 DP0 D0 , DT0 DS0 0 dTP
Subcutaneous A D0 p F p ka DP0 DT0 DS0 0 . . . + koff CP − 2 kon DP TP − kon CP TP + 2 koff CP2 (15)
dt
dTS
. . . + koff CS − 2 kon DS TS − kon CS TS + 2 koff CS2 (16)
dt
be incomplete withoutVT ’s explicit inclusion in the equations and
dCP2 VS
the parameter set. Still, the reader’s ability to use the model would kspC CS2 − kpsC CP2 + kon DP TP − koff CP − kelC CP2 (17)
dt VP
not be inhibited by ignoring this extra mathematics.
dCS2 VP
kpsC CP2 − kspC CS2 + kon DS TS − koff CS2 (18)
Binding Parameters dt VS
If kon has not been determined by a surface plasmon resonance
method (Tang et al., 2010), or other methods, such as KinExA For variables DP , DS , TP , TS , CP , CS , the only differences
(Wani et al., 2016), kon can be assumed to be 1e6 M −1 s−1 (Foote between Eqs 11–18 and Eqs 1–7 are the binding interactions,
and Eisen, 1995). Given a measured constant of dissociation (KD ), hence synthesis, distribution, and elimination reactions are
one can calculate koff as the product of kon and KD . Drug:target replaced by ellipses for simplicity. Two new species are
interactions in the peripheral compartment and complex introduced: CP2 and CS2 , which represent the concentration of
distribution from plasma to the peripheral compartment are mAb bound to its target on each arm (a double complex) in
typically ignored. To make binding interactions even more plasma and the SoA, respectively. The factors of two account for
mechanistic, one can include step-wise binding for each of the the multiple ways in which an unbound antibody can engage a
antibody’s arm. In this case the binding interactions from Eqs 1–7 target, or a doubly bound antibody can release a target. Whether
would need to be rewritten as follows: to include this mechanistic binding step is dependent on the
biology and the requirement for this extra complexity.
dDP
. . . + koff CP − 2 kon DP TP (11)
dt Target Parameters
dDS The target related parameters are turnover (half-life or
. . . + koff CS − 2 kon DS TS (12)
dt degradation rate), synthesis rate, concentrations (both in
Frontiers in Bioinformatics | www.frontiersin.org 4 September 2021 | Volume 1 | Article 731340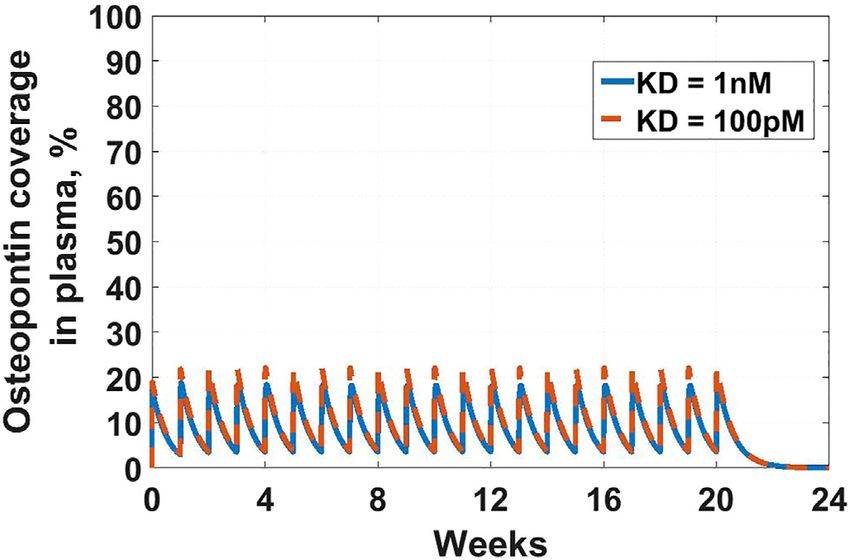
Kapitanov et al.                                                                                          Site-Of-Action Model for Antagonistic Antibodies

plasma and the SoA) and distribution rate (between the plasma                Lassman et al., 2014; Larance and Lamond, 2015). One of the
and the SoA).                                                                preferred methods uses immunoaffinity enrichment of the target
                                                                             proteins from a stable isotope labeled amino acid tracer pulse-chase
Estimating Target Concentrations                                             study, either from preclinical or clinical studies. Tracer incorporation
There are many published methods or approaches for measuring                 in a surrogate peptide sequence is then measured by targeted mass
target levels both in serum and tissue (Becker and Hoofnagle, 2012),         spectrometry. The workflow and details of the study have been
including ligand binding assays and mass spectrometry. A preferred           published (Farrokhi et al., 2018a). Once data is available for both the
approach, as previously highlighted due to its enhanced specificity           tracer levels and its incorporation in the protein of interest, the
and selectivity, is protein or peptide immunoaffinity liquid                  turnover rate is estimated using a series of models that account for the
chromatography tandem mass spectrometry (IA LC-MS/MS).                       tracer’s incorporation, as well as the known biological properties of
The method requires selection of optimal capture reagents,                   the protein of interest (e.g., a shed receptor in the tissue vs cytokine
calibration standards and surrogate peptides for detection. In this          released primarily in plasma). An earlier version of these models was
method, proteins and/or trypsin digested peptides are enriched by            used in Farrokhi et al. 2018a These assays are confined by the time
anti-protein or anti-peptide antibodies or a sequential combination          limitations in pulse-chase durations (multiple hours or a few days) in
of both approaches. The enriched peptides are quantified using                in vivo studies and accurate measurement of slow turnover rates
detection by nanoflow LC-MS/MS. A detailed description of this                (i.e., multiple days or weeks) are not feasible or are estimated from
method can be found in Palandra et al. (2013) and Neubert et al.             extrapolation. Also, in some cases, measurements are not feasible due
(2020). The addition of a stable isotope-labeled synthetic version of        to low concentrations of the target protein. Other methodologies
the surrogate peptide(s) prior to protein digestion reduces variables        have also been published in the literature, (Bateman et al., 2006;
and quantitation relative to the chosen protein calibrator can be            Lindwall et al., 2006; Doherty and Whitfield, 2011; Hinkson and
achieved. The mass spectrometric response of the endogenous                  Elias, 2011; Lassman et al., 2014; Larance and Lamond, 2015), but
peptide is compared to the analogous response for the labelled               they are likely to experience similar limitations. Physiological target
peptide in all samples, including calibrators, thereby normalizing for       turnover measurements in human is limited to only the soluble
digestion efficiency and matrix suppression differences between the           targets and turnover in SoA is estimated from soluble target when
samples (Bantscheff et al., 2007). Examples of well designed, fit for         possible.
purpose, sequential protein and tryptic peptide IA-LC-MS can
achieve lower limit of quantitation (LLOQ) of sub 10 pg/ml                   Target Synthesis Rate
(Neubert et al., 2013; Palandra et al., 2013), while protein IA and          Generally, once information about the target’s concentrations
peptide IA only approaches are typically capable of achieving sub            and turnover are available, the synthesis is calculated assuming
100 pg/ml LLOQ (McAvoy et al., 2014; Zhao et al., 2018; Shuford              that in the absence of drug the system is at steady state. The rate
et al., 2020).                                                               constant for target distribution from the plasma to the site of
    Target expression levels vary widely depending on their                  action ( kpsT ) can be fixed. The rate constant for target
biological function, disease state, tissue localization, and many            distribution from the site of action to the plasma (kspT ) is
other factors. For example, the growth and differentiation factor 8          derived based on the steady state levels of target in the plasma
(GDF-8), is present in circulation at very high expression levels of         and the SoA together with kpsT . At steady state, synthesis rates,
approximately 7 ng/ml in adult humans owing to its function in               degradation rates, and distribution rate constants between the
regulating muscle mass (Palandra et al., 2016). While targets like           plasma and the SoA must be balanced to achieve known levels of
Interleukin-21 are not detected in human serum and can only be               target concentrations in both compartments.
measured in certain human tissues such as colon tissue at an                    Target steady state concentration in plasma prior to drug
average concentration of 1 ng/g (Palandra et al., 2013). The                 administration is defined by:
alarmin cytokine, Interleukin-33 (IL-33) is present in
circulation at approximately 20–100 pg/ml (Artru et al., 2020)                    dTP
                                                                                       ksynP − TP0 kdegTp + kpsT  + TS0 kspT VS /VP  0          (19)
and in many tissues at very elevated concentrations (200 ng/g in                   dt
the lung (Cohen et al., 2015)) owing to its ubiquitous presence in             Target steady state concentration at the SoA prior to drug
the nucleus of all producing human cells. When the                           administration is defined by:
concentrations in a tissue homogenate are measured, the
concentrations that are provided need to be adjusted for the                      dTS
                                                                                       ksynS − TS0 kdegTs + kspT  + TP0 kpsT VP /VS  0          (20)
interstitial volume of the analyzed tissue before being applied in                 dt
the SoA model. Again, other methodologies have been used in
                                                                               Total target synthesis in the human body (in amount,
some cases as driven by the protein and analytical complexities.
                                                                             nanomoles) is defined as:
Estimating Target Turnover                                                     ksynTot  ksynP Vp + ksynS VS  TP0 kdegTp VP + TS0 kdegTs VS        (21)
While traditionally radio-labelling methods have been used for
estimating turnover, methods based on in-vivo stable isotope                    It is rare that one has information about the ratio between
labelling and proteomics have been established to measure                    target synthesis in plasma versus the SoA. This ratio is generally
physiologically relevant turnover (Bateman et al., 2006; Lindwall            assumed taking into account what is known about the biology.
et al., 2006; Doherty and Whitfield, 2011; Hinkson and Elias, 2011;           For the remainder of this section and for the purpose of equations

Frontiers in Bioinformatics | www.frontiersin.org                        5                                   September 2021 | Volume 1 | Article 731340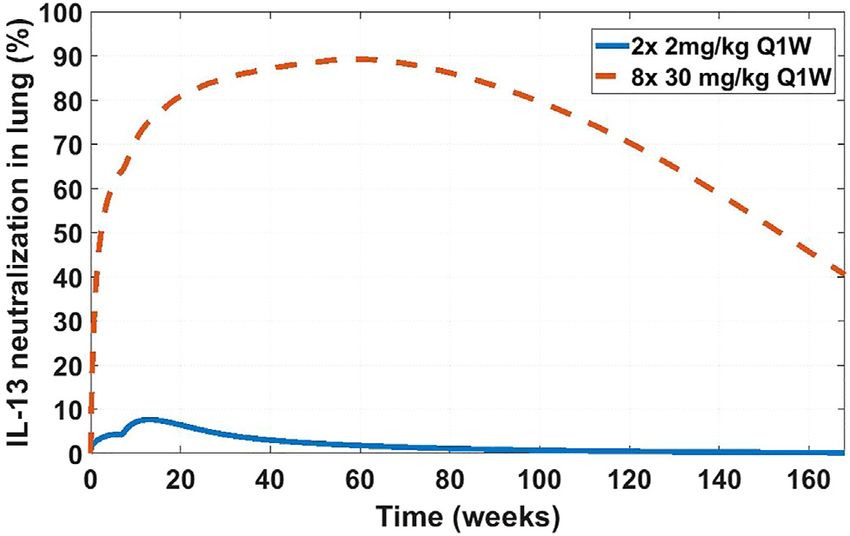
Kapitanov et al.                                                                                               Site-Of-Action Model for Antagonistic Antibodies

and calculations, the fraction of total synthesis in the SoA is                    cases, the required levels of target coverage for efficacy are
captured by the parameter frac.                                                    unknown so a threshold is set, depending on the disease,
                                                                                   competitive landscape, and other factors, often at >90% or
Estimating Target Distribution                                                     >99% target neutralization. If the required coverage for
While drug distribution constants can be calculated from the PK                    pharmacology cannot be achieved at a commercially viable
and Eqs 8–10 above, target rates of distribution are largely                       dose, project termination is recommended.
unknown. We fix kpsT :
                                                                                   Osteopontin Example
                                          Qtarget                                  The first example in this section is an example of the latter-
                                 kpsT            .                    (22)        targeting osteopontin for rheumatoid arthritis (RA). Osteopontin
                                           VP
                                                                                   is a secreted protein from a plethora of cells, that has been
    At an exploratory stage, we use a parameter value for Qtarget ,                implicated in a variety of biological functions, from
estimated from literature data reporting a distributive clearance rate             inflammation and fibrosis, to tumorigenesis and metastasis
of Albumin from Synovial joints of Rheumatoid arthritis patients                   (Ashkar et al., 2000; Lund et al., 2013; Wang et al., 2014; Liu
(Owen et al., 1994). While this parameter value can be used in the                 et al., 2015; Clemente et al., 2016). The goal of the work was to
initial stages of a project, as a project progresses, this value is explored       assess feasibility in suppressing osteopontin for the treatment of
in more detail and is updated by considering a pharmacokinetics                    RA. A full SoA model was not utilized in this case because, as you
based value for a recombinant version of the target, e.g., (Creaven                will see, plasma levels of osteopontin were high enough to
et al., 1987; Banks et al., 2000; Zhang et al., 2019), or by basing Qtarget        sufficiently inform feasibility, without the need for further
on the molecular weight of the target (Li et al., 2017).                           modeling complexity. Target turnover was estimated using a
    Since these approaches have not be largely validated and                       human D3-leucine pulse-chase study similar to discussed in
adopted, one is advised to employ sensitivity analysis                             Estimating Target Turnover. Target serum concentrations
regarding target distribution parameters.
                                                  k
                                                                                   were measured using a nano flow liquid chromatography-
    If kpsT is fixed, assuming ksynS  frac p synTot VS and rearranging             tandem mass spectrometry method similar to discussed in
Eqs 19 and 22 will result in:                                                      Estimating        Target     Concentrations.      Mean      serum
                                                                                   concentrations were measured at around 10 nM and half-life
               TP0 kdegTp VP + TS0 kdegTs VS             TP0 VP                  was estimated at around 10 min. The scenarios presented here
kspT  frac                                     − kdegTs +        p kpsT
                                                                                   assume a mAb interacting with a soluble target and PK
                           TS0 VS                          TS0 VS
                                                                    (23)           parameters for the drug are in Table 3. For the purpose of the
                                                                                   example, to assess the degree of target coverage (free target
                                                                                   reduction) in plasma, two dosing regimens were explored –
                                                                                   300 mg SC and 1,000 mg IV, both every week. These are not
APPLICATIONS OF SITE-OF-ACTION                                                     commercially viable doses for RA but were selected to explore the
MODEL METHODOLOGY                                                                  maximum attainable coverage with a monoclonal antibody
                                                                                   targeting osteopontin. The effect of antibody affinity on target
This section provides four examples of application of the SoA                      coverage was simulated using KD values of 1 nM, 100 pM, for
modeling structure to soluble targets. The examples are divided                    both scenarios, and 10 pM for the IV dosing scenario. The results
into the three main categories for successful use of translational                 of the simulations can be seen in Figures 2 and 3. Ultimately, the
modeling and simulation: right target, right compound, and                         high target levels and very fast target turnover resulted in low
right dose.                                                                        target trough coverage even at a non-commercially viable dosing
                                                                                   regimens for RA. Drug affinity for the target was predicted to
Right Target                                                                       have little effect on the coverage, so affinity optimization would
In the pre-clinical space, especially in early project stages, it is               not help. Therefore, the target was determined undruggable with
appropriate to conduct feasibility analysis. At this stage, a                      a regular monoclonal antibody and the project was not
successful assessment is both one that progresses a target as a                    progressed. More detailed assessment of this target with a
part of the portfolio and eventually into the clinic, as well as one               different modeling approach can be seen in Farrokhi et al.
that shows that a target is infeasible from a clinical utility                     2018b, where other antibody modalities were also explored.
standpoint. Such analyses are performed to determine whether
sufficient levels of target coverage can be achieved via                            IL-33 Example
neutralization with a monoclonal antibody and should not be                        Another feasibility example is IL-33. IL-33 is an alarmin, member
confused with determining whether the target is “right” from a                     of the IL-1 cytokine family, released by cells at the barrier surfaces
disease standpoint. Often these analyses are done with just in-                    (i.e., keratinocytes and airways epithelial cells) after disruption in
vitro functional assays, whose utility is limited - they capture a                 the barrier function by pathogens, tissue injury, and cell death,
narrow aspect of the biology and may be done in the pre-portfolio                  and has been associated with atopic dermatitis and asthma (Saluja
stage. Once the project is part of the portfolio, we recommend a                   et al., 2015; Saluja et al., 2016). Asthma is the disease of choice for
more thorough analysis with a SoA model since more resources                       this example, therefore the SoA is lung. IL-33 signals through
for modeling and biomeasures/biomarkers are available. In many                     binding to ST2 and then forming a heterodimer with the IL-1

Frontiers in Bioinformatics | www.frontiersin.org                              6                                  September 2021 | Volume 1 | Article 731340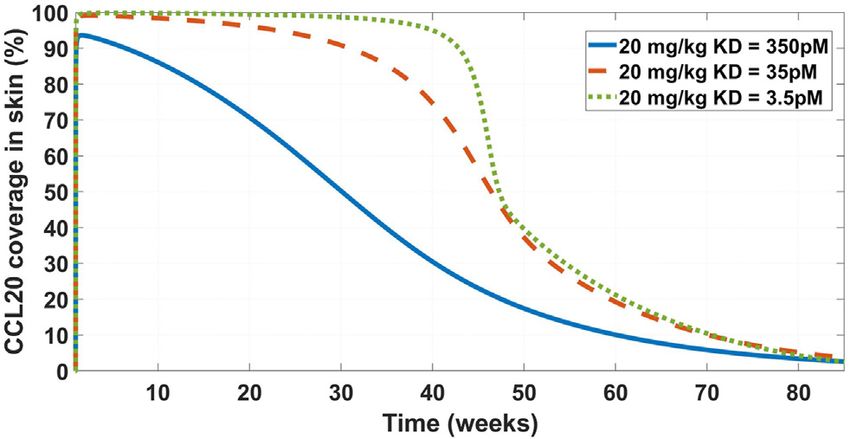
Kapitanov et al.                                                                                                     Site-Of-Action Model for Antagonistic Antibodies

TABLE 3 | Antibody PK parameters for osteopontin feasibility analysis.

Parameter             Value (unit)                       References

VP                      3.2 (L)
V2                      2.2 (L)             Betts et al. (2018)
Cl                    0.454 (L/d)
Q                     0.252 (L/d)
ka                    0.26 (1/d)
                                            Assumed, (Dirks and Meibohm, 2010)
F                       60 (%)

receptor (Saluja et al., 2015; Saluja et al., 2016; Griesenauer and
Paczesny, 2017). ST2 can also be found in soluble form (sST2),
which is a scavenger for IL-33 and constraints its signaling
properties (Griesenauer and Paczesny, 2017). For the purpose
of this example, our antibody competes with sST2 for binding to                       FIGURE 2 | Osteopontin coverage in plasma: Shows the projected
IL-33 in plasma. A scheme and description of the model is shown                       neutralization of osteopontin after mAb administration as described in
in Figure 4. The antibody binds IL-33 both in plasma and at the                       Osteopontin Example. Simulated dose is 300 mg SC Q1W, with two antibody
                                                                                      affinities – KD of 1 nM (solid blue line) and 100 pM (dashed orange line).
SoA. The distribution of the drug to the SoA and the periphery as                     Even peak projected neutralization is only 20%, which is unlikely to result in
well as assumptions regarding the mAb:IL-33 complex have been                         meaningful pharmacology.
described earlier (see Drug Distribution Parameters). The
target-related parameters and references used are described in
Table 4. The mAb related parameters are described in Table 3                         results in asthma (Anaptysbio, 2014; Regeneron Pharmaceuticals,
and Binding Parameters. KD for the purpose of this feasibility                       2019), validating the model’s conclusions.
analysis was assumed to be either 100 or 10 pM - kon remained
fixed (see Binding Parameters), while koff was calculated                             Right Compound
accordingly. Figure 5 shows projected target coverage at the                         Once feasibility has been established, the team delves deeper
site of action (lung). Based on the modeling results, the 100 mg SC                  into assessing the molecular properties of the antibody
Q4W dose is predicted to achieve greater than 90% neutralization                     necessary to neutralize the target. Most of the
of IL-33 at the site of action if the affinity of the mAb is closer to                pharmacokinetic properties would depend on molecular
10 pM than 100 pM. While a ∼10 pM affinity is challenging from                        assessment and there are currently few models that connect
an engineering perspective, design of a high-affinity antibody                        antibody molecular assessment and pharmacokinetics (Jones
should be expected when targeting cytokines, especially if the                       et al., 2019; Jones et al., 2020). Predominantly, modelers can
ligand’s binding to its natural receptor is so tight (26 pM (Palmer                  assist the engineering team with projecting what antibody
et al., 2008)). In this case it was concluded, using the modelling                   binding affinity is needed for the required level of
analysis, that the target should be explored further, however                        neutralization (coverage). We use the next example of a
extensive affinity optimization will likely be required to                            clinical compound, to assess whether the mechanism was
achieve sufficient neutralization. A Matlab Simbiology model                          tested adequately and what affinity is required for improved
file for this example is available in the Supplement section of                       target neutralization at a commercially viable dose.
this article.                                                                            Chemokine (C-C motif) ligand 20 (CCL20) is a
    This early-stage feasibility analysis omits several potentially                  chemoattractant for lymphocytes and dendritic cells in a
important aspects of the biology of IL-33, e.g., quick inactivation                  variety of mucosal tissues (Schutyser et al., 2003). GSK3050002
due to oxidation and proteolytic activities, and synthesis in                        is an anti-CCL20 monoclonal antibody that was tested in healthy
cellular nucleus and release under inflammatory conditions                            volunteers (Bouma et al., 2017). The data presented in the study
(Cohen et al., 2015; Saluja et al., 2015; Griesenauer and                            was drug, drug:target complex, and free target concentrations
Paczesny, 2017; Scott et al., 2018). The former can increase                         both in serum and in skin blister. The drug did not appear to
the apparent clearance of active IL-33 and both properties can                       inhibit monocytes and granulocytes activity in the skin blister
skew the measurements of active free IL-33 in plasma and tissue.                     model, so we decided to test whether a higher affinity antibody
Also, considering the tight binding of IL-33 to sST2, further                        would be predicted to achieve higher and more sustained target
considerations can be made regarding the expression of                               coverage at the skin. For this purpose, a SoA model was
membrane ST2 in the lung and the antibody’s interaction with                         constructed with skin as the SoA with the assumption that
the target in a full receptor:target interaction mechanistic                         CCL20 was synthesized in the skin only and eliminated in the
modeling system. Potentially, a competing vs non-competing                           plasma only. Interstitial skin volume was assumed to be 1.125 L
epitope may be important for enhancing target neutralization,                        (Shah and Betts, 2012). Two-compartment PK model parameters
which could be evaluated at the next stage of mechanistic                            (Table 4), KD (350 pM), target half-life (15 min), plasma:skin
modeling - right molecule. Several anti-IL-33 molecules have                         drug concentration ratio (20%, measured), and initial CCL20
already been in the clinic, and a couple have shown positive                         concentrations in the plasma (30 pM) were fixed based data

Frontiers in Bioinformatics | www.frontiersin.org                                7                                       September 2021 | Volume 1 | Article 731340
Kapitanov et al. Site-Of-Action Model for Antagonistic Antibodies
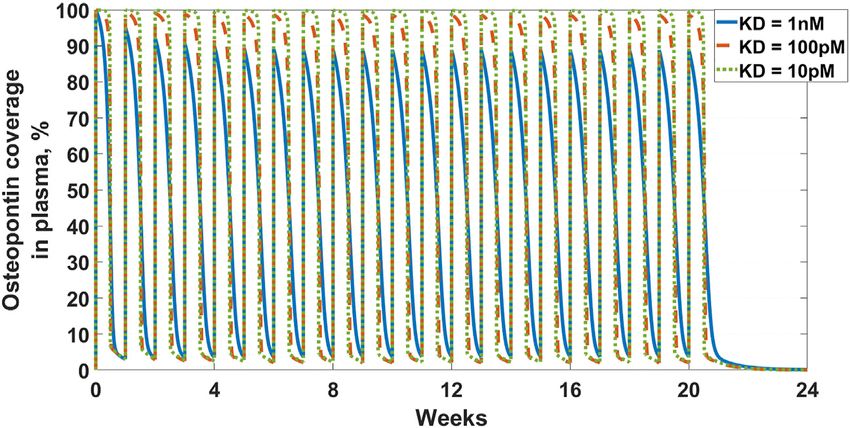
FIGURE 3 | Osteopontin coverage in plasma: Shows the projected neutralization of osteopontin after mAb administration as described in Osteopontin Example.
Simulated dose is 1,000 mg IV Q1W, with three antibody affinities – KD of 1 nM (solid blue line), 100 pM (dashed orange line), and 10 pM (dotted green line). All scenarios
result in high peak neutralization, which is not sustained for the full duration of the dosing interval.
ratio would be target-dependent and potentially sensitivity
analysis would need to be done to fully evaluate.
Right Dose
Once drug properties have been established, modeling is utilized
to project a clinical efficacious dose in different patient
populations. This step is important both from standpoint of
selecting doses for toxicology studies and assisting in dose
selection for first-in-human studies. This particular example is
a retrospective analysis of the clinical compound IMA-026, an
antagonist monoclonal antibody against IL-13 (Gauvreau et al.,
2011; Kasaian et al., 2011; Tiwari et al., 2016b). IL-13 is a cytokine
with demonstrated role in many inflammatory diseases, including
asthma. IMA-026 is an M1 type anti-IL-13 antibody (May and
Fung, 2015), which blocks IL-13 from interaction with its
receptors - IL13Rα1 (signaling receptor) and IL13Rα2 (decoy
FIGURE 4 | Modeling scheme of an anti-IL-33 mAb. The general
processes are similar to the default scheme described in Figure 1, with
receptor) (Chandriani et al., 2014). IMA-026 data in healthy
several details adapted to the IL-33 scenario. IL-33 is synthesized at the SoA volunteers (NCT00517348) has been analyzed before (Tiwari
(lung) and distributes to the plasma. There, it can bind sST2 or get et al., 2016b), where initial IL-13 concentrations, drug affinity,
eliminated. sST2 is synthesized and eliminated in plasma only. The sST2:IL-33 and target turnover were estimated. However, we demonstrate
complex clears in the plasma.
here that the accumulation of total plasma concentration of IL-13
can be obtained without fitting any parameters by using literature
references (target turnover), pre-clinical observations (drug
provided in Bouma et al., 2017. Skin concentrations of CCL20 are affinity), and relevant clinical data (PK and initial target
assumed to be 10-fold higher than plasma. Under these concentrations). IL-13 target turnover was estimated to be
assumptions, even a dose of 20 mg/kg is not projected to around 20 min in mice (Khodoun et al., 2007), drug KD was
achieve 90% target reduction in the skin for more than ∼ a 1 nM (based on internal measurements), median initial plasma
week (Figure 6). At a regimen of 300 mg SC Q2W, the mAb is IL-13 concentrations were estimated using ligand binding assay
projected to need an affinity of 3.5 pM in order to reduce the (LBA) to be around 0.06 pM for healthy volunteers and 0.12 pM
target by 90% (Figure 7). This suggests that the affinity of the for asthmatic patients, and PK parameters were estimated in
mAb was not tight enough and that the CCL20 mechanism was Tiwari et al., 2016b. A SoA model was constructed with interstitial
likely not adequately tested in the published clinical study. lung volume of 0.3 L (Shah and Betts, 2012) and SoA target
While the general conclusion may still hold, several concentrations of 0.03 pM in healthy volunteers and 0.4 pM in
assumptions affect the results of the model. Some, like the asthmatic patients (Kroegel et al., 1996). An average human
synthesis of CCL20 in the skin, are reasonable given that the bodyweight of 70 kg was assumed. Figure 8 shows the
disease of interest is atopic dermatitis. The SoA:plasma ratio was simulation of total IL-13 accumulation using the SoA model
assumed similar to the one found in IL-33 (see Table 5). That in plasma along with the observed clinical data from the healthy
Frontiers in Bioinformatics | www.frontiersin.org 8 September 2021 | Volume 1 | Article 731340Kapitanov et al. Site-Of-Action Model for Antagonistic Antibodies
FIGURE 5 | Projected IL-33 neutralization in the lung at 100 mg SC Q4W dosing at 10 pM (dashed orange line) and 100 pM (solid blue line) drug affinities. The 90%
coverage line (dashed grey) is emphasized for convenience. The model projects that a 10 pM affinity would achieve 90% IL-33 neutralization in the lung.
TABLE 4 | GSK3050002 two-compartment PK parameters (Bouma et al., 2017).
Parameter Value (unit) 95% CI
VP 3.63 (L) 3.44–3.83
V2 3.19 (L) 2.89–3.52
Cl 0.475 (L/d) 0.439–0.514
Q 0.374 (L/d) 0.324–0.432
volunteer study. IMA-026 was evaluated further in an additional
clinical study, NCT00725582, Study Evaluating the Effect of IMA-
026 on Allergen-Induced Late Asthma Response in Mild Asthma.
Two 2 mg/kg SC doses were administered 1 week apart. FIGURE 6 | Model projected CCL20 coverage in the skin after
The SoA model estimated that after 2 weeks dosing of 2 mg/kg administration of 20 mg/kg IV bolus dose of GSK3050002. Three mAb affinity
SC Q1W the drug reached only around 8% target suppression at the scenarios were modeled – 350 pM (solid blue line), 35 pM (dashed orange
line), and 3.5 pM (dotted green line). The low coverage at the base KD of
site of action, while 8 weeks of dosing of 30 mg/kg SC Q1W would
350 pM is consistent with observed lack of activity as described in Bouma
have achieved close to 90% coverage (Figure 9). Ultimately IMA-026 et al. 2017.
was abandoned since it did not show efficacy (Gauvreau et al., 2011).
However, had data supporting an SoA model been available at time
of the study conception, it could have projected the low coverage at et al., 2017), has been approved for treatment of atopic dermatitis
2 mg/kg and suggested either a longer duration study or a more (LEO Pharma announces, 2021). The success and high affinity of
appropriate dose for testing the mechanism. Likely, if SoA modeling both mAbs validate the model’s conclusions.
had been available even earlier, an affinity maturation campaign
could have been initiated to increase the affinity above 1 nM since a
dose of 30 mg/kg Q1W is not commercially feasible. Suggestions for DISCUSSION
increased dose or improved affinity are corroborated by a crowd of
anti-IL-13 monoclonal antibodies that have subsequently shown We have presented a three compartment mechanistic model that
moderate to low efficacy in asthma (Gauvreau et al., 2011; Noonan extends a typical two-compartment model by adding a site of
et al., 2013; van Hartingsveldt et al., 2013; De Boever et al., 2014; action - a representation of the interstitial volume of the tissue
Hanania et al., 2016), indicating the difficulty of achieving complete where the interactions of the protein target with the drug are
neutralization of IL-13 and/or its role as a standalone mechanism in expected to contribute to disease modulation. The modeling is
the disease. The only anti-IL-13 mAb that has been in Phase 3 for performed through a system of ordinary differential equations and
asthma is lebrikizumab, with reported affinity ofKapitanov et al. Site-Of-Action Model for Antagonistic Antibodies
TABLE 5 | List of target-related parameters used for anti-IL-33 model.
Parameter Description Value, units Comments and references
IL33s_0 Initial concentration of free IL- 11 pM 200 pg/mg of lung tissue in COPD or asthmatic patients
33 at the SoA (lung) (Cohen et al., 2015)
IL33p_0 Initial concentration of free IL- 1.5 pM Assumed similar between asthma and allergic rhinitis –
33 in plasma 27 pg/ml (Glück et al., 2019)
sST2_0 Initial concentration of free 27 pM 1 ng/ml in mild/moderate attack ((Oshikawa et al., 2001)),
sST2 in plasma within two-fold of most other situations in Oshikawa et al.
(2001) and levels in Glück et al. (2019)
sST2p0
sST2_IL33p_0 Initial concentration of sST2- kon ST2 p IL33p0 p koff ST2 +kdeg sST2 IL33p
To preserve drug-free equilibrium values
bound IL-33 in plasma
IL-33 molecular To convert mass 18 kDa Palmer et al. (2008)
weight concentration into molarity
sST2 molecular To convert mass 37 kDa Mueller and Dieplinger, (2016)
weight concentration into molarity
kdeg_IL33p Degradation rate of IL-33 in 4.2 1/day ∼4 h half-life in human lung explants (Cohen et al., 2015)
plasma
kdeg_sST2p Degradation rate of sST2 in 2.6 1/day 6.3 h half-life (recombinant, IV administration) (Jacobs
plasma et al., 1993)
kdeg_sST2_IL33p Degradation rate of sST2:IL- kdeg sST2p Assumed
33 complex in plasma
kon_ST2 Association constant 358 1/nM/day Palmer et al. (2008)
between IL-33 and sST2
koff_ST2 Dissociation rate between IL- kon ST2 p KD IL33 sST2 KD_IL33_sST2 26 pM (Palmer et al., 2008)
33 and sST2
kps_IL33 IL-33 distribution rate from 0.13 1/day See Estimating Target Distribution
plasma to SoA
ksyn IL33s
ksp_IL33 IL-33 distribution rate from (kps IL33p p IL33p0 ) p VP
VS *IL33s0 + IL33s0 To preserve drug-free equilibrium values
SoA to plasma
ksyn_IL33s IL-33 synthesis rate at (kdeg IL33p p IL33p0 + kdeg sST2 IL33p p sST2 IL33p0 ) p VP
VS To preserve drug-free equilibrium values
the SoA
ksyn_sST2p sST2 synthesis rate in plasma kdeg sST2p p sST2p0 + kdeg sST2 IL33p p sST2 IL33p0 To preserve drug-free equilibrium values
for sufficient target engagement (right compound) and inform the essential parameters in early stage pre-clinical work. This is evident
necessary doses for achieving the degree of target engagement in the examples we presented - osteopontin could not be covered at any
required for efficacy in the clinic (right dose). While the case reasonable dose or affinity because of its high abundance and turnover;
studies described were categorized into examples of each of these IL-33 needed high affinity for high neutralization but was deemed
three questions, these questions are inter-linked and in practice the feasible due to relatively low expression and slow turnover; CCL20 also
modelling approach addresses all three if used at an appropriate needed high affinity and a high dose to neutralize due to fast turnover.
stage of the drug discovery process. Ideally at project inception, a Different targets have different associated biology and will require
model should be generated to explore feasibility, affinity, and PK different strategies to overcome difficulties in neutralizing them. Hence,
requirements for a desired dose level. Such an approach allows while for the purpose of this discussion we are focused on the modeling
drug companies to focus on programs with the highest chance of structure, a capable biomarkers/biomeasures group is essential for the
success and limit the “wasted” resources on those which are more translational research effort.
likely to fail. Hence, our proposal is to utilize this model in the early Within the SoA model framework one can implement a
stages of drug discovery and, if possible, validate with clinical data. variety of biological complexities: downstream or upstream
The main feature of the SoA modeling approach is its flexibility. biomarkers, different cell types, ligand-receptor binding, etc.
Depending on the target, a modeler can include any number of SoA The SoA model facilitates their implementations but one must
compartments, ranging from zero to including every main tissue in the weigh the complexity of the model versus the questions it tries to
human body. Along with the system of equations, we suggest two key answer. The SoA modeling approach is not appropriate for a full
biomeasures: target concentrations and turnover, which represent disease model, for that goal a more complex QSP implementation
Frontiers in Bioinformatics | www.frontiersin.org 10 September 2021 | Volume 1 | Article 731340Kapitanov et al. Site-Of-Action Model for Antagonistic Antibodies
FIGURE 7 | Projected CCL20 coverage in the skin at 300 mg SC Q2W dosing regimen and varying affinity. Three affinity scenarios were simulated – 350 pM (solid
blue line), 35 pM (solid orange line), and 3.5 pM (solid green line). Thin dashed grey line indicates 90% coverage, which is emphasized for convenience. The model
projects that a 3.5 pM affinity is required for achieving 90% CCL20 coverage in the skin.
would be appropriate. The SoA model is also not a physiologically disposition, shedding of the membrane target) and relevant
based pharmacokinetics (PBPK) model - if the distribution of the biomarker and biomeasures assays (i.e., number of receptors per
drug in the whole body is important for the project, a PBPK cell, quantifying receptor internalization). These aspects can be
model would likely be the appropriate tool. described in a separate manuscript but there are excellent
The SoA model, as presented here, is fit for mAb modeling discussions on the topic, among which Aston et al. 2011 and
with its representation of mechanistic target binding and Grimm 2009.
unbinding. The model can be adjusted and has been utilized There are a number of shortcomings to the SoA modeling
to incorporate different molecular modalities - pegylated Fab platform. The peripheral compartment may be underutilized -
fragments, bispecific antibodies, etc. the model as presented here does not include target expression
The examples in the manuscript are focused on soluble and turnover in the peripheral compartment or drug:target
targets, which simplified some aspects of the presentation. complex distribution in and out of the peripheral
Membrane-bound targets often present different challenges compartment. The method of fixing the ratio of drug
from modeling standpoint (i.e., target-mediated drug concentration in plasma vs. the SoA assumes similar
FIGURE 9 | Projected IL-13 neutralization in lung at two dosing
FIGURE 8 | Total IL-13 accumulation after IMA-026 administration in schedules for IMA-026. Two doses of 2 mg/kg a week apart (solid blue line)
Phase I trial - model simulations vs published data. Different color solid lines was the clinically tested dose in asthma patients (NCT00725582). Eight doses
correspond to different doses, open circles with corresponding colors are of 30 mg/kg a week apart (dashed orange line) is a hypothetical clinical
clinical data. Labels: SC, subcutaneous; IV, intravenous; HV, healthy dose at which the projected IMA-026 coverage reaches close to 90% IL-13
volunteers; MA, mild asthmatics. The model reasonably captures the behavior neutralization in the lung. Modeling suggests that the mechanism of IL-13
using internal affinity measures, previously published target data, and neutralization was likely untested in the clinic due to low tested dose, which is
published PK parameters for IMA-026, without fitting any parameters. projected to result in low coverage.
Frontiers in Bioinformatics | www.frontiersin.org 11 September 2021 | Volume 1 | Article 731340Kapitanov et al. Site-Of-Action Model for Antagonistic Antibodies
distribution to other previously measured antibodies. The rate of translation from discovery to development. For the ones
distribution of the drug into the SoA may have an effect on the where understanding of the underlying pharmacology is
target neutralization, and here it is calculated. Some of the limited, a simple exposure-response approach may be
mathematical methods may lead to non-physiological rates in sufficient.
order to preserve the measured concentrations at steady state. For
example, the use of target distribution fixes the rate of distribution
from plasma to the SoA and calculates the rate of distribution CONCLUSION
from the SoA into the plasma when assuming that the target is
only synthesized in the SoA. This can lead to non-physiological Ultimately, the SoA platform model is a useful framework that
differences in the plasma:SoA back and forth distribution rates. has allowed us to inform the progression of many successful
The very assumptions of target synthesis and distribution can mAb programs. In particular, we have used the model to
alter the estimate of target suppression. However, despite these determine the doability of targets, drug requirements for
potential caveats of the base SoA model described in this “best in class” mAbs and dosing regimens to achieve
manuscript, it is possible to adapt the framework to capture required levels of target coverage to demonstrate efficacy.
the relevant biological mechanisms as appropriate so that the This modeling approach is fully integrated in the drug
sought physiological modulation can be described more discovery process with the ability to make decisions believed
accurately. Therefore, all the assumptions and calculations to be high.
presented in this manuscript are just the most current
iterations of ideas and are subject to scrutiny in the face of
new facts and better representations. DATA AVAILABILITY STATEMENT
As with all models, this framework requires validation.
Early decisions can be made with sparse data and limited Publicly available datasets were analyzed in this study. Available
measurements but in order to improve confidence in the data is referenced in the article (literature references only).
modeling results, ideally, measurements of key dynamics
behaviors predicted by the model (longitudinal
measurements of target engagement, free or total target AUTHOR CONTRIBUTIONS
levels, etc.) in relevant species with the candidate molecule
or a suitable surrogate are needed for model validation. HJ and GK conceived the concept. GK, JC, JN, and MR
Furthermore, a retrospective validation using clinical data conducted the modeling research. HN, JP, VF, and JJ
(external clinical data can also inform the pre-clinical conducted the biomeasures research. RW and HJ supervised
model) should be performed when data is available in order the research and manuscript. GK wrote the manuscript with
to bridge the gap between theoretical and practical model support and contributions from all other authors.
projections. Some aspects of these validations include
clinically-relevant disease-dependent level of target
neutralization, distribution of the mAb into various types of SUPPLEMENTARY MATERIAL
SoA, or evaluation of the pre-clinical affinity biomeasures or
functional assays and their translatability to the clinical The Supplementary Material for this article can be found online at:
setting. Not every project needs a site-of-action or a https://www.frontiersin.org/articles/10.3389/fbinf.2021.731340/
quantitative systems pharmacology model for successful full#supplementary-material.
Artru, F., Bou Saleh, M., Maggiotto, F., Lassailly, G., Ningarhari, M., Demaret, J.,
REFERENCES et al. (2020). IL-33/ST2 Pathway Regulates Neutrophil Migration and Predicts
Outcome in Patients with Severe Alcoholic Hepatitis. J. Hepatol. 72 (6),
Aarons, L. (2005). Physiologically Based Pharmacokinetic Modelling: a Sound 1052–1061. doi:10.1016/j.jhep.2019.12.017
Mechanistic Basis Is Needed. Br. J. Clin. Pharmacol. 60 (6), 581–583. Ashkar, S., Weber, G. F., Panoutsakopoulou, V., Sanchirico, M. E., Jansson, M.,
doi:10.1111/j.1365-2125.2005.02560.x Zawaideh, S., et al. (2000). Eta-1 (Osteopontin): an Early Component of Type-1
Allerheiligen, S. R. (2010). Next-generation Model-Based Drug Discovery and (Cell-mediated) Immunity. Science 287 (5454), 860–864. doi:10.1126/
Development: Quantitative and Systems Pharmacology. Clin. Pharmacol. Ther. science.287.5454.860
88 (1), 135–137. doi:10.1038/clpt.2010.81 Aston, P. J., Derks, G., Raji, A., Agoram, B. M., and van der Graaf, P. H.
An, B., Zhang, M., Pu, J., Qu, Y., Shen, S., Zhou, S., et al. (2020). Toward Accurate (2011). Mathematical Analysis of the Pharmacokinetic-
and Robust Liquid Chromatography-Mass Spectrometry-Based Quantification Pharmacodynamic (PKPD) Behaviour of Monoclonal Antibodies:
of Antibody Biotherapeutics in Tissues. Anal. Chem. 92 (22), 15152–15161. Predicting In Vivo Potency. J. Theor. Biol. 281 (1), 113–121.
doi:10.1021/acs.analchem.0c03620 doi:10.1016/j.jtbi.2011.04.030
Anaptysbio, I. (2014). Etokimab. Available from: https://www.anaptysbio.com/ Banks, R. E., Forbes, M. A., Patel, P. M., Storr, M., Hallam, S., Clarke, D., et al.
pipeline/etokimab/. (2000). Subcutaneous Administration of Recombinant Glycosylated Interleukin
Andersen, M. E. (1995). Physiologically Based Pharmacokinetic (PB-PK) Models 6 in Patients with Cancer: Pharmacokinetics, Pharmacodynamics and
in the Study of the Disposition and Biological Effects of Xenobiotics and Drugs. Immunomodulatory Effects. Cytokine 12 (4), 388–396. doi:10.1006/
Toxicol. Lett. 82-83, 341–348. doi:10.1016/0378-4274(95)03487-0 cyto.1999.0556
Frontiers in Bioinformatics | www.frontiersin.org 12 September 2021 | Volume 1 | Article 731340You can also read