Salience based object prioritization during active viewing of naturalistic scenes in young and older adults
←
→
Page content transcription
If your browser does not render page correctly, please read the page content below
www.nature.com/scientificreports
OPEN Salience‑based object prioritization
during active viewing of naturalistic
scenes in young and older adults
1,2*
Antje Nuthmann , Immo Schütz3,4 & Wolfgang Einhäuser3
Whether fixation selection in real-world scenes is guided by image salience or by objects has been
a matter of scientific debate. To contrast the two views, we compared effects of location-based and
object-based visual salience in young and older (65 + years) adults. Generalized linear mixed models
were used to assess the unique contribution of salience to fixation selection in scenes. When analysing
fixation guidance without recurrence to objects, visual salience predicted whether image patches
were fixated or not. This effect was reduced for the elderly, replicating an earlier finding. When using
objects as the unit of analysis, we found that highly salient objects were more frequently selected for
fixation than objects with low visual salience. Interestingly, this effect was larger for older adults. We
also analysed where viewers fixate within objects, once they are selected. A preferred viewing location
close to the centre of the object was found for both age groups. The results support the view that
objects are important units of saccadic selection. Reconciling the salience view with the object view,
we suggest that visual salience contributes to prioritization among objects. Moreover, the data point
towards an increasing relevance of object-bound information with increasing age.
Which factors guide where we direct our attention and gaze when viewing a naturalistic scene? In recent years,
this question has sparked a scientific debate about whether fixation selection is based on image properties such
as visual salience (hereafter: salience view) or information about objects within the scene (hereafter: object view).
Here, we attempt to reconcile the two views by comparing effects of location-based and object-based visual sali-
ence, utilizing statistical analyses that allow for assessing the unique contribution of salience to fixation selection
in scenes. In addition, we explore how eye guidance in scenes changes across the lifespan by comparing young
and older (65 + years) adults.
Computational models that highlight the role of low-level image features propose that the eyes are mainly
driven toward image regions that are visually salient. The saliency map algorithms1,2 have become the reference
models in this regard. Visual salience and saliency maps attempt to define areas that “stand out” from the back-
ground, the idea being that these regions are looked at before others. The saliency map model and its descendants
indeed predict human fixation selection in free-viewing tasks reasonably well3,4.
The alternative object view stipulates that objects form an important unit of saccadic selection in scene
viewing. Empirical support for object-based selection was obtained by analysing fixation locations on scene
images with respect to object boundaries. Nuthmann and Henderson5 found that the distribution of fixations
within objects is well-described by a 2-dimensional Gaussian distribution. The distribution has a mean close to
the centre of the object, quantifying the preferred viewing location (PVL). The basic finding that viewers prefer
to send their eyes to the centre of objects has since been r eplicated6–10. Additional research has shown that the
PVL is modulated by low-level visuomotor variables such as object size, the direction of the incoming saccade,
and launch site d istance5,11. For example, saccade landing positions are systematically shifted towards their
launch site; that is, incoming saccades tend to undershoot the centre of the o bject5, which is consistent with the
hypometric bias that has been observed for saccades to single targets in peripheral v ision12,13. Object category
and affordances also play a r ole10,14. Finally, the PVL was found to be preserved when observers’ central vision
was strongly degraded15, demonstrating the importance of peripheral vision to fixation selection.
According to the object view, salience does not guide fixation selection directly but through a correlation
between salient locations and objects. In this view, the saliency map predicts fixations because it provides a
(coarse) estimate of object locations. Indeed, the original saliency map2,16 has little additional predictive power for
1
Institute of Psychology, Kiel University, Olshausenstr. 62, 24118 Kiel, Germany. 2School of Philosophy, Psychology
and Language Sciences, University of Edinburgh, Edinburgh, UK. 3Institute of Physics, Chemnitz University of
Technology, Chemnitz, Germany. 4Present address: Justus Liebig University Giessen, Giessen, Germany. *email:
nuthmann@psychologie.uni‑kiel.de
Scientific Reports | (2020) 10:22057 | https://doi.org/10.1038/s41598-020-78203-7 1
Vol.:(0123456789)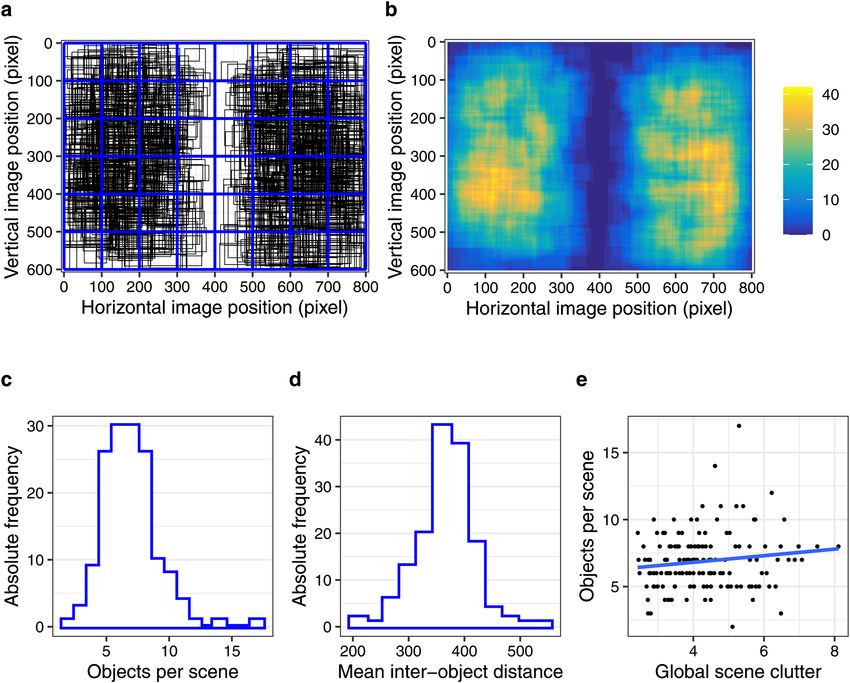
www.nature.com/scientificreports/
fixation locations if object locations are k nown17. This result has been challenged on the basis of detailed analyses
of an extended set of more recent salience models18. However, an object-based model that adequately considers
the object-based PVL5 predicts fixations equally well as the best low-level salience models19. When scenes are
experimentally manipulated to dissociate objects from regions with high low-level salience, the object-based
model even outperforms such m odels19. Pursuing a similar approach as in Stoll et al.19, Borji and T anner10 found
that a weighted linear combination of the map generated by the Adaptive Whitening Saliency (AWS) model20
and a map of object boundaries (adjusted for higher probability of fixations around the object’s centre of mass)
achieved significantly better gaze prediction than either model alone.
One advantage of salience maps is that they are image computable, which implies that they can be derived
by exclusively using information contained in the current image. By comparison, in the aforementioned stud-
ies advocating the object view of fixation selection in scenes, the objects were labelled manually by human
annotators5,19. This is not a principled limitation as computational models for object detection continue to
improve, especially those based on deep neural networks (DNNs)21. Such models have indeed been successfully
adapted for fixation p rediction22. Moreover, in the modelling literature “proto-objects” have been suggested as
an image computable alternative to “real” objects23. Although the precise definition of the term varies, in the
modelling literature “proto-object” typically refers to entities that are potential objects based on their image-
computable properties. Proto-object models can yield improvements to salience map predictions23,24. However,
one test which we deem critical is typically missing in the evaluation of such models: do fixations of human
observers within proto-objects show the PVL phenomenon? For the model by Walther and Koch25, in which
proto-objects are a function of image salience, Nuthmann and H enderson5 showed that no PVL was found for
proto-objects unless they overlapped with annotated real objects.
Although the object view is supported by experimental and modelling results, a critical question remains:
once the objects are available for selection, how do observers decide which object, out of several candidate
objects, to select for fixation? In previous research, we have argued that object-based visual salience contributes
to such prioritization among objects19. With the present study we extend this research by pursuing a number of
interrelated goals. First, we set out to replicate our previous findings in an independent sample of young adults
with different images. Second, we compared effects of location-based and object-based visual salience. Third, we
investigated the PVL for first fixations on objects in scenes. Moreover, we compared eye movements of young
and older adults.
It is important to study how well research findings generalize from young to older adults. Most psychology
research is based on studies with young adults, primarily undergraduate psychology students26. At the same time,
Western societies have to deal with ageing populations and a considerable demographic redistribution. Basic
visual and cognitive functions decline with advancing age27–29. Specifically, older age is associated with subtle
reductions in visual abilities. These include reductions in visual acuity30, contrast sensitivity31, and visual fields32.
Research using the additional singleton paradigm has shown that visually salient stimuli can capture attention
and trigger an eye movement toward their location reflexively, regardless of an observer’s i ntentions33. Studies that
examined age-related changes in capture susceptibility found mixed results. While some studies found greater
oculomotor capture in aging a dults34,35, others did n ot36. Other research has investigated how eye-movement
behaviour changes across the adult lifespan. In simple saccade-targeting tasks, older adults showed increased
saccade latency37,38 while saccade accuracy was found to be p reserved39 or to be reduced40,41. Healthy aging also
affects eye movements during sentence r eading . Older adults make more and, on average, longer fixations43.
42
Accuracy in saccade targeting appears to be relatively preserved, as suggested by analyses of the PVL for words
in reading44.
Açik et al.45 were the first to investigate developmental changes during scene viewing by comparing eye
movements from young adults, older adults, and children (mean age 7.6 years). During a 5-s viewing period,
older adults made more saccades than both young adults and children, but with shorter amplitude. At the same
time, all three age groups showed similar levels of explorative viewing behaviour. Importantly, the influence of
low-level image features on fixation selection in scenes was found to decrease with increasing age. Subsequent
studies revealed that image salience can predict fixation locations in young children46 and i nfants47. The data by
Helo et al.46 suggest that image salience was a better predictor for children between two and six years old than
for older children and adults.
In the present study, we set out to replicate Açik et al.’s45 results for local low-level image features on fixation
selection in scenes. However, instead of individual features we used a composite measure of image salience
(specifically, the AWS model), and a different analysis method. Going beyond previous research, we additionally
explored whether there were different effects of object-based visual salience for young and older adults. For both
types of analyses, we used generalized linear mixed modelling (GLMM). To assess effects of location-based visual
salience, we combined GLMM with a-priori scene parcellation using a grid with equal-sized, square cells48,49.
This analysis approach has a number of desirable properties; perhaps most importantly, we can explicitly model
the central bias of fixation50,51 by including a separate central-bias predictor in the GLMM. This allows us to
test whether location-based visual salience has an independent effect above and beyond what can be accounted
for by observers’ tendency to look at the centre of scene images, where high-salience items oftentimes appear.
In addition, we can investigate age-related differences. In another set of analyses, we extended this approach by
using object-based scene parcellation instead of a grid. With this object-based GLMM approach, we can analyse
the independent contribution of object-based visual salience and other object properties (size, eccentricity) to
object prioritization for gaze guidance19, and how these effects depend on age group. We extended our open-
source Python toolbox GridFix49 to include the data processing steps for the object-based analyses presented here.
In sum, our approach enables us to compare age-related changes in the effects of object salience on fixa-
tion guidance (object GLMM) to those of local, object-agnostic scene salience (grid GLMM). For older adults,
location-based visual salience should have a smaller effect on fixation probability than for younger a dults45. If the
Scientific Reports | (2020) 10:22057 | https://doi.org/10.1038/s41598-020-78203-7 2
Vol:.(1234567890)www.nature.com/scientificreports/
Figure 1. Real-world scene with all fixations from all 76 observers overlaid as yellow dots (a) and with tagged
object bounding boxes represented by yellow rectangles (b). The salience map (Adaptive Whitening Saliency)
for this image is shown in (c), where brighter colours correspond to higher visual salience; the object bounding
boxes from (b) are additionally displayed. The depicted photograph was taken by George L. Malcolm.
Number of fixations per trial Fixation duration (ms) Saccade amplitude (°)
Young adults 21.03 (1.91) 248.39 (23.76) 4.68 (0.56)
Age group
Older adults 20.9 (2.16) 252.49 (33.91) 4.52 (0.55)
Table 1. Mean (and standard deviation) general scanning behaviour per participant for young and older
adults.
influence of visual salience on fixation guidance generally decreases with age, effects of object salience on object
prioritization should decrease as well. Alternatively, if older observers rely more heavily on objects and high-level
structure, effects of object-based and location-based scene salience should be differentially modulated by age.
Results
Data from 42 young and 34 older adults were analysed. Every participant viewed 150 colour photographs of
natural scenes (see Fig. 1 for an example) for 6 s each.
Memory test performance and basic eye‑movement measures. In a first step, we analysed par-
ticipants’ responses to the memory test questions that occurred after 20% of the trials. The questions were yes/
no questions that were related to objects in the scenes (e.g., “Was there an oven mitt?”). All observers had a
positive d’, which is indicative of above-chance performance (young: M = 1.54, SD = 0.45, range: 0.67 to 2.33;
old: M = 1.33, SD = 0.47, range: 0.27 to 2.13). There was no significant difference between the two age groups,
t(69.8) = 1.97, p = 0.053. Observers in both groups applied conservative criteria c; that is, they had the tendency
to rather classify a present item as absent (miss) than vice versa (false alarm). On average, older observers
applied a more conservative criterion (M = 0.67, SD = 0.38, range: − 0.44 to 1.32) than young observers (M = 0.45,
SD = 0.34, range: − 0.33 to 1.19), t(66.8) = 2.68, p = 0.009.
To characterize the eye-movement behaviour of young and older adults at a basic level, we calculated their
mean number of fixations per trial, along with their mean fixation durations and saccade amplitudes (Table 1).
There were no significant differences between the age groups on number of fixations (t(66.5) = 0.29, p = 0.773),
fixation duration (t(57.18) = − 0.6, p = 0.553) or saccade amplitude (t(71.23) = 1.28, p = 0.204). However, the dis-
tributions of fixation durations and saccade amplitudes (Fig. 2) showed subtle differences between young and
older adults, which suggests that there may be systematic differences in viewing behaviour which are not well
captured by mean-level analyses.
Effects of object‑based visual salience on fixation selection. The aim of the next analysis was to
examine the effects of object eccentricity, size, and salience on fixation probability, and whether these effects
differed between young and older adults. First, object eccentricity was included to account for observers’ cen-
tral fixation bias. Based on our previous investigations49, an anisotropic Euclidean central-bias predictor was
included in the GLMM (see “Methods” for details). Second, object size was defined as the log-transformed area
(number of pixels) of the object’s bounding box (Fig. 1b). Third, object salience was defined as the mean over the
normalized saliency map’s values within the object’s bounding box (Fig. 1c). Figure 3 shows the distribution of
object properties for 1032 annotated objects (see “Methods” for additional details).
The three object-related input variables were measured on a continuous scale. Age group is a categorical
variable, which was treatment-coded (reference category: young adults). Differences between young and older
adults were tested through interactions between age group and a given continuous predictor. Thus, the GLMM
included eight fixed effects (intercept, three main effects, four interaction coefficients).
Scientific Reports | (2020) 10:22057 | https://doi.org/10.1038/s41598-020-78203-7 3
Vol.:(0123456789)www.nature.com/scientificreports/
a 0.005 b
0.004 Age group 0.15 Age group
young young
old old
0.003
density
density
0.10
0.002
0.05
0.001
0.000 0.00
0 200 400 600 0 5 10 15 20
Fixation durations (ms) Saccade amplitudes (°)
Figure 2. Basic eye-movement measures for young and older adults. Distributions of fixation durations (a) and
saccade amplitudes (b) are shown. The vertical lines represent the corresponding means.
a b c
80
Absolute frequency
Absolute frequency
Absolute frequency
60
100
60
40
40
50
20 20
0
0 0
0.00 0.25 0.50 0.75 1.00
200 400 600 7 8 9 10 11
Object eccentricity Object size Object salience × 105
Figure 3. Distribution of object properties; (a) object eccentricity, (b) object size and (c) object salience.
The GLMM results are summarized in Table 2, and the fixed-effects estimates are visualized in Fig. 4 (red
bars in both panels). Dependent variable is the probability of object fixation (1 yes, 0 no) in logit space. The
intercept in the GLMM represents the overall fixation probability. Compared to the reference group of young
adults (b = − 0.2278, SE = 0.071, z = − 3.207, p = 0.001), the model intercept was significantly lower for older adults
(b = − 0.208, SE = 0.0865, z = − 2.406, p = 0.016). The fact that the intercept for the group of young adults is signifi-
cantly different from zero has no interpretative meaning. The logit value of − 0.23 corresponds to a probability of
0.44. For the older adults, the actual coefficient for the intercept can be derived by summing the coefficient for
young adults (− 0.2278) and the interaction coefficient (− 0.208). The interaction coefficient is a difference score,
describing the difference between older and young adults. Converting the summed value to a probability value, it
becomes clear that the overall fixation probability was reduced to 0.39 for the group of older adults. These seem-
ingly low probability values for both participant groups do not imply that more than half of the annotated objects
were never fixated; instead, these values indicate that not every participant fixated every object. The question
then arises: what object properties determine whether some objects are prioritized over others?
Owing to the central bias, fixation probability was influenced by object eccentricity. Thus, young adults fixated
centrally located objects more frequently than distant objects (b = − 0.1795, SE = 0.0434, z = − 4.131, p < 0.001),
and this effect did not differ between age groups (b = 0.033, SE = 0.0409, z = 0.807, p = 0.420). Even if saccades
were generated randomly, we would observe more fixations on large objects than on small objects. Therefore, it is
not surprising that young adults’ probability of fixating objects significantly increased with increasing object size
(b = 1.028, SE = 0.0403, z = 25.485, p < 0.001). However, this effect was stronger for older adults, that is they fix-
ated larger objects disproportionally more often than smaller objects (b = 0.1567, SE = 0.032, z = 4.901, p < 0.001).
Scientific Reports | (2020) 10:22057 | https://doi.org/10.1038/s41598-020-78203-7 4
Vol:.(1234567890)www.nature.com/scientificreports/
Fixed effects Description B SE z p
Intercept Young − 0.2278 0.071 − 3.207 0.001
Intercept Old–young − 0.208 0.0865 − 2.406 0.016
Central bias Young − 0.1795 0.0434 − 4.131 < 0.001
Central bias Old–young 0.033 0.0409 0.807 0.420
Object size Young 1.028 0.0403 25.485 < 0.001
Object size Old–young 0.1567 0.032 4.901 < 0.001
Object salience Young 0.3823 0.0384 9.949 < 0.001
Object salience Old–young 0.0523 0.0219 2.387 0.017
Random effects
Groups Name Variance Correlation
Intercept 0.13466 Intercept
Central bias 0.02521 0.73 Central bias
Subject
Size 0.01161 − 0.09 0.14 Size
Salience 0.00288 0.12 − 0.28 0.17
Object Intercept 1.03523 – – –
Scene Intercept 0.09261 – – –
Table 2. Object GLMM. Age-related effects on fixation probability during scene viewing are modelled relative
to annotated objects in scenes. Standardized coefficients (b), standard errors (SE), z- and p-values for fixed
effects and variances and correlations for random effects are provided.
Importantly, object salience predicted gaze guidance above and beyond object size and eccentricity. Young adults
fixated highly salient objects more frequently than objects with low visual salience (b = 0.3823, SE = 0.0384,
z = 9.949, p < 0.001). Interestingly, this effect was significantly stronger for older adults (b = 0.0523, SE = 0.0219,
z = 2.387, p = 0.017).
Object‑based fixation times. According to the previous analysis, older adults had a reduced overall
probability of fixating objects, without having a stronger central bias. Possibly, older adults engage longer with
selected objects than young adults. To test this, we analysed two measures of fixation times. First-fixation dura-
tion is the duration of the initial fixation on the object, whereas first-pass gaze duration is the sum of all fixation
durations from first entry to first exit52,53. Thus, gaze duration includes the duration of all immediate object
refixations. The linear mixed model for each measure had the same fixed-effects structure as the object GLMM.
Fixation times were log-transformed. The results are summarized in Table 3, and the fixed-effects estimates are
visualized in Fig. 5.
For young adults, all three object variables had significant effects on first-fixation durations. There was a
significant effect of object eccentricity with longer first-fixation durations for more distant objects (b = 0.0221,
SE = 0.0055, t = 4.003). Moreover, there was a significant negative effect of object size with shorter first-fixation
durations for larger objects (b = − 0.0122, SE = 0.0045, t = − 2.726). Interestingly, there was also a significant posi-
tive effect of object salience with longer first-fixation durations for higher-salience objects (b = 0.0225, SE = 0.0046,
t = 4.933). None of the interactions with age group were significant (Table 3), indicating that there was no evidence
for significant differences between young and older adults for first-fixation durations.
Gaze durations for young adults were longer for more eccentric objects (b = 0.0314, SE = 0.0075, t = 4.176).
They were also longer for larger objects and for higher-salience objects (object size: b = 0.0599, SE = 0.0079,
t = 7.579, object salience: b = 0.039, SE = 0.0075, t = 5.207). The results for the intercept show that gaze durations
were significantly longer for older adults compared with young adults (b = 0.1046, SE = 0.026, t = 4.025). Moreover,
the effect of object eccentricity was significantly larger in older adults (b = 0.0153, SE = 0.0071, t = 2.165). The size
effect was significantly larger in older adults too (b = 0.043, SE = 0.0078, t = 5.478), whereas the salience effect did
not differ for young and older adults (b = − 0.0008, SE = 0.006, t = − 0.128).
Distributions of within‑object fixation locations: preferred viewing location. With the object
GLMM we examined variables that affect whether objects are selected for fixation and found age-related dif-
ferences in this regard. In addition, we analysed where viewers fixate within objects, once they are selected.
Analyses considered initial fixations in first-pass viewing; that is, cases in which a saccade was launched from
outside the object and led to a within-object fixation, irrespective of whether it was followed by an immediate
refixation or not. Annotated objects differed in their sizes (width, height). Moreover, individual fixations differed
with regard to the direction from which the eyes entered the object, though it has previously been demonstrated
that most saccades enter the object from the left or from the r ight5. For analyses, landing positions within objects
were normalized according to the size of the object5,9 and according to where the saccade originated8. These
normalized x- and y-coordinates ranged from − 0.5 to 0.5, with 0 corresponding to fixations at the centre of the
object and negative and positive values representing undershoots and overshoots of object centre, relative to the
previous fixation location.
Scientific Reports | (2020) 10:22057 | https://doi.org/10.1038/s41598-020-78203-7 5
Vol.:(0123456789)www.nature.com/scientificreports/
a b
Young adults (simple effects) Older adults (difference score)
***
1.0
*** ***
Standardized effect estimate (log−odds)
0.2
0.5 ***
*
0.0 0.0
*** **
**
−0.5
*** −0.2
−1.0
*** −0.4 *
−1.5
Intercept Central bias Size Salience Intercept Central bias Size Salience
Object or cell property
model object GLMM grid cell GLMM
Figure 4. Fixed-effects results from the object GLMM (red bars) and the grid GLMM (blue bars), each fitting
fixation probability during scene viewing for young (left) and older (right) adults. In particular, effects of object-
based (red) and location-based (blue) visual salience on fixation probability are compared. (a) Effects that were
estimated for the young adults. (b) Difference scores, describing the difference between older and young adults.
Error bars indicate 95% confidence intervals. Stars denote coefficients that were significantly different from zero
(* p < .05, ** p < .01, *** p < .001). Different to the object GLMM, the grid GLMM did not include a fixed-effect
for size because all cells in the grid were of equal size.
The distributions of normalized landing positions are depicted in Fig. 6; for visualization purposes, the data
were collapsed across all object sizes. First, the horizontal and vertical components of within-object fixation loca-
tions were considered separately, which allows for a direct comparison of densities for young and older adults
(Fig. 6a). To accommodate the two-dimensional nature of the data, 2D density plots are additionally presented
(Fig. 6b). The data revealed a peak (Fig. 6a) and/or a “hot spot” (Fig. 6b) close to the centre of the object, with
a slight tendency to undershoot the centre. This PVL for objects in scenes was found for both young and older
adults.
For statistical evaluation, two linear mixed models were specified, one each for horizontal and vertical normal-
ized landing positions. Each model included the intercept, object size and their interactions with age group as
fixed effects. As in the other object-based mixed models, object size was included as log-transformed object area,
rather than including object width/height in the models testing normalized horizontal/vertical landing positions,
respectively. The amplitude of the incoming saccade was not included as additional fixed effect because launch
site, landing site and object centre do not in general fall on a single straight line. This would make the choice of
an appropriate projection in 2D space a non-trivial endeavour, which is further complicated by the distortion
of the objects’ aspect ratio when mapping it to the normalized coordinate frame used for representing the PVL.
The results are summarized in Table 4. For the reference group of young adults, the intercept was signifi-
cantly smaller than 0 for both horizontal (b = − 0.0509, SE = 0.0051, t = − 9.952) and vertical landing positions
Scientific Reports | (2020) 10:22057 | https://doi.org/10.1038/s41598-020-78203-7 6
Vol:.(1234567890)www.nature.com/scientificreports/
First fixation duration Gaze duration
Fixed effects B SE t B SE t
Intercept: young 5.4532 0.0181 301.878 5.609 0.0187 300.298
Intercept: old–young 0.0398 0.0265 1.5 0.1046 0.026 4.025
Eccentricity: young 0.0221 0.0055 4.003 0.0314 0.0075 4.176
Eccentricity: old–young 0.0056 0.007 0.801 0.0153 0.0071 2.165
Size: young − 0.0122 0.0045 − 2.726 0.0599 0.0079 7.579
Size: old–young 0.004 0.0051 0.781 0.043 0.0078 5.478
Salience: young 0.0225 0.0046 4.933 0.039 0.0075 5.207
Salience: old—young − 0.0097 0.005 − 1.939 − 0.0008 0.006 − 0.128
Random effects
Groups Name SD Name SD
Intercept 0.11310 Intercept 0.10987
Object eccentricity 0.02193 Object eccentricity 0.01710
Subject
Object size 0.00610 Object size 0.02234
Object salience 0.00237 Object salience 0.00174
Object Intercept 0.08463 Intercept 0.17556
Image Intercept 0.02023 Intercept 0.03719
Table 3. Fixation times for objects in scenes. Significant coefficients are set in bold (|t|> 1.96). Results from
two linear mixed models, fitting log-transformed first-fixation durations and gaze durations on objects.
Standardized coefficients (b), standard errors (SE), and t-values for fixed effects and standard deviations (SD)
for random effects are provided.
(b = − 0.0294, SE = 0.0069, t = − 4.232). Due to the way landing positions were normalized, these results imply
that the eyes tended to undershoot the centre of the object both horizontally as well as vertically. Interestingly,
there were no significant differences between young and older adults (horizontal: b = 0.0102, SE = 0.007, t = 1.456,
vertical: b = − 0.0109, SE = 0.0095, t = − 1.144). Moreover, there was a significant negative effect of object size such
that larger objects were associated with smaller normalized landing positions, for both horizontal (b = − 0.0113,
SE = 0.0027, t = − 4.238) and vertical dimensions (b = − 0.0173, SE = 0.0033, t = − 5.227). Thus, larger objects were
associated with a stronger tendency to undershoot the centre of the object. Again, there was no evidence for
significant differences between young and older adults (horizontal: b = − 0.0023, SE = 0.0027, t = − 0.861, vertical:
b = 0.0053, SE = 0.0031, t = 1.728).
Effects of location‑based visual salience on fixation selection. To compare effects of object-based
and location-based visual salience, the object GLMM was complemented by a grid G LMM48. To this end, we
applied an 8 × 6 grid such that each image and each AWS map was divided into 48 square patches. The grid
GLMM allowed us to assess the effect of image salience across the entire scene, and without recurrence to
objects. For this analysis approach, fixations were assigned to cells of an arbitrary grid rather than objects. Since
all cells in the grid were of equal size, the GLMM did not include a fixed-effect for size. Otherwise, the fixed-
effects structure for the grid GLMM was identical to the object GLMM.
The GLMM results are summarized in Table 5, and the fixed-effects estimates are visualized in Fig. 4 (blue
bars in both panels). As before, the intercept in the GLMM represents the overall fixation probability, for which
there was no significant difference between young and older observers (Table 5). On the probability scale, mean
fixation probabilities were 0.220 and 0.224 for young and older adults, respectively. Reflecting the central bias,
fixation probability was influenced by grid cell eccentricity. Specifically, young adults fixated distant cells less
frequently than centrally located cells (b = − 0.5665, SE = 0.0364, z = − 15.564, p < 0.001), with no significant dif-
ference between age groups (b = 0.0424, SE = 0.0425, z = 0.996, p = 0.319). Importantly, cell salience influenced
fixation probability beyond physical cell location in the scene in that cells with higher average AWS saliency were
fixated more often (b = 0.6830, SE = 0.0289, z = 23.617, p < 0.001). As in the object GLMM, the effect of visual sali-
ence on fixation probability was differentially modulated by age, but now in the opposite direction. Thus, older
adults showed a reduced effect of location-based visual salience (b = − 0.0399, SE = 0.0150, z = − 2.653, p = 0.008).
Discussion
When inspecting images of real-world scenes, we move our eyes in a systematic manner. A key question regarding
eye-movement control in scenes concerns the unit of saccadic selection. In principle, this selection can be based
on localized features or on objects. A popular approach has been to extract various features at image locations
and to investigate how these features drive the eyes in a bottom-up manner54. However, in recent years there
have been a number of studies investigating the role of object-based selection5,17,19.
In the present study, we compared effects of location-based and object-based visual salience for young and
older adults. The grid GLMM allowed us to assess the effect of image salience across the entire scene. For the
sample of young adults, we had previously shown that location-based visual salience has an independent effect
Scientific Reports | (2020) 10:22057 | https://doi.org/10.1038/s41598-020-78203-7 7
Vol.:(0123456789)www.nature.com/scientificreports/
a b
Young adults (simple effects) Older adults (difference score)
0.20 0.20
***
0.15 0.15
Standardized effect estimate (log)
0.10 0.10
***
***
***
0.05 *** 0.05
*** *** *
0.00 0.00
**
−0.05 −0.05
Intercept Eccentricity Size Salience Intercept Eccentricity Size Salience
Object property
model first fixation duration gaze duration
Figure 5. Fixed-effects results for linear mixed models fitting log-transformed fixation times for objects in
scenes. One model evaluated first-fixation duration (green bars), the other one gaze duration (orange bars). Both
models compared data for young and older adults. (a) Effects that were estimated for the young adults; the large
coefficients for the intercept were not visualised (but see Table 3). (b) Difference scores, describing the difference
between older and young adults. Error bars indicate 95% confidence intervals. Stars denote coefficients that were
significantly different from zero (* |t|> 1.96, ** |t|> 2.576, *** |t|> 3.291).
above and beyond what can be accounted for by the central fixation bias49. Here, we demonstrate that this effect
is significantly smaller in older adults, which accords with previous r esearch45. The object GLMM allowed us to
bjects19. Both young and older adults selected
test the hypothesis that visual salience aids prioritization among o
highly salient objects more frequently for fixation than objects with low visual salience, while this effect was
somewhat larger for older adults. In addition, we analysed where the first fixation on an object was placed within
the object; a PVL close to the centre of the object5 was found for both young and older adults alike.
The question of what exactly an object is turns out to be less straightforward than our daily experience with
objects may suggest. What constitutes an object depends on physical properties of the stimulus; however, it also
depends on how we parse a scene in line with our behavioural goals55. Generally put, objects can be described as
entities that can be individuated within a scene and potentially carry meaning. Object-based effects on eye guid-
ance in scene perception have long been known to exist56. For example, research has shown how easily humans
search for common objects in complex real-world scenes57,58. Moreover, a classic way to explore the influence
of overall scene semantics on fixation selection has been to compare eye movements to objects that are either
semantically consistent or inconsistent within a given scene context53,59–61.
Cognitive relevance theory is a theoretical account that emphasizes the importance of scene and object
meaning62,63. In this view, the scene image is (only) needed to generate a visuospatial representation of potential
saccade targets. Importantly, image features are thought to provide a flat (i.e., unranked) landscape of potential
targets rather than a peaked salience map. Instead, potential saccade targets are ranked on the basis of relevance
to the observer’s task and behavioural goals. The present results suggest that (object-based) visual salience does
Scientific Reports | (2020) 10:22057 | https://doi.org/10.1038/s41598-020-78203-7 8
Vol:.(1234567890)www.nature.com/scientificreports/
a
Horizontal Vertical
1.5
1.0
Age group
density
young
old
0.5
0.0
−0.50 −0.25 0.00 0.25 0.50 −0.50 −0.25 0.00 0.25 0.50
Normalized landing position
b Young Old
0.50
Vertical normalized landing position
0.25 density
2.0
1.5
0.00
1.0
0.5
−0.25
−0.50
−0.50 −0.25 0.00 0.25 0.50 −0.50 −0.25 0.00 0.25 0.50
Horizontal normalized landing position
Figure 6. Preferred viewing location for objects in scenes. Analyses were based on initial fixations on objects.
(a) Distributions of the horizontal (left panel) and vertical (right panel) components of normalized within-
object landing positions are directly compared for young adults (solid line) and older adults (broken line). In
both panels, the vertical red dotted line marks a landing position at the centre of the object. (b) Corresponding
smoothed two-dimensional viewing location histograms for young adults (left panel) and older adults (right
panel). The frequency information is displayed as variations in colour, with colours ranging from blue (few
fixations) to yellow (many fixations) and passing through green and orange. The intersection of the two red
dotted lines marks the centre of the object. See text for details on the normalization procedure.
contribute to this ranking process, along with other variables, thereby challenging the assumption of a “flat”
landscape of saccade targets.
Early presentations of the cognitive relevance account put emphasis on objects as saccade t argets5,63. More
recently, the cognitive relevance approach has been complemented by the meaning map approach64,65. Con-
ceptually, a meaning map is analogous to a salience map, the difference being that it represents the spatial
distribution of semantic rather than visual features. To create a meaning map, the image is divided into circular
overlapping patches64. To measure the meaningfulness of these scene patches, human observers provide ratings
which are then combined into a meaning map. Since meaning maps and salience maps are coded in the same
format, researchers can assess the relative contributions of visual and semantic salience to fixation selection in
scenes. The key result of several studies is that meaning as defined by meaning maps is more important for this
Scientific Reports | (2020) 10:22057 | https://doi.org/10.1038/s41598-020-78203-7 9
Vol.:(0123456789)www.nature.com/scientificreports/
Horizontal Vertical
Fixed effects B SE t B SE t
Intercept: young − 0.0509 0.0051 − 9.952 − 0.0294 0.0069 − 4.232
Intercept: old–young 0.0102 0.007 1.456 − 0.0109 0.0095 − 1.144
Object size: young − 0.0113 0.0027 − 4.238 − 0.0173 0.0033 − 5.227
Object size: old–young − 0.0023 0.0027 − 0.861 0.0053 0.0031 1.728
Random effects
Groups Name SD Name SD
Intercept 0.02793 Intercept 0.03965
Subject
– – Object Size 0.00665
Object Intercept 0.06035 Intercept 0.08033
Table 4. Preferred viewing location for objects in scenes. Significant coefficients are set in bold (|t|> 1.96).
Results from two separate linear mixed models, fitting horizontal and vertical landing positions for initial
fixations on objects. Standardized coefficients (b), standard errors (SE), and t-values for fixed effects and
standard deviations (SD) for random effects are provided.
Fixed effects B SE z p
Intercept: young − 1.2669 0.0333 − 38.084 < .001
Intercept: old–young 0.0223 0.0406 0.549 0.583
Central bias: young − 0.5665 0.0364 − 15.564 < .001
Central bias: old–young 0.0424 0.0425 0.996 0.319
Salience: young 0.6830 0.0289 23.617 < .001
Salience: old–young − 0.0399 0.0150 − 2.653 0.008
Random effects
Groups Name Variance Correlation
Intercept 0.02995 Intercept
Subject Central bias 0.03294 0.80 Central bias
Salience 0.00323 0.32 0.32
Intercept 0.05510 Intercept
Scene Central bias 0.07648 0.38 Central bias
Salience 0.10889 − 0.32 0.30
Table 5. Grid GLMM. Age-related effects on fixation probability during scene viewing are modelled with
reference to equal-sized, square cells in a grid. Standardized coefficients (b), standard errors (SE), z- and
p-values for fixed effects and variances and correlations for random effects are provided.
selection process than visual salience65. It is important to note that the patches were presented independently of
the scenes from which they were taken and independently of any task besides the rating itself. The correlation
between such context-free meaning and visual salience is h igh64. Challenging the meaning map approach in its
current form, results from a recent study suggest that meaning maps index the distribution of high-level visual
features rather than m eaning66.
The larger problem is that meaning can be defined in many ways60. Complicating things further, the meaning
maps for young and older adults may be different. Young and older adults may also disagree on how meaningful
or important an object is with respect to the global context of the scene. Therefore, we chose to remain agnostic
about scene semantics but acknowledge that future work should take scene and object meaning into account.
Being agnostic about semantics also provides one major rationale for using the A WS20,67 model rather than a
more recent DNN-based m odel68. As the DNN-based models usually pre-train their lower layers on object clas-
sification tasks, it is likely that they carry some implicit semantic representation in these layers. In contrast, AWS
implicitly carries information about objectness, but this is rather related to their “Gestalt” (in a broad sense)
than to their meaning.
When dividing scene images into arrays of either circular patches64 or quadratic grid cells48 for data analysis
reasons, researchers use procedures that are indifferent to an important theoretical question: What is the unit
of the selection process? This is particularly evident in the context of meaning maps which, by design, decouple
meaning from objects.
The object-based effects on fixation probability and analyses of within-object fixation locations reported here
lend further support to the view that objects are important units of saccade targeting and, by inference, atten-
tional selection in scene p erception5,11,17. The results also allow for reconciling the salience view with the object
view: although objects dominate over visual salience in selecting regions to be fixated19, objects themselves are
Scientific Reports | (2020) 10:22057 | https://doi.org/10.1038/s41598-020-78203-7 10
Vol:.(1234567890)www.nature.com/scientificreports/
prioritized by salience. Moreover, complementary analyses of fixation durations suggest that object salience did
not only affect saccade target selection but also object encoding during fixation.
In previous studies, evidence for object-based selection in scenes was found for different task i nstructions5,19.
In addition, studies in which a scene memorisation task was compared with an aesthetic preference judgement
task have revealed only subtle differences in eye-movement behaviour64,69–71. Nevertheless, we cannot exclude the
possibility that our object-related memory questions have biased participants toward fixating individual objects in
the scenes. Moreover, it is known that effects of image salience differ for different tasks72,73. We leave it as a ques-
tion for future research to determine whether the pattern of results reported here is modulated by task demands.
From a computer vision perspective, an apparent disadvantage of the object view, which it shares with the
meaning map approach, is that it requires human annotators and/or raters. By contrast, both salience maps
as well as proto-objects are image computable. Therefore, from a computer vision perspective it may be suf-
ficient to establish correlations between salient locations and, for example, subjective interest points74, or to use
proto-objects as proxy for objects23. However, from a cognitive science perspective, what constitutes the unit of
selection during scene perception is an important question for theory building that should not be deferred for
computational convenience.
In the present study, we also investigated age-related effects by comparing eye movements of young and older
adults. Whereas there were no mean-level differences between young and older adults for number of fixations,
fixation durations, and saccade amplitudes, the mixed-model analyses revealed systematic differences in viewing
behaviour. The results from both grid and object GLMMs suggest that age does not modulate the central bias
of fixation. This is in agreement with the previously reported finding that young and older adults show similar
levels of explorative viewing behaviour overall45. The object-based results showed that, on average, observers
fixated less than half of the annotated objects during the 6-s scene viewing period. Compared with young adults,
older adults fixated significantly fewer of the annotated objects, but showed stronger effects of object size and
salience on fixation probability.
In the GLMMs, the intercept represents the overall probability of fixating an object and/or a grid cell, and
a smaller intercept should be associated with a larger central bias48. Why did we not observe this in the object
GLMM? Object-based analyses of first-pass fixation times revealed that gaze durations, but not first-fixation
durations, were longer for older adults than for young adults. This implies that older adults made more imme-
diate object refixations than young adults. Thus, older adults engaged longer with selected objects than young
adults, which may explain the finding that older adults fixated fewer of the annotated objects without exhibiting
a stronger central bias.
Effects of visual salience on fixation probability showed an age-related dissociation: compared with young
adults, older adults showed a reduced effect of location-based salience, but an increased effect of object-based
salience. While a reduced effect of location-based visual salience is compatible with the idea that older adults
rely more strongly on top-down as opposed to bottom-up c ontrol45,75, the object-based effects are less intuitive.
Objects can be considered as high-level cues for selection. According to cognitive guidance models, selecting
objects for fixation is a top-down process. Based on the present results, we argue that low-level variables like
object size and salience also contribute to this selection process. Interestingly, older adults were more strongly
guided by object size and salience than young adults.
The spatial analyses were complemented by temporal analyses related to objects that were fixated. In scene-
perception research, gaze duration has been used as a measure of object encoding53,59. For young adults, gaze
durations were longer for larger o bjects76. There was also an independent effect of object salience, with longer
gaze durations for higher-salience objects. First-fixation durations were also modulated by object salience. In
principle, the salience effects are consistent with previous location-based fixation-duration a nalyses77,78. Older
adults showed a stronger effect of object size on gaze duration, whereas the effect of object salience did not differ
between age groups.
Since the selection of the next fixation target is driven by information in parafoveal and peripheral v ision15,79,
effects of object size and salience may be associated with age-related changes in visual information processing.
When arbitrary targets were embedded at 10° eccentricity in images of everyday scenes, older adults’ detection
performance decreased with increasing a ge80. Moreover, using simple stimuli and fixation tasks it has been shown
that older adults have a smaller useful field of v iew81 and are more susceptible to visual c rowding82. However,
whether and how these effects generalize to active scene perception is currently an open research question.
Research on scene perception has established a PVL for objects in s cenes5. In previous research, the PVL
was modulated by object size and launch site distance11, whereas it was unaffected by the lack of high-resolution
information in central vision15. Therefore, in a sense, the PVL can be seen as a marker of extrafoveal processing
abilities. The present data revealed a general tendency to undershoot the centre of objects, which was more pro-
nounced for larger objects. The undershoot tendency observed for objects in s cenes5 is consistent with findings
from basic oculomotor research12,13. No differences between young and older adults were found. In future work,
object width and height could be experimentally manipulated to investigate whether older adults are impaired
in targeting objects that are particularly small or far away.
The present study focused on mean differences between young and older adults. Notably, the GLMM
approaches used here also allow for investigating individual differences, by estimating variance/covariance
components of subject-related random effects49. Hence, our method can readily be extended to the emerging
question of individual differences in gaze behaviour when viewing naturalistic s cenes83,84.
Scientific Reports | (2020) 10:22057 | https://doi.org/10.1038/s41598-020-78203-7 11
Vol.:(0123456789)www.nature.com/scientificreports/
Methods
Participants. Analyses were based on data from a corpus of eye movements during scene viewing and sen-
tence reading. Forty-two young adults who were students at the University of Edinburgh and 34 older adults
from the community participated in the eye-tracking experiment. The young adults (8 men and 34 women)
averaged 22.1 years of age (range = 18 years to 29 years), and the older adults (17 men and 17 women) averaged
72.1 years of age (range = 66 years to 83 years). All participants had normal or corrected-to-normal vision by
self-report. Participants’ visual abilities were not independently assessed. Whereas this is a potential limitation
of our study, meta-analytical results suggest that age-related differences in visual acuity do not moderate age-
related differences in higher cognitive processing85,86. Participants gave written informed consent and received
monetary compensation for their participation. The study was conducted in accordance with the Declaration of
Helsinki and approved by the Psychology Research Ethics Committee of the University of Edinburgh.
The present analyses were based on the scene-viewing data. The data from the young adults were previously
used to demonstrate how computational models of visual salience can be evaluated and compared by combining
a-priori parcellation of scenes with GLMM49.
Experimental setup and paradigm. Eye movements were recorded using an EyeLink 1000 Desktop
mount system (SR-Research, Ottawa, ON, Canada). It was equipped with the 2000 Hz camera upgrade, allowing
for binocular recordings at a sampling rate of 1000 Hz for each eye. Data from the right eye were analysed. The
experiment was implemented with the SR Research Experiment Builder software.
Each participant viewed 150 colour photographs of real-world scenes (Fig. 1a), which were presented in
random order. The scene images were displayed on a 21-inch CRT monitor at a screen resolution of 800 × 600
pixels (width × height). Head position and viewing distance were fixed at 90 cm from the screen using a chin
rest. Accordingly, scenes subtended 25.78° × 19.34°. Before the onset of each scene, a central fixation check was
performed. Afterwards, the scene was displayed for 6 s during which participants were free to move their eyes. To
provide a common task across participants, they were informed that, on a given trial, they would view a real-life
scene and that this may be followed by a question asking them to recall a specific detail of the scene. On 30 trials,
a test question asking about the presence or absence of a particular object appeared after scene presentation to
probe participants’ scene encoding.
Evaluation of memory test performance. To evaluate participants’ responses to the memory test ques-
tions, we calculated signal detection theory m easures87; that is, observers’ sensitivity (d’) and criterion (c). To
avoid numerical issues with perfect false-alarm or hit rates, we applied the correction introduced by Hautus88 in
all participants.
Gaze data processing. Raw gaze data were converted into fixation sequence reports using the SR Research
Data Viewer software. The initial, central fixation in a trial was excluded from all analyses. The last fixation in a
trial happened when we removed the scene stimulus. The participant determined the location of the last fixation
prior to the start of that fixation. Therefore, we included the last fixation in all analyses involving fixation posi-
tions, whereas we excluded it from analysis of fixation durations. Data processing was originally programmed
in MATLAB (The MathWorks, Natick, MA, USA) and then re-implemented and generalized in Python (version
3.4; http://python.org) as an extension to our open-source toolbox GridFix (version 0.3; http://doi.org/10.5281/
zenodo.4042996).
Computation of salience maps and object properties. Salience maps were computed using the AWS
odel20,67. The AWS model relies on simple visual features, such as local colours and edge orientations, to predict
m
fixations. In addition, it includes a statistical whitening procedure to improve performance. The AWS model was
chosen because it performed well in previous model e valuations4 and because it was used in some of our previ-
ous studies19,49. The saliency maps from the AWS model were generated using the MATLAB code provided by
the authors at http://persoal.citius.usc.es/xose.vidal/research/aws/AWSmodel.html. Parameters were kept at the
authors’ default values, with the exception of the output scaling factor which was set to 1.0 instead of the default
value of 0.5 to compute maps at full image resolution (Fig. 1c). By design of the AWS algorithm, maps are nor-
malized to unit integral (i.e., the sum over all pixels equals 1).
An independent annotator labelled objects in the scenes by providing object bounding boxes and object names
using custom-made software. Whereas the bounding boxes were used for object-based eye-movement analyses,
the names of the objects were used to construct the memory test questions. For a given object, a bounding box
was drawn as the smallest possible rectangle encompassing the object (Fig. 1). The annotator was instructed
to select objects that were of moderate size and were not occluded by other scene elements. Moreover, objects
were chosen such that their spatial extension did not include the vertical midline of the scene. A total of 1032
objects were tagged across the 150 scene images. The mean width and height of annotated objects were 2.5°
(SD = 1.4°) and 2.6° (SD = 1.5°), respectively. The mean Euclidean distance from object centre to scene centre was
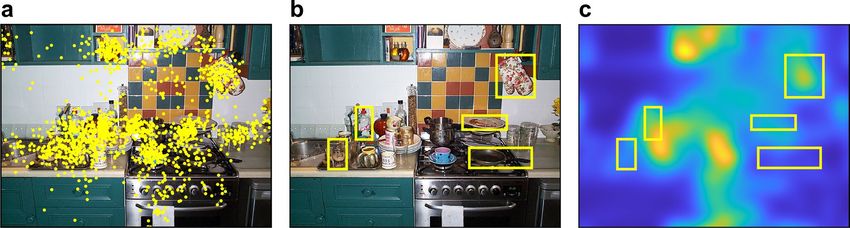
8.6° (SD = 2.6°). Figure 7a shows the distribution and size of object bounding boxes across all scenes. Figure 7b
additionally presents a summed object map. For a given image, all image pixel locations that belonged to an
annotated object were coded with 1, whereas all other locations were coded with 0. These pixel-based maps were
summed across all images to obtain a single object map. In Fig. 7b, this map is shown as heat map, with colours
ranging from blue (no objects) to yellow (many objects).
To quantify the arrangement of objects within scenes, inter-object distances were determined. The distance
between objects was calculated as the Euclidean distance between object centres (in pixels). For k objects in
a scene, there are k(k-1)/2 unique distances between objects. Next, for each scene we computed the mean
Scientific Reports | (2020) 10:22057 | https://doi.org/10.1038/s41598-020-78203-7 12
Vol:.(1234567890)You can also read