Future evolution of aerosols and implications for climate change in the Euro-Mediterranean region using the CNRM-ALADIN63 regional climate model ...
←
→
Page content transcription
If your browser does not render page correctly, please read the page content below
Atmos. Chem. Phys., 21, 7639–7669, 2021
https://doi.org/10.5194/acp-21-7639-2021
© Author(s) 2021. This work is distributed under
the Creative Commons Attribution 4.0 License.

Future evolution of aerosols and implications for climate change in
the Euro-Mediterranean region using the CNRM-ALADIN63
regional climate model
Thomas Drugé, Pierre Nabat, Marc Mallet, and Samuel Somot
CNRM, Université de Toulouse, Météo-France, CNRS, Toulouse, France

Correspondence: Thomas Drugé (thomas.druge@meteo.fr)

Received: 14 October 2020 – Discussion started: 8 December 2020
Revised: 15 March 2021 – Accepted: 13 April 2021 – Published: 20 May 2021

Abstract. This study investigates, through regional climate      and a moderate nitrate and ammonium DRF increase be-
modelling, the surface mass concentration and AOD (aerosol       tween 1.3 and 1.5 W m−2 , depending on the three scenarios
optical depth) evolution of the various (anthropogenic and       over Europe. These changes, which are similar under the dif-
natural) aerosols over the Euro-Mediterranean region be-         ferent scenarios, explain about 65 % of the annual shortwave
tween the end of the 20th century and the mid-21st cen-          radiation change but also about 6 % (in annual average) of the
tury. The direct aerosol radiative forcing (DRF) as well as      warming expected over Europe by the middle of the century.
the future Euro-Mediterranean climate sensitivity to aerosols    This study shows, with SSP 5-8.5, that the extra warming at-
have also been analysed. Different regional climate simula-      tributable to the anthropogenic aerosol evolution over Central
tions were carried out with the CNRM-ALADIN63 regional           Europe and the Iberian Peninsula during the summer period
climate model, driven by the global CNRM-ESM2-1 Earth            is due to “aerosol–radiation” as well as “aerosol–cloud” in-
system model (used in CMIP6) and coupled to the TAC-             teraction processes. The extra warming of about 0.2 ◦ C over
TIC (Tropospheric Aerosols for ClimaTe In CNRM) inter-           Central Europe is explained by a surface radiation increase
active aerosol scheme. These simulations follow several fu-      of 5.8 W m−2 over this region, due to both a surface aerosol
ture scenarios called shared socioeconomic pathways (SSP         DRF decrease of 4.4 W m−2 associated with a positive ef-
1-1.9, SSP 3-7.0 and SSP 5-8.5), which have been chosen to       fective radiative forcing due to aerosol–radiation interactions
analyse a wide range of possible future scenarios in terms of    (ERFari) of 2.7 W m−2 at the top of the atmosphere (TOA)
aerosol or particle precursor emissions. Between the histori-    and a cloud optical depth (COD) decrease of 1.3. In paral-
cal and the future period, results show a total AOD decrease     lel, the simulated extra warming of 0.2◦ C observed over the
between 30 % and 40 % over Europe for the three scenar-          Iberian Peninsula is due to a COD decrease of 1.3, leading to
ios, mainly due to the sulfate AOD decrease (between −85         a positive effective radiative forcing due to aerosol–cloud in-
and −93 %), that is partly offset by the nitrate and ammo-       teractions (ERFaci) of 2.6 W m−2 at the TOA but also to an
nium particles AOD increase (between +90 and +120 %).            atmospheric dynamics change leading to a cloud cover de-
According to these three scenarios, nitrate aerosols become      crease of about 1.7 % and drier air in the lower layers, which
the largest contributor to the total AOD during the future pe-   is a signature of the semi-direct forcing. This study thus high-
riod over Europe, with a contribution between 43.5 % and         lights the necessity of taking into account the evolution of
47.5 %. It is important to note that one of the precursors of    aerosols in future regional climate simulations.
nitrate and ammonium aerosols, nitric acid, has been imple-
mented in the model as a constant climatology over time.
Concerning natural aerosols, their contribution to the total
AOD increases slightly between the two periods. The differ-
ent evolution of aerosols therefore impacts their DRF, with a
significant sulfate DRF decrease between 2.4 and 2.8 W m−2

Published by Copernicus Publications on behalf of the European Geosciences Union.
7640                                                                T. Drugé et al.: Aerosols in regional climate projections

1   Introduction                                                   et al., 2015; Da Silva et al., 2018; Boé et al., 2020; Pavlidis
                                                                   et al., 2020). Indeed, Nabat et al. (2015) showed, thanks to
Due to their optical and microphysical properties, atmo-           the CNRM Regional Climate System Model (RCSM) ocean–
spheric aerosols are known to have an essential role in the        atmosphere coupled regional modelling system, which inte-
regional and global climate system. Indeed, they are able to       grated a realistic aerosol climatology over the period 2003–
modify the entire energy balance as well as cloud properties       2009 (Nabat et al., 2013), a surface shortwave direct aerosol
and the hydrological cycle (Forster et al., 2007; Tang et al.,     radiative forcing (DRF) on the order of −20 W m−2 over
2018). The Earth’s radiative budget is modified by aerosol–        the Mediterranean Sea and North Africa and on the order of
radiation interactions (ari), which correspond to what is usu-     −15 W m−2 over Europe. Other studies, such as Papadimas
ally referred to as the direct and semi-direct aerosol effects,    et al. (2012), have shown similar values over the Mediter-
and also by aerosol–cloud interactions (aci) that include what     ranean basin with a mean aerosol DRF at the surface of about
has earlier been referred to as the indirect aerosol effect        −16.5 W m−2 . Over Europe and the Mediterranean Sea, the
(Boucher et al., 2013). The direct radiative effect consists       cooling effect shown by Nabat et al. (2015) at the surface
of the absorption and scattering of the incident radiation         is partially offset by the semi-direct radiative effect, a con-
(Mitchell, 1971; Coakley et al., 1983). The absorption of so-      sequence of a change in cloud cover and atmospheric cir-
lar radiation by aerosols can also affect the atmospheric ther-    culation. At the surface, the net radiative forcing (direct +
modynamic properties and dynamics as well as the evapora-          semi-direct aerosol effect) is therefore negative over Europe,
tion of clouds (semi-direct effect; Hansen et al., 1997; Allen     the Mediterranean Sea and North Africa (−16.2, −11.7 and
and Sherwood, 2010). Finally, due to their role as condensa-       −21.0 W m−2 respectively) and consequently leads to a sur-
tion nuclei, aerosols can also modify the microphysical and        face cooling of about 0.5 ◦ C over the Mediterranean basin.
radiative cloud properties, which notably have consequences        Using a RegCM3 simulation, Zanis et al. (2012) showed
on cloud albedo and lifetime (indirect effect; Twomey, 1977;       in their study that the anthropogenic aerosols induced small
Albrecht, 1989; Lohmann and Feichter, 2005). Over the past         changes in the yearly averaged surface temperature over Eu-
few years, efforts have been made to quantify the magnitude        rope during the period 1996–2007 with a maximum temper-
of the different aerosol radiative effects on the radiative bud-   ature drop in the order of 0.2 ◦ C over the Balkan Peninsula.
get (Boucher et al., 2013; Myhre et al., 2013a; Stevens, 2015;     Finally, the study of Pavlidis et al. (2020) carried out over
Allen et al., 2020) but their quantification still shows large     the period 2004–2008 with the Weather Research and Fore-
uncertainties (Myhre et al., 2020; Bellouin et al., 2020).         casting (WRF) model shows a negative direct aerosol effect
   The Mediterranean region is characterized by important          over Europe ranging from −17 to −5 W m−2 depending on
aerosol loads composed of both natural (mineral dust and sea       the season, which is partly offset by small positive changes
salt) and anthropogenic (sulfate, nitrate, ammonium, black         in the cloud radiative effect (+5 W m−2 ), attributed to the
and organic carbon) particles (Lelieveld et al., 2002; Nabat       semi-direct aerosol effect. The authors of this study also
et al., 2013). These aerosols come from different sources          showed that the study of aerosol–cloud interactions can lead
such as the Sahara, but also from industries, European cities,     to small changes in cloudiness, especially low-level clouds,
forest fires and even the Mediterranean Sea itself (Lelieveld      and circulation anomalies in the lower and mid-troposphere.
et al., 2002). This important variety in aerosol sources leads     Lastly, they also highlighted a surface cooling between 0.1
to complex physico-chemical and optical aerosol properties         and 0.5 ◦ C due to aerosol–radiation interactions. At the top
over the basin, making the Euro-Mediterranean region a par-        of the atmosphere (TOA), the direct aerosol radiative forc-
ticularly interesting area for studying aerosol–climate inter-     ing is more contrasted, with values that can be positive over
actions (Basart et al., 2009; Nabat et al., 2015).                 North Africa (especially in summer) and negative over the
   Besides, given the complex Euro-Mediterranean climate,          Mediterranean Sea and Europe due to surface albedo dif-
which is highly dependant on orography and regional winds,         ferences (Nabat et al., 2015). Over a longer period of time,
the fluxes exchange between the Mediterranean Sea and the          Nabat et al. (2014) have also shown the important role of
atmosphere, the significant contrasts of the surface albedo        aerosols in the climate trends observed in recent decades. In
and the high spatial and temporal variability of aerosols,         particular, they have shown that the sulfate aerosol decrease
regional climate models with relatively fine resolution are        since the 1980s over Europe and the Mediterranean Sea has
therefore essential to investigate the aerosol–climate interac-    largely contributed to the incident solar radiation increase at
tions over this region (Gibelin and Déqué, 2003; Gao et al.,       the surface (81 ± 16 %) as well as to the warming (23 ± 5 %)
2006; Giorgi and Lionello, 2008; Herrmann et al., 2011). Un-       over the Mediterranean region. This phenomenon has also
til recently, few studies have addressed the aerosol impact        been studied over Europe by Zubler et al. (2011) with the
on the Euro-Mediterranean climate using a regional climate         COSMO-CLM version over the period 1970–2000. In par-
model over a multi-year period. Nevertheless, some studies         ticular, they showed a strong brightening of up to 10 W m−2
have shown that aerosols have a strong impact on surface ra-       in the annual mean over this period for mid-Europe.
diation, temperature and precipitation in this region (Zubler         The climate of the Mediterranean region, alternating be-
et al., 2011; Zanis et al., 2012; Spyrou et al., 2013; Nabat       tween hot and dry summers and mild and wet winters,

Atmos. Chem. Phys., 21, 7639–7669, 2021                                             https://doi.org/10.5194/acp-21-7639-2021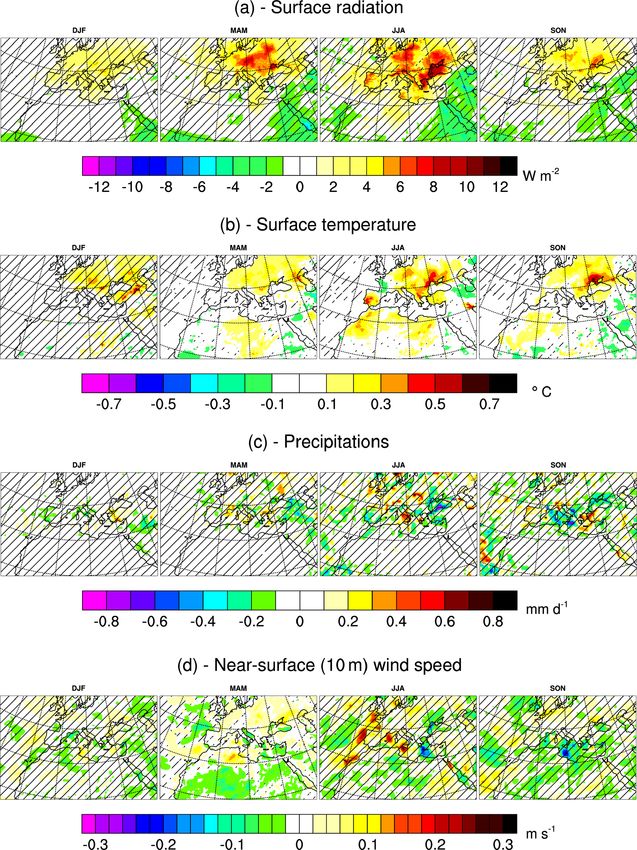
T. Drugé et al.: Aerosols in regional climate projections                                                                    7641

is highly reactive to current global climate change. The            tion on the future Euro-Mediterranean climate change. Since
Mediterranean area is even considered as a climate change           the CNRM-ALADIN63 regional climate model is uncoupled
“hotspot” (Giorgi, 2006). Indeed, Jacob et al. (2014) have          with the ocean, this study is mainly focused on quick cli-
showed, based on a set of seven high-resolution regional            mate responses to aerosols. After a description of the CNRM-
models from the CORDEX project, a strong temperature in-            ALADIN63 regional model and its aerosol scheme in Sect. 2,
crease at the end of the century (2071–2100) compared to            the evolution of the different aerosols as well as their radia-
the period 1971–2000 that is on the order of 1 to 4.5 ◦ C with      tive forcing will be presented in Sect. 3. The future Euro-
the representative concentration pathway (RCP) 4.5 and on           Mediterranean climate sensitivity to aerosols will be dis-
the order of 2.5 to 5.5 ◦ C with the RCP 8.5. Other studies         cussed in Sect. 4 before the concluding remarks in Sect. 5.
from the ENSEMBLES project have also predicted a temper-
ature increase of the same order of magnitude with the A1B
scenario (Hewitt, 2004; van der Linden and Mitchell, 2009).         2     Model and experiments
These various studies have also shown a significant precipita-
                                                                    2.1    The CNRM-ALADIN63 regional climate model
tion increase of at least 25 % over a large part of Central and
northern Europe, as well as a precipitation decrease around         The current work has been carried out with the CNRM-
the Mediterranean Sea. Other studies such as those of Giorgi        ALADIN63 regional climate model (Nabat et al., 2020) that
and Lionello (2008) or of Thiébault and Moatti (2016) con-          was developed at the CNRM (National Centre for Meteoro-
firm these results. Given this Mediterranean climate sensitiv-      logical Research). It includes an interactive aerosol scheme
ity to climate change, but also the important aerosol radiative     described below. It also includes the SURFEX land surface
effect on the past and present climate of this region men-          module (Masson et al., 2013) with the ISBA scheme (Noil-
tioned above, it is necessary to take into account the aerosol      han and Planton, 1989) that models water and energy ex-
evolution to study the impact of these particles on the future      changes at the interface between the plant, soil and atmo-
Euro-Mediterranean climate. Boé et al. (2020) and Gutiér-           sphere. SURFEX will then provide the mean values of differ-
rez et al. (2020) have also recently highlighted the need to        ent data such as the ascending radiation or the surface albedo,
take into account the anthropogenic aerosol evolution in or-        which are necessary for the CNRM-ALADIN63 model ra-
der to study the future evolution of climate over Europe and        diative scheme. Lastly, land surface hydrology and river flow
in particular the solar radiation changes. For the time being,      are simulated by the TRIP model (Oki and Sud, 1998) ac-
a few studies have only addressed the variability of the sur-       cording to the evaporation–precipitation balance provided by
face fine particles mass concentration, in particular the PM10      ISBA.
and PM2.5 , using air quality prediction models. These stud-           CNRM-ALADIN63 is a bi-spectral, hydrostatic limited-
ies have shown a decline in PM10 over Europe in the future          area regional climate model with a semi-Lagrangian ad-
(Lacressonnière et al., 2014; Markakis et al., 2014; Lacres-        vection and a semi-implicit scheme. The configuration of
sonnière et al., 2017; Cholakian et al., 2019). The intensity       CNRM-ALADIN63 used here over the Euro-Mediterranean
of this decrease depends on the period that is taken into ac-       region has a 50 km horizontal resolution and 91 vertical lev-
count and on the inputs used. Cholakian et al. (2019) showed        els. Contrary to the globe, the domain is not periodic, so an
in particular a PM10 concentration decrease, in the 2050s, of       extension zone used only for Fourier transforms has been
about 12 % over Europe for the RCP 4.5.                             added with the aim of achieving the bi-periodization. The
   Nevertheless, there are still few studies dedicated to in-       CNRM-ALADIN63 model includes the Fouquart and Mor-
vestigating the impact of anthropogenic and natural aerosols        crette shortwave radiation scheme (FMR; Fouquart and Bon-
on the future Euro-Mediterranean climate. Moreover, to our          nel, 1980; Morcrette et al., 2008) with six spectral bands and
knowledge, this question has never been addressed by us-            the RRTM (rapid radiative transfer model) longwave radia-
ing a regional climate model with interactive aerosols pro-         tion scheme (Mlawer et al., 1997).
viding a realistic description of the different particles and al-      The Euro-Mediterranean domain chosen for this study,
lowing for the study of their impact on the climate. In that        presented in Fig. 1, includes the official domain of the Med-
context, the first aim of this study is to investigate the evo-     CORDEX initiative (Ruti et al., 2016) as well as an extension
lution of the different (natural and anthropogenic) aerosol         to take into account the two main dust sources (the Sahara
loads (mass surface concentration and aerosol optical depth)        and the largest part of the Arabian Peninsula). This domain
in the future using the CNRM-ALADIN63 regional climate              represents 128 × 180 points, including a bi-periodization of
model and its TACTIC aerosol scheme (Nabat et al., 2020).           11 points (north and east) and a classical relaxation zone of 8
In addition, the use of the recent anthropogenic emission           points (on each side). The Europe and the Mediterranean Sea
dataset provided for the sixth phase of the Coupled Model           regions are highlighted in Fig. 1 for the needs of this study.
Intercomparison Project (CMIP6) allows for more realistic
emissions than those of previous studies. In addition, this
regional modelling tool will serve to address the evolution
of direct radiative forcing and the impact of aerosol evolu-

https://doi.org/10.5194/acp-21-7639-2021                                             Atmos. Chem. Phys., 21, 7639–7669, 2021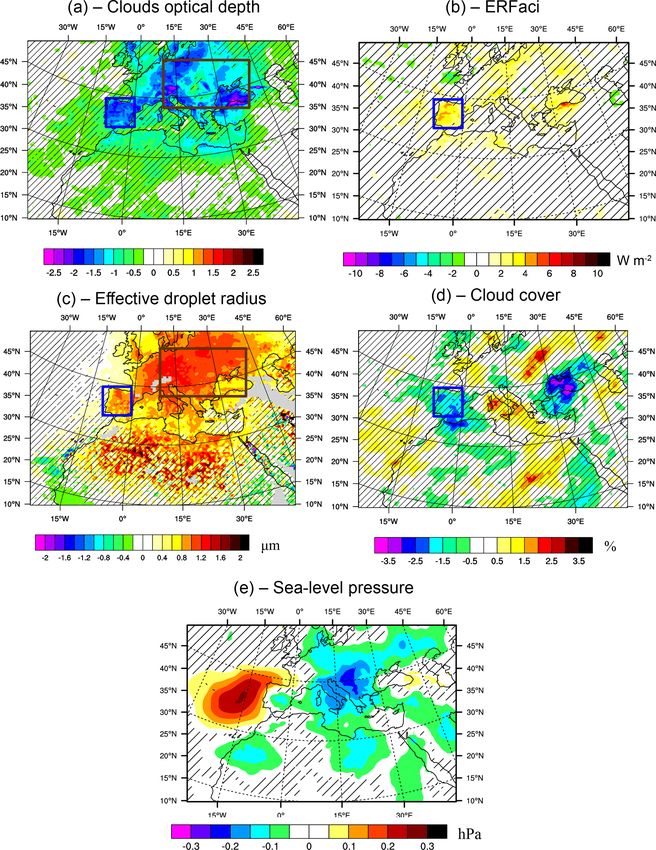
7642                                                                      T. Drugé et al.: Aerosols in regional climate projections

                                                                            To represent the particle size spectrum, the TACTIC
                                                                         aerosol scheme includes 16 prognostic variables using sev-
                                                                         eral size bins for some specific species. In detail, three size
                                                                         bins are used for dust aerosols (0.01 to 1.0, 1.0 to 2.5 and 2.5
                                                                         to 20 m) and for primary sea salt (0.01 to 1.0, 1.0 to 10.0 and
                                                                         10.0 to 100.0 m). Organic matter and black carbon aerosols
                                                                         are both separated into two different bins (hydrophilic and
                                                                         hydrophobic particles). Only one bin is used for sulfate par-
                                                                         ticles and another is used for its precursors, notably sulfur
                                                                         dioxide (SO2 ). Recently, nitrate aerosols have been included
                                                                         in the TACTIC aerosol scheme (Drugé et al., 2019). This
                                                                         specific tracer is divided into two different bins (for fine
                                                                         and coarse modes). The last two bins are used for ammo-
                                                                         nium and ammonia tracers. It is important to note that one
                                                                         of the ammonium and nitrate aerosol precursors, nitric acid
                                                                         HNO3 , is implemented in the model as a constant monthly
                                                                         climatology based on the CAMS reanalysis (Inness et al.,
                                                                         2019), which is an important limitation in this study. Nev-
Figure 1. AOD of the dominant aerosol species (sea salt, ammo-           ertheless, a sensitivity test (not shown here) highlighted that
nium, organic carbon, nitrate, sulfate, black carbon and dust) at each   in the CNRM-ALADIN63 model, the nitrate concentration
point over the Euro-Mediterranean region (28 August 1974). The in-       is impacted relatively little by the use of a constant or time-
ner model domain, without the bi-periodization and the relaxation        dependent nitric acid climatology. This constant HNO3 cli-
zones, represents 101 × 153 points. The projection type used here is     matology used in this model version for past and future sim-
the Lambert conformal projection. The two main zones used in this        ulations, and the whole nitrate–ammonium module, are de-
study, Europe and the Mediterranean Sea, are highlighted in red.
                                                                         scribed in detail in Drugé et al. (2019). The different primary
                                                                         aerosol mass concentrations can be dynamically calculated
                                                                         online as a function of surface wind and soil characteristics
2.2    The TACTIC aerosol scheme
                                                                         (dust, primary sea salt) or based on external emission datasets
CNRM-ALADIN63 incorporates an interactive aerosol                        from anthropogenic and/or biomass burning particles (black
scheme named TACTIC (Tropospheric Aerosols for ClimaTe                   carbon, organic matter, sulfate, nitrate and ammonium). Af-
In CNRM; Michou et al., 2015; Nabat et al., 2015; Wat-                   ter being emitted into the atmosphere, all aerosol species are
son et al., 2018; Drugé et al., 2019; Michou et al., 2020;               then transported and submitted to the dry and wet (in and be-
Nabat et al., 2020), which was originally based upon the                 low clouds) deposition. Finally, it is important to note that in
GEMS/MACC aerosol module of the ECMWF operational                        the present study, the defined ALADIN domain is supposed
forecast model (Morcrette et al., 2009). The version of this             to be large enough to include all aerosol sources affecting
aerosol scheme used in this study is described in detail in              the Euro-Mediterranean region and the long-range transport
Nabat et al. (2020).                                                     of particles is not included in the lateral boundary forcing.
   Initially, this aerosol scheme takes into account five                   The different radiative properties of each aerosol species,
aerosol types (desert dust, sea salt, black carbon, organic              and notably those used as input for the radiative transfer
matter and sulfate) and recently nitrate and ammonium par-               scheme (the extinction coefficient, asymmetry parameter and
ticles have been added as presented in Drugé et al. (2019).              single scattering albedo), are set for each aerosol type fol-
The TACTIC aerosol scheme makes it possible to simulate                  lowing Nabat et al. (2013) and Drugé et al. (2019). These
the aerosol life cycle (emission, transport and deposition),             different aerosol optical properties are pre-calculated using a
considering the different aerosols as prognostic variables and           Mie code using the hypothesis of aerosol sphericity (Acker-
taking into account their direct and semi-direct radiative ef-           man and Toon, 1981) and are dependant on relative humid-
fects. The first indirect aerosol effect (cloud albedo) is also          ity, with the exception of mineral dust and hydrophobic black
represented for sulfate, organic matter and sea salt aerosols.           and organic carbon particles.
On the other hand, the second indirect effect (interactions                 The different simplifications presented previously, such as
between aerosols and cloud microphysics) is not included                 the limited number of bins used for anthropogenic aerosols,
in this aerosol scheme. Finally, secondary organic aerosols              the hypothesis of the external mixing state between the dif-
(SOAs) are taken into account through the climatology of                 ferent species or the fact that the aerosol optical properties
Dentener et al. (2006), but their formation is not explicitly            are not calculated online in the model, are necessary to keep
included in the TACTIC aerosol scheme.                                   the regional model at a reasonable computation cost, which
                                                                         in this configuration is well adapted to perform multi-decadal
                                                                         simulations.

Atmos. Chem. Phys., 21, 7639–7669, 2021                                                    https://doi.org/10.5194/acp-21-7639-2021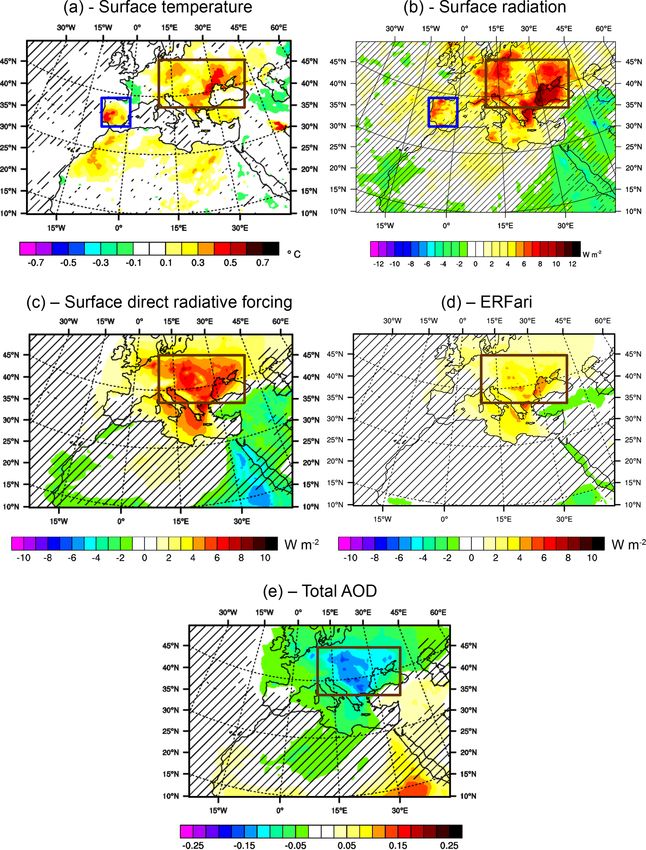
T. Drugé et al.: Aerosols in regional climate projections                                                                               7643

Figure 2. CMIP5 and CMIP6 emissions (kg m−2 s−1 ) over Europe from the main activity sectors (residential, agriculture, energy, industrial,
air, land and sea transport, waste and solvents) for sulfur dioxide, ammonia, black carbon and organic carbon. The large filled dots symbolize
the three scenarios chosen for this study (SSP 1-1.9, SSP 3-7.0 and SSP 5-8.5). Shaded bars highlight the past and future simulations period.

2.3   Simulations                                                        nomic pathways (SSPs; O’Neill et al., 2017), namely SSP 1-
                                                                         1.9, SSP 3-7.0 and SSP 5-8.5. The choice of these scenarios
The TACTIC aerosol scheme presented previously allows us                 will be explained below (Sect. 3.1). These four simulations
to study in the following section the variation of aerosols be-          will be named Hist, SSP119, SSP370 and SSP585 respec-
tween the past (from 1971 to 2000; reference period com-                 tively. All these different simulations use the CMIP6 dataset
monly used) and the future (from 2021 to 2050) period.                   for the emission of the different aerosols or aerosol precur-
The near future has been selected as the future period be-               sors. The historical dataset is based on two main sources,
cause, unlike greenhouse gases, the most important aerosol               namely the anthropogenic emissions (Hoesly et al., 2018)
change is up to the middle of the century (see Figs. 2 and 3).           and the biomass burning emissions (van Marle et al., 2017).
In their study, Allen et al. (2020) have effectively shown               The anthropogenic emissions of the different aerosols and
that non-methane mitigation leads to a net warming effect                their precursors are provided from the main sectors of activ-
in the near-term due to the removal of aerosol. Moreover,                ity (residential, agriculture, energy, industrial, air, land and
the near future horizon period is most suitable to help pub-             sea transport, waste and solvents) for each country and for
lic decision-makers. For this purpose, a first simulation over           each grid point at 0.5◦ resolution, while the emissions from
the past period (1971–2000) and three simulations over the               biomass fires (natural and anthropogenic) are provided over
future period (2021–2050) were carried out. These future                 the period 1750–2014. Future CMIP6 emissions are provided
ALADIN simulations are based on three shared socioeco-

https://doi.org/10.5194/acp-21-7639-2021                                                    Atmos. Chem. Phys., 21, 7639–7669, 2021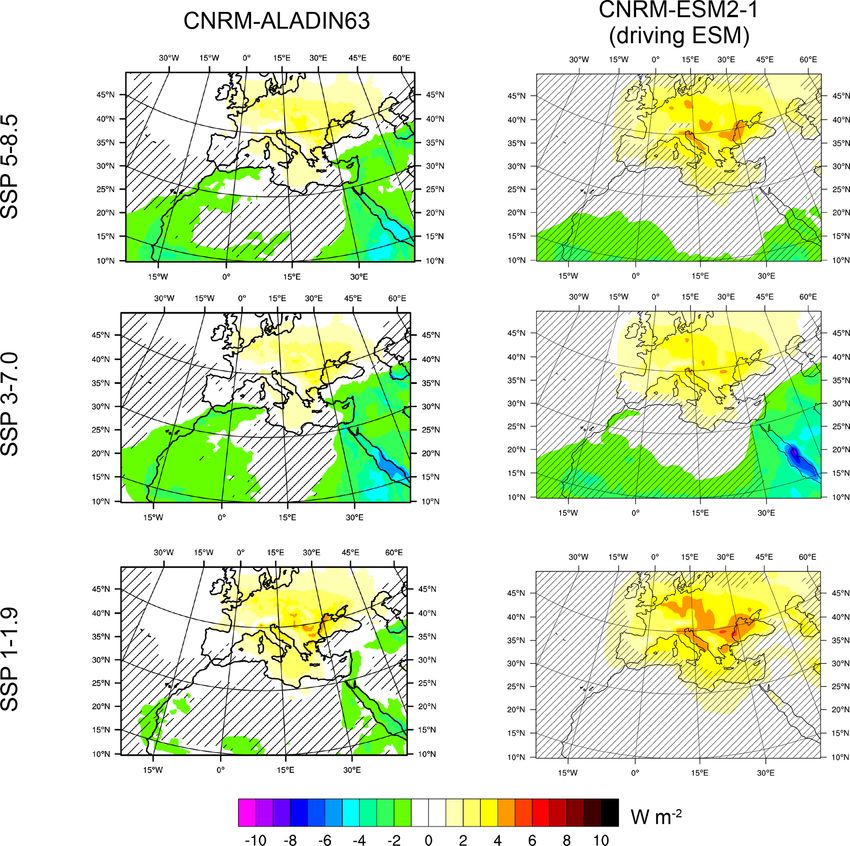
7644                                                                     T. Drugé et al.: Aerosols in regional climate projections

                                                                        at 550 nm. Table 1 summarizes the characteristics of the dif-
                                                                        ferent simulations used in this study.
                                                                           All these simulations are driven by the CNRM-ESM2-
                                                                        1 Earth system model (Séférian et al., 2019), which has a
                                                                        horizontal resolution of about 150 km. This global climate
                                                                        model, which contributes to the sixth phase of the Cou-
                                                                        pled Model Intercomparison Project (CMIP6; Eyring et al.,
                                                                        2016), is developed by the CNRM and CERFACS (Euro-
                                                                        pean Center for Research and Advanced Training in Sci-
                                                                        entific Computing) modelling groups. The physical core of
                                                                        this climate model is the global coupled ocean–atmosphere
                                                                        model CNRM-CM, whose version 6 is used here (Voldoire
                                                                        et al., 2019). CNRM-ESM2-1 is mainly dedicated to the re-
                                                                        alization of climate scenarios and is composed of different
                                                                        models such as the ARPEGE climate model (Roehrig et al.,
                                                                        2020) for the atmosphere, NEMO for the ocean (Madec et al.,
Figure 3. Global CO2 concentration evolution (ppmv) over the pe-        2017) and REPROBUS (Lefevre et al., 1994) for the chem-
riod 1970–2100 according to eight different SSPs. The three scenar-     istry. Like the CNRM-ALADIN63 model, this global model
ios chosen for this study (SSP 1-1.9, SSP 3-7.0 and SSP 5-8.5) are      also includes the TACTIC prognostic aerosol scheme, in-
highlighted by solid lines. Shaded bars highlight the past and future   cluding all the aerosols present in TACTIC with the excep-
simulations period.                                                     tion of nitrate and ammonium particles. The CNRM-ESM2-
                                                                        1 model also integrates the SURFEX continental surface
                                                                        modelling platform (Masson et al., 2013) with the ISBA-
                                                                        CTRIP land surface model (Decharme et al., 2019) and
in the same format, derived from the different SSPs (Gidden             a lake model named Flake (http://www.flake.igb-berlin.de/,
et al., 2019).                                                          last access: 17 May 2021; Le Moigne et al., 2016). Fi-
   Finally, a fifth simulation named SSP585cst, which will              nally, the CNRM-ESM2-1 model also integrates a sea ice
be used in Sect. 4 of this study was also carried out with the          scheme (GELATO; Mélia, 2002) and a marine biogeochem-
SSP 5-8.5. This simulation is similar to the SSP585 simu-               istry module (PISCES; Aumont and Bopp, 2006). All these
lation but with constant aerosol and aerosol precursor emis-            CNRM-ESM2-1 model components are presented in detail
sions that correspond to the average historical emissions over          in Séférian et al. (2019). It is worth mentioning that CNRM-
the 1971–2000 period. As a reminder, these five simula-                 ALADIN63 and CNRM-ESM2-1 share the same physical
tions were carried out at 50 km resolution with the CNRM-               basis (atmosphere, surface, aerosols) and the same climate
ALADIN63 model including the TACTIC aerosol scheme                      forcings (solar forcing, GHGs, aerosol emissions, ozone) as
and are uncoupled with the ocean. No specific spinup was                much as possible.
used for these simulations but the restart is that of the end
of the simulations presented in Drugé et al. (2019). Atmo-              2.4   Anthropogenic CMIP6 emissions
spheric lateral boundary conditions, sea surface temperature,
sea ice cover and ozone concentrations come from histori-               As mentioned above, the CMIP6 emissions of aerosols or
cal and respective scenario simulations carried out with the            aerosol precursors are provided by Hoesly et al. (2018) and
global Earth system model CNRM-ESM2-1 (Séférian et al.,                 van Marle et al. (2017) for the historical period (1750–2014)
2019) presented below. As the chosen domain is assumed to               and by Gidden et al. (2019) for the future period (2015–
be large enough to include the main sources of aerosols over            2100) following the various SSPs. The anthropogenic emis-
the Euro-Mediterranean region, no aerosols are transmitted              sions, ranging from 1971 to 2100 over Europe, are presented
from the global model CNRM-ESM2-1 to the regional model                 in Fig. 2 for sulfur dioxide, ammonia, black carbon and or-
CNRM-ALADIN63. Land use changes are not considered                      ganic carbon according to the different existing scenarios.
in this study. The historical evolution of the different green-         Compared to the previous CMIP5 inventory, which has been
house gases (GHGs) is included in these simulations follow-             improved by taking better account of the different emission
ing the yearly global averages of Meinshausen et al. (2017).            sectors as well as re-evaluated emission factors, this CMIP6
Besides, following Matthes et al. (2017), the total solar ir-           dataset presents some differences as shown in Fig. 2, in
radiance forcing is also taken into account with yearly aver-           particular for ammonia emissions. Indeed, CMIP6 anthro-
ages. Finally, the stratospheric aerosol radiative forcing, in-         pogenic ammonia emissions show a decrease from the 1990s,
cluding the contribution of the main historical volcanic erup-          whereas the previous CMIP5 inventory showed the opposite
tions such as Mt. Pinatubo in 1991, is included through the             trend with an increase in ammonia emissions. Despite this,
Thomason et al. (2018) dataset, providing stratospheric AOD             for other aerosols or aerosol precursors, trends are similar

Atmos. Chem. Phys., 21, 7639–7669, 2021                                                  https://doi.org/10.5194/acp-21-7639-2021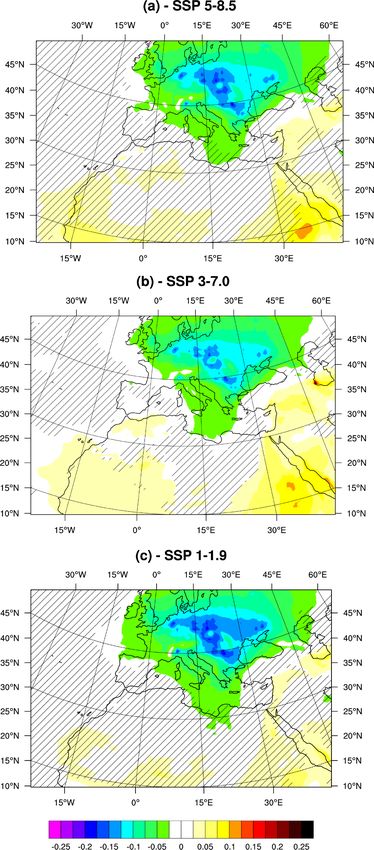
T. Drugé et al.: Aerosols in regional climate projections                                                                         7645

Table 1. Summary of the main characteristics of the five simulations used in this study.

                                                 Hist           SSP119         SSP370       SSP585       SSP585cst
             Period of simulation                1971–2000      2021–2050      2021–2050    2021–2050    2021–2050
             Scenario                                           SSP 1-1.9      SSP 3-7.0    SSP 5-8.5    SSP 5-8.5
             Anthropogenic aerosol emissions     Historical     SSP 1-1.9      SSP 3-7.0    SSP5-8.5     Historical (average)

between the two datasets, such as for sulfur dioxide, which              due to the large amount of natural aerosols such as desert
shows a peak in the early 1980s followed by a significant                dust or primary sea salts over this area. Nevertheless, over
decrease in both emission inventories. Figure 2 shows a de-              the period 1971–2000, the total AOD over Europe is similar
crease in emissions over the historical period for all aerosols,         to that over the Mediterranean Sea on the order of 0.2. Con-
particularly from the 1990s. The most significant decrease,              cerning the aerosol evolution between the historical period
by about 80 %, concerns sulfur dioxide, a precursor of sul-              1971–2000 and the future period 2021–2050, Figs. 4 and 5
fate aerosols, which had the highest emissions. Indeed, sulfur           show a future concentration and total AOD decrease over Eu-
dioxide emissions were approximately divided by five be-                 rope and the Mediterranean Sea. Figure A1 shows that this
tween 1980 and 2010. Concerning the different scenarios,                 AOD trend over Europe present in the CNRM-ALADIN63
this figure shows that, with the exception of ammonia, the               model (−0.07 on average) is also found with its forcing
majority of them predict a decrease in the different emissions           model (CNRM-ESM2-1; −0.08 on average) as well as with
in the future. However, in the ammonia case, several scenar-             the average of the different members carried out with this
ios such as the SSP 5-3.4, the SSP 4-6.0 or the SSP 3-7.0                ESM model (−0.08 on average). In terms of AOD, Figs. 4
predict higher emissions by 2100 compared to 2010 (+60 %,                and 5 show an annual decrease equivalent to about −0.07 on
+10 % and +20 % respectively).                                           average according to the SSP 5-8.5 over Europe and −0.02
   The choice of the three scenarios used in this study gives            over the Mediterranean Sea. This total AOD decrease is ex-
a contrasted range of values in terms of radiative forcing but           plained, in part, by the strong decrease in sulfate concentra-
also in terms of aerosol or aerosol precursor emissions. In ad-          tion and AOD that is notable between the past and the future
dition, as shown in Fig. 3, which presents the CO2 concentra-            periods in all months of the year. Indeed, over Europe, sulfate
tion evolution, the SSPs 1-1.9 and 5-8.5 allow us to have the            AOD decreases from 0.12 on average over the historical pe-
widest possible range of future radiative forcing. Lastly, the           riod to 0.01 over the future period according to the SSP 5-8.5,
SSP 1-1.9 is interesting as it represents one of the few combi-          i.e. a decrease of 90 %. Similarly, over the Mediterranean Sea
nations that can be used to comply with the Paris Agreement              this decrease is on the order of 85 %. However, this sharp sul-
and thus limit the global temperature increase to 1.5 ◦ C by             fate AOD drop and thus the total AOD decrease is compen-
2100. The SSP 3-7.0 was chosen as an intermediate scenario               sated for by a nitrate and ammonium AOD increase of about
between the SSP 1-1.9 and the SSP 5-8.5 and because it is                30 %, as shown in Fig. 5. On average over Europe (Fig. 5a),
one of the scenarios characterized by an ammonia emission                the nitrate AOD increases from 0.03 (0.01 for ammonium)
increase. These different scenarios thus make it possible to             over the period 1971–2000 to 0.06 (0.02 for ammonium) over
study the evolution of all the aerosols present over the Euro-           the period 2021–2050, i.e. a 100 % increase again according
Mediterranean region thanks to a wide range of possible fu-              to the SSP 5-8.5. Over the Mediterranean Sea (Fig. 5b), the
tures in terms of concentration and optical thickness of the             AOD of theses particles increases by about 300 % for nitrate
different aerosols.                                                      aerosols and about 230 % for ammonium aerosols. Figure 5
                                                                         also shows some smaller changes in dust and sea salt aerosols
                                                                         over the Mediterranean Sea, particularly in terms of concen-
3     Future evolution of aerosols and their radiative                   tration, between historical and future periods. Concerning the
      forcing                                                            other aerosols (organic carbon and black carbon), they do not
                                                                         show strong concentration or AOD changes between the two
3.1    Surface mass concentration and AOD evolution                      periods studied either over Europe or over the Mediterranean
                                                                         Sea.
The total AOD evolution between the past (1971–2000) and
                                                                            Finally, Fig. 4 also shows a total AOD increase over the
the future (2021–2050) periods can be seen in Fig. 4. In more
                                                                         western and eastern part of Africa according to the three sce-
detail, Fig. 5 presents the aerosol evolution between these
                                                                         narios studied. This increase is due both to a nitrate and am-
two periods in terms of surface mass concentration and AOD
                                                                         monium AOD increase but also to an increase in dust AOD
for each aerosol type over both Europe (a) and the Mediter-
                                                                         during the summer and in particular during the months of
ranean Sea (b). First of all, Fig. 5 indicates that the total
                                                                         July and August over this region. This result is illustrated
aerosol surface mass concentration over the Mediterranean
                                                                         in Fig. 6, which shows the different aerosol evolution be-
Sea is significantly higher than over Europe, in particular

https://doi.org/10.5194/acp-21-7639-2021                                                   Atmos. Chem. Phys., 21, 7639–7669, 2021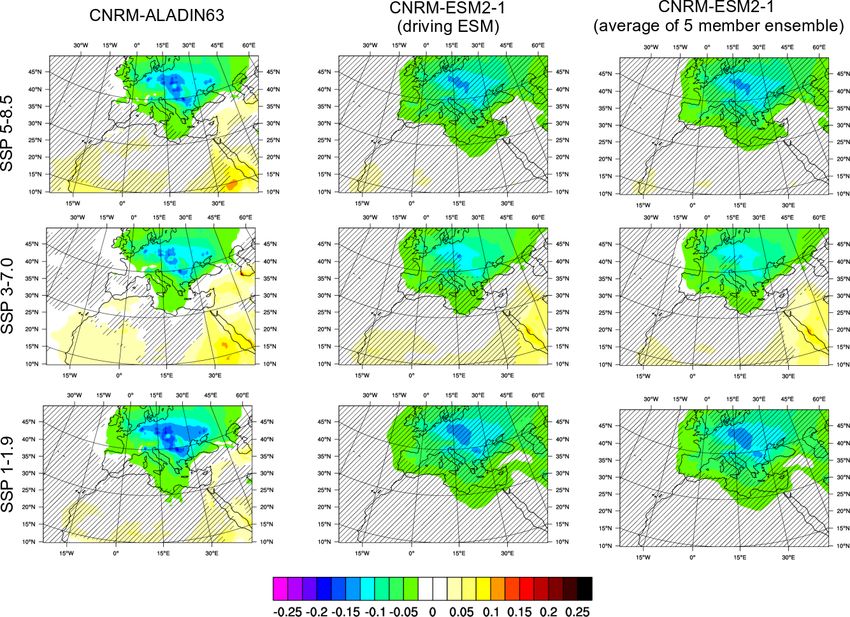
7646                                                                 T. Drugé et al.: Aerosols in regional climate projections

                                                                    Table 2. Relative contribution (%) of the different aerosols to the
                                                                    total AOD (550 nm) over the historical period (1971–2000) and the
                                                                    future period (2021–2050) according to SSPs 1-1.9, 3-7.0 and 5-8.5.

                                                                                       Historical   SSP 1-1.9   SSP 3-7.0   SSP 5-8.5
                                                                      Europe
                                                                      Sulfate                 60            7          13          10
                                                                      Nitrate                 15         47.5        43.5         46
                                                                      Ammonium                 5           17        14.5        15.5
                                                                      Organic carbon           6            6           8           8
                                                                      Black carbon             2            1         1.5         1.5
                                                                      Sea salt                 7          12         10.5         11
                                                                      Dust                     5          9.5           9           9
                                                                      Mediterranean Sea
                                                                      Sulfate               38.5            7         16            9
                                                                      Nitrate                  6           23         19         21.5
                                                                      Ammonium               1.5          7.5          6            7
                                                                      Organic carbon           4          3.5          5          4.5
                                                                      Black carbon           1.5            1          2          1.5
                                                                      Sea salt              14.5          17          15         16.5
                                                                      Dust                    34           41         37           40

                                                                    that the wind increase during the summer present in the
                                                                    CNRM-ALADIN63 model is also found with its forcing
                                                                    model (CNRM-ESM2-1) as well as with the average of the
                                                                    different members carried out with this global model. The ni-
                                                                    trate and ammonium AOD increase over this region is due to
                                                                    an increase in ammonia emissions but also to an increase in
                                                                    dust emissions and therefore to more calcite available, which
                                                                    will then react with nitric acid to form nitrate and ammonium
                                                                    aerosols (Drugé et al., 2019).
                                                                       The most important concentration and AOD changes be-
                                                                    tween the past and the future period therefore occur over Eu-
                                                                    rope and are mainly due to a strong sulfate concentration and
                                                                    AOD decrease, which is partly offset by the nitrate and am-
                                                                    monium concentration and AOD increase. Figures 4 and 5
                                                                    show that these changes are robust to the three scenarios used
                                                                    in this study. Nevertheless, the SSP 3-7.0 shows the smallest
                                                                    total AOD decrease over Europe with a decline of 0.06, com-
                                                                    pared to 0.07 with the SSP 5-8.5 and 0.08 with the SSP 1-1.9.
                                                                    This is due to a more moderate sulfate AOD decrease and
                                                                    a slight nitrate AOD increase, initially due to higher sulfur
                                                                    dioxide and ammonia emissions with this scenario. Except
Figure 4. Total AOD evolution between the past period (1971–        for these few variations, all results showed a total AOD de-
2000) and the future period (2021–2050) following SSP 5-8.5 (a),    crease over Europe for the three scenarios (SSP 1-1.9, SSP
SSP 3-7.0 (b) and SSP 1-1.9 (c). The hatched areas are statically   3-7.0 and SSP 5-8.5). These results are therefore in agree-
non-significant with a threshold of 10 %.                           ment with the first studies that addressed the fine particles
                                                                    evolution, and in particular PM10 and PM2.5 , which fore-
                                                                    cast a fine particles decrease over Europe by the end of the
tween the period 1971–2000 and the period 2021–2050 for             century (Markakis et al., 2014; Lacressonnière et al., 2017;
the SSP 5-8.5 over the East African region shown in black.          Cholakian et al., 2019). These results are also consistent with
The dust AOD increase during the summer between the two             Boé et al. (2020) and Gutiérrez et al. (2020) studies that pre-
periods is due to a wind speed increase, shown in Fig. 7, and       dict a decline in total aerosol AOD by the middle of the cen-
therefore higher dust emissions. In addition, Fig. 7 shows          tury.

Atmos. Chem. Phys., 21, 7639–7669, 2021                                                https://doi.org/10.5194/acp-21-7639-2021
T. Drugé et al.: Aerosols in regional climate projections                                                                         7647

Figure 5. Surface concentration (µg m−3 ) and AOD evolution of the different aerosols between the past period (1971–2000) and the future
period (2021–2050) according to SSP 1-1.9, SSP 3-7.0 and SSP 5-8.5 over Europe (a) and the Mediterranean Sea (b).

   Following the evolution of these different aerosol types,          under the three different scenarios. This table shows that ni-
their contribution to the total AOD will therefore also change        trate particles are the highest contributor to the total AOD
between the past and the future periods. Table indicates the          over Europe for the future period, with a contribution of
relative contribution of each aerosol type to the future total        about 45 % over the period 2021–2050 according to the dif-
AOD (2021–2050) over Europe and the Mediterranean Sea                 ferent SSPs compared to only 15 % over the period 1971–

https://doi.org/10.5194/acp-21-7639-2021                                                Atmos. Chem. Phys., 21, 7639–7669, 2021

7648                                                                      T. Drugé et al.: Aerosols in regional climate projections

Figure 6. Historical total AOD and its evolution between the past period (1971–2000) and the future period (2021–2050) according to the
SSP 5-8.5 over the East African region, which is framed in black. The hatched areas are statically non-significant with a threshold of 10 %.

Figure 7. Near-surface wind speed evolution (m s−1 ) between the past period (1971–2000) and the future period (2021–2050) according to
the SSP 5-8.5 over the East African region with the CNRM-ALADIN63 model and its driving ESM.

2000. The contribution of these aerosols to the total AOD is            Aqua (2002–2012) and MODIS Terra (2000–2012) obser-
the highest (47.5 %) when using the SSP 1-1.9. These results            vations that show a dust and sea salt aerosols contribution
are consistent with the Bellouin et al. (2011) and Drugé et al.         to the total AOD (550 nm) of about 60 %. Over this region,
(2019) studies, which show that nitrate particles are or would          Table shows that nitrate aerosols become the second high-
become the dominant aerosol species over Europe. In addi-               est contributor to the total AOD, of about 20 % according
tion Drugé et al. (2019) show, over the period 1979–2016,               to the three SSPs, just behind desert dust particles, which
that the ammonium and nitrate concentrations increase over              contribute of about 40 % to the total AOD. In addition to ni-
Europe is due to the decrease in sulfate aerosol production,            trate particles, the ammonium aerosol contribution to the to-
which produces more free ammonia in the atmosphere. At                  tal AOD over Europe also shows a clear increase between the
the global scale, Papadimas et al. (2012) also showed that              two periods by a factor of 3, from 5 % to 15 %. Conversely,
nitrate particles will increase from a contribution of 23 % to          sulfate particles, which are the highest contributors (60 %)
anthropogenic AOD (year 2000) to 56 % (year 2090) for the               to the total AOD during the period 1971–2000 over Europe
RCP 4.5 scenario. Concerning the Mediterranean Sea, Ta-                 would contribute only at 10 % to the future total AOD with
ble indicates a historical natural (sea salt and dust) aerosols         the SSP 5-8.5 (7 % with the SSP 1-1.9 and 13 % with the
contribution to the total AOD of about 50 %. These results              SSP 3-7.0). Over the Mediterranean Sea, sulfate also shifts
are consistent with the study of Georgoulias et al. (2016) car-         from the highest contributor (38.5 %) to one of the least con-
ried out over the eastern Mediterranean and based on MODIS              tributing species to the total AOD except with the SSP 3-

Atmos. Chem. Phys., 21, 7639–7669, 2021                                                    https://doi.org/10.5194/acp-21-7639-2021
T. Drugé et al.: Aerosols in regional climate projections                                                                         7649

Figure 8. Mean SW DRF (W m−2 ) of all aerosols over the period 1971–2000 at the surface and at the TOA.

7.0 where sulfate particles have a contribution to the total         Table 3. Mean SW DRF (W m−2 ) of all aerosols over the period
AOD of about 16 %, comparable to that of nitrate (19 %)              1971–2000 at the surface and at the TOA over Europe, Mediter-
or primary sea salt (15 %) aerosols. Finally, natural aerosol        ranean Sea and Africa.
contribution to the total AOD increases slightly between the
two periods both over Europe and the Mediterranean Sea.                                                        Mediterranean
For information, the increase in sea salt emissions over the                                          Europe             Sea   Africa
Mediterranean Sea, particularly in spring and summer, is ex-                                 DJF       −2.1            −4.3     −7.2
plained by the increase in sea surface temperature, on which                                 MAM       −7.4           −13.1    −17.3
these aerosol emissions directly depend, and not by a change                       Surface   JJA       −9.2           −11.9    −12.1
in wind speed.                                                                               SON       −4.2            −5.5     −5.8
                                                                       Shortwave

                                                                                             Annual    −5.7            −8.7    −10.6
3.2     Evolution of aerosol direct radiative forcing                                        mean

The evolution and variability of the different aerosol species                               DJF       −1.1            −2.6       1.2
over the Euro-Mediterranean region presented above is                                        MAM       −4.0            −5.9       5.3
mainly dominated by the sulfate mass concentration decrease                        TOA       JJA       −5.3            −7.1       3.6
                                                                                             SON       −2.8            −3.6       1.3
partially compensated by the nitrate concentration increase.
This evolution would consequently impact the variability of                                  Annual    −3.3            −4.8       2.8
the shortwave (SW) direct radiative forcing (DRF) exerted by                                 mean
the anthropogenic particles. This instantaneous aerosol radia-
tive forcing, at the surface and TOA in SW and LW spectral
ranges, is diagnosed using a double call (with and without
aerosols) to the radiation scheme during the model simula-           anthropogenic aerosols, by absorbing and scattering solar
tion.                                                                radiation, cause an average estimated surface SW DRF of
                                                                     −5.7 W m−2 over Europe, −8.7 W m−2 over the Mediter-
3.2.1    Historical aerosol DRF                                      ranean Sea and −10.6 W m−2 over North Africa. In com-
                                                                     parison, some studies using multi-annual regional simula-
Before studying the change in the DRF of the different par-          tions have been carried out. For example, Nabat et al. (2015)
ticles between the historical (1971–2000) and the future pe-         showed a surface SW DRF over the period 2003–2009 on
riod (2021–2050), we first analyse the SW DRF exerted by             the order of −14.7 W m−2 over Europe, −20.9 W m−2 over
all aerosols over the historical period. The results are pre-        the Mediterranean Sea and −19.7 W m−2 over North Africa.
sented seasonally both at the surface and at the TOA in Fig. 8       Differences between this study’s results and those presented
and summarized in Table 3. Unless otherwise specified, the           here are largely explained by a different version of the atmo-
different presented direct radiative forcing values are calcu-       spheric model between the two modelling exercises, but also
lated in all-sky conditions. Figure 8 shows that natural and         by the non-inclusion of nitrate and ammonium aerosols and

https://doi.org/10.5194/acp-21-7639-2021                                                     Atmos. Chem. Phys., 21, 7639–7669, 2021
7650 T. Drugé et al.: Aerosols in regional climate projections Figure 9. Mean aerosols SW DRF evolution (W m−2 ) at the surface and at the TOA between the historical period (1971–2000) and the future period (2021–2050) according to SSPs 5-8.5 (a), 3-7.0 (b) and 1-1.9 (c). The hatched areas are statically non-significant with a threshold of 10 %. the use of an aerosols climatology in the study of Nabat et al. et al. (2012) study indicates, on the basis of MODIS satel- (2015). A study using the regional climate model RegCM, lite data, a mean DRF over the Mediterranean basin on the which includes an aerosol prognostic scheme for five species order of −16.5 W m−2 at the surface (period 2000–2007), (sulfate, organic carbon, black carbon, dust and primary sea with a maximum during spring and summer. Table 3 as well salt), showed a mean surface DRF over the period 2000–2009 as Fig. 8 also show that the highest SW DRF simulated at close to that simulated here: on the order of −13.6 W m−2 the surface occurs during spring, especially for regions with over the Mediterranean Sea and −14.9 W m−2 over North high dust emissions (−17.3 W m−2 over Africa) and over Africa (Nabat et al., 2012). Benas et al. (2013) have shown the Mediterranean Sea (−13.1 W m−2 ) near the coasts. The a mean surface aerosol DRF between −15 and −30 W m−2 results presented above are therefore fairly consistent with in Crete over the period 2000–2010. Finally, the Papadimas Atmos. Chem. Phys., 21, 7639–7669, 2021 https://doi.org/10.5194/acp-21-7639-2021
T. Drugé et al.: Aerosols in regional climate projections 7651
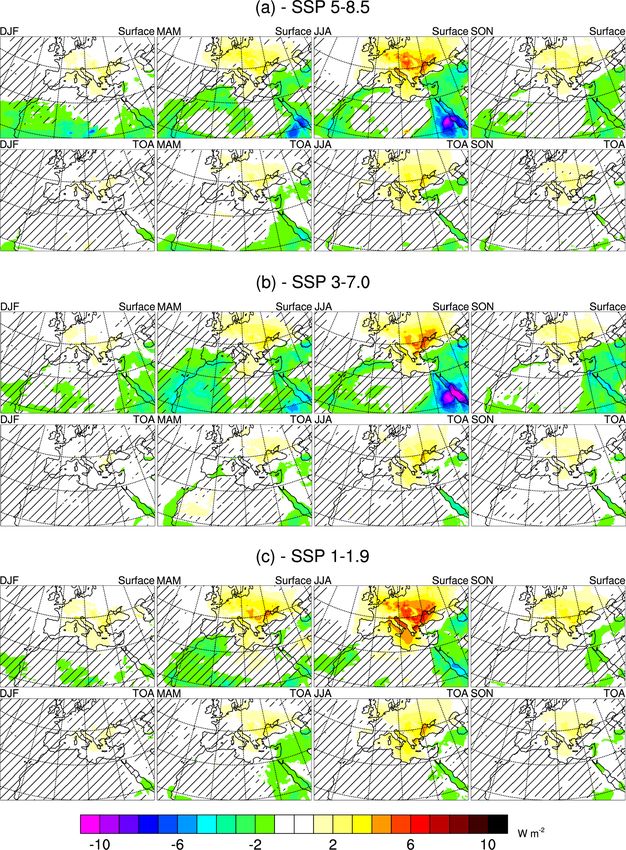
these various studies, both on the intensity and on the spatial radiative forcing (direct and indirect effects) in 2030 than in
and temporal distribution of historical surface SW DRF. 1980 over Europe with global climate models.
At the TOA, the aerosol SW DRF is also nega- The evolution between the two periods of the SW DRF ex-
tive (−3.3 W m−2 over Europe and −4.8 W m−2 over the erted at the surface by each aerosol type, which is diagnosed
Mediterranean Sea, on average) with a maximum in sum- using several calls to the radiation scheme at each time step,
mer, except over North Africa where it is slightly positive is reported in Fig. 10. The same results at the TOA are pre-
(+2.8 W m−2 ) due to a high surface albedo over this region sented in Fig. A3. Showing the same trends as the results
and the absorbing properties of mineral dust (single scatter- observed at the surface, but with lower values, only the evo-
ing albedo of dust fixed at 0.90 for the 550 nm wavelength in lution of the SW DRF exerted at the surface by each aerosol
CNRM-ALADIN63). This result is consistent with the study type will be discussed here. As showed previously, the results
of Bellouin et al. (2011), carried out with a global climate clearly indicate, in absolute terms, that the aerosol DRF de-
model, which shows a radiative forcing (direct and first in- creases over Europe between the two periods. This is largely
direct effect) on the order of −4 W m−2 at the TOA over due to sulfate and organic carbon aerosols, which represent
Europe for the year 2000. Moreover, over the period 2000– a mean DRF decrease at the surface of 2.6 W m−2 . On the
2007, Papadimas et al. (2012) estimated a DRF at the TOA other hand, nitrate and ammonium aerosols partially com-
of −2.4 W m−2 over the Mediterranean basin as well as a pensate the sulfate and organic carbon DRF decrease with a
positive DRF over desert areas of +4.1 W m−2 . contribution of 1.4 W m−2 on average for the three SSPs. The
Whether on the surface or at the TOA, the CNRM- evolution of the different aerosol DRF estimated here is con-
ALADIN63 model therefore simulates a historical aerosol sistent with results obtained at the global scale by Hauglus-
SW DRF that is consistent with previous studies. Therefore, taine et al. (2014). Our results concerning the nitrate DRF
this model seems to be valid for studying the future evolution are also consistent with other studies carried out at the global
of this aerosol DRF. scale. Indeed, the global nitrate DRF is estimated to be be-
tween −0.02 and −0.19 W m−2 (Adams et al., 2001; Jacob-
son, 2001; Liao and Seinfeld, 2005; Bauer et al., 2007; Xu
3.2.2 Future aerosol DRF
and Penner, 2012; IPCC, 2013; Myhre et al., 2013a) and is
estimated to be between −0.4 and 1.3 W m−2 by the end
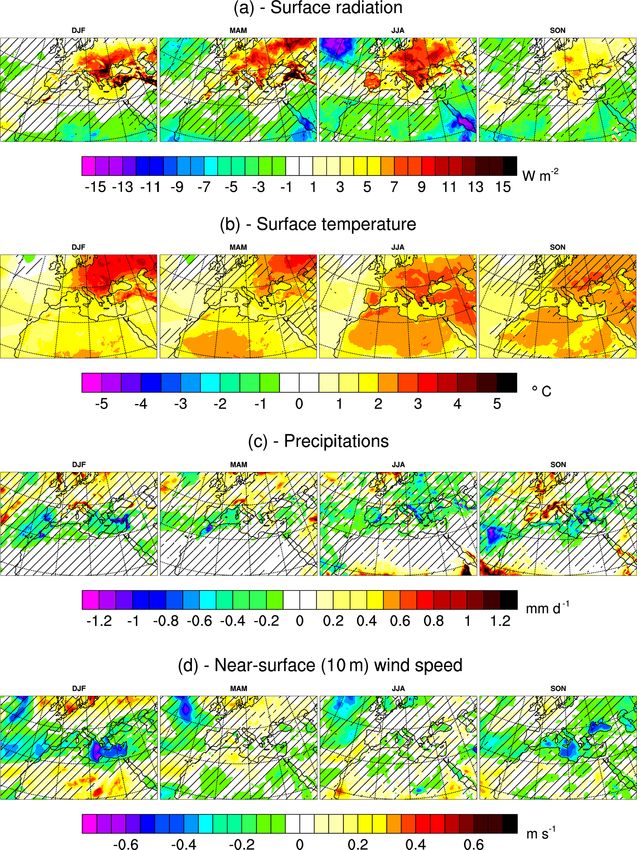
Finally, Fig. 9 presents the total SW aerosol DRF difference of the century, becoming the aerosol with the highest cool-
between the historical (1971–2000) and the future (2021– ing effect (Adams et al., 2001; Bellouin et al., 2011). Fig-
2050) periods according to the three different scenarios pre- ure 10 also shows that the natural aerosol DRF remains rel-
viously presented. This figure shows a similar DRF evolu- atively stable between the two periods. Over the Mediter-
tion using the three different scenarios with a significant de- ranean Sea, Fig. 10 shows a surface aerosol DRF evolution
crease in absolute terms at the surface and at the TOA over close to the one simulated over Europe with a sulfate and
Europe, in particular during the summer over the Po Val- organic carbon DRF decrease of about 2.6 W m−2 , which is
ley, the Benelux and Eastern Europe, of up to 6 W m−2 . Fig- associated with an nitrate and ammonium DRF increase of
ure A2 shows that this surface SW DRF decrease over Eu- about 1.7 W m−2 . Both over Europe and the Mediterranean
rope present in the CNRM-ALADIN63 model (1.6 W m−2 Sea, the largest sulfate and organic carbon DRF decrease oc-
on average for the three scenarios) is also found with its forc- curs with the SSP 1-1.9 (2.8 W m−2 on average over Europe
ing model (CNRM-ESM2-1, 2.8 W m−2 on average for the and 3.0 W m−2 over the Mediterranean Sea). As presented
three scenarios). The differences between these two models previously, this specific scenario presents the largest concen-
are mainly due to the fact that nitrate and ammonium aerosols tration decrease of these particles over these two regions.
are not taken into account in the CNRM-ESM2-1 global Concerning North Africa, Fig. 10 indicates a slight total DRF
model. Figure 9 shows that the total DRF decrease over Eu- increase, which is partly due to an increase of nitrate and am-
rope at the surface is 1.6 W m−2 on average with the SSP monium DRF (of about 0.6 W m−2 for the three scenarios)
5-8.5, 1.2 W m−2 with the SSP 3-7.0 and 2.0 W m−2 with the but also for black carbon aerosols, especially for SSPs 3-7.0
SSP 1-1.9. The SSP 1-1.9 shows the largest decrease in to- and 5-8.5 during summer and autumn (0.3–0.4 W m−2 on an-
tal DRF over Europe, which is consistent with the total AOD nual average). In addition, this total DRF increase over North
evolution analysed previously. On the other hand, over North Africa is also due to a moderate dust DRF increase, which is
Africa, Fig. 9 shows an increase in the surface DRF in ab- about 0.3–0.4 W m−2 with the three scenarios over this re-
solute terms, ranging from 0.5 W m−2 with the SSP 1-1.9 to gion. The maximum of this dust DRF increase occurs during
1.4 W m−2 with the SSP 3-7.0. At the TOA, the same trends the months of May and June for the three scenarios and can
are found but with lower values on the order of 1 W m−2 over reach 1.5 W m−2 .
Europe and 0.2 W m−2 over North Africa. These changes in
DRF are therefore consistent with the changes in total AOD
presented previously. Moreover, these results are also consis-
tent with Shindell et al. (2013), who showed a lower aerosol
https://doi.org/10.5194/acp-21-7639-2021 Atmos. Chem. Phys., 21, 7639–7669, 20217652 T. Drugé et al.: Aerosols in regional climate projections
Figure 10. Surface SW DRF evolution (W m−2 ) of sulfate and organic carbon (in red), sea salt (in blue), dust (in brown), black carbon (in
yellow) and nitrate and ammonium (in grey) between the historical period (1971–2000) and the future period (2021–2050) according to SSPs
1-1.9, 3-7.0 and 5-8.5.
4 Future Euro-Mediterranean climate sensitivity to 4.1 Future climate simulated by CNRM-ALADIN63
anthropogenic aerosols
First of all, Fig. 11 presents the changes in surface SW ra-
The evolution of the surface mass concentration, AOD and diation (panel a), surface temperature (panel b), precipita-
DRF of the different aerosols discussed previously are ex- tion (panel c) and surface wind speed (panel d) between the
pected to have some significant impacts on the future Euro- historical and future periods over the Euro-Mediterranean
Mediterranean climate. As primary natural sea spray and region for the SSP 5-8.5. Panel (a) shows a sharp surface
mineral dust aerosols are characterized by moderate changes SW radiation increase over Europe between the two peri-
between the historical and the future period, only the anthro- ods (1971–2000 and 2021–2050) that is on the order of
pogenic aerosol impact will be studied here. Furthermore, as 5 W m−2 on annual average. Figure 11a also indicates a
the differences between the scenarios are small, only the SSP strong seasonal variability with a higher surface radiation
5-8.5 will be discussed in this section for clarity reasons. increase in summer (7.5 W m−2 ). Concerning surface tem-
peratures, panel (b) indicates a significant increase over the
Euro-Mediterranean region. On annual average, the increase
Atmos. Chem. Phys., 21, 7639–7669, 2021 https://doi.org/10.5194/acp-21-7639-2021T. Drugé et al.: Aerosols in regional climate projections 7653 Figure 11. Surface radiation (W m−2 , a), surface temperature (◦ C, b), precipitation (mm d−1 , c) and surface wind speed (m s−1 , d) evolution between the periods 1971–2000 and 2021–2050 for the SSP 5-8.5. The hatched areas are statically non-significant with a threshold of 10 %. between the two periods is about 2.2 ◦ C over Europe, 1.7 ◦ C Over the Mediterranean, they have shown a smaller warm- over the Mediterranean Sea and 1.9 ◦ C over Africa. The ing between 2 and 2.5 ◦ C. Finally, Coppola et al. (2021) also strongest temperature increase over Europe is simulated dur- show a summer warming that is similar to that shown in ing the winter, with an average of 2.5 ◦ C and a maximum of Fig. 11 with a maximum signal over the Mediterranean land 4 ◦ C over Eastern Europe. Over Africa, the maximum tem- regions. Moreover, the ENSEMBLES project results show a perature increase occurs in summer with an average of 2 ◦ C. temperature increase from 3 to 4.5 ◦ C, also more pronounced These results are consistent with different studies such as that in winter, with the A1B scenario over this region between of Jacob et al. (2014), Boé et al. (2020) or Coppola et al. 1971–2000 and 2021–2050 (Hewitt, 2004; van der Linden (2021). This last study shows, for the RCP 8.5 or the SSP 5- and Mitchell, 2009). Concerning precipitation and surface 8.5, a median warming in winter of 2.5 ◦ C for the CMIP5 en- wind speed, except during winter, Fig. 11c and d shows semble and of 3.8 ◦ C for CMIP6 over Central Europe for the few areas with significant changes. These results therefore middle of the century (2041–2070) relative to 1981–2010. present a higher uncertainty than temperatures. Nevertheless, https://doi.org/10.5194/acp-21-7639-2021 Atmos. Chem. Phys., 21, 7639–7669, 2021
7654                                                                      T. Drugé et al.: Aerosols in regional climate projections

Figure 12. Anthropogenic aerosol role (difference between SSP585 and SSP585cst) in surface radiation (a), surface temperature (b), precipi-
tation (c) and surface wind speed (d) changes between the periods 1971–2000 and 2021–2050. The hatched areas are statically non-significant
with a threshold of 10 %.

Fig. 11 shows an average rainfall decrease of about 5 % (2 %            ENSEMBLES project from scenario A1B. Indeed, Coppola
for surface wind speed) over the Mediterranean Sea between              et al. (2021) have shown, for the middle of the century and
the period 1971–2000 and the period 2021–2050 with a max-               in winter, a median precipitation increase of 10 %–12 % over
imum of 10 % (5 % for surface wind speed) in winter. Over               Central Europe and a median negative change of 5 % over
Europe, and mainly in the northern part of Europe, an in-               the Mediterranean for the EURO-CORDEX, the CMIP5 and
crease in precipitation can be observed, with a maximum                 the CMIP6 ensembles. For the summer period, they showed a
of 1 mm d−1 in the Alps. The only season with a decrease                negative change of precipitation spanning the range from 4 %
in precipitation throughout Europe is the summer, with an               (EURO-CORDEX) to −10 % (CMIP6) over Central Europe
average decrease of 0.2 mm d−1 . Similar results concerning             and from −10 % to −20 % over the Mediterranean. Finally,
precipitation are observed in different studies (Jacob et al.,          compared to these different ensembles, the simulation used
2014; Boé et al., 2020; Coppola et al., 2021) as well as in the

Atmos. Chem. Phys., 21, 7639–7669, 2021                                                    https://doi.org/10.5194/acp-21-7639-2021
You can also read