The Need for Speed Institute for Governance & Sustainable Development
←
→
Page content transcription
If your browser does not render page correctly, please read the page content below
Institute for Governance & Sustainable Development

                                        The Need for Speed
               Reducing Short-Lived Climate Pollutants Has the Potential to Cut
Rate of Global Warming by Half and Arctic Warming by Two-Thirds Over the Next 30 to 40 Years

                       SLCP mitigation promotes sustainable development,
                reduces near-term impacts on health, crops, and regional climate,
      along with sea-level rise and other near-term impacts on vulnerable people and places

                                                  Summary
14 Feb 2013. Carbon dioxide (CO2) emissions are responsible for 55 to 60% of radiative forcing. See
Fig. 1. Fast and aggressive CO2 mitigation is essential to combat the resulting climate change. But
this is not enough. CO2 mitigation must be combined with fast and aggressive mitigation of the
pollutants causing the other 40 to 45% of warming. These pollutants include black carbon aerosols,
tropospheric ozone and its precursor, methane, and hydrofluorocarbons (HFCs). Because these
pollutants have atmospheric lifetimes of days to decades, they are referred to as short-lived climate
pollutants (SLCPs). Reducing SLCPs is critical for slowing the rate of climate change over the next
several decades and for protecting the people and regions most vulnerable to near-term climate
impacts.
                    Figure 1. Changes in radiative forcing from anthropogenic
                    emissions since the Industrial Revolution of 1750 (in W/m2)

         Based on IPCC, WG 1, Fig. 2.21, AR 4 (2007). (Note graph does not include all non-CO2 forcers.)
While we have known about SLCPs for more than thirty-five years, the following scientific
developments have catapulted them to the front lines of the battle against climate change.
   • First is the recognition that we have already added enough climate pollutants to warm the
     planet by 2.4°C or more during this century. Much of this warming has been offset by cooling
     aerosols, primarily sulfates, which are being reduced under current air pollution policies.
     These reductions are important to protect public health and ecosystems, but are contributing to
     near-term warming.
   • Second is the recognition that without fast-action mitigation, warming may cross the 1.5° to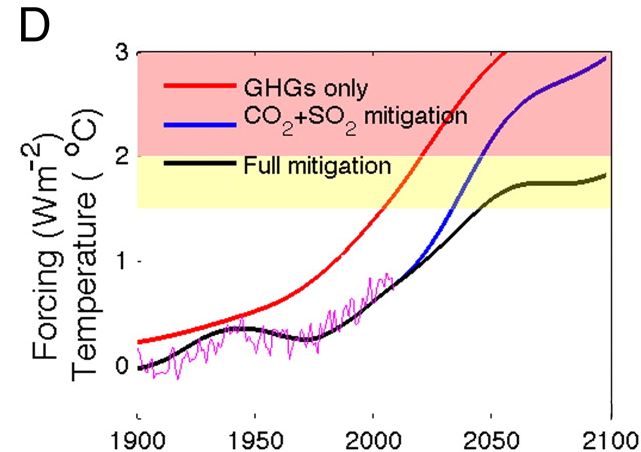
2°C threshold by the middle of this century even with strong CO2 mitigation. Reducing SLCPs
       is the most effective strategy for constraining warming in the short-term, since most of their
       warming effect disappears within weeks to a decade and a half after emissions are reduced.
   • Third is the recognition that in addition to being climate forcers, two of the three SLCPs are
     also harmful air pollutants and reducing them will prevent millions of premature deaths ever
     year and protect tens of millions of tonnes of crops, while promoting sustainable development.
   • Fourth is the recognition that the health benefits and crop improvements will accrue primarily
     in the nations that mitigate these pollutants.
   • Fifth is the recognition that there are practical and proven ways to reduce all four pollutants
     and readily available laws and institutions to support reductions in most cases.
Reducing three of the non-CO2 short-lived climate pollutants—black carbon and tropospheric ozone
and its precursor, methane—can avoid 0.5°C in warming by 2050 and 0.84°C in the Arctic by 2070.
This would cut the current rate of global warming by half, the rate of warming in the Arctic by two-
thirds, and the rate of warming over the elevated regions of the Himalayas and Tibet by at least half.
See Fig. 7 & 11. It also will produce significant collateral benefits for health, crops, and local air
quality valued at $5.9 trillion annually by 2030.
Avoiding growth in the other short-lived climate pollutant, HFCs, can increase by 20% the avoided
warming from reductions in black carbon, tropospheric ozone, and methane, bringing the total
prevented warming to 0.6°C by 2050. The combined reduction in rate of global warming from
reducing these SLCPs will slow the rate of sea level rise and reduce other impacts. Reductions can be
achieved quickly and in most cases by using existing technologies and existing laws and institutions.
The SLCP mitigation strategy may offer the best near-term protection for the countries that are most
vulnerable to climate change, including island nations, countries with low-lying coastal areas, and
agriculture-dependent countries in Asia and Africa already suffering droughts, floods, and shifting
rainfall. Reducing SLCPs will:
   • Help stabilize regional climate systems and reduce heat waves, fires, droughts, floods and
     hurricanes in mid-latitudes, and slow shifts in monsoons, expansion of desertification, and
     increases in cyclones in the tropics.
   • Slow the melting of glaciers and Arctic sea ice and the rate of sea-level rise.
   • Slow the pace of climate impacts and provide critical time to adapt to large climate changes.
The primary direct local benefits for developing countries from reducing SLCPs include:
   • Saving millions of lives a year and significantly reducing other illnesses.
   • Improving food security.
   • Expanding energy access for the billion forced to depend on solid biomass.
All SLCPs are being addressed in the Climate and Clean Air Coalition (CCAC) to Reduce Short-lived
Climate Pollutants, which was launched in early 2012 to pursue these reductions. The Coalition now
has 55 partners, including 27 States and the European Commission, the World Bank, the United
Nations Environment Programme, the United Nations Development Programme, the United Nations
Industrial Development Organization and 23 NGOs. The G8 nations announced in their Camp David
Declaration 19 May 2012 that their countries would join the Coalition; the G8 also requested the
World Bank to conduct a study of how best to integrate SLCP reductions into the World Bank’s
programs. Select CCAC press coverage is here.
In addition to being included in the CCAC, HFCs are addressed in the Rio + 20 declaration, The
Future We Want, where world leaders supported phasing down HFC production and use. Such a

                                                  2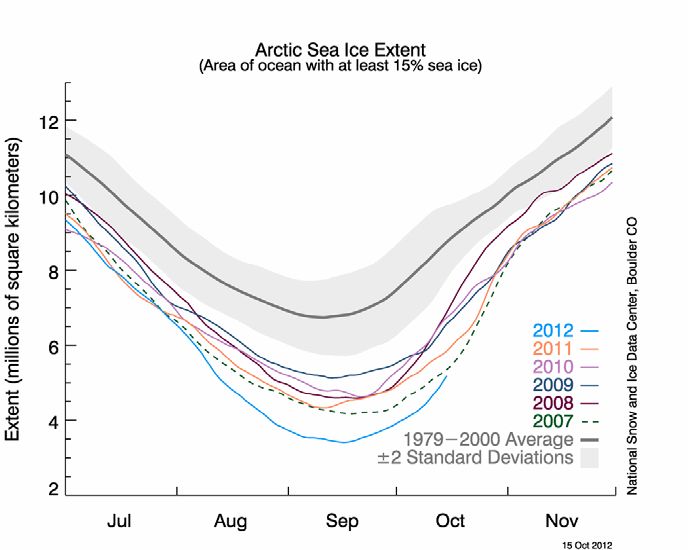
phase-down can be achieved through the Montreal Protocol, which has already phased out the
production and use of nearly 100 similar chemicals, while simultaneously improving the energy
efficiency of refrigerators, air conditioners, and other equipment and products that use HFCs, thus
reducing CO2 emissions as well. The Federated States of Micronesia has made a formal proposal to
amend the Montreal Protocol to do this, as have the North American Parties (Mexico, Canada, and
the U.S.). (Montreal Protocol 2012 & Montreal Protocol 2012). 108 Parties had expressed support to
the Bangkok Declaration on the global transition away from HCFCs and HFCs, upon its closure to
additional signatories in 2011. Through November 2012, 105 parties had provided written support to
the Bali Declaration on Transitioning to Low Global Warming Potential Alternatives to Ozone
Depleting Substances. Action at national and regional levels also can help reduce HFCs, as can
voluntary efforts.
Although reducing SLCPs is essential for reducing near-term climate impacts, it is not sufficient.
Aggressive reductions in CO2 emissions also are essential for long-term climate stability. In contrast
to the short lifetime of SLCPs, only about 25% of CO2 emissions is removed from the atmosphere in
the first fifty years, increasing to approximately 50% after one hundred years, with most of the
remaining CO2 lasting for a thousand years or more. See Fig. 2. CO2’s long lifetime combined with
the thermal inertia of the heat stored in the ocean means that even if CO2 emissions were to cease
completely, more than 80% of the expected decrease in global mean temperature would not be
realized for hundreds of years, whereas up to 90% of the decreased warming from cuts to most
SLCPs would be realized within a decade.
When combined with substantial CO2 reductions that begin immediately, these fast actions to reduce
SLCPs have a high probability of keeping the increase in global temperature to less than 1.5°C above
the pre-industrial temperature for the next 30 years and below the 2°C guardrail, the agreed goal of
the international community, for the next 60 to 90 years. See Fig. 6 & 7. It will also be necessary to
deliberately remove previously emitted CO2 from the atmosphere on a timescale of decades rather
than the millennia of the natural cycle, in order to return to a safe and stable climate by the end of the
century. This can be done using CO2 removal strategies such as bio-sequestration, biochar, and
chemical air capture and re-utilization, although many of these tools need to be further developed at
scale.
The following discussion elaborates these points, drawing on quotation from the relevant scientific
publications and the relevant policy statements. (See here for summary of policy statements
supporting SLCPs reductions from key international, regional, and bilateral policy meetings; and here
for a list of top press stories. Additional resources on SLCP science and policy are below.)

                                               Discussion
Fast reduction of CO2 is essential for a safe climate. CO2 is responsible for 55-60% of warming,
a substantial portion remains in the atmosphere for millennia, and most of the warming and
seal level rise it causes is irreversible for 1,000 years after emissions stop.

       While more than half of the CO2 emitted is currently removed from the atmosphere within a century …
       about 20% … remains … for many millennia. (IPCC, AR4 2007.)

       [W]hile approximately half of the carbon emitted is removed by the natural carbon cycle within a
       century, a substantial fraction of anthropogenic CO2 will persist in the atmosphere for several
       millennia. (Matthews & Caldeira, GRL 2008, citing Archer, JGR 2005.)

       About one-quarter of fossil fuel CO2 emissions will stay in the air “forever”, i.e. more than 500
       years…. Resulting climate changes would be … irreversible. (Hansen et al., PTRS 2007.)

                                                    3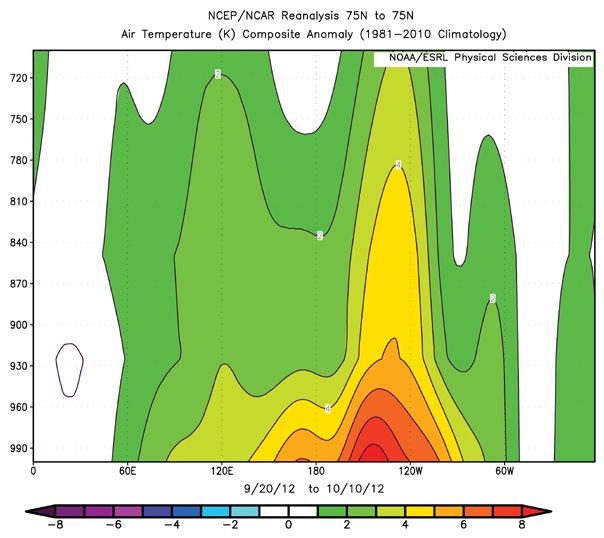
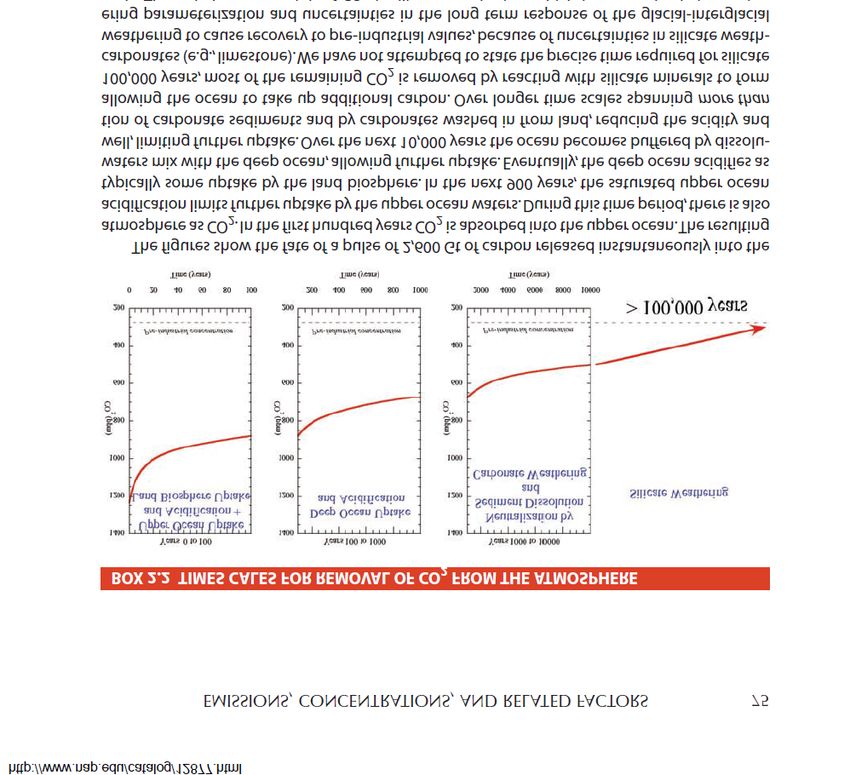
Figure 2. Time Scales for Removal of CO2 from the Atmosphere

Model simulation of atmospheric CO2 concentration for >100,000 years following a large CO2 release from
combustion of fossil fuels. Different fractions of the released gas recover on different timescales. (Solomon S. et
al., NAS 2011.)

[C]limate change that takes place due to increases in carbon dioxide concentrations is largely
irreversible for 1,000 years after emissions stop. (Solomon et al., PNAS 2009.)

Anthropogenic carbon dioxide will cause irrevocable sea level rise…. An assessed range of models
suggests that the eventual contribution to sea level rise from thermal expansion of the ocean is expected
to be 0.2–0.6 m per degree of global warming (5). Fig. [3] uses this range together with a best estimate
for climate sensitivity of 3 °C (5) to estimate lower limits to eventual sea level rise due to thermal
expansion alone. Fig. [3] shows that even with zero emissions after reaching a peak concentration,
irreversible global average sea level rise of at least 0.4–1.0 m is expected if 21st century CO2
concentrations exceed 600 ppmv and as much as 1.9 m for a peak CO2 concentration exceeding 1,000
ppmv. (Solomon S. et al., PNAS 2009)

            Figure 3: Irreversible Sea-Level Rise and Warming from CO2

The black line shows irreversible global average surface warming based upon peak atmospheric CO2
concentrations. The red band shows lower limit range of corresponding sea-level rise from thermal expansion
only, due to peak atmospheric CO2 concentrations. (Solomon S. et al., PNAS 2009)

[A] simplified way to view future warming persistence is that emissions of CO2 and a handful of other
extremely long-lived gases imply warming that is essentially irreversible on human timescales without
geoengineering or active sequestration. (Solomon et al., PNAS 2010.)

                                                    4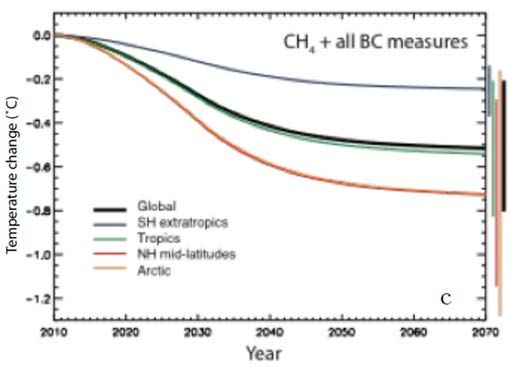
The greenhouse gases that have already been emitted into the atmosphere through 2005 have
added about 3 Wm-2 heat energy (radiative forcing) to the planet and this is sufficient to warm
the planet by about 2.4°C and to risk passing predicted tipping points (see Fig.4) (Ramanathan
& Feng, 2008).

       This article uses the greenhouse gases (GHGs) forcing of 3 (2.6 to 3.5) Wm-2 estimated by the IPCC-
       AR4 for the preindustrial to present (year 2005) period…. Using these data, this study infers that we
       have already committed the planet to a global warming of 2.4°C (1.4–4.3°C)…. (Ramanathan & Feng,
       2008)

                 Figure 4. Committed Warming as of 2005 and Predicted Tipping Points

       The total warming that is committed but yet not fully realized from historic emissions through 2005 is estimated
       to be 2.4 to 4.3°C. Up to 1.15°C of this committed warming is currently being ‘masked’ by emissions of cooling
       aerosols, primarily sulfates, from fossil fuel and biomass combustion which are now being rapidly reduced to
       protect human health and ecosystems. (Ramanathan & Feng, 2008)

While reducing CO2 is essential for limiting warming, reducing SLCPs also is essential for
limiting warming in the next few decades; together, these two strategies provide the best chance
to keep temperature below the 2°C guardrail through 2100 (Ramanathan & Xu, PNAS 2010).
Due to its long lifetime in the atmosphere and the thermal inertia of the oceans, CO2 reductions do
little to constrain warming in the critical next 30-40 years, but the mitigation benefit grows quickly
50 years after significant reductions begin. For SLCPs, however, cuts can produce rapid benefits (see
Fig. 6 & 7); up to 90% of the decrease in global mean temperatures would be realized in a few
decades.

                                                         5
Figure 5. Persistence of Warming From Greenhouse Gases

       Relative changes in radiative forcing (Upper) and warming (Lower) in the Bern 2.5CC model, for the same
       assumed profile of increasing radiative forcing over 100 y, followed by a stop of emissions as in Fig. 3, for a
       range of greenhouse gases of varying lifetimes. The gases considered are HFC-152a (1.4-y lifetime),
       methane (≈10-y lifetime), N2O (114-y lifetime), carbon dioxide (see text), and CF4 (50,000-y lifetime). All
       quantities are normalized to one when emissions stop, in order to examine relative changes. (Solomon et al.,
       PNAS 2010.)

       [M]itigation of 0.15°C due to CO2 measures takes place only around 2050 … under the CO2 measures
       scenario; 30 years after emissions begin to decline rapidly. The influence of the CO2 reductions grows
       rapidly, however, so that they mitigate roughly 0.5°C by 2070. (UNEP-WMO 2011.)

       The use of current infrastructure to build this new low-emission [energy] system [to phase out existing
       coal-fired power plants] necessitates additional emissions of greenhouse gases, and the coal-based
       infrastructure will continue to emit substantial amounts of greenhouse gases as it is phased out.
       Furthermore, ocean thermal inertia delays the climate benefits of emissions reductions.... We show
       that rapid deployment of low-emission energy systems [over the next 40 years] can do little to
       diminish the climate impacts in the first half of this century. (Myhrvold & Caldeira, ERL 2012.)

       In the case of an SLCF this means that, when its concentration and hence its radiative forcing is
       reduced by emission controls, the global mean temperature will achieve most of its decrease towards a
       new equilibrium value in few decades. About 10 per cent of the full decrease will not be realized for
       hundreds of years, since the redistribution of heat stored in the deep ocean while the SLCF was active,
       and hence its upwards transport, will continue for hundreds of years…. In the case of CO2, more than
       80 per cent of the expected decrease in global mean temperature after emission reductions will not be
       realized for hundreds of years. (UNEP-WMO 2011.)

Reducing SLCPs will have fast effects; cutting black carbon and methane can cut the rate of
Arctic warming by two-thirds and the rate of global warming by up to half or more within
decades. The UNEP-WMO (2011 & 2011 Summary for Decision Makers) assessment analyzed
1,650 possible control measures and selected 16 priority measures for black carbon, tropospheric

                                                           6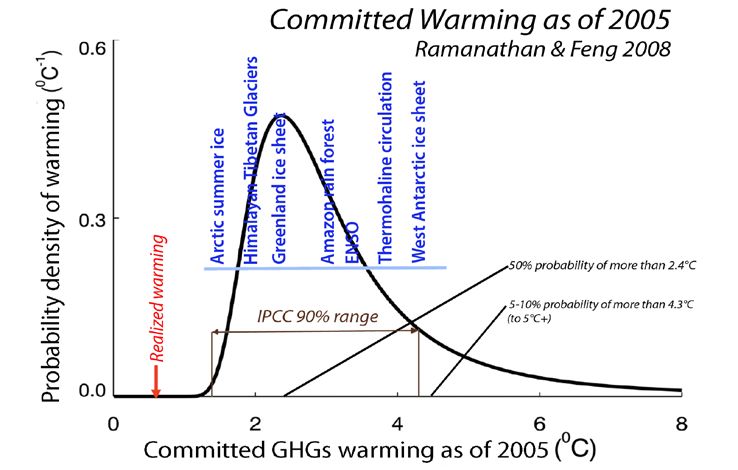
ozone and its precursor, methane 1 which maximize warming mitigation while limiting reductions of
cooling aerosols and gases; Shindell et al. (2012) consolidated these into 14 measures (see page 20
for list).

        The selection criterion was that the [control] measure had to be likely to reduce global climate change
        and also provide air quality benefits, so-called win-win measures. Those measures that provided a
        benefit for air quality but increased warming were not included in the selected measures. For example,
        measures that primarily reduce emissions of SO2 were not included…. [T]he top 16 have been
        selected that collectively achieve nearly 90 per cent of the overall mitigation potential according to
        the GWP100 metric…. When all measures are fully implemented, warming during the 2030s relative
        to the present day is only half as much as if no measures had been implemented. … This could reduce
        warming in the Arctic in the next 30 years by about two-thirds compared to the projections of the
        Assessment’s reference scenario. (UNEP-WMO 2011.)

        We identified 14 measures targeting methane and BC emissions that reduce projected global mean
        warming ~0.5°C by 2050.… BC albedo and direct forcings are large in the Himalayas, where there is
        an especially pronounced response in the Karakoram, and in the Arctic, where the measures reduce
        projected warming over the next three decades by approximately two thirds.... (Shindell et al., SCI
        2012.)

The combination of CO2 mitigation and SLCP mitigation provides the greatest chance of
keeping global temperatures below 1.5°C until 2050 and below 2°C through 2100. (Ramanathan
& Xu, PNAS 2010, Fig. 6 below).

        These actions [to reduce emissions of SLCPs including HFCs, methane, black carbon, and
        tropospheric ozone], even if we are restricted to available technologies … can reduce the probability
        of exceeding the 2˚C barrier before 2050 to less than 10% and before 2100 to less than 50% [when
        CO2 concentrations are stabilized below 441 ppm during this century]. (Ramanathan & Xu, PNAS
        2010.)

1
  Unlike other SLCPs, tropospheric ozone is not emitted directly but instead forms from interactions between sunlight and
precursor gases both human and natural. These precursor gases include oxides of nitrogen (NOx), carbon monoxide
(CO), and volatile organic compounds (which includes methane). Globally, increased methane emissions are responsible
for approximately two-thirds of the rise in tropospheric ozone, therefore controlling methane will lead to significant
reductions in tropospheric ozone and its damaging effects. Reducing other precursors can have varying effects on the
climate, for example cutting non-methane VOCs can provide some additional cooling, but reducing NOx is predicted to
produce warming due to its importance for removing methane from the atmosphere (UNEP-WMO 2011).

                                                           7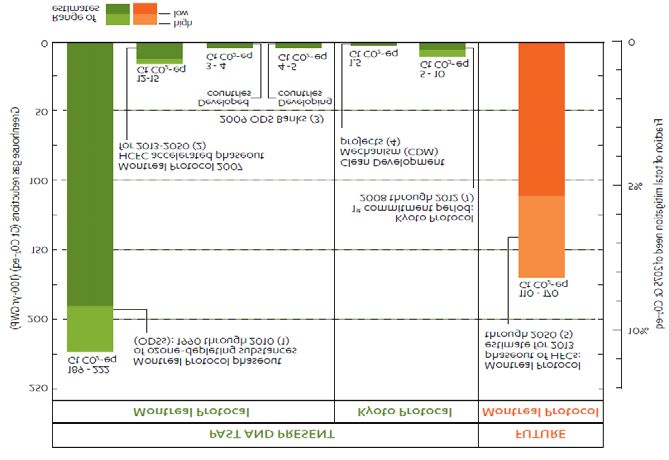
Figure 6. Warming Avoided Through Combined SLCP and CO2 Mitigation

      The red line depicts strong mitigation of CO2 (peaking in 2015 and remaining at 2015 levels until 2100,
      reaching a concentration peak of 430 ppm by 2050), but no mitigation of non-CO2 greenhouse gases, and
      does not account for forcing from aerosols or land use change; the blue line is the same as the red line except
      it includes warming and cooling aerosol forcing and the mitigation of cooling sulfate aerosols; the black line
      is the same as the blue line except it includes mitigation of all SLCPs including HFCs; the pink and yellow
      backgrounds show zones beyond 2°C and 1.5°C. (Ramanathan & Xu, Fig 1D, PNAS 2010.)

Recent analysis by Shindell et al. (SCI 2012) and UNEP-WMO (2011 & 2011) confirm how
much the rate of warming can be slowed for the next 30 to 60 years by cutting just black
carbon and methane, provided progress also is made cutting CO2. These results are show in Fig.
7 below.

      The combination of CH4 and BC measures along with substantial CO2 emissions reductions [under a
      450 parts per million (ppm) scenario] has a high probability of limiting global mean warming to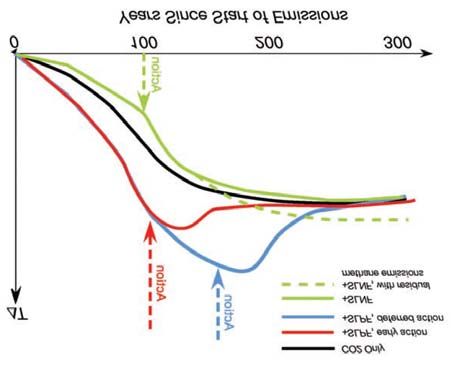
Figure 7. Temperature Rise Predictions Under Various Mitigation Scenarios

        Observed temperatures (42) through 2009 and projected temperatures thereafter under various scenarios,
        all relative to the 1890–1910 mean. Results for future scenarios are the central values from analytic
        equations estimating the response to forcings calculated from composition-climate modeling and literature
        assessments (7). The rightmost bars give 2070 ranges, including uncertainty in radiative forcing and climate
        sensitivity. A portion of the uncertainty is systematic, so that overlapping ranges do not mean there is no
        significant difference (Shindell et al., SCI 2012 and UNEP-WMO 2011, based on Ramanathan & Xu, Fig
        1D, PNAS 2010. 2 ) (Note: HFC mitigation is not included in this graph, although it is included in
        Ramanathan & Xu, Fig. 1D, reproduced as Fig. 3, above.)

Mitigation of CO2 and SLCPs is more effective if done sooner rather than later (Fig. 5 & 8).
The heat stored in the deep ocean from any climate pollutant returns to the atmosphere on a time
scale of centuries after that pollutant is removed from the atmosphere. Therefore, the best approach
for reducing the heat that will be fed from the oceans back into the atmosphere over the next several
centuries is to act quickly to prevent that heat from being absorbed by the ocean in the first place. In
the case of CO2, this is exacerbated by its millennial time scale for removal from the atmosphere, as
well as the thermal inertia of the deep oceans (see Fig. 3 & 5). Reductions in CO2 can do little to
slow warming over the next thirty years, but mitigation benefits accrue quickly in the medium- to
long-term.

        [M]itigation of 0.15°C due to CO2 measures [in the IEA 450 Scenario] takes place only around 2050
        … under the CO2 measures scenario; 30 years after emissions begin to decline rapidly. The influence
        of the CO2 reductions grows rapidly, however, so that they mitigate roughly 0.5°C by 2070 [the
        difference between the green reference line and the dark purple CO2 mitigation line in Fig. 7, above].
        (UNEP, 2011.)

2
  The science of SLCPs dates back to the 1970s (Ramanathan, 1975; Wang et al., 1976). A major WMO-UNEP-NASA-
NOAA report in 1985 concluded that non-CO2 greenhouse gases in the atmosphere are adding to the greenhouse effect by
an amount comparable to the effect of CO2. (Ramanathan et al., 1985.) This finding has been confirmed and strengthened
in the following decades by hundreds of studies culminating in IPCC reports (IPCC 1990; IPCC 1995; IPCC 2001; IPCC
2007). In January 2013, an international team of 31 scientists concluded after a four-year assessment of black carbon that
it was the second most damaging climate pollutant, after CO2 (Bond et al., 2013). The 2013 black carbon assessment
confirmed the earlier calculations of Ramanathan & Carmichael (Ramanathan & Carmichael, 2008) and Jacobson
(Jacobson, 2001). In short, researchers have had at least 25 years to carefully develop the science of SLCPs and assess
the findings.

                                                            9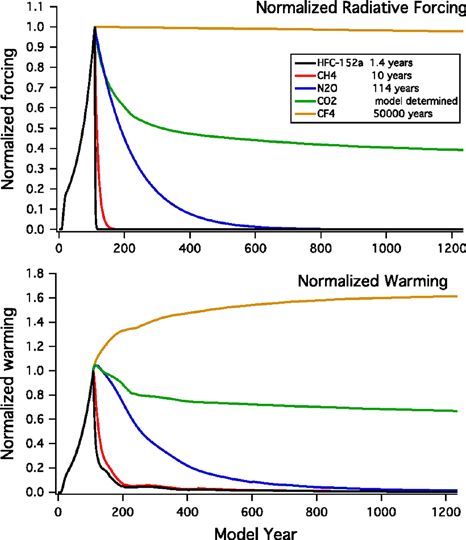
[M]ultiple centuries are required to warm or cool the deep ocean…. Maintaining a forcing for a
       longer period of time transfers more heat to the deep … ocean, with a correspondingly longer
       timescale for release of energy if emissions were to be halted…. [T]he slow timescales of the ocean
       imply that actions to mitigate the climate impacts of these warming agents [SLCPs] would be most
       effective if undertaken sooner; conversely such actions would become less effective the longer the
       radiative forcing is maintained. (Solomon et al., PNAS 2010.)

          Figure 8. Cooling from SLCP Mitigation in a Carbon Constrained Scenario

       Qualitative sketch of the time-course of future temperature under various scenarios for control of emissions
       of short-lived radiative forcing agents…. The time course of warming produced by CO2 emissions alone is
       given schematically by the black line. If one adds short-lived radiative forcing agents with an aggregate
       warming effect into the mix, the effect will be to add to the temperature increase until such time as the
       emissions are brought under control, where after the temperature will quickly drop back to the CO2-only
       curve (the blue and red solid lines on the curve, representing early or delayed mitigation of shortlived
       forcing agents). (Solomon S. et al., NAS 2011.)

In addition, some SLCPs damage ecosystems and their ability to sequester carbon, which causes
more CO2 to remain in the atmosphere increasing long-term warming.

       O3 pollution is also known to damage ecosystem health by reducing plant productivity. Gross primary
       production (GPP) is a measure of the total amount of CO2 removed from the atmosphere every year to
       fuel photosynthesis…. Of great significance is that the O3 climate impact through perturbation of the
       carbon cycle operates on longer timescales than the O3 atmospheric lifetime itself of only a few
       weeks…. 30% of the maximum global warming due to the total ozone effect is essentially irreversible.
       (Unger & Pan, AE 2012.)

Many vulnerable regions are warming faster than the global average rate of warming. Global
warming is expressed as an average increase in surface temperature but is experienced unevenly in
different regions, with some of the world’s most vulnerable regions warming much faster than the
global average.

       The increase in annual average temperature since 1980 has been twice as high over the Arctic as it
       has been over the rest of the world. (AMAP 2011.)

       The proximate cause of the changes now being felt on the [Tibetan] plateau is a rise in temperature of
       up to 0.3 °C a decade that has been going on for fifty years — approximately three times the global
       warming rate. (Qiu, NAT 2008.)

       In all four regions [of Africa] and in all seasons, the median temperature increase [between 1980 and
       2099] lies between 3°C and 4°C, roughly 1.5 times the global mean response. (IPCC 2007.)

                                                         10
Warming in the Arctic could lead to dangerous climate feedbacks that cause warming to
accelerate past tipping points. The term ‘tipping element’ on a basic level is a chain of events that
escalate to a point where it is impossible to return to former conditions. Some examples include
Arctic sea-ice melt, permafrost melt, and Himalayan glacial melt.
The word tipping element suggests the existence of a self-amplification process at the heart of the
tipping dynamics. *** A prominent example of such self-amplification is the ice-albedo feedback … in
the Arctic sea-ice region and on mountain glaciers such as the Alps and the Himalayas: An initial
warming of snow- or ice-covered area induces regional melting. This uncovers darker ground, either
brownish land or blue ocean, beneath the white snow- or ice-cover. Darker surfaces reflect less
sunlight inducing increased regional warming, the effect self-amplifies. (Levermann et al., CC 2012.)
Figure 9. Open Water Warms the Lower Atmosphere
This figure shows air temperatures as a function of height and longitude at 75 degrees north latitude. Temperatures are for
the period September 20 to October 10, 2012 compared to averages for the years 1981 to 2010. Between longitudes 120
degrees west to 150 degrees west, temperatures more than 4 degrees Celsius (7 degrees Fahrenheit) above normal are found
up to the 850 hPa level (roughly 4500 feet above the surface), with temperatures near the surface, in closer proximity to the
warming effects of the ocean, more than 6 degrees Celsius (11 degrees Fahrenheit) above normal. (NSIDC 2012.)
A variety of tipping elements could reach their critical point within this century under anthropogenic
climate change. The greatest threats are tipping the Arctic sea-ice and the Greenland ice sheet, and at
least five other elements could surprise us by exhibiting a nearby tipping point. (Lenton et al., PNAS
2008.)
Permafrost–permanently frozen ground–underlies most of the Arctic land area and extends under
parts of the Arctic Ocean. Temperatures in the permafrost have risen by up to 2˚C over the past two to
three decades.... The southern limit of the permafrost retreated northward by 30 to 80 km in Russia
between 1970 and 2005, and by 130 km during the past 50 years in Quebec. (AMAP 2011.)
The thaw and release of carbon currently frozen in permafrost will increase atmospheric CO2
concentrations and amplify surface warming to initiate a positive permafrost carbon feedback (PCF)
on climate. (Schaefer et al., TELLUS B 2011.)
Some tipping points are already approaching much faster than worst case scenarios in IPCC
AR4 in 2007. On September 16, 2012 Arctic summer sea-ice reached a new record minimum, nearly
1150% less than the 1979-2000 average (see Fig. 10). Scientists now predict that the Arctic could be
free of summer sea-ice by mid-century if not significantly sooner.
[C]ontraction of snow cover area, increases in thaw depth over most permafrost regions and decrease
in sea ice extent; in some projections using SRES scenarios, Arctic late-summer sea ice disappears
almost entirely by the latter part of the 21st century. (IPCC AR4, 2007)
Figure 10. Collapsing Arctic Summer Sea-Ice
The graph above shows Arctic sea ice extent as of October 15, 2012, along with daily ice extent data for the
previous five years. 2012 is shown in blue, 2011 in orange, 2010 in pink, 2009 in navy, 2008 in purple, and
2007 in green. The gray area around the average line shows the two standard deviation range of the data
(NSIDC 2012.)
[T]he observed downward trend in sea-ice cover suggests that summer sea ice could disappear
completely as early as 2030, something that none of the models used for the next report by the
Intergovernmental Panel on Climate Change comes close to forecasting. (Schiermeier, Nat 2012.)
Reducing black carbon, tropospheric ozone, and its precursor, methane is critical for reducing
warming and associated impacts in the Arctic and other vulnerable places in the near term.
Black carbon is estimated to be responsible for 50% of the increase in Arctic warming, or almost 1°C
of the total 1.9°C increase from 1890 to 2007. (Jacobson, JGR 2010; Shindell & Faluvegi, NG 2009.)
Roughly 50% of the warming in the elevated Himalayan region has been attributed to the direct black
carbon heating of the atmosphere and the surface. (Ramanathan et al., JGR 2007; Flanner et al.,
ACPD 2009; Xu et al., CB 2009; Menon et al., ACP 2010) Thus, reducing black carbon and other
SLCPs is critical for slowing down the warming and glacier melting in the Arctic, the Himalayan-
Tibetan region, and other vulnerable places (Menon et al., ACP 2010; Ramanathan & Xu, PNAS
2010).
BC albedo and direct forcings are large in the Himalayas, where there is an especially pronounced
response in the Karakoram, and in the Arctic, where the measures reduce projected warming over the
next three decades by approximately two thirds. (Shindell et al., SCI 2012.)
12Controlling FS [fossil-fuel soot] and BSG [solid-biofuel soot and gases] may be a faster method of
reducing Arctic ice loss and global warming than other options, including controlling CH4 or CO2,
although all controls are needed. (Jacobson, JGR 2010.)
Implementation of the [16 mitigation] measures would substantially slow, but not halt, the current
rapid pace of temperature rise and other changes already occurring at the poles and high-altitude
glacier regions. This is in part because particles co-emitted with BC, which are reflecting and
therefore cooling over other regions, are still dark and absorb heat over ice and snow, leading to
greater warming impacts…. the CH4, BC Group 1 and Group 2 measures may reduce Arctic warming
in 2070 by 0.37°C, 0.21°C and 0.14°C, respectively. The two additional Group 1 measures (pellet
stoves and coal briquettes) drive the highest ratio of Arctic/global climate benefit in 2070, reducing
Arctic warming by an additional 0.12°C [for a total of 0.84°C in avoided Arctic warming]. (UNEP-
WMO 2011.)
Figure 11. Regional Temperature Benefits From SLCP Mitigation
Global and regional temperature benefits relative to business-as-usual (BAU) warming from deployment of 16
SLCP mitigation measures. In 2070 additional temperature rise in the Arctic, compared to 2010 temperatures,
could be 0.84°C lower than BAU, 0.25°C in the Southern Hemisphere extratropics, 0.59°C in the tropics, and
0.83°C lower in the Northern Hemisphere mid-latitudes. Global average temperatures are expected to be 0.54°C
lower over the same period. (UNEP-WMO 2011.)
Reducing the current rate of warming and returning to a safer climate requires fast-action
mitigation for both CO2 and SLCPs, along with deliberate CO2 removal from the atmosphere on
a timescale of decades, starting with bio-sequestration, including biochar.
We define ‘‘fast-action’’ to include regulatory measures that can begin within 2–3 years, be
substantially implemented in 5–10 years, and produce a climate response within decades. We discuss
strategies for short-lived non-CO2 GHGs and particles, where existing agreements can be used to
accomplish mitigation objectives. Policy makers can amend the Montreal Protocol to phase down the
production and consumption of hydrofluorocarbons (HFCs) with high global warming potential.
Other fast-action strategies can reduce emissions of black carbon particles and precursor gases that
lead to ozone formation in the lower atmosphere, and increase biosequestration, including through
biochar. These and other fast-action strategies may reduce the risk of abrupt climate change in the
next few decades by complementing cuts in CO2 emissions. (Molina et al., PNAS 2009.)
Mitigation of SLCPs is not a substitute for CO2 mitigation; both are required to keep the warming below the
2°C guardrail this century:
Therefore, efforts to reduce emissions of black carbon and ozone precursors should be presented not
as substitutes for commitments to reducing carbon dioxide emissions but as wasys to quickly achieve
local environmental and economic benefits.
13At the current rate of global warming the earth’s temperature stands to careen out of control. Now is
the time to look carefully at all the possible brakes that can be applied to slow climate change, hedge
against near-term climate disasters, and buy time for technological innovations. Of the available
strategies, focusing on reducing emissions of black carbon and ozone precursors is the low-hanging
fruit: the costs are relatively low, the implementation is feasible, and the benefits would be numerous
and immediate. (Wallack & Ramanathan, FA 2009.)
One promising fast-action strategy is to strengthen climate protection under the Montreal Protocol
stratospheric ozone treaty by phasing down high GWP HFCs. The Montreal Protocol has
successfully phased out 98% of nearly 100 ozone-depleting and climate-warming chemicals. This has
provided mitigation of up to 222 billion tonnes of CO2-eq. and delayed warming by up to 12 years
worth of CO2 emissions (Velders et al., PNAS 2007.) The 197 Parties to the treaty are now phasing
out ozone-depleting and climate-damaging HCFCs, which will provide an additional 15 billion
tonnes of CO2-eq. in climate mitigation by 2040 (Velders et al., PNAS 2009.) Unfortunately, high-
GWP HFCs are growing 10 to 15% per year as they are used as substitutes for HCFCs in an
increasing number of applications. Phasing down production and use of high GWP HFCs would
substantially reduce one of the six Kyoto gases and achieve mitigation of over 100 billion tonnes of
CO2-eq. by 2050 through a treaty that has always succeeded, and at a cost that could be pennies of
public funding per tonne of CO2-eq. Historically, such transitions under the Montreal Protocol have
also significantly improved the energy efficiency of the refrigerators, air conditioners, and other
products and equipment using refrigerants, reducing CO2 emissions (TEAP 2010.) Unless high-GWP
HFCs are phased down, the rapid growth of HFCs will cancel the climate mitigation already achieved
by the Montreal Protocol (Velders et al., SCI 2012; UNEP 2011.)
Total avoided net annual ODS emissions [under the Montreal Protocol] are estimated to be equivalent
to about 10 Gt CO2/ year in 2010, which is about five times the annual reduction target of the Kyoto
Protocol for 2008–2012. This climate benefit of the Montreal Protocol may be reduced or lost
completely in the future if emissions of ODS substitutes with high GWPs, such as long- lived HFCs,
continue to increase. (Velders et al., SCI 2012.)
The atmospheric abundances of major HFCs used as ODS substitutes are increasing 10 to 15% per
year in recent years…. In an upper-range scenario, global radiative forcing from HFCs increases
from about 0.012 W/m-2 in 2010 to 0.25 to 0.40 W/m-2 in 2050. This corresponds to 14 to 27% of the
increase in CO2 forcing under the range of Intergovernmental Panel on Climate Change (IPCC)
business-as-usual scenarios from 2010 to 2050…. If the current mix of HFCs with an average lifetime
of 15 years (average GWP of 1600) were replaced by HFCs with life- times less than 1 month (GWP
less than ~20), the total HFC radiative-forcing contribution in 2050, even under the high-emission
scenario, would be less than the current forcing from HFCs (see the graph). Such choices are
currently available. (Velders et al., SCI 2012.)
14Figure 12. HFCs projected to be up to 20- 40% of RF of CO2 in 2050
Projected radiative forcing of climate by HFCs and CO2 since 2000, when the influence of HFCs was
essentially zero. The HFC climate forcing for an upper range scenario is compared with the CO2 forcing for
the range of scenarios from IPCC-SRES and the 450 ppm CO2 stabilization scenario. Clearly, the
contribution of HFCs to radiative forcing could be very significant in the future; by 2050, it could be as
much as a quarter of that due to CO2 increases since 2000, if the upper range HFC scenario is compared to
the median of the SRES scenario. Alternatively, the contribution of HFCs to radiative forcing could be one-
fifth the radiative forcing due to CO2 increases since 2000, if the upper range HFC scenario is compared to
the upper range of the SRES scenario. The contribution of HFCs to radiative forcing could also be as much
as 40% of the radiative forcing by CO2 under the 450 ppm scenario. (UNEP 2011)
Figure 13. Climate Protection of the Montreal Protocol and the Kyoto Protocol
(UNEP, 2012)
The study by Molina et al. (2009) reports that in the twenty years up to 2010, the phase-out of
production and consumption of ODSs has reduced GHG emissions by a net 135 billion tonnes of CO2
equivalent or about 11 billion tones CO2 equivalent per year. This is about five times more than the
Kyoto Protocol annual emissions reduction target for the period 2008–2012 (WMO, 2010). . . . The
value attached to the cumulative reduction in GHG emissions from the Montreal Protocol would then
be estimated at US$ 3,262 billion over a period of 20 years. This amounts to about 6 per cent of the
world’s current GDP or put another way, the average annual reduction over the period is valued at
0.3 per cent of current GDP. (UNEP, 2012)
15Substitutes for HFCs already exist for many uses and others are expected soon, according to
TEAP and other authorities. In addition, a coalition of 650 companies in the Consumer Goods
Forum has already pledged to avoid HFCs beginning in 2015.
Approaches to reduce climate forcing from future HFC use and to preserve climate benefits provided
by the Montreal Protocol include…: (i) replacing high-GWP HFCs with substances that have low
impact on climate (e.g., hydrocarbons, CO2 or certain HFCs) and alternative technologies (e.g., fiber
insulation materials) and (ii) reducing HFC emissions (e.g., by changing the design of equipment and
capturing and destroying HFCs when equipment reaches the end of its useful life)…. Low-climate-
impact substitutes are already in commercial use in several sectors. (Velders et al., SCI 2012.)
Technology is available to leapfrog high-GWP HFCs in some applications, which would avoid a
second transition out of HFCs and complications of an increasingly large inventory of HFC
equipment requiring servicing with HFCs that may be expensive or not easily available. (TEAP 2010.)
As the Board of the Consumer Goods Forum, we recognise the major and increasing contribution to
total greenhouse gas emissions of HFCs and derivative chemical refrigerants. We are therefore taking
action to mobilize resources within our respective businesses to begin phasing-out HFC refrigerants
as of 2015 and replace them with non-HFC refrigerants (natural refrigerant alternatives) where these
are legally allowed and available for new purchases of point-of-sale units and large refrigeration
installations. (TCGF 2010.)
Figure 14. Annual global production of domestic refrigerators and freezers, showing
changes in the refrigerants used from 1992 to 2008 (RTOC 2011).
About 104 million domestic refrigerators and freezers are produced annually. Each unit can contain 50 -
250 grams of HFC refrigerant, and up to 1kg of HFC blowing agent in the insulating foam. When CFCs
were being phased out in the 1990s, hydrocarbon technology was developed for domestic refrigerators to
provide a low-GWP alternative to ODSs and HFCs. The use of hydrocarbons has grown to about 36% of the
global market for new domestic refrigerators and freezers (Figure 4.1), and is expected to reach about 75%
of global production by 2020 (TEAP 2010a). Energy efficient hydrocarbon systems are now used by
refrigerator manufacturing companies in many countries, including: Argentina, China, Denmark, France,
Germany, Hungary, India, Indonesia, Italy, Japan, South Korea, Mexico, Russia, Swaziland, Turkey, Brazil
and recently in USA (Maté 2010; TEAP 2010a). (UNEP 2011.)
Vulnerable island states, led by the Federated States of Micronesia (FSM), have proposed
phasing down production and use of high-GWP HFCs under the Montreal Protocol, leaving
control of emissions of HFCs in the Kyoto Protocol. (Montreal Protocol 2012.) The US, Mexico, and
16Canada made a similar proposal (Montreal Protocol 2012). 108 Parties had expressed support to the
Bangkok Declaration on the global transition away from HCFCs and HFCs, upon its closure to
additional signatories in 2011 (Montreal Protocol 2011). By November 2012, 105 parties had
provided written support to the Bali Declaration on Transitioning to Low Global Warming Potential
Alternatives to Ozone Depleting Substances, with a few more verbal supports (Montreal Protocol
2012).
The FSM’s 2012 Proposed Amendment will strengthen climate protection under the Montreal
Protocol by phasing down the production and consumption of HFCs, a group of super-greenhouse
gases. Phasing down HFCs is essential to fulfilling obligations under the Vienna Convention to limit
the adverse environmental effects, including effects on the climate system, of actions taken to protect
the ozone layer. The resulting benefit will be up to 100 billion tonnes of CO2-eq. mitigation by 2050
under a treaty that has successfully phased out nearly 100 other chemicals. (Montreal Protocol 2012.)
Cumulative benefits of the HFC phasedown estimated by the U.S. Government amount to reductions of
2,200 million metric tons of carbon dioxide equivalent (MMT CO2eq) through 2020, and about 85,000
MMTCO2eq through 2050…. Cumulative benefits from HFC-23 byproduct emissions controls as
estimated by the U.S. Government amount to an additional 11,300 MMTCO2eq through 2050…. The
proposal leaves unchanged the provisions of the UNFCCC/Kyoto Protocol that govern HFC
emissions. Parties could follow Montreal Protocol obligations to meet certain UNFCCC obligations
(Montreal Protocol 2012.)
Figure 15. Cumulative Decrease of Direct GWP-Weighted Emissions of HFCs under the
Proposed Micronesian and North American Amendments to the Montreal Protocol
The North American proposal and the Micronesian proposal are similar; both decrease the cumulative
(2013-2050) direct GWP-weighted emissions of HFCs to 22-24 GtCO2-eq from 110-170 GtCO2-eq, for a
total of ~87 to 146 GtCO2-eq in mitigation. This is equivalent to a reduction from projected annual
emissions of 5.5 to 8.8 GtCO2-eq/yr in 2050 to less than ~0.3 GtCO2-eq/yr. Prepared Dr. Guus Velders,
based on Velders G. et al., The large contribution of projects HFC emissions to future climate forcing,
PNAS (2009).
[Bali] Declaration on the global transition away from hydrochlorofluorocarbons (HCFCs) and
chlorofluorocarbons (CFCs)…. [The 108 Party signatories] Encourage all Parties to promote policies
and measures aimed at selecting low-GWP alternatives to HCFCs and other ozone-depleting
17substances;… Declare our intent to pursue further action under the Montreal Protocol aimed at
transitioning the world to environmentally sound alternatives to HCFCs and CFCs. (Montreal
Protocol 2010 & 2011.)
The Rio+20 declaration, The Future We Want, provides universal support for phasing down
consumption and production of HFCs.
222. We recognize that the phase-out of ozone-depleting substances is resulting in a rapid increase in
the use and release of high global-warming potential hydrofluorocarbons to the environment. We
support a gradual phase-down in the consumption and production of hydrofluorocarbons. (The Future
We Want 2012)
A second fast-action strategy is to cut black carbon and tropospheric ozone and its precursor,
methane—local air pollutants that harm public health, crops, ecosystems, and carbon sinks, and
that also cause climate change. Unlike CO2, black carbon, tropospheric ozone and its precursor,
methane, disappear quickly from the atmosphere once emissions are cut. Reducing these local air
pollutants can cut the rate of global warming by up to half and the rate of Arctic warming by up to
two-thirds over the next thirty years. In addition to producing fast climate results, reducing these
local air pollutants would also deliver strong collateral benefits for public health, food security, and
ecosystems, including carbon sinks, providing independent justification for fast action. These
benefits, including much of the climate mitigation benefit, would be enjoyed largely by the regions
making the cuts. For example, eliminating emissions of black carbon from traditional solid biomass
stoves with improved cook stoves would have a major impact in reducing black carbon direct climate
effects over South Asia by about 60% (Ramanathan & Carmichael, NG 2008).
Reducing black carbon, methane and tropospheric ozone now will slow the rate of climate change
within the first half of this century…. A small number of emission reduction measures targeting black
carbon and ozone precursors could immediately begin to protect climate, public health, water and
food security, and ecosystems. (UNEP-WMO 2011.)
The selection criterion [for a mitigation measure] was that the measure had to be likely to reduce
global climate change and also provide air quality benefits, so-called win-win measures. Those
measures that provided a benefit for air quality but increased warming were not included in the
selected measures. (UNEP-WMO, 2011)
These measures can accomplish about 38 per cent reduction of global methane emissions and around
77 per cent of black carbon emissions, if implemented between now and 2030, relative to a 2030
‘reference’ emission scenario. (UNEP 2011.)
Mitigation of diesel-engine sources appears to offer the most confidence in reducing near-term
climate forcing. Mitigating emissions from residential solid fuels also may yield a reduction in net
positive forcing. The net effect of other sources, such as small industrial coal boilers and ships,
depends on the sulfur content, and net climate benefits are possible by mitigating some individual
source types. (Bond et al., 2013)
Annual average BC concentrations in California have decreased by about 50% from 0.46 μg m−3 in
1989 to 0.24 μ gm−3 in 2008 compared to the corresponding reductions in diesel BC emissions (also
about 50%) from a peak of 0.013 Tg Yr-1 in 1990 to 0.006 Tg Yr-1 by 2008. We attribute the observed
negative trends to the reduction in vehicular emissions due to stringent statewide regulations. Our
conclusion that the reduction in diesel emissions is a primary cause of the observed BC reduction is
also substantiated by a significant decrease in the ratio of BC to non-BC aerosols. (Bahadur et al.,
2011)
18This small number of mitigation measures is capable of realizing “nearly 90% of the maximum
reduction in net GWP.” (Shindell et al., SCI 2012.) They include the 14 measures listed below.
Eliminating kerosene-fueled wick lamps is an additional mitigation measure. (Lam et al., ES&T).
Methane Control Measures Black Carbon Control Measures
• Control fugitive emissions from oil and • Install particulate filters on diesel
gas production vehicles
• Control emissions from coal mining • Replace traditions cooking stoves with
• Control fugitive emissions from long clean burning biomass stoves
distance gas transmission • Modernize brick kilns
• Capture gas from municipal waste and • Modernize coke ovens
landfills • Ban open burning of biomass
• Capture gas from wastewater treatment • Eliminate high emitting on and off-road
facilities diesel vehicles
• Capture gas from livestock manure • Provide global access to modern cooking
• Intermittent aeration of constantly and heating
flooded rice paddies
(Shindell et al., SCI 2012.)
Full implementation of the [14] identified measures [by 2030] would reduce future global warming by
0.5˚C (within a range of 0.2–0.7˚C)… by 2050…. Full implementation of the identified measures… could
reduce warming in the Arctic in the next 30 years by about two-thirds compared to the projections of the
Assessment’s reference scenario, [in addition to providing substantial benefits in] the Himalayas and other
glaciated and snow-covered regions. (UNEP-WMO 2011.)
Kerosene-fueled wick lamps used in millions of developing-country households are a significant but
overlooked source of black carbon (BC) emissions…. Kerosene lamps have affordable alternatives that
pose few clear adoption barriers and would provide immediate benefit to user welfare…. No other major
BC source has such readily available alternatives, definitive climate forcing effects, and cobenefits.
Replacement of kerosene-fueled wick lamps deserves strong consideration for programs that target short-
lived climate forcers. (Lam et al., ES&T)
In addition to climate benefits, reducing SLCPs provides strong collateral benefits for public
health and food security.
We estimate that, for PM2.5 [black carbon] and ozone respectively, fully implementing these [14] measures
could reduce global population-weighted average surface concentrations by 23-34% and 7-17% and avoid
0.6-4.4 and 0.04-0.52 million annual premature deaths globally in 2030. Over 80% of the health benefits
are estimated to occur in Asia…. Based on our estimates, avoided deaths would represent 1-8% of
cardiopulmonary and lung cancer deaths among those age 30 years and older, and 1-7% of all deaths for
all ages, assuming constant baseline mortality rates. (Anenberg et al., EHP 2012.)
This strategy avoids 0.7 to 4.7 million annual premature deaths from outdoor air pollution and increases
annual crop yields by 30 to 135 million metric tons due to ozone reductions in 2030 and beyond. (Shindell
et al., SCI 2012.)
Full implementation of the identified measures could avoid … the loss of 52 million tonnes (within a range
of 30–140 million tonnes), 1–4 per cent, of the global production of maize, rice, soybean and wheat each
year. (UNEP-WMO 2011.)
Air pollution is set to become the world’s top environmental cause of premature mortality, overtaking dirty
water and lack of sanitation. Air pollution concentrations in some cities, particularly in Asia, already far
19exceed World Health Organization safe levels, and they are projected to deteriorate further to 2050…. The
number of premature deaths from exposure to particulate matter … is projected to more than double
worldwide, from just over 1 million today to nearly 3.6 million per year in 2050, with most deaths
occurring in China and India…. The absolute number of premature deaths from exposure to ground-level
ozone is to more than double worldwide (from 385 000 to nearly 800 000) between 2010 and 2050. Most of
these deaths are expected to occur in Asia, where the ground-level ozone concentrations as well as the size
of the exposed population are likely to be highest. (OECD 2012.)
The regions making reductions in black carbon and tropospheric ozone get most of the benefits.
The health benefits from implementing black carbon mitigation measures would be realized immediately
and almost entirely in the regions that reduce their emissions. Regions taking action on black carbon
would also benefit significantly from reduced regional warming, reduced disruption of regional weather
patterns, as well as a substantial reduction in crop-yield losses.... Nearly all of the health benefit, 87-99
per cent, would be realized within the same regions that implement the measures, which is worth
considering when deciding on national actions to reduce SLCFs. (UNEP 2011.)
Most of the control measures for reducing black carbon and tropospheric ozone and its
precursor, methane, can be implemented immediately with existing technologies and often with
existing laws and institutions.
BC can be reduced by approximately 50% with full application of existing technologies by 2030….
Strategies to reduce BC could borrow existing management and institutions at the international and
regional levels, including existing treaty systems regulating shipping and regional air quality. (Molina et
al., PNAS 2009.)
National efforts to reduce SLCFs can build upon existing institutions, policy and regulatory frameworks
related to air quality management, and, where applicable, climate change. *** Regional air pollution
agreements, organizations and initiatives may be effective mechanisms to build awareness, promote the
implementation of SLCF mitigation measures, share good practices and enhance capacity. *** Global
actions can help enable and encourage national and regional initiatives and support the widespread
implementation of SLCF measures. A coordinated approach to combating SLCFs can build on existing
institutional arrangements, ensure adequate financial support, enhance capacity and provide technical
assistance at the national level. (UNEP 2011.)
Many other policy alternatives exist to implement the CH4 [methane] and BC measures, including
enhancement of current air quality regulations. (Shindell et al., SCI 2012.)
Regulatory policies and forums exist to reduce non-CO2 warming agents. The Montreal Protocol with
modifications for HFC regulations can be an effective tool for reducing watts attributable to HFCs.
National policies exist to limit CO and other ozone-producing gases. (Ramanathan & Xu, PNAS 2010.)
These measurements … provide a direct link between regulatory control policies and the long-term impact
of anthropogenic emissions. Our model calculation indicates that the decrease in BC in California has lead
to a cooling of 1.4Wm-2 (±60%). The regulation of diesel fuel emissions in California therefore has proven
to be a viable control strategy for climate change in addition to mitigating adverse human health effects.
(Bahadur et al., AE 2011.)
Half of the identified measures can be implemented with a net cost savings for those making the
investment, and all are ultimately cost-effective when the $5.9 trillion annual benefits that start in
2030 are taken into account.
About 50 per cent of both methane and black carbon emission reductions can be achieved through
measures that result in net cost savings (as a global average) over their technical lifetime. The savings
20occur when initial investments are offset by subsequent cost savings from, for example, reduced fuel use or
utilization of recovered methane. A further third of the total methane emission reduction could be
addressed at relatively moderate costs. (UNEP 2011.)
Benefits of methane emissions reductions are valued at $700 to $5000 per metric ton, which is well above
typical marginal abatement costs (less than $250). *** … [T]he bulk of the BC measures could probably
be implemented with costs substantially less than the benefits given the large valuation of the health
impacts. (Shindell et al., SCI 2012.)
While many measures can provide a net cost savings, new policies and financing measures will
likely be required to overcome implementation barriers.
[A]bout half of the temperature reduction would emerge from Group 1 measures [low cost methane and
black carbon measures], which result in net cost savings to society over their full technical lifetime.
However, the required up-front investments over an assumed 20 years implementation period do constitute a
considerable barrier to implementation. Prevailing short-term profit expectations of private investors make
these measures less attractive to the market…. For all Group 1 measures, targeted interventions or
appropriate financing mechanisms could help to overcome implementation barriers. In comparison,
measures of Group 2, which could potentially be competitive on a carbon market, require much lower up-
front investments, especially for methane recovery in coal mines. Some of the more costly measures for
controlling SLCFs are often/usually implemented for other development related objectives. (UNEP 2011.)
The Climate & Clean Air Coalition is pursing mitigation strategies for black carbon, tropospheric
ozone, and methane, as well as HFCs. (CCAC 2012.) The World Bank, a member of the Coalition,
wants to increase its initial portfolio of SLCP-relevant mitigation from its current 12 percent to 15 percent
by 2015 and 20 percent by 2020. The Bank estimates that its current investment in mitigation of black
carbon and methane is $12 billion.
At the Bank, we want to expand the SLCP-relevant part of our IDA/IBRD portfolio from 12 percent in 2012
to 15 percent by 2015 and 20 percent by 2020, and will work on payment for results for methane reduction.
We also plan to increase impact on SLCPs through our GEF, Carbon Finance, Global Gas Flaring, and
Montreal Protocol portfolios. (Kyte, 12 Dec 2012.)
The World Bank Group has numerous projects that we implement that help reduce SLCPs. For example, a
back of the envelope analysis for methane and black carbon showed about $12 billion of investments, or
140 projects, approved between 2006-11 support SLCP reductions. These include investment in everything
from cleaner fuels, better urban landfill management and cleaner cookstoves. We also support important
partnerships to reduce SLCPs, such as the Global Gas Flaring Reduction Partnership (GGFR) which
works with governments and companies in reducing the flaring and venting of associated gas. The
Montreal Protocol, for which the World Bank serves as an implementing agency, is now actively promoting
alternatives to HFCs where available. HFCs are human-created gases used to replace ozone depleting
substances but which are strong, short-lived global warmers by themselves. (Barton-Dock, 9 July 2012.)
A final fast-action strategy is to deliberately remove excess CO2 from the atmosphere on a timescale of
decades rather than the natural timescale of millennia in order to return to a safe and stable climate as
soon as possible. Reducing CO2 concentrations to a level consistent with a safe and stable climate
requires that carbon sinks ultimately exceed emissions sources. Strategies for enhancing sinks include
protecting and expanding forests, wetlands, grasslands, and other sources of biomass that are removing
CO2 from the atmosphere, as well as pyrolysis of waste biomass (cooking it with limited oxygen) to
produce a permanent form of carbon called biochar that can safely return carbon to permanent storage for
hundreds to thousands of years. Bio-sequestration of CO2, including biochar, can match and ultimately
21You can also read